

#jctsignal
jctsignal
279 views
4 Discussing
Hot
Latest

Article
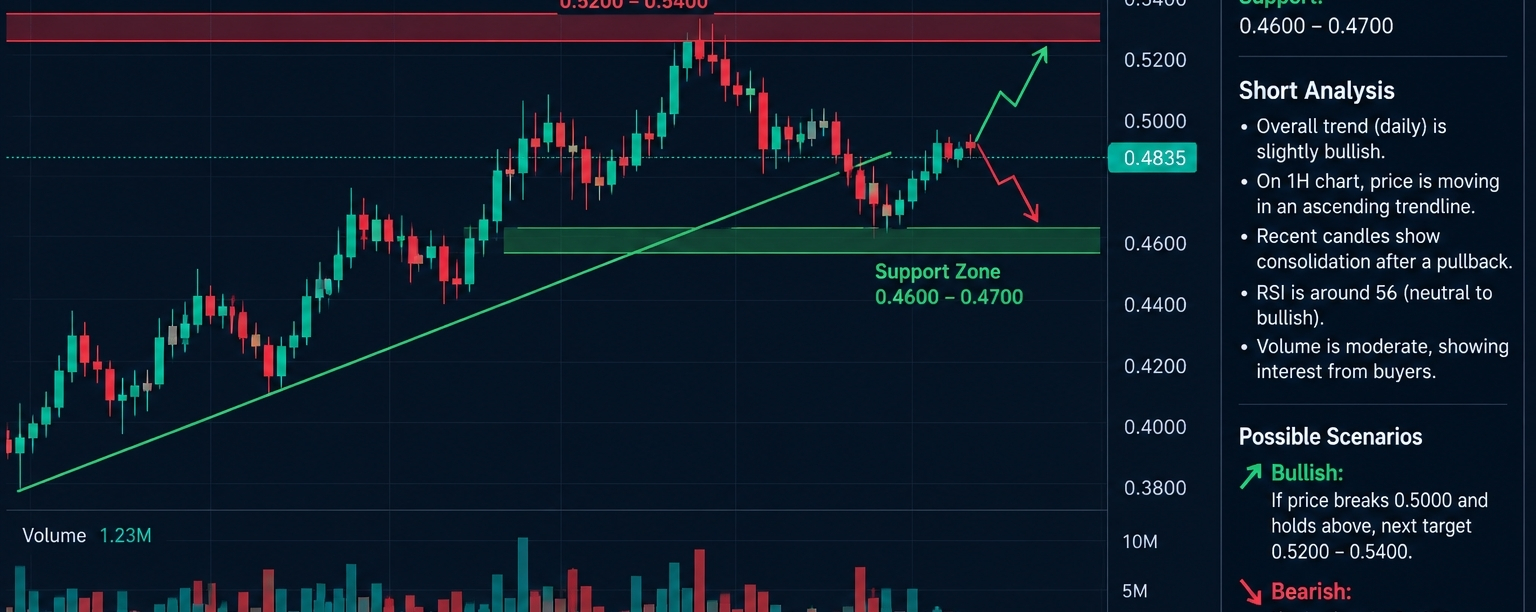
JCT/USDTJCT/USDT — Short Candle Analysis
To understand the trend on the candlestick chart, look at the 15-minute and 1-hour timeframes:
Green candles: may indicate buying pressure.
Red candles: may indicate selling pressure.
Resistance: a level where it may be difficult for the price to rise.
Support: a level that may help prevent the price from falling further.
Volume: helps you understand the strength of price movements.
Latest available trend: JCT has shown bullish momentum on the daily timeframe, but the 15-minute chart showed short-term selling pressure in data from October 27, 2026.
JCT/USDT
JCT/USDT — Short Candle Analysis
To understand the trend on the candlestick chart, look at the 15-minute and 1-hour timeframes:
Green candles: may indicate buying pressure.
Red candles: may indicate selling pressure.
Resistance: a level where it may be difficult for the price to rise.
Support: a level that may help prevent the price from falling further.
Volume: helps you understand the strength of price movements.
Latest available trend: JCT has shown bullish momentum on the daily timeframe, but the 15-minute chart showed short-term selling pressure in data from October 27, 2026.
23

·
--
Bearish
$JCT
{future}(JCTUSDT)
🚀 JCTUSDT — Short Watch
• Live Price: $0.007168 •
Margin: Isolated •
Setup: Sharp Rally — Pullback Rejection •
Entry Zone: $0.00730 – $0.00750 • Invalidation: $0.00770 •
Targets: $0.00705 / $0.00680 / $0.00650
#JCTRocket #JCTShort #JCTsignal #JCTSetup #JCTTokens
$JCT
🚀 JCTUSDT — Short Watch
• Live Price: $0.007168 •
Margin: Isolated •
Setup: Sharp Rally — Pullback Rejection •
Entry Zone: $0.00730 – $0.00750 • Invalidation: $0.00770 •
Targets: $0.00705 / $0.00680 / $0.00650
#JCTRocket #JCTShort #JCTsignal #JCTSetup #JCTTokens
🚀 JCTUSDT — Short Watch
• Live Price: $0.007168 •
Margin: Isolated •
Setup: Sharp Rally — Pullback Rejection •
Entry Zone: $0.00730 – $0.00750 • Invalidation: $0.00770 •
Targets: $0.00705 / $0.00680 / $0.00650
#JCTRocket #JCTShort #JCTsignal #JCTSetup #JCTTokens
225

Log in to explore more content
Join global crypto users on Binance Square
⚡️ Get latest and useful information about crypto.
💬 Trusted by the world’s largest crypto exchange.
👍 Discover real insights from verified creators.
Email / Phone number
Trending Topics
1
#CanMicrosoftDeliverOnAI
226,396 views
1,887 Discussing
2
#CanGoogleDefindItsCore
128,901 views
1,385 Discussing
3
#EarningsSeason
5.8M views
27,867 Discussing
4
#BitcoinSurpasses$81K
433 views
25 Discussing
5
#KOSPISurges6.63%BackAbove6000
254 views
31 Discussing
6
#DatavaultAICantWithdrawBitcoinFromBiconomy
1,161 views
50 Discussing
7
#FOMCWatch
9.2M views
29,089 Discussing
8
#HKPlacesTokenizedFundSecondaryTradingUnderETFLikeFramework
545 views
28 Discussing
9
#USGovSellsFTXLinkedAnthropicSharesFor$627M
852 views
29 Discussing
10
#MoodysAssignsRLUSDA2LongTermDepositRating
6,474 views
210 Discussing