

#haztradingaqui
haztradingaqui
22,185 views
75 Discussing
Hot
Latest

·
--
DON’T GET LEFT BEHIND!!
Aren’t you going to take advantage while it’s going down? Don’t wait until it’s on the rise to join in.
The crypto market never stops, and leading coins are still on the move. Take advantage of market corrections to plan your strategy.#HazTradingAqui
$BNB $768.14 USD
$BTC $82,842.02 USD
$SOL $114.5 USD
They’ve all experienced a correction, but these coins are going to EXPLODE, so take advantage of these prices.
These coins have their targets well planned out:
BTC to 90,000 this week, but over the next few months it wants to return to its all-time high of 126,000.
BNB to 800 before the end of the year.
SOL to 150 before the end of the year
They could take off 🚀🙌
#cryptouniverseofficial
Do you believe in the proposed targets?
Which one will reach its target first?
DON’T GET LEFT BEHIND!!
Aren’t you going to take advantage while it’s going down? Don’t wait until it’s on the rise to join in.
The crypto market never stops, and leading coins are still on the move. Take advantage of market corrections to plan your strategy.#HazTradingAqui
$BNB $768.14 USD
$BTC $82,842.02 USD
$SOL $114.5 USD
They’ve all experienced a correction, but these coins are going to EXPLODE, so take advantage of these prices.
These coins have their targets well planned out:
BTC to 90,000 this week, but over the next few months it wants to return to its all-time high of 126,000.
BNB to 800 before the end of the year.
SOL to 150 before the end of the year
They could take off 🚀🙌
#cryptouniverseofficial
Do you believe in the proposed targets?
Which one will reach its target first?
Aren’t you going to take advantage while it’s going down? Don’t wait until it’s on the rise to join in.
The crypto market never stops, and leading coins are still on the move. Take advantage of market corrections to plan your strategy.#HazTradingAqui
$BNB $768.14 USD
$BTC $82,842.02 USD
$SOL $114.5 USD
They’ve all experienced a correction, but these coins are going to EXPLODE, so take advantage of these prices.
These coins have their targets well planned out:
BTC to 90,000 this week, but over the next few months it wants to return to its all-time high of 126,000.
BNB to 800 before the end of the year.
SOL to 150 before the end of the year
They could take off 🚀🙌
#cryptouniverseofficial
Do you believe in the proposed targets?
Which one will reach its target first?
BTC a 90.000
55%
BNB a 800
20%
SOL a 150
25%
49 votes • Voting closed
1
1.9k

·
--
Bearish
$TRX Currently, its price is at $0.3290.
It has fallen by 0.40% in the last 24 hours.
In the long term, the movement points upward; the truth is that the price has declined. However, the $0.3290 area is an important zone; in other words, staying above this level is key to looking for a rebound.
In the short term, the movement has lost momentum, so at first glance it would be good to reclaim the $0.3324 area; this way, buyers can win the battle and regain control.
Key levels:
• Support line: Between $0.3290 and $0.3275. The key is to stay above this range.
• Resistance line: At the $0.3444 area. Breaking this level will open up room to move higher.
#HazTradingAqui 👇🏼
{future}(TRXUSDT)
$TRX Currently, its price is at $0.3290.
It has fallen by 0.40% in the last 24 hours.
In the long term, the movement points upward; the truth is that the price has declined. However, the $0.3290 area is an important zone; in other words, staying above this level is key to looking for a rebound.
In the short term, the movement has lost momentum, so at first glance it would be good to reclaim the $0.3324 area; this way, buyers can win the battle and regain control.
Key levels:
• Support line: Between $0.3290 and $0.3275. The key is to stay above this range.
• Resistance line: At the $0.3444 area. Breaking this level will open up room to move higher.
#HazTradingAqui 👇🏼
It has fallen by 0.40% in the last 24 hours.
In the long term, the movement points upward; the truth is that the price has declined. However, the $0.3290 area is an important zone; in other words, staying above this level is key to looking for a rebound.
In the short term, the movement has lost momentum, so at first glance it would be good to reclaim the $0.3324 area; this way, buyers can win the battle and regain control.
Key levels:
• Support line: Between $0.3290 and $0.3275. The key is to stay above this range.
• Resistance line: At the $0.3444 area. Breaking this level will open up room to move higher.
#HazTradingAqui 👇🏼
146
·
--
Bearish
$BTC Currently, its price is $79,990.00.
Over the past 24 hours, it has fallen by 0.32%.
In the long term, the bullish structure remains strong; the movement shows some weakness, but there is nothing to worry about, as it may simply need a foothold to continue its movement. Therefore, we are still looking for lower zones.
In the short term, the price decline is notable; so far, we have pulled back, but only slightly. In other words, we could test lower levels, specifically the lower end of the $78,826.70 range, and it could even extend down to the $75,156.00 level.
Key levels:
• Support line: Located around $75,156.00. A pullback to this level is possible; if that happens, it would be a good buying opportunity.
• Resistance line: Located around $81,900.00. This is a tough ceiling that the price will probably try to break once the correction is over.
#HazTradingAqui 👇🏼
{spot}(BTCUSDT)
$BTC Currently, its price is $79,990.00.
Over the past 24 hours, it has fallen by 0.32%.
In the long term, the bullish structure remains strong; the movement shows some weakness, but there is nothing to worry about, as it may simply need a foothold to continue its movement. Therefore, we are still looking for lower zones.
In the short term, the price decline is notable; so far, we have pulled back, but only slightly. In other words, we could test lower levels, specifically the lower end of the $78,826.70 range, and it could even extend down to the $75,156.00 level.
Key levels:
• Support line: Located around $75,156.00. A pullback to this level is possible; if that happens, it would be a good buying opportunity.
• Resistance line: Located around $81,900.00. This is a tough ceiling that the price will probably try to break once the correction is over.
#HazTradingAqui 👇🏼
Over the past 24 hours, it has fallen by 0.32%.
In the long term, the bullish structure remains strong; the movement shows some weakness, but there is nothing to worry about, as it may simply need a foothold to continue its movement. Therefore, we are still looking for lower zones.
In the short term, the price decline is notable; so far, we have pulled back, but only slightly. In other words, we could test lower levels, specifically the lower end of the $78,826.70 range, and it could even extend down to the $75,156.00 level.
Key levels:
• Support line: Located around $75,156.00. A pullback to this level is possible; if that happens, it would be a good buying opportunity.
• Resistance line: Located around $81,900.00. This is a tough ceiling that the price will probably try to break once the correction is over.
#HazTradingAqui 👇🏼
1
132
·
--
Bearish
$ETH Currently, its price is $2,397.40.
It is down 4.00% over the past 24 hours.
The bullish structure remains firm despite the price decline, retaining enough strength to stay above $2,118.00. The drop so far has been slight; in other words, it could extend into a larger correction, but there is nothing to worry about.
In the short term, we are still looking for lower levels, as weakness has been extremely notable so far; in other words, we have just lost $2,420.00, which showed some weakness. Therefore, reclaiming that level is the primary objective.
Key levels:
• Support line: At around $2,118.00; the key is to stay above it.
• Resistance line: At around $2,545.00. This is a key ceiling to break through to open up room to the upside. Otherwise, it will weaken.
#HazTradingAqui 👇🏼
{spot}(ETHUSDT)
$ETH Currently, its price is $2,397.40.
It is down 4.00% over the past 24 hours.
The bullish structure remains firm despite the price decline, retaining enough strength to stay above $2,118.00. The drop so far has been slight; in other words, it could extend into a larger correction, but there is nothing to worry about.
In the short term, we are still looking for lower levels, as weakness has been extremely notable so far; in other words, we have just lost $2,420.00, which showed some weakness. Therefore, reclaiming that level is the primary objective.
Key levels:
• Support line: At around $2,118.00; the key is to stay above it.
• Resistance line: At around $2,545.00. This is a key ceiling to break through to open up room to the upside. Otherwise, it will weaken.
#HazTradingAqui 👇🏼
It is down 4.00% over the past 24 hours.
The bullish structure remains firm despite the price decline, retaining enough strength to stay above $2,118.00. The drop so far has been slight; in other words, it could extend into a larger correction, but there is nothing to worry about.
In the short term, we are still looking for lower levels, as weakness has been extremely notable so far; in other words, we have just lost $2,420.00, which showed some weakness. Therefore, reclaiming that level is the primary objective.
Key levels:
• Support line: At around $2,118.00; the key is to stay above it.
• Resistance line: At around $2,545.00. This is a key ceiling to break through to open up room to the upside. Otherwise, it will weaken.
#HazTradingAqui 👇🏼
1
403
·
--
Bullish
$DASH Currently, its price is $52.40.
It has risen 1.05% in the last 24 hours.
In the long term, the structure remains bullish. As the price declines, it may need to find support in the lower zone; so far, the pullback has been slight, meaning it could extend toward $41.75.
In the short term, the upward movement has lost momentum, and weakness is extremely apparent. Therefore, the $43.95 level would be exposed as the primary target.
Key levels:
• Support line: Located around $43.95. As long as the price stays above this level, we can rule out the second support point at $41.75.
• Resistance line: Located around $68.00. Without a doubt, this level has become a tough ceiling that is difficult to break through.
#HazTradingAqui 👇🏼
{spot}(DASHUSDT)
$DASH Currently, its price is $52.40.
It has risen 1.05% in the last 24 hours.
In the long term, the structure remains bullish. As the price declines, it may need to find support in the lower zone; so far, the pullback has been slight, meaning it could extend toward $41.75.
In the short term, the upward movement has lost momentum, and weakness is extremely apparent. Therefore, the $43.95 level would be exposed as the primary target.
Key levels:
• Support line: Located around $43.95. As long as the price stays above this level, we can rule out the second support point at $41.75.
• Resistance line: Located around $68.00. Without a doubt, this level has become a tough ceiling that is difficult to break through.
#HazTradingAqui 👇🏼
It has risen 1.05% in the last 24 hours.
In the long term, the structure remains bullish. As the price declines, it may need to find support in the lower zone; so far, the pullback has been slight, meaning it could extend toward $41.75.
In the short term, the upward movement has lost momentum, and weakness is extremely apparent. Therefore, the $43.95 level would be exposed as the primary target.
Key levels:
• Support line: Located around $43.95. As long as the price stays above this level, we can rule out the second support point at $41.75.
• Resistance line: Located around $68.00. Without a doubt, this level has become a tough ceiling that is difficult to break through.
#HazTradingAqui 👇🏼
1
416
·
--
Bearish
$ETC Its price is currently at $7.70. Over the past 24 hours, it has fallen by 5.05%.
The long-term bullish outlook remains intact.
The price has declined, but there is no need to worry, as it may be looking for a support level to continue its movement; in other words, we may be seeing a brief correction.
In the short term, weakness is extremely apparent. Therefore, we continue to look for lower levels. The drop below $8.00 showed us that the short-term movement was losing momentum. So far, the decline has been mild; in other words, it could extend toward the lower end of the $6.80 range.
Key levels:
• Support line: Located around $6.80. This level could act as a potential floor.
• Resistance line: Located between $8.30 and $8.60. This zone has undoubtedly become a tough ceiling that will be difficult to break through.
#HazTradingAqui 👇🏼
{spot}(ETCUSDT)
$ETC Its price is currently at $7.70. Over the past 24 hours, it has fallen by 5.05%.
The long-term bullish outlook remains intact.
The price has declined, but there is no need to worry, as it may be looking for a support level to continue its movement; in other words, we may be seeing a brief correction.
In the short term, weakness is extremely apparent. Therefore, we continue to look for lower levels. The drop below $8.00 showed us that the short-term movement was losing momentum. So far, the decline has been mild; in other words, it could extend toward the lower end of the $6.80 range.
Key levels:
• Support line: Located around $6.80. This level could act as a potential floor.
• Resistance line: Located between $8.30 and $8.60. This zone has undoubtedly become a tough ceiling that will be difficult to break through.
#HazTradingAqui 👇🏼
The long-term bullish outlook remains intact.
The price has declined, but there is no need to worry, as it may be looking for a support level to continue its movement; in other words, we may be seeing a brief correction.
In the short term, weakness is extremely apparent. Therefore, we continue to look for lower levels. The drop below $8.00 showed us that the short-term movement was losing momentum. So far, the decline has been mild; in other words, it could extend toward the lower end of the $6.80 range.
Key levels:
• Support line: Located around $6.80. This level could act as a potential floor.
• Resistance line: Located between $8.30 and $8.60. This zone has undoubtedly become a tough ceiling that will be difficult to break through.
#HazTradingAqui 👇🏼
1
116
·
--
Bullish
$WLD Currently, its price is $0.5731.
It has risen 1.83% over the past 24 hours.
In the long term, the outlook is bullish: selling volume has declined and the price continues to rise, showing a solid structure that should keep it above $0.4160. If it loses this level, a more prolonged decline will follow.
In the short term, the price began to decline, seemingly showing weakness and indicating that it encountered strong resistance. Therefore, we could look for the $0.4160 area.
Key levels:
• Support line: Located around $0.4160. The key to targeting the higher zone is staying above this level.
• Resistance line: Located around $0.6925. This is a tough ceiling that is difficult to break.
#HazTradingAqui 👇🏼
{future}(WLDUSDT)
$WLD Currently, its price is $0.5731.
It has risen 1.83% over the past 24 hours.
In the long term, the outlook is bullish: selling volume has declined and the price continues to rise, showing a solid structure that should keep it above $0.4160. If it loses this level, a more prolonged decline will follow.
In the short term, the price began to decline, seemingly showing weakness and indicating that it encountered strong resistance. Therefore, we could look for the $0.4160 area.
Key levels:
• Support line: Located around $0.4160. The key to targeting the higher zone is staying above this level.
• Resistance line: Located around $0.6925. This is a tough ceiling that is difficult to break.
#HazTradingAqui 👇🏼
It has risen 1.83% over the past 24 hours.
In the long term, the outlook is bullish: selling volume has declined and the price continues to rise, showing a solid structure that should keep it above $0.4160. If it loses this level, a more prolonged decline will follow.
In the short term, the price began to decline, seemingly showing weakness and indicating that it encountered strong resistance. Therefore, we could look for the $0.4160 area.
Key levels:
• Support line: Located around $0.4160. The key to targeting the higher zone is staying above this level.
• Resistance line: Located around $0.6925. This is a tough ceiling that is difficult to break.
#HazTradingAqui 👇🏼
1
662
·
--
Bullish
$XRP Currently, its price is at $1.3835.
It has risen by 4.46% over the last 24 hours.
In the long term, the structure remains bullish and strong. The price has declined but is holding above $1.3166, so there is nothing to worry about.
In the short term, the price has declined, but there is no cause for concern, as it may need a foothold to continue toward the upper range at $1.5500.
Key levels:
• Support line: Around $1.3755. In the event of a correction, this would be our first point of support.
• Resistance line: Around $1.5500. Without a doubt, this level has become a tough ceiling that is difficult to break through.
#HazTradingAqui 👇🏼
{future}(XRPUSDT)
$XRP Currently, its price is at $1.3835.
It has risen by 4.46% over the last 24 hours.
In the long term, the structure remains bullish and strong. The price has declined but is holding above $1.3166, so there is nothing to worry about.
In the short term, the price has declined, but there is no cause for concern, as it may need a foothold to continue toward the upper range at $1.5500.
Key levels:
• Support line: Around $1.3755. In the event of a correction, this would be our first point of support.
• Resistance line: Around $1.5500. Without a doubt, this level has become a tough ceiling that is difficult to break through.
#HazTradingAqui 👇🏼
It has risen by 4.46% over the last 24 hours.
In the long term, the structure remains bullish and strong. The price has declined but is holding above $1.3166, so there is nothing to worry about.
In the short term, the price has declined, but there is no cause for concern, as it may need a foothold to continue toward the upper range at $1.5500.
Key levels:
• Support line: Around $1.3755. In the event of a correction, this would be our first point of support.
• Resistance line: Around $1.5500. Without a doubt, this level has become a tough ceiling that is difficult to break through.
#HazTradingAqui 👇🏼
1
311
·
--
Bullish
$XLM Currently, its price is $0.1855.
Over the past 24 hours, it has risen by 3.74%.
In the long term, the structure remains bullish. The price has declined over the past few days, but there is nothing to worry about, as it may be looking for a support level. Therefore, the $0.1590 level could be helpful.
In the short term, we are still looking at lower zones. The move is extremely exhausted, leaving lower levels exposed, such as $0.1760.
Key levels:
• Support line: Located around $0.1590. This level could act as potential support.
• Resistance line: Located around $0.2000. It has undoubtedly become a strong ceiling that is difficult to break.
#HazTradingAqui 👇🏼
{future}(XLMUSDT)
$XLM Currently, its price is $0.1855.
Over the past 24 hours, it has risen by 3.74%.
In the long term, the structure remains bullish. The price has declined over the past few days, but there is nothing to worry about, as it may be looking for a support level. Therefore, the $0.1590 level could be helpful.
In the short term, we are still looking at lower zones. The move is extremely exhausted, leaving lower levels exposed, such as $0.1760.
Key levels:
• Support line: Located around $0.1590. This level could act as potential support.
• Resistance line: Located around $0.2000. It has undoubtedly become a strong ceiling that is difficult to break.
#HazTradingAqui 👇🏼
Over the past 24 hours, it has risen by 3.74%.
In the long term, the structure remains bullish. The price has declined over the past few days, but there is nothing to worry about, as it may be looking for a support level. Therefore, the $0.1590 level could be helpful.
In the short term, we are still looking at lower zones. The move is extremely exhausted, leaving lower levels exposed, such as $0.1760.
Key levels:
• Support line: Located around $0.1590. This level could act as potential support.
• Resistance line: Located around $0.2000. It has undoubtedly become a strong ceiling that is difficult to break.
#HazTradingAqui 👇🏼
1
291
·
--
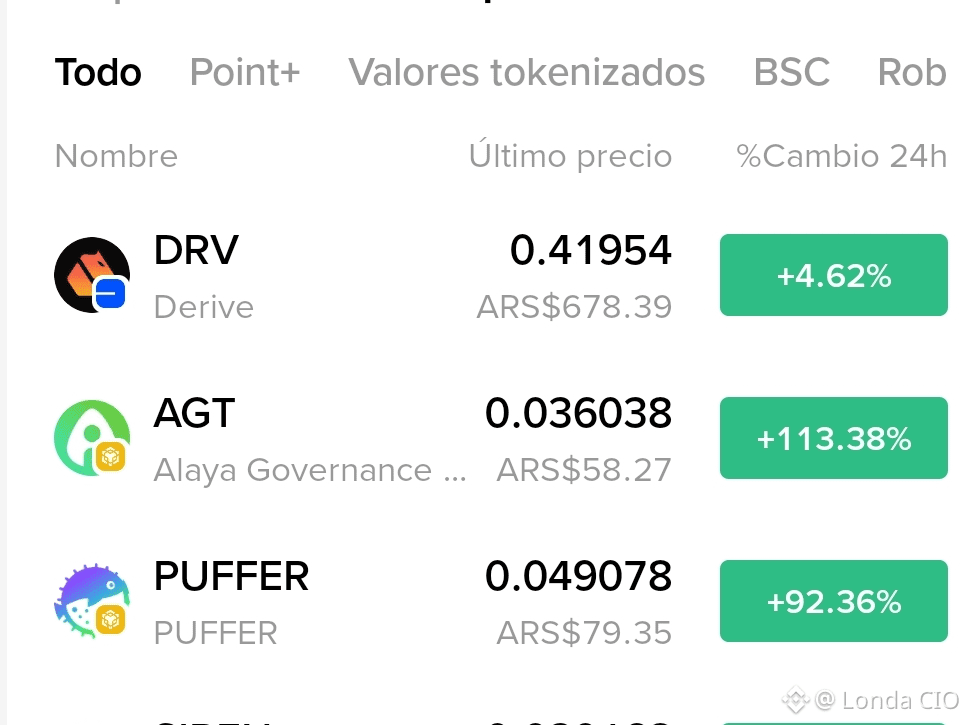
Community, they say to invest in these; I'll leave it up to you:
LET'S GO, trade these to the downside with:
$DRV
$AGT
$PUFFER
Would you go long for the short term on these, or short them since they've already gone up a lot? Trade whichever way you choose 🙌
Volatility can push these up, but it can also bring them down automatically.
Community, they say to invest in these; I'll leave it up to you:
LET'S GO, trade these to the downside with:
$DRV
$AGT
$PUFFER
Would you go long for the short term on these, or short them since they've already gone up a lot? Trade whichever way you choose 🙌
Volatility can push these up, but it can also bring them down automatically.
LET'S GO, trade these to the downside with:
$DRV
$AGT
$PUFFER
Would you go long for the short term on these, or short them since they've already gone up a lot? Trade whichever way you choose 🙌
Volatility can push these up, but it can also bring them down automatically.
4
1
597
·
--
Bullish
$BNB Currently, its price is $740.95.
It has fallen 1.30% over the past 24 hours.
In the long term, the upward movement has become somewhat vulnerable after losing the $780.00 zone. This left the structure extremely unstable. Therefore, we are looking for a correction toward lower levels, specifically the lower end of the $665.33 zone.
In the short term, buyers are not quite giving in; however, a strong ceiling seems to have formed, which halted the rise. This caused some weakness and makes it clear that bullish momentum is losing strength, leaving the $706.97 zone exposed as the first target.
Key levels:
• Support line: Located around $706.97. A break below this level would expose $665.33.
• Resistance line: Located between $760.00 and $770.00. This zone remains a tough ceiling that is difficult to break through.
#HazTradingAqui 👇🏼
{spot}(BNBUSDT)
$BNB Currently, its price is $740.95.
It has fallen 1.30% over the past 24 hours.
In the long term, the upward movement has become somewhat vulnerable after losing the $780.00 zone. This left the structure extremely unstable. Therefore, we are looking for a correction toward lower levels, specifically the lower end of the $665.33 zone.
In the short term, buyers are not quite giving in; however, a strong ceiling seems to have formed, which halted the rise. This caused some weakness and makes it clear that bullish momentum is losing strength, leaving the $706.97 zone exposed as the first target.
Key levels:
• Support line: Located around $706.97. A break below this level would expose $665.33.
• Resistance line: Located between $760.00 and $770.00. This zone remains a tough ceiling that is difficult to break through.
#HazTradingAqui 👇🏼
It has fallen 1.30% over the past 24 hours.
In the long term, the upward movement has become somewhat vulnerable after losing the $780.00 zone. This left the structure extremely unstable. Therefore, we are looking for a correction toward lower levels, specifically the lower end of the $665.33 zone.
In the short term, buyers are not quite giving in; however, a strong ceiling seems to have formed, which halted the rise. This caused some weakness and makes it clear that bullish momentum is losing strength, leaving the $706.97 zone exposed as the first target.
Key levels:
• Support line: Located around $706.97. A break below this level would expose $665.33.
• Resistance line: Located between $760.00 and $770.00. This zone remains a tough ceiling that is difficult to break through.
#HazTradingAqui 👇🏼
313
·
--
Bearish
$DOGE Currently, its price is at $0.8370
It has fallen 3.56% over the past 24 hours.
In the long term, it may be looking for a foothold in the lower zone; therefore, a move down to the $0.07890 area could be beneficial without affecting the uptrend.
In the short term, we are still looking for lower zones. Weakness is extremely noticeable so far, and that rejection at the top confirms a move toward the lower zone, specifically the $0.07890 area.
Key levels:
• Support line: Located around $0.07890. A break below this level could trigger a deeper correction and test lower levels.
• Resistance line: Located between $0.10210 and $0.10500. Without a doubt, this zone has been a tough ceiling since the price lost that level.
#HazTradingAqui 👇🏼
{spot}(DOGEUSDT)
$DOGE Currently, its price is at $0.8370
It has fallen 3.56% over the past 24 hours.
In the long term, it may be looking for a foothold in the lower zone; therefore, a move down to the $0.07890 area could be beneficial without affecting the uptrend.
In the short term, we are still looking for lower zones. Weakness is extremely noticeable so far, and that rejection at the top confirms a move toward the lower zone, specifically the $0.07890 area.
Key levels:
• Support line: Located around $0.07890. A break below this level could trigger a deeper correction and test lower levels.
• Resistance line: Located between $0.10210 and $0.10500. Without a doubt, this zone has been a tough ceiling since the price lost that level.
#HazTradingAqui 👇🏼
It has fallen 3.56% over the past 24 hours.
In the long term, it may be looking for a foothold in the lower zone; therefore, a move down to the $0.07890 area could be beneficial without affecting the uptrend.
In the short term, we are still looking for lower zones. Weakness is extremely noticeable so far, and that rejection at the top confirms a move toward the lower zone, specifically the $0.07890 area.
Key levels:
• Support line: Located around $0.07890. A break below this level could trigger a deeper correction and test lower levels.
• Resistance line: Located between $0.10210 and $0.10500. Without a doubt, this zone has been a tough ceiling since the price lost that level.
#HazTradingAqui 👇🏼
128
·
--
Bearish
$MORPHO Currently, its price is at $2,425.
Over the last 24 hours, it has fallen by 0.85%.
In the long term, the bullish structure remains strong. However, the price has been pulling back, and we have seen it weaken as the days go by; this opens the way toward $1,980 as a support level at the very bottom of the range.
In the short term, we will be looking for lower zones. It is clear that the price has declined, although only slightly so far; in other words, it could continue to fall. Therefore, we have identified $1,980 as a level to watch.
Key levels:
• Support line: Located around $1,980. This level could serve as a potential and primary support point.
• Resistance line: Located around $2,930. This level is undoubtedly a tough ceiling that will be difficult to break through.
#HazTradingAqui 👇🏼
{spot}(MORPHOUSDT)
$MORPHO Currently, its price is at $2,425.
Over the last 24 hours, it has fallen by 0.85%.
In the long term, the bullish structure remains strong. However, the price has been pulling back, and we have seen it weaken as the days go by; this opens the way toward $1,980 as a support level at the very bottom of the range.
In the short term, we will be looking for lower zones. It is clear that the price has declined, although only slightly so far; in other words, it could continue to fall. Therefore, we have identified $1,980 as a level to watch.
Key levels:
• Support line: Located around $1,980. This level could serve as a potential and primary support point.
• Resistance line: Located around $2,930. This level is undoubtedly a tough ceiling that will be difficult to break through.
#HazTradingAqui 👇🏼
Over the last 24 hours, it has fallen by 0.85%.
In the long term, the bullish structure remains strong. However, the price has been pulling back, and we have seen it weaken as the days go by; this opens the way toward $1,980 as a support level at the very bottom of the range.
In the short term, we will be looking for lower zones. It is clear that the price has declined, although only slightly so far; in other words, it could continue to fall. Therefore, we have identified $1,980 as a level to watch.
Key levels:
• Support line: Located around $1,980. This level could serve as a potential and primary support point.
• Resistance line: Located around $2,930. This level is undoubtedly a tough ceiling that will be difficult to break through.
#HazTradingAqui 👇🏼
2
293
·
--
Bullish
$ZEC Currently, its price is at $1,271.00
It has risen 3.78% in the last 24 hours.
In the long term, the bullish structure looks a little unstable; in other words, we could look for a support level to reinforce the structure. The $1,100.00 zone would be a good level.
In the short term, we are looking at lower zones. Buyers are still in control; however, signs of weakness had already been appearing. Of course, we had just lost the $1,500.00 mark, which showed weakness. Therefore, the lower $1,100.00 zone has been considered the main target.
Key zones:
• Support line: Located in the $1,100.00 zone. The key is to stay above this level; in the worst-case scenario, $886.60 would be exposed.
• Resistance line: Located in the $1,500 zone. This level is undoubtedly a strong ceiling and difficult to break through at this time.
#HazTradingAqui 👇🏼
{spot}(ZECUSDT)
$ZEC Currently, its price is at $1,271.00
It has risen 3.78% in the last 24 hours.
In the long term, the bullish structure looks a little unstable; in other words, we could look for a support level to reinforce the structure. The $1,100.00 zone would be a good level.
In the short term, we are looking at lower zones. Buyers are still in control; however, signs of weakness had already been appearing. Of course, we had just lost the $1,500.00 mark, which showed weakness. Therefore, the lower $1,100.00 zone has been considered the main target.
Key zones:
• Support line: Located in the $1,100.00 zone. The key is to stay above this level; in the worst-case scenario, $886.60 would be exposed.
• Resistance line: Located in the $1,500 zone. This level is undoubtedly a strong ceiling and difficult to break through at this time.
#HazTradingAqui 👇🏼
It has risen 3.78% in the last 24 hours.
In the long term, the bullish structure looks a little unstable; in other words, we could look for a support level to reinforce the structure. The $1,100.00 zone would be a good level.
In the short term, we are looking at lower zones. Buyers are still in control; however, signs of weakness had already been appearing. Of course, we had just lost the $1,500.00 mark, which showed weakness. Therefore, the lower $1,100.00 zone has been considered the main target.
Key zones:
• Support line: Located in the $1,100.00 zone. The key is to stay above this level; in the worst-case scenario, $886.60 would be exposed.
• Resistance line: Located in the $1,500 zone. This level is undoubtedly a strong ceiling and difficult to break through at this time.
#HazTradingAqui 👇🏼
352
·
--
Bearish
$TRX Currently, its price is $0.3305.
It has fallen by 0.15% over the last 24 hours.
In the long term, the trend points upward; the structure looks completely solid for staying above $0.3325. Therefore, we’re still looking for higher levels.
In the short term, we could look for a bounce to $0.3500, provided it respects the support zone. In other words, first reclaiming $0.3444 is key to opening up room to continue its move.
Key levels:
• Support line: It is located around $0.3295. The key is to stay above this level; otherwise, the price will weaken.
• Resistance line: It is located around $0.3444. Reaching and breaking this level is key, as it would expose the higher zone at $0.3500.
#HazTradingAqui 👇🏼
{spot}(TRXUSDT)
$TRX Currently, its price is $0.3305.
It has fallen by 0.15% over the last 24 hours.
In the long term, the trend points upward; the structure looks completely solid for staying above $0.3325. Therefore, we’re still looking for higher levels.
In the short term, we could look for a bounce to $0.3500, provided it respects the support zone. In other words, first reclaiming $0.3444 is key to opening up room to continue its move.
Key levels:
• Support line: It is located around $0.3295. The key is to stay above this level; otherwise, the price will weaken.
• Resistance line: It is located around $0.3444. Reaching and breaking this level is key, as it would expose the higher zone at $0.3500.
#HazTradingAqui 👇🏼
It has fallen by 0.15% over the last 24 hours.
In the long term, the trend points upward; the structure looks completely solid for staying above $0.3325. Therefore, we’re still looking for higher levels.
In the short term, we could look for a bounce to $0.3500, provided it respects the support zone. In other words, first reclaiming $0.3444 is key to opening up room to continue its move.
Key levels:
• Support line: It is located around $0.3295. The key is to stay above this level; otherwise, the price will weaken.
• Resistance line: It is located around $0.3444. Reaching and breaking this level is key, as it would expose the higher zone at $0.3500.
#HazTradingAqui 👇🏼
121
·
--
Bullish
$BTC Currently, its price is $83,732.00.
It has risen by 0.77% over the last 24 hours.
In the long term, the bullish structure remains firm. The movement shows some weakness, but there is nothing to worry about, as it may simply need a point of support to continue its upward movement. Therefore, we are looking for lower zones.
In the short term, the price decline is notable. So far, we have seen a pullback, but it has been very slight. In other words, we could test lower levels, specifically the lower end of the $78,826.70 zone.
Key zones:
• Support line: It is located around $77,510.00. A pullback to this level is possible; in that case, it would be a good buying opportunity.
• Resistance line: It is located around $86,000.00. This level has become a key ceiling that is difficult to break.
#HazTradingAqui 👇🏼
{spot}(BTCUSDT)
$BTC Currently, its price is $83,732.00.
It has risen by 0.77% over the last 24 hours.
In the long term, the bullish structure remains firm. The movement shows some weakness, but there is nothing to worry about, as it may simply need a point of support to continue its upward movement. Therefore, we are looking for lower zones.
In the short term, the price decline is notable. So far, we have seen a pullback, but it has been very slight. In other words, we could test lower levels, specifically the lower end of the $78,826.70 zone.
Key zones:
• Support line: It is located around $77,510.00. A pullback to this level is possible; in that case, it would be a good buying opportunity.
• Resistance line: It is located around $86,000.00. This level has become a key ceiling that is difficult to break.
#HazTradingAqui 👇🏼
It has risen by 0.77% over the last 24 hours.
In the long term, the bullish structure remains firm. The movement shows some weakness, but there is nothing to worry about, as it may simply need a point of support to continue its upward movement. Therefore, we are looking for lower zones.
In the short term, the price decline is notable. So far, we have seen a pullback, but it has been very slight. In other words, we could test lower levels, specifically the lower end of the $78,826.70 zone.
Key zones:
• Support line: It is located around $77,510.00. A pullback to this level is possible; in that case, it would be a good buying opportunity.
• Resistance line: It is located around $86,000.00. This level has become a key ceiling that is difficult to break.
#HazTradingAqui 👇🏼
110
·
--
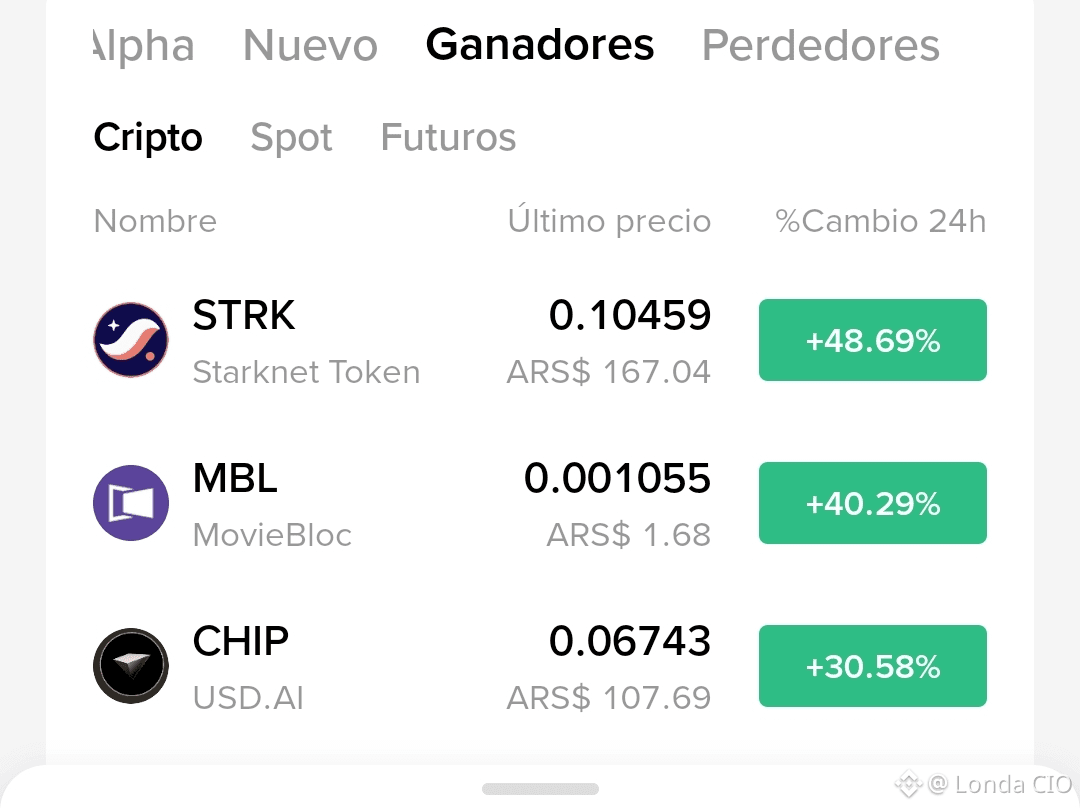
IT'S PUMPING AGAIN!!!!
You have to take advantage of the volatility of these coins, but be careful.
#HazTradingAqui
$STRK It could keep going up. But you can also make a profit on the downside if the price falls.
$MBL
But be careful—keep a close eye on them when you trade, because they can drop quickly due to volatility. These coins are mostly driven by a few people looking to make profits for their group.
IT'S PUMPING AGAIN!!!!
You have to take advantage of the volatility of these coins, but be careful.
#HazTradingAqui
$STRK It could keep going up. But you can also make a profit on the downside if the price falls.
$MBL
But be careful—keep a close eye on them when you trade, because they can drop quickly due to volatility. These coins are mostly driven by a few people looking to make profits for their group.
You have to take advantage of the volatility of these coins, but be careful.
#HazTradingAqui
$STRK It could keep going up. But you can also make a profit on the downside if the price falls.
$MBL
But be careful—keep a close eye on them when you trade, because they can drop quickly due to volatility. These coins are mostly driven by a few people looking to make profits for their group.
1
695
·
--
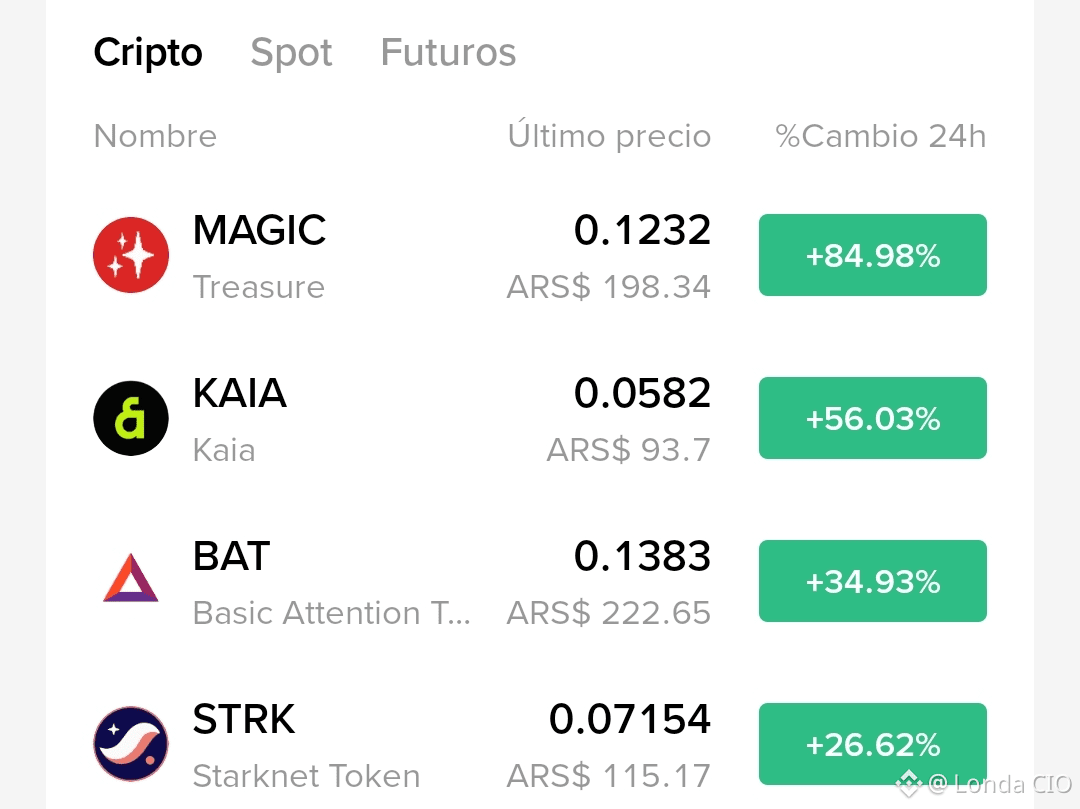
TAKE ADVANTAGE OF THE VOLATILITY OF THESE COINS!!
The power these coins have.
and the chance to make profits in the volatile market is incredible.
#HazTradingAqui with:
$MAGIC take advantage of their volatility until they start to fall.
$KAIA with care, you can take advantage of their volatility, but they can crash, so trade carefully 🙌
$BAT they can still grow more, but if their popularity drops, they’ll crash again.
{spot}(MAGICUSDT)
{spot}(KAIAUSDT)
TAKE ADVANTAGE OF THE VOLATILITY OF THESE COINS!!
The power these coins have.
and the chance to make profits in the volatile market is incredible.
#HazTradingAqui with:
$MAGIC take advantage of their volatility until they start to fall.
$KAIA with care, you can take advantage of their volatility, but they can crash, so trade carefully 🙌
$BAT they can still grow more, but if their popularity drops, they’ll crash again.
The power these coins have.
and the chance to make profits in the volatile market is incredible.
#HazTradingAqui with:
$MAGIC take advantage of their volatility until they start to fall.
$KAIA with care, you can take advantage of their volatility, but they can crash, so trade carefully 🙌
$BAT they can still grow more, but if their popularity drops, they’ll crash again.
2
3.1k
·
--
LET'S GO, LET'S GO, LET'S GO, THE LIGHT IS GREEN...
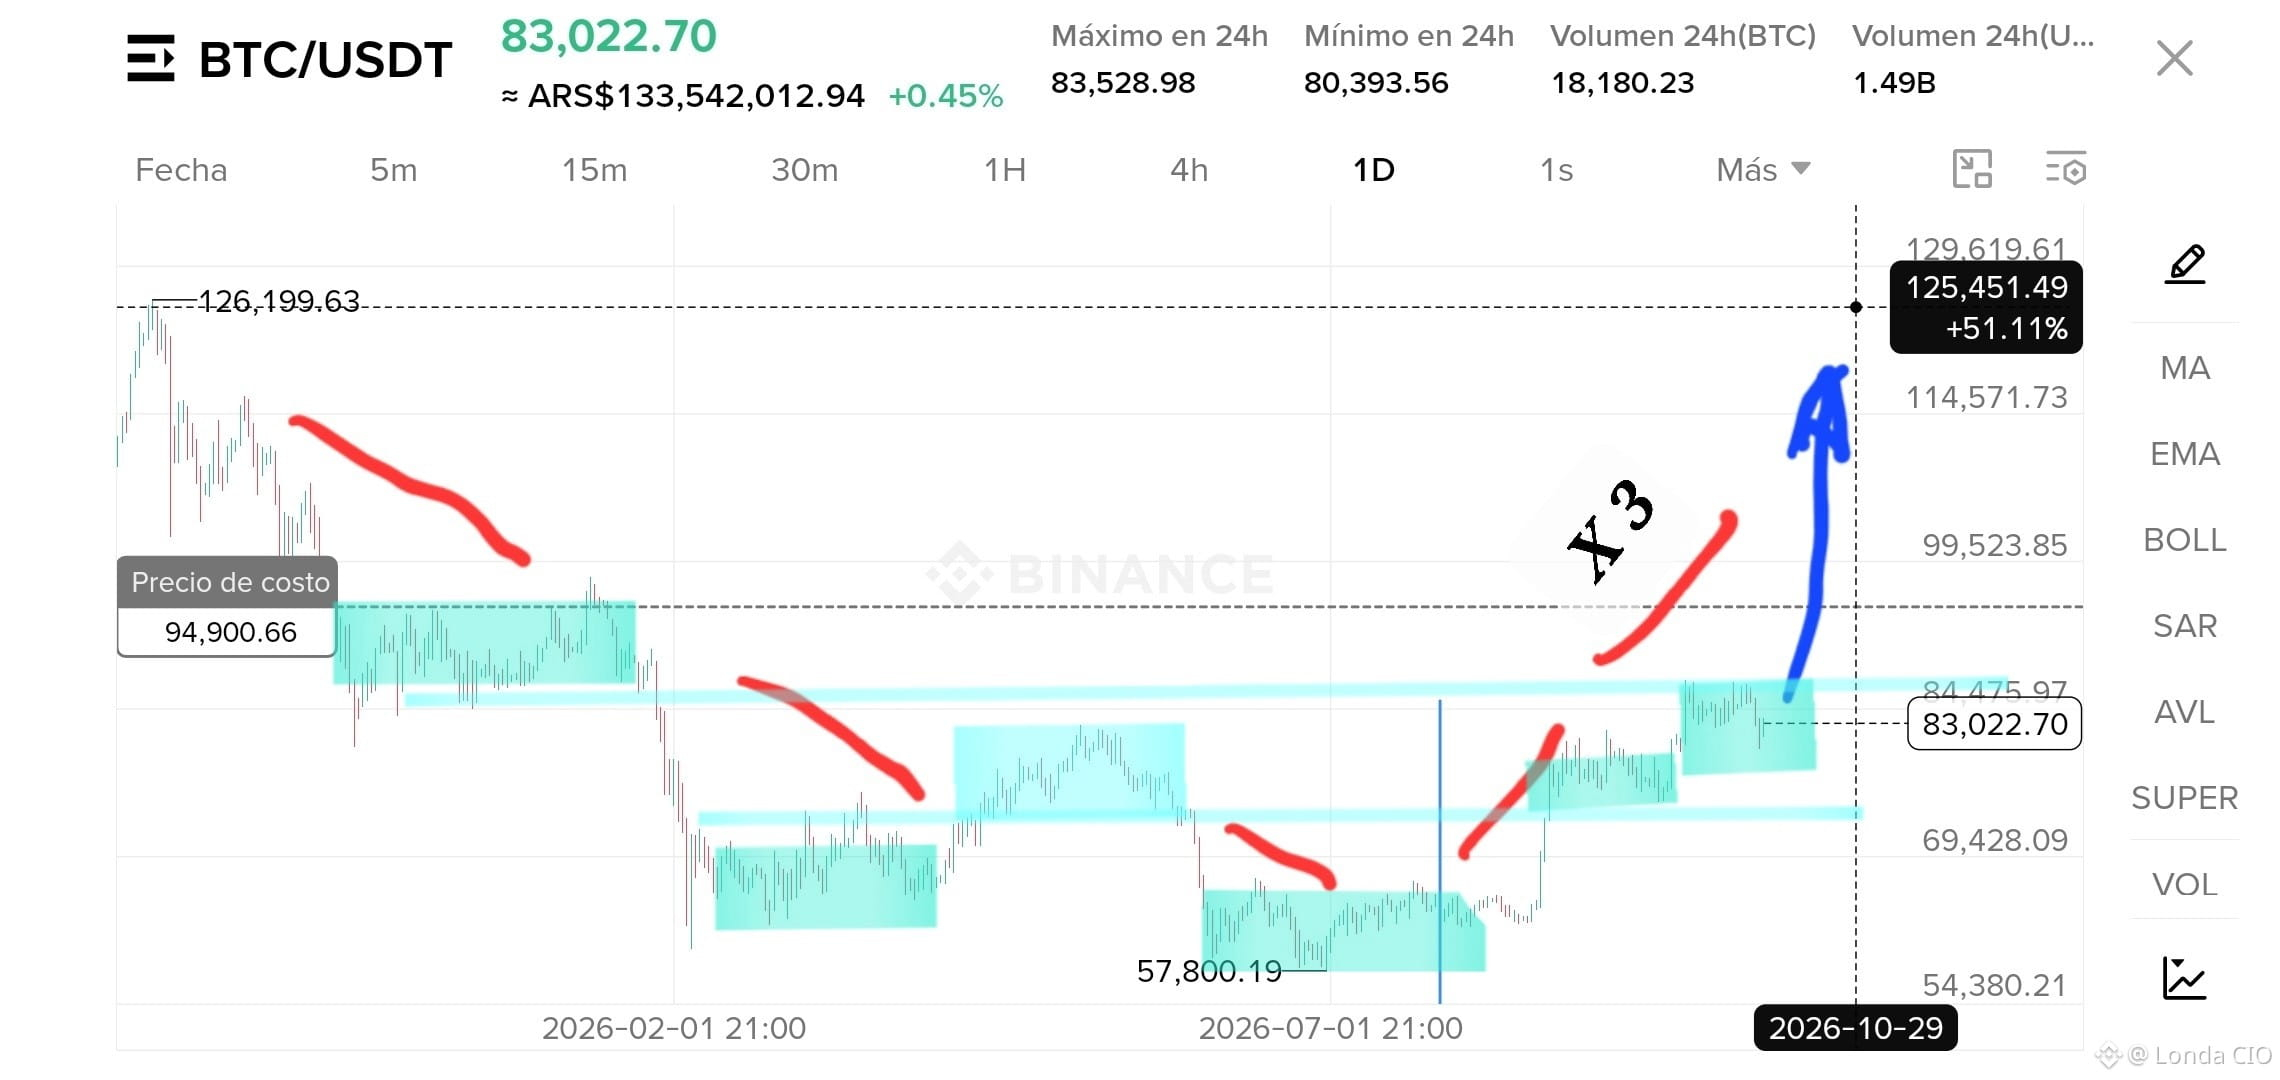
The fractal symmetry anticipating the bullish comeback of $BTC
Let's also be patient with #PEPE
$PEPE is going to explode any moment.
#HazTradingAqui
BTC heading to $126,000?
I BELIEVE IN $BTC . THE WHOLE COMMUNITY KNOWS BITCOIN IS GOING TO RISE... because it has already been consistently taking liquidity.
After completing three clear downward cycles that brought the price to test the historical accumulation zone near $57,800.
If the fractal pattern repeats in reverse, we could be at the start of consecutive bullish cycles aimed at reaching the all-time high again, around $126,000.
Confirmed bottom: The clean exit from the lower consolidation zone and the current push above $83,000 validate buyers' strength in the short term.
Key zone: The real institutional challenge lies at the $94,900 "Cost Basis." Breaking this resistance with volume will confirm the structure's second major push.
Three stages of absorption and momentum.
.🙌 #BinanceSquareTalks
LET'S GO, LET'S GO, LET'S GO, THE LIGHT IS GREEN...
The fractal symmetry anticipating the bullish comeback of $BTC
Let's also be patient with #PEPE
$PEPE is going to explode any moment.
#HazTradingAqui
BTC heading to $126,000?
I BELIEVE IN $BTC . THE WHOLE COMMUNITY KNOWS BITCOIN IS GOING TO RISE... because it has already been consistently taking liquidity.
After completing three clear downward cycles that brought the price to test the historical accumulation zone near $57,800.
If the fractal pattern repeats in reverse, we could be at the start of consecutive bullish cycles aimed at reaching the all-time high again, around $126,000.
Confirmed bottom: The clean exit from the lower consolidation zone and the current push above $83,000 validate buyers' strength in the short term.
Key zone: The real institutional challenge lies at the $94,900 "Cost Basis." Breaking this resistance with volume will confirm the structure's second major push.
Three stages of absorption and momentum.
.🙌 #BinanceSquareTalks
The fractal symmetry anticipating the bullish comeback of $BTC
Let's also be patient with #PEPE
$PEPE is going to explode any moment.
#HazTradingAqui
BTC heading to $126,000?
I BELIEVE IN $BTC . THE WHOLE COMMUNITY KNOWS BITCOIN IS GOING TO RISE... because it has already been consistently taking liquidity.
After completing three clear downward cycles that brought the price to test the historical accumulation zone near $57,800.
If the fractal pattern repeats in reverse, we could be at the start of consecutive bullish cycles aimed at reaching the all-time high again, around $126,000.
Confirmed bottom: The clean exit from the lower consolidation zone and the current push above $83,000 validate buyers' strength in the short term.
Key zone: The real institutional challenge lies at the $94,900 "Cost Basis." Breaking this resistance with volume will confirm the structure's second major push.
Three stages of absorption and momentum.
.🙌 #BinanceSquareTalks
2
656
·
--
Bearish
$ADA Currently, its price is at $0.2322.
Over the last 24 hours it has fallen by 9.72%.
In the long term, given the decline in price, the structure looks quite solid in order to stay above $0.2200.
In the short term, although the price has decreased, it is expected to find a support point and keep the structure. Therefore, we have considered the $0.2200 zone.
Key zones:
• Support line: It is located in the $0.2200 zone. Without a doubt, this level could be a good support point. Otherwise, it will weaken.
• Resistance line: It is located in the $0.2560 zone. This strong ceiling is key to breaking in order to create room.
#HazTradingAqui 👇🏼
{future}(ADAUSDT)
$ADA Currently, its price is at $0.2322.
Over the last 24 hours it has fallen by 9.72%.
In the long term, given the decline in price, the structure looks quite solid in order to stay above $0.2200.
In the short term, although the price has decreased, it is expected to find a support point and keep the structure. Therefore, we have considered the $0.2200 zone.
Key zones:
• Support line: It is located in the $0.2200 zone. Without a doubt, this level could be a good support point. Otherwise, it will weaken.
• Resistance line: It is located in the $0.2560 zone. This strong ceiling is key to breaking in order to create room.
#HazTradingAqui 👇🏼
Over the last 24 hours it has fallen by 9.72%.
In the long term, given the decline in price, the structure looks quite solid in order to stay above $0.2200.
In the short term, although the price has decreased, it is expected to find a support point and keep the structure. Therefore, we have considered the $0.2200 zone.
Key zones:
• Support line: It is located in the $0.2200 zone. Without a doubt, this level could be a good support point. Otherwise, it will weaken.
• Resistance line: It is located in the $0.2560 zone. This strong ceiling is key to breaking in order to create room.
#HazTradingAqui 👇🏼
1
862
Log in to explore more content
Join global crypto users on Binance Square
⚡️ Get latest and useful information about crypto.
💬 Trusted by the world’s largest crypto exchange.
👍 Discover real insights from verified creators.
Email / Phone number
Trending Topics
1
#CanMicrosoftDeliverOnAI
602,043 views
3,929 Discussing
2
#CanGoogleDefindItsCore
369,246 views
2,782 Discussing
3
#FedWatch
16.1M views
37,094 Discussing
4
#BitcoinCore32.1RaisesPeerConnectionLimit
123 views
22 Discussing
5
#EarningsSeason
6.1M views
30,179 Discussing
6
#BitcoinCoreIdentifiesThreeVulnerabilities
9,697 views
196 Discussing
7
#RippleExpects$900MAnnualizedProductRevenueRunRate
405 views
9 Discussing
8
#GoogleToPreviewCryptoCustodySecuritySystem
2,625 views
79 Discussing
9
#FedToBeginShrinkingRateSettingCalendarIn2027
3,833 views
52 Discussing
10
#StrategyShareholdersApproveDailyDividends
3,680 views
74 Discussing