
#fettoken
fettoken
31,725 views
20 Discussing
Hot
Latest

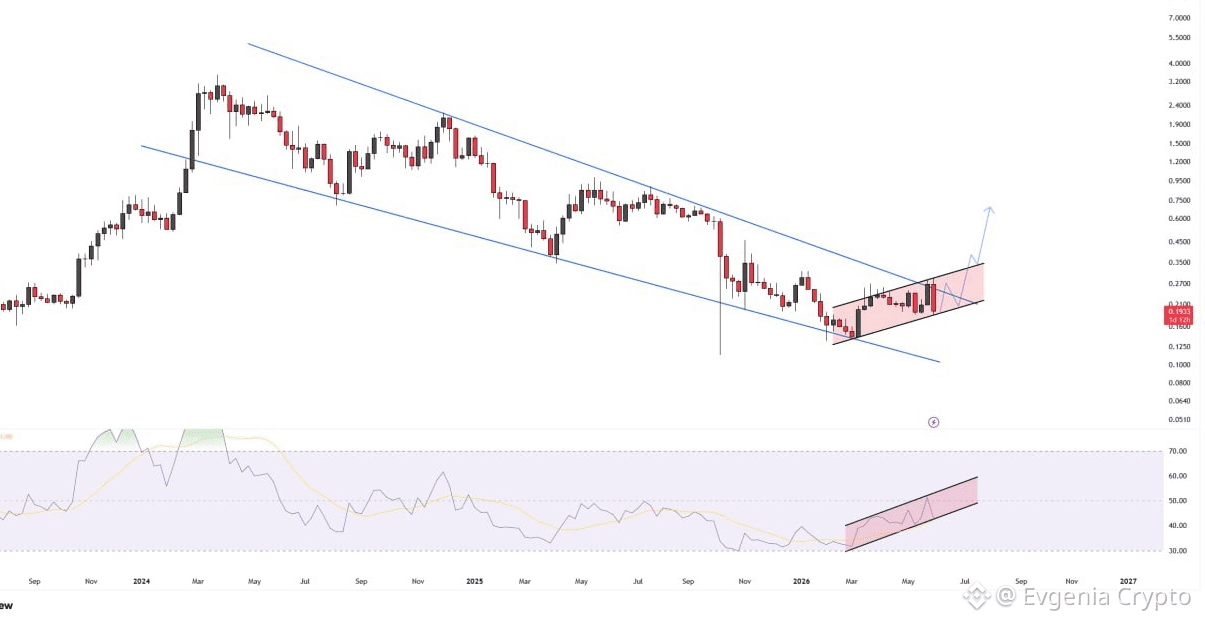
The bull show for $FET might end in a nightmare! 🔥
We're catching a bounce off the bottom of the weekly channel, but it's too early to celebrate.
The main boss ahead — the 0.25 zone.
If the buyers fizzle out on the retest, a false breakout will hit all the longs hard.
Load up those alerts, things are heating up!
#FETToken #CryptoGains #BearishTrend
We're catching a bounce off the bottom of the weekly channel, but it's too early to celebrate.
The main boss ahead — the 0.25 zone.
If the buyers fizzle out on the retest, a false breakout will hit all the longs hard.
Load up those alerts, things are heating up!
#FETToken #CryptoGains #BearishTrend

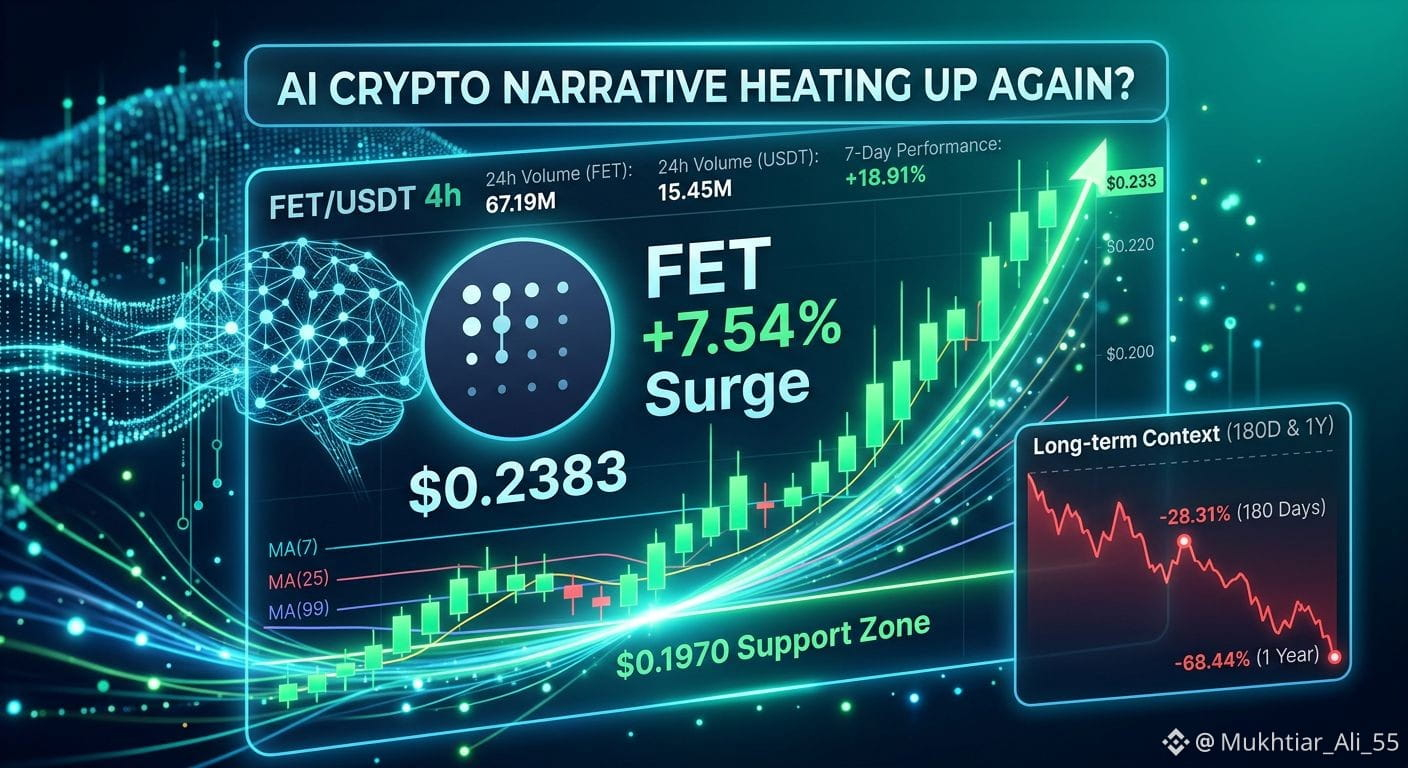
FET (Fetch.ai) Surges 7.54% — Is the AI Crypto Narrative Heating Up Again?
Fetch.ai (FET) is making some serious moves today, and the charts are telling a compelling story. Currently trading at $0.2383, FET has climbed +7.54% in the last 24 hours, touching a high of $0.2388 — just shy of its intraday resistance level.
Let's break down what's happening:
📊 Key Price Action:
Looking at the 4-hour chart, FET has staged an impressive rally from the $0.1970 support zone, pushing through multiple resistance levels with strong bullish candles. The price is now comfortably trading above all key moving averages — MA(7), MA(25), and MA(99) — which is a classic sign of bullish momentum building up.
📈 What the Numbers Say:
24h Volume (FET): 67.19M — solid participation from buyers
24h Volume (USDT): 15.45M — healthy liquidity flowing in
7-Day Performance: +18.91% — short-term bulls are clearly in control
90-Day Performance: +42.01% — a meaningful recovery trend
⚠️ The Other Side of the Coin:
While the short-term picture looks encouraging, it's important to note the bigger context. FET is still down 28.31% over 180 days and 68.44% over the past year. This tells us we're potentially in a recovery phase, not necessarily a new all-time-high run — at least not yet.
#FetchAI #CryptoTrading #AICrypto #FETToken #CryptoAnalysis
$FET
Fetch.ai (FET) is making some serious moves today, and the charts are telling a compelling story. Currently trading at $0.2383, FET has climbed +7.54% in the last 24 hours, touching a high of $0.2388 — just shy of its intraday resistance level.
Let's break down what's happening:
📊 Key Price Action:
Looking at the 4-hour chart, FET has staged an impressive rally from the $0.1970 support zone, pushing through multiple resistance levels with strong bullish candles. The price is now comfortably trading above all key moving averages — MA(7), MA(25), and MA(99) — which is a classic sign of bullish momentum building up.
📈 What the Numbers Say:
24h Volume (FET): 67.19M — solid participation from buyers
24h Volume (USDT): 15.45M — healthy liquidity flowing in
7-Day Performance: +18.91% — short-term bulls are clearly in control
90-Day Performance: +42.01% — a meaningful recovery trend
⚠️ The Other Side of the Coin:
While the short-term picture looks encouraging, it's important to note the bigger context. FET is still down 28.31% over 180 days and 68.44% over the past year. This tells us we're potentially in a recovery phase, not necessarily a new all-time-high run — at least not yet.
#FetchAI #CryptoTrading #AICrypto #FETToken #CryptoAnalysis
$FET

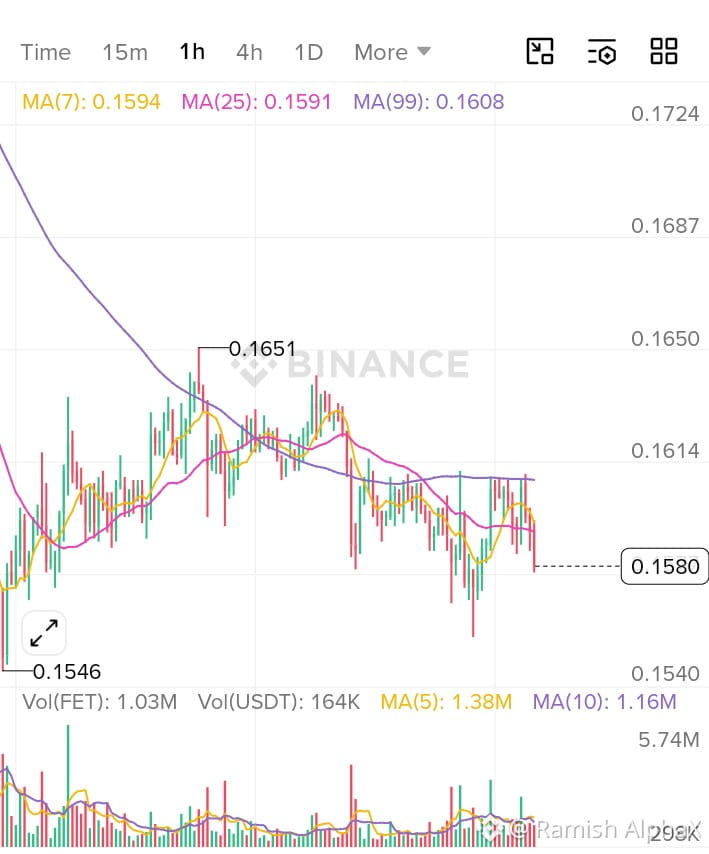
🔥 $FET 1H Analysis: Compression Before Expansion or Early Signs of Breakdown?
⏰ Timeframe Analyzed: 1 Hour (1H) Only
📊 Market Bias: Neutral → Slightly Bearish
$FET is currently trading inside a tight consolidation range after failing to sustain momentum above the 0.1614 - 0.1620 resistance zone. Price has slipped below the short-term moving averages while the MA99 continues acting as the key institutional pivot.
🎯 Trade Setup
🟡 Preferred Setup: WAIT for Confirmation
The current structure lacks a confirmed break of support or resistance, making patience the higher probability strategy.
🟢 Bullish Scenario
Entry Zone: 0.1595 - 0.1602 after an hourly close above resistance.
Stop Loss: 0.1570
🎯 Targets:
TP1: 0.1615
TP2: 0.1635
TP3: 0.1651
Risk : Reward: 1:2.0 → 1:4.0
Trade Invalidation:
Hourly close below 0.1570.
🔴 Bearish Scenario
If sellers secure an hourly close below support:
Entry Zone: Below 0.1575
Stop Loss: 0.1600
🎯 Targets:
TP1: 0.1560
TP2: 0.1546
TP3: 0.1530
Risk : Reward: 1:2.0 → 1:3.5
#FET #fetcoin #FETToken #FETUSDT #FETUSD
⏰ Timeframe Analyzed: 1 Hour (1H) Only
📊 Market Bias: Neutral → Slightly Bearish
$FET is currently trading inside a tight consolidation range after failing to sustain momentum above the 0.1614 - 0.1620 resistance zone. Price has slipped below the short-term moving averages while the MA99 continues acting as the key institutional pivot.
🎯 Trade Setup
🟡 Preferred Setup: WAIT for Confirmation
The current structure lacks a confirmed break of support or resistance, making patience the higher probability strategy.
🟢 Bullish Scenario
Entry Zone: 0.1595 - 0.1602 after an hourly close above resistance.
Stop Loss: 0.1570
🎯 Targets:
TP1: 0.1615
TP2: 0.1635
TP3: 0.1651
Risk : Reward: 1:2.0 → 1:4.0
Trade Invalidation:
Hourly close below 0.1570.
🔴 Bearish Scenario
If sellers secure an hourly close below support:
Entry Zone: Below 0.1575
Stop Loss: 0.1600
🎯 Targets:
TP1: 0.1560
TP2: 0.1546
TP3: 0.1530
Risk : Reward: 1:2.0 → 1:3.5
#FET #fetcoin #FETToken #FETUSDT #FETUSD
Log in to explore more content