
#fatflaunchesreviewofcryptohubsmoneylaunderingcontrols
fatflaunchesreviewofcryptohubsmoneylaunderingcontrols
Hot
Latest

·
--
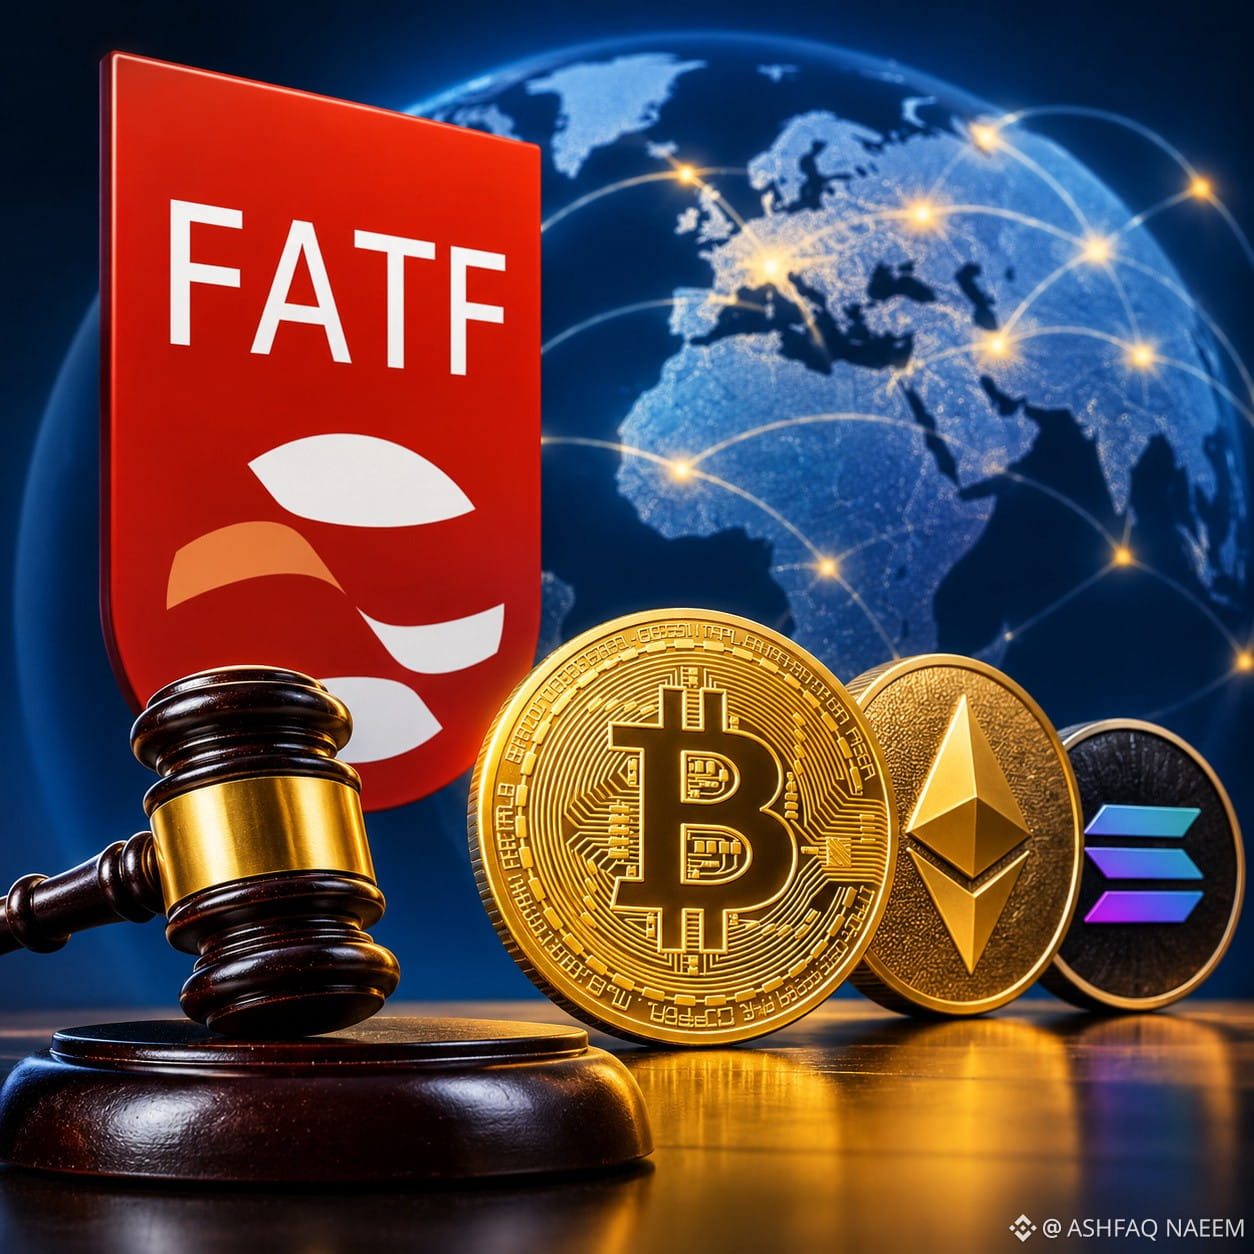
🚨FATF TARGETS CRYPTO HUBS — GLOBAL AML COMPLIANCE UNDER PRESSURE
The crypto industry is entering a new phase of regulatory scrutiny, and this time, the focus is on the countries powering the digital asset economy.
The Financial Action Task Force (FATF) has launched a targeted review of jurisdictions with significant crypto activity to identify weaknesses in their anti-money laundering (AML) controls.
🔥What makes this review important?
The FATF is focusing on jurisdictions with materially important Virtual Asset Service Provider (VASP) activity, considering their existing compliance assessment status.
The review aims to accelerate the implementation of global standards designed to prevent money laundering, terrorist financing, and other illicit activities through crypto.
📅Key dates to watch:
• June 2027 — Initial review findings
• October 2027 — Further results expected
The FATF has not yet publicly named all jurisdictions under review.
💡Why should crypto investors care?
Stronger AML enforcement could bring greater transparency, improve institutional confidence, and strengthen the long-term credibility of the crypto industry.
However, exchanges and crypto businesses operating in jurisdictions with regulatory gaps may face increased compliance costs, stricter oversight, and operational challenges.
The bigger picture is clear: Crypto adoption is growing, but regulatory accountability is becoming just as important.
The next chapter of crypto growth may depend not only on innovation, but also on how effectively the industry builds trust.
👇Your opinion matters:
Will stronger FATF oversight make crypto safer for investors, or could excessive regulation slow down innovation?
#FATFLaunchesReviewOfCryptoHubsMoneyLaunderingControls $BTC $ETH $SOL
{spot}(SOLUSDT)
{spot}(ETHUSDT)
{spot}(BTCUSDT)
🚨FATF TARGETS CRYPTO HUBS — GLOBAL AML COMPLIANCE UNDER PRESSURE
The crypto industry is entering a new phase of regulatory scrutiny, and this time, the focus is on the countries powering the digital asset economy.
The Financial Action Task Force (FATF) has launched a targeted review of jurisdictions with significant crypto activity to identify weaknesses in their anti-money laundering (AML) controls.
🔥What makes this review important?
The FATF is focusing on jurisdictions with materially important Virtual Asset Service Provider (VASP) activity, considering their existing compliance assessment status.
The review aims to accelerate the implementation of global standards designed to prevent money laundering, terrorist financing, and other illicit activities through crypto.
📅Key dates to watch:
• June 2027 — Initial review findings
• October 2027 — Further results expected
The FATF has not yet publicly named all jurisdictions under review.
💡Why should crypto investors care?
Stronger AML enforcement could bring greater transparency, improve institutional confidence, and strengthen the long-term credibility of the crypto industry.
However, exchanges and crypto businesses operating in jurisdictions with regulatory gaps may face increased compliance costs, stricter oversight, and operational challenges.
The bigger picture is clear: Crypto adoption is growing, but regulatory accountability is becoming just as important.
The next chapter of crypto growth may depend not only on innovation, but also on how effectively the industry builds trust.
👇Your opinion matters:
Will stronger FATF oversight make crypto safer for investors, or could excessive regulation slow down innovation?
#FATFLaunchesReviewOfCryptoHubsMoneyLaunderingControls $BTC $ETH $SOL
The crypto industry is entering a new phase of regulatory scrutiny, and this time, the focus is on the countries powering the digital asset economy.
The Financial Action Task Force (FATF) has launched a targeted review of jurisdictions with significant crypto activity to identify weaknesses in their anti-money laundering (AML) controls.
🔥What makes this review important?
The FATF is focusing on jurisdictions with materially important Virtual Asset Service Provider (VASP) activity, considering their existing compliance assessment status.
The review aims to accelerate the implementation of global standards designed to prevent money laundering, terrorist financing, and other illicit activities through crypto.
📅Key dates to watch:
• June 2027 — Initial review findings
• October 2027 — Further results expected
The FATF has not yet publicly named all jurisdictions under review.
💡Why should crypto investors care?
Stronger AML enforcement could bring greater transparency, improve institutional confidence, and strengthen the long-term credibility of the crypto industry.
However, exchanges and crypto businesses operating in jurisdictions with regulatory gaps may face increased compliance costs, stricter oversight, and operational challenges.
The bigger picture is clear: Crypto adoption is growing, but regulatory accountability is becoming just as important.
The next chapter of crypto growth may depend not only on innovation, but also on how effectively the industry builds trust.
👇Your opinion matters:
Will stronger FATF oversight make crypto safer for investors, or could excessive regulation slow down innovation?
#FATFLaunchesReviewOfCryptoHubsMoneyLaunderingControls $BTC $ETH $SOL
92

·
--
Bullish
#FATFLaunchesReviewOfCryptoHubsMoneyLaunderingControls
🚨 FATF TARGETS MAJOR CRYPTO HUBS IN NEW ANTI-MONEY LAUNDERING REVIEW! 🌐⚖️
Global Crackdown: The Financial Action Task Force (FATF) is launching a targeted review focusing on jurisdictions with "materially important" virtual asset service provider (VASP) activity to close enforcement gaps in global anti-money laundering (AML) standards.
Timeline for Findings: Initial findings from the watchdog's targeted review are scheduled for publication in June 2027, followed by further results in October 2027 to track regulatory progress.
The Enforcement Gap: This initiative builds on previous FATF findings showing that while many countries have adopted crypto Travel Rule legislation, a majority have yet to take active supervisory or enforcement actions.
Targeting Loopholes: Regulators are aiming to crack down on unlicensed crypto entities, cross-border oversight vulnerabilities, and the misuse of virtual assets by illicit actors.
💬 YOUR TURN: Do you think tighter global FATF supervision and stricter AML controls will help legitimize the crypto industry, or will it push activity into decentralized shadows?
👇 Drop your thoughts below!
"CLICK ON THE BELOW YELLOW COIN TAG TO GO TO DESIRED TRADING PAGE TO GET BENEFIT TRADE" $ZEC
{future}(ZECUSDT)
$ETH
{future}(ETHUSDT)
$ASTER
{future}(ASTERUSDT)
#BTC走势分析 #FATF #crypto #Binance
#FATFLaunchesReviewOfCryptoHubsMoneyLaunderingControls
🚨 FATF TARGETS MAJOR CRYPTO HUBS IN NEW ANTI-MONEY LAUNDERING REVIEW! 🌐⚖️
Global Crackdown: The Financial Action Task Force (FATF) is launching a targeted review focusing on jurisdictions with "materially important" virtual asset service provider (VASP) activity to close enforcement gaps in global anti-money laundering (AML) standards.
Timeline for Findings: Initial findings from the watchdog's targeted review are scheduled for publication in June 2027, followed by further results in October 2027 to track regulatory progress.
The Enforcement Gap: This initiative builds on previous FATF findings showing that while many countries have adopted crypto Travel Rule legislation, a majority have yet to take active supervisory or enforcement actions.
Targeting Loopholes: Regulators are aiming to crack down on unlicensed crypto entities, cross-border oversight vulnerabilities, and the misuse of virtual assets by illicit actors.
💬 YOUR TURN: Do you think tighter global FATF supervision and stricter AML controls will help legitimize the crypto industry, or will it push activity into decentralized shadows?
👇 Drop your thoughts below!
"CLICK ON THE BELOW YELLOW COIN TAG TO GO TO DESIRED TRADING PAGE TO GET BENEFIT TRADE" $ZEC
$ETH
$ASTER
#BTC走势分析 #FATF #crypto #Binance
🚨 FATF TARGETS MAJOR CRYPTO HUBS IN NEW ANTI-MONEY LAUNDERING REVIEW! 🌐⚖️
Global Crackdown: The Financial Action Task Force (FATF) is launching a targeted review focusing on jurisdictions with "materially important" virtual asset service provider (VASP) activity to close enforcement gaps in global anti-money laundering (AML) standards.
Timeline for Findings: Initial findings from the watchdog's targeted review are scheduled for publication in June 2027, followed by further results in October 2027 to track regulatory progress.
The Enforcement Gap: This initiative builds on previous FATF findings showing that while many countries have adopted crypto Travel Rule legislation, a majority have yet to take active supervisory or enforcement actions.
Targeting Loopholes: Regulators are aiming to crack down on unlicensed crypto entities, cross-border oversight vulnerabilities, and the misuse of virtual assets by illicit actors.
💬 YOUR TURN: Do you think tighter global FATF supervision and stricter AML controls will help legitimize the crypto industry, or will it push activity into decentralized shadows?
👇 Drop your thoughts below!
"CLICK ON THE BELOW YELLOW COIN TAG TO GO TO DESIRED TRADING PAGE TO GET BENEFIT TRADE" $ZEC
$ETH
$ASTER
#BTC走势分析 #FATF #crypto #Binance

1
373

·
--
Bullish
$TRON.US
{stock_us}(TRON.US)
🚨TRON overtakes #Ethereum in USDT as stablecoin supply hits $92.25B.#FATFLaunchesReviewOfCryptoHubsMoneyLaunderingControls
$TRON.US
🚨TRON overtakes #Ethereum in USDT as stablecoin supply hits $92.25B.#FATFLaunchesReviewOfCryptoHubsMoneyLaunderingControls
🚨TRON overtakes #Ethereum in USDT as stablecoin supply hits $92.25B.#FATFLaunchesReviewOfCryptoHubsMoneyLaunderingControls

TRXUS+4.38%
47

Article
Crude Is the Switch: How Oil Drives Inflation, Rate Hikes and Market Crash RiskMarket analysis · November 2, 2026 · Data as of October 30 to November 2
Oil is the main swing variable in the 2026 inflation story and the most direct reason central banks have turned hawkish. US gasoline is up about 34% on the year, headline inflation is 3.7% against 2.6% at the core, and the Fed, the Bank of Japan, the Bank of England and the European Central Bank are all leaning toward tightening because an energy shock risks turning into a broader price problem. Oil is not the only variable: tariffs, services inflation and AI-driven demand matter too. But if you want one number that points to where inflation, interest rates and risk assets are heading, it is the price of crude.
This article walks through the chain with current data, tests the claim that oil is the main variable, and then asks what it means for market crashes.
The short version
Crude: Brent traded near $110 on Monday after settling at $113.43 on Friday, up about 70% from a year ago and about 10% over the past month. It peaked near $118 in March and sank to about $72 in early July before climbing back.Inflation: September CPI was 3.7% against 2.6% core. Gasoline was up 34.2% on the year and accounted for more than half of the monthly increase. PCE inflation was 3.6% (core 3.1%).Rates: the Fed hiked in September and held on October 28 with two votes for another hike, and markets price a December hike at roughly 70%–80%. The Bank of Japan, the Bank of England and the ECB are leaning the same way.Expectations are the battleground: consumers expect 3.5% inflation over the long run, while market-based measures sit near 2.2%. The Fed is hiking to stop that gap from closing upward.Crash risk: elevated but not realized. The Nasdaq-100 is about 9% below its record and the S&P 500 about 3% below its own, while the S&P is still up about 10.7% this year. Valuations leave little cushion against bond yields near 5%.
Market snapshot
Crude: Brent about $110 and WTI about $101 (November 2).US pump prices: regular gasoline $4.17 (November 1), up from $2.81 on January 8; diesel about $6.3.US inflation (September): CPI 3.7%, core CPI 2.6%; PCE 3.6%, core PCE 3.1%.Policy rates: Fed 3.75%–4.00%; Bank of Japan 1.25%; Bank of England 3.75%; ECB deposit rate 2.50%.10-year Treasury yield: 4.93% (October 30 close).Stocks (October 30 close): S&P 500 7,580; VIX 19.4.
1. From crude to the pump to the CPI
The arithmetic is simple. A barrel holds 42 gallons, so every $10 move in crude is about 24 cents a gallon of raw cost. Brent averaged roughly $65 in January and trades near $110 now, a rise of about $45, or roughly $1.07 a gallon. AAA’s national average for regular gasoline rose from $2.81 on January 8 to $4.17 on November 1, a $1.36 increase. On that rough arithmetic, crude explains about four-fifths of the rise at the pump (my calculation), with refining margins and other costs covering the rest. Diesel, which moves freight, is up even more: $6.32 a gallon on October 6, up 71.7% from a year earlier.
The September CPI shows the pass-through. Gasoline rose 9.1% in the month and 34.2% over the year, and the BLS said it accounted for more than half of the monthly increase in the overall index. Energy as a whole was up 20.4% on the year. By one estimate gasoline alone adds about one percentage point to the 3.7% annual rate, and the gap between headline CPI (3.7%) and core CPI (2.6%) is about 1.1 points. The Fed’s preferred PCE measure puts less weight on energy, so its gap is smaller: 3.6% headline against 3.1% core.
2. Is oil really the main variable?
The case for yes. Inflation has tracked the crude price. Quarterly PCE inflation ran at 5.0% annualized in the second quarter, when Brent peaked near $118, cooled to 2.1% in the third quarter as crude fell toward $72 in July, and then re-accelerated in September as crude climbed back. Fed officials have framed it the same way: St. Louis Fed President Alberto Musalem said in April that the oil shock would keep core inflation near 3% this year, and the Fed’s September projections put 2026 PCE inflation at 3.7% and core at 3.4%.
The case for nuance. Several other forces are at work.
Tariffs. Section 232 duties of 50% on steel, aluminum and copper took effect in April, and the Fed chair has described the inflation run-up as coming from both energy and tariffs.Services. Services excluding energy are running at 3.1% and shelter at 3.2%. Core PCE at 3.1% is above core CPI at 2.6%, and core CPI has risen at a 3.4% annualized pace over the past three months.AI demand. Reuters reports central banks citing brisk AI-related demand alongside the energy shock as inflation pressure.Limited spread so far. Core goods prices are up only 0.7% on the year, and the Cleveland Fed’s nowcast for October core CPI is about 2.5%, so the second-round effects the Fed fears are not yet broad.
A fair verdict. Oil is the main driver of headline inflation and the trigger for the hawkish turn. Whether it becomes the main driver of core inflation is the open question that rate decisions now turn on.
3. From inflation to rate hikes: the Fed’s logic
Asked in September how a quarter-point hike could help when it cannot reopen the Strait of Hormuz, Chair Kevin Warsh said the Fed “cannot affect any individual price,” but can make sure changes in relative prices do not broaden into second- and third-order effects. In other words, the hikes are aimed not at oil but at wages, expectations and the prices of everything else.
Critics say the Fed should look through the shock. Treasury Secretary Scott Bessent and some economists have urged that, and UBS’s Paul Donovan has called oil a one-off shock beyond central banks’ control, the fourth in a row after pandemic supply chains, Ukraine, tariffs and the Gulf war. The Fed’s counter is the expectations data:
Consumers: the University of Michigan survey shows year-ahead inflation expectations of 4.7%, versus 3.4% in February before the war began, and long-run expectations of 3.5%, above the 2.8%–3.2% range of 2024.Markets: the five-year, five-year forward breakeven is near 2.2%, so investors have not priced a lasting shift.Policy: the Fed hiked to 3.75%–4.00% in September and held on October 28 on a 10–2 vote, with two members preferring another hike.
The pattern is global. The Bank of Japan held at 1.25% on October 30 but said underlying inflation has reached its 2% target. The Bank of England, with UK inflation at 3.5% and motor fuel up 29.8%, is widely expected to raise Bank Rate from 3.75% on November 5. The ECB held at 2.50% on October 29 with euro-area inflation at 3.8% and energy up about 19%, and left December open.
4. The oil market today
Price. Brent fell about 3% on Monday to near $110 after settling at $113.43 on Friday, and WTI traded near $101. Brent is about 70% above a year ago.
Supply. IEA data show flows through the Strait of Hormuz averaged only 7.6 million barrels a day in August, against roughly a fifth of world oil before the war, and observed global stocks at the end of September were 509 million barrels below pre-war levels. The US Strategic Petroleum Reserve is at 282.7 million barrels, the lowest since 1982. Over the weekend, two tankers were reported struck by mines near Hormuz, the Houthis said they had attacked Saudi facilities on Thursday, and the Wall Street Journal has reported that Washington told Gulf allies to prepare for a short, intense campaign after the November 3 midterms.
Diplomacy. Prices eased on Monday because Iran’s foreign minister said a Qatar-brokered plan could reopen Hormuz within two days if the US meets Tehran’s conditions, and because of reports that the White House favors more diplomacy before any military escalation. OPEC+ held its December output target. One analyst note frames the near-term range as about $104 if talks progress and $120 if they stall after the midterms.
Demand. The IEA’s October report sees global oil demand falling 2.6 million barrels a day in 2026 as high prices and weaker activity bite. Demand destruction is how oil shocks eventually cap themselves, but at a cost to growth.
5. From inflation to market crashes: how the transmission works
This section is analysis, not a forecast. Inflation caused by an oil shock can hurt markets through six channels.
Discount rates. Higher yields reduce the present value of distant earnings. The 10-year Treasury yield rose from 4.18% on December 31 to about 5.24% on October 9 and closed October 30 at 4.93%. The S&P 500’s forward earnings yield of about 5.2% is roughly equal to that, which leaves little equity risk premium, and the Shiller CAPE near 41 is second only to 1999–2000.Margins and costs. Fuel, freight and tariffs squeeze companies that cannot pass costs on, and AI builders face costlier funding at the same time.Real incomes. Real disposable income fell 0.3% in September, the saving rate was 3.8%, and consumer sentiment is near 48, all of which weigh on consumer earnings.No policy cushion. When inflation is above target, central banks cannot cut to soften a fall, and stocks and bonds can drop together, which weakens diversification. That happened in the September–October bond rout.Liquidity and leverage. On October 30, stocks, gold and crypto all fell together, and more than $1.5 billion of crypto positions were liquidated, a sign of forced selling rather than a single-asset story.Growth. An oil shock plus hikes raises recession risk. The IEA sees demand falling, euro-area activity is slowing, and US real spending has stalled.
6. What history says
These figures are approximate, and history is a guide rather than a forecast.
1973–74: the Arab oil embargo roughly quadrupled crude. US inflation peaked above 12%, and the S&P 500 fell about 48% from January 1973 to October 1974.1979–82: the Iranian revolution roughly doubled oil again. Inflation peaked near 15%, the Fed pushed rates to about 20%, and the S&P 500 fell about 27% from late 1980 to August 1982.1990: Iraq’s invasion of Kuwait roughly doubled oil, and the S&P 500 fell about 20% from July to October 1990 as the US slipped into recession.2022: after Russia invaded Ukraine, Brent spiked above $120, US inflation peaked at 9.1% in June, the Fed raised rates by 4.25 points, and the S&P 500 fell about 25% from January to October.
The damage was usually greatest where inflation was already high, where central banks tightened hard into the shock, or where starting valuations were rich. Today inflation is far lower than in the 1970s, with core CPI at 2.6% and market-based expectations near 2.2%, and the S&P 500 is still up about 10.7% this year on strong earnings. But oil is up about 70%, central banks are hiking, and valuations are high.
7. Where markets stand now
On Friday, October 30, the S&P 500 fell 1.8% to 7,580, the Nasdaq Composite fell 2.9%, the Nasdaq-100 fell 3.5% and closed about 9.1% below its October 6 record, and the Philadelphia Semiconductor Index plunged 7.2%. The VIX touched its highest level since April and closed near 19.4. For October the Nasdaq lost 5.3%, its worst month since March 2025, while the Dow gained 1.7% as investors rotated into defensive areas. Gold fell 3.3% to a one-year low and Bitcoin slid with it. Futures rebounded on Monday as Brent fell.
Strategists disagree. Morgan Stanley’s Mike Wilson expects one more leg lower of about 9% in the S&P 500, to around 7,100, before a rally toward 8,000, while Yardeni Research has noted that a Nasdaq decline of this size is not unusual for such a volatile index. By the usual definition of a crash, a fall of 20% or more, nothing has happened yet. The risk is in the setup: thin valuation cushions, bond yields near 5%, and an oil price that governments cannot control.
8. Scenarios from here
None of these can be given reliable odds.
De-escalation. Iran’s two-day Hormuz plan gains traction, Brent moves toward $104 or lower, headline inflation eases and December hike odds fade. Yields fall, and stocks and crypto get relief. Core inflation and tariffs would still keep the Fed cautious.Escalation after the midterms. Brent pushes past $120, CPI re-accelerates, a December hike is locked in and inflation expectations drift up. Yields rise, and crash risk increases most for AI-funded names and leveraged positions.Stalemate. Brent stays in a $100–$120 range and the Fed hikes in December. Pressure builds slowly, and corporate earnings and AI funding decide the direction of stocks.
9. What to watch
Brent: the $104 and $120 lines, and any sign of tanker traffic through Hormuz.Tuesday, November 3: US midterm elections.Thursday, November 5: Bank of England decision and its vote split.Friday, November 6: US October jobs report.Tuesday, November 10: US October CPI, headline versus core, and shelter.Expectations: the University of Michigan’s November reading and five-year, five-year breakevens.Wednesday, December 9: Fed decision.Markets: the 10-year yield near 5%, the VIX, credit spreads, semiconductor stocks, gold and Bitcoin ETF flows.
Bottom line
Crude is the switch that most directly moves headline inflation, and headline inflation is what has pushed the Fed, the Bank of Japan, the Bank of England and the ECB toward tightening. It is not the only variable, and the Fed’s hikes are aimed at stopping oil from spreading into wages and expectations, not at oil itself. For markets, the danger from an oil-driven inflation shock is less an immediate crash than a squeeze: higher yields on stretched valuations, no central bank cushion, and leverage that can force selling. If Hormuz reopens, the squeeze eases quickly. If it does not, the next test comes after the midterms.
This article is for information only and is not financial advice. Markets are volatile and you can lose money. Do your own research.
Sources and data notes
Data are as of October 30 to November 2, 2026, and change quickly; oil quotes differ by contract and time of day. Oil prices draw on Trading Economics, Reuters and Bloomberg as relayed by FinanceFeeds, Mitrade and Discovery Alert. Pump prices draw on AAA, EIA and LendingTree. Inflation data draw on the Bureau of Labor Statistics release as reported by CNBC, Wichita Liberty, Admiral Markets and Portfolio Terminal, and on the Commerce Department’s PCE release. Inflation expectations draw on the University of Michigan and FatTail’s summary of FRED data. Fed views draw on the Federal Reserve’s press-conference transcripts, Reuters, Fortune and the Daily Caller News Foundation. Supply and demand data draw on the IEA’s October Oil Market Report as reported by gCaptain, and on US Energy Department data. Market data draw on market-close summaries from FNArena, Bloomberg, Tickmill and Market Index, and valuation data on FactSet as relayed by Seeking Alpha and Infrastructure Capital. Historical figures are approximate and from standard market histories. Strategist views are their own opinions.
#USMidtermElections #BinanceWithdrawalScamWarning #Verify1to1BinanceReserves #StrategyRepurchases$208MSTRCAdds811Bitcoin #FATFLaunchesReviewOfCryptoHubsMoneyLaunderingControls
Crude Is the Switch: How Oil Drives Inflation, Rate Hikes and Market Crash Risk
Market analysis · November 2, 2026 · Data as of October 30 to November 2
Oil is the main swing variable in the 2026 inflation story and the most direct reason central banks have turned hawkish. US gasoline is up about 34% on the year, headline inflation is 3.7% against 2.6% at the core, and the Fed, the Bank of Japan, the Bank of England and the European Central Bank are all leaning toward tightening because an energy shock risks turning into a broader price problem. Oil is not the only variable: tariffs, services inflation and AI-driven demand matter too. But if you want one number that points to where inflation, interest rates and risk assets are heading, it is the price of crude.
This article walks through the chain with current data, tests the claim that oil is the main variable, and then asks what it means for market crashes.
The short version
Crude: Brent traded near $110 on Monday after settling at $113.43 on Friday, up about 70% from a year ago and about 10% over the past month. It peaked near $118 in March and sank to about $72 in early July before climbing back.Inflation: September CPI was 3.7% against 2.6% core. Gasoline was up 34.2% on the year and accounted for more than half of the monthly increase. PCE inflation was 3.6% (core 3.1%).Rates: the Fed hiked in September and held on October 28 with two votes for another hike, and markets price a December hike at roughly 70%–80%. The Bank of Japan, the Bank of England and the ECB are leaning the same way.Expectations are the battleground: consumers expect 3.5% inflation over the long run, while market-based measures sit near 2.2%. The Fed is hiking to stop that gap from closing upward.Crash risk: elevated but not realized. The Nasdaq-100 is about 9% below its record and the S&P 500 about 3% below its own, while the S&P is still up about 10.7% this year. Valuations leave little cushion against bond yields near 5%.
Market snapshot
Crude: Brent about $110 and WTI about $101 (November 2).US pump prices: regular gasoline $4.17 (November 1), up from $2.81 on January 8; diesel about $6.3.US inflation (September): CPI 3.7%, core CPI 2.6%; PCE 3.6%, core PCE 3.1%.Policy rates: Fed 3.75%–4.00%; Bank of Japan 1.25%; Bank of England 3.75%; ECB deposit rate 2.50%.10-year Treasury yield: 4.93% (October 30 close).Stocks (October 30 close): S&P 500 7,580; VIX 19.4.
1. From crude to the pump to the CPI
The arithmetic is simple. A barrel holds 42 gallons, so every $10 move in crude is about 24 cents a gallon of raw cost. Brent averaged roughly $65 in January and trades near $110 now, a rise of about $45, or roughly $1.07 a gallon. AAA’s national average for regular gasoline rose from $2.81 on January 8 to $4.17 on November 1, a $1.36 increase. On that rough arithmetic, crude explains about four-fifths of the rise at the pump (my calculation), with refining margins and other costs covering the rest. Diesel, which moves freight, is up even more: $6.32 a gallon on October 6, up 71.7% from a year earlier.
The September CPI shows the pass-through. Gasoline rose 9.1% in the month and 34.2% over the year, and the BLS said it accounted for more than half of the monthly increase in the overall index. Energy as a whole was up 20.4% on the year. By one estimate gasoline alone adds about one percentage point to the 3.7% annual rate, and the gap between headline CPI (3.7%) and core CPI (2.6%) is about 1.1 points. The Fed’s preferred PCE measure puts less weight on energy, so its gap is smaller: 3.6% headline against 3.1% core.
2. Is oil really the main variable?
The case for yes. Inflation has tracked the crude price. Quarterly PCE inflation ran at 5.0% annualized in the second quarter, when Brent peaked near $118, cooled to 2.1% in the third quarter as crude fell toward $72 in July, and then re-accelerated in September as crude climbed back. Fed officials have framed it the same way: St. Louis Fed President Alberto Musalem said in April that the oil shock would keep core inflation near 3% this year, and the Fed’s September projections put 2026 PCE inflation at 3.7% and core at 3.4%.
The case for nuance. Several other forces are at work.
Tariffs. Section 232 duties of 50% on steel, aluminum and copper took effect in April, and the Fed chair has described the inflation run-up as coming from both energy and tariffs.Services. Services excluding energy are running at 3.1% and shelter at 3.2%. Core PCE at 3.1% is above core CPI at 2.6%, and core CPI has risen at a 3.4% annualized pace over the past three months.AI demand. Reuters reports central banks citing brisk AI-related demand alongside the energy shock as inflation pressure.Limited spread so far. Core goods prices are up only 0.7% on the year, and the Cleveland Fed’s nowcast for October core CPI is about 2.5%, so the second-round effects the Fed fears are not yet broad.
A fair verdict. Oil is the main driver of headline inflation and the trigger for the hawkish turn. Whether it becomes the main driver of core inflation is the open question that rate decisions now turn on.
3. From inflation to rate hikes: the Fed’s logic
Asked in September how a quarter-point hike could help when it cannot reopen the Strait of Hormuz, Chair Kevin Warsh said the Fed “cannot affect any individual price,” but can make sure changes in relative prices do not broaden into second- and third-order effects. In other words, the hikes are aimed not at oil but at wages, expectations and the prices of everything else.
Critics say the Fed should look through the shock. Treasury Secretary Scott Bessent and some economists have urged that, and UBS’s Paul Donovan has called oil a one-off shock beyond central banks’ control, the fourth in a row after pandemic supply chains, Ukraine, tariffs and the Gulf war. The Fed’s counter is the expectations data:
Consumers: the University of Michigan survey shows year-ahead inflation expectations of 4.7%, versus 3.4% in February before the war began, and long-run expectations of 3.5%, above the 2.8%–3.2% range of 2024.Markets: the five-year, five-year forward breakeven is near 2.2%, so investors have not priced a lasting shift.Policy: the Fed hiked to 3.75%–4.00% in September and held on October 28 on a 10–2 vote, with two members preferring another hike.
The pattern is global. The Bank of Japan held at 1.25% on October 30 but said underlying inflation has reached its 2% target. The Bank of England, with UK inflation at 3.5% and motor fuel up 29.8%, is widely expected to raise Bank Rate from 3.75% on November 5. The ECB held at 2.50% on October 29 with euro-area inflation at 3.8% and energy up about 19%, and left December open.
4. The oil market today
Price. Brent fell about 3% on Monday to near $110 after settling at $113.43 on Friday, and WTI traded near $101. Brent is about 70% above a year ago.
Supply. IEA data show flows through the Strait of Hormuz averaged only 7.6 million barrels a day in August, against roughly a fifth of world oil before the war, and observed global stocks at the end of September were 509 million barrels below pre-war levels. The US Strategic Petroleum Reserve is at 282.7 million barrels, the lowest since 1982. Over the weekend, two tankers were reported struck by mines near Hormuz, the Houthis said they had attacked Saudi facilities on Thursday, and the Wall Street Journal has reported that Washington told Gulf allies to prepare for a short, intense campaign after the November 3 midterms.
Diplomacy. Prices eased on Monday because Iran’s foreign minister said a Qatar-brokered plan could reopen Hormuz within two days if the US meets Tehran’s conditions, and because of reports that the White House favors more diplomacy before any military escalation. OPEC+ held its December output target. One analyst note frames the near-term range as about $104 if talks progress and $120 if they stall after the midterms.
Demand. The IEA’s October report sees global oil demand falling 2.6 million barrels a day in 2026 as high prices and weaker activity bite. Demand destruction is how oil shocks eventually cap themselves, but at a cost to growth.
5. From inflation to market crashes: how the transmission works
This section is analysis, not a forecast. Inflation caused by an oil shock can hurt markets through six channels.
Discount rates. Higher yields reduce the present value of distant earnings. The 10-year Treasury yield rose from 4.18% on December 31 to about 5.24% on October 9 and closed October 30 at 4.93%. The S&P 500’s forward earnings yield of about 5.2% is roughly equal to that, which leaves little equity risk premium, and the Shiller CAPE near 41 is second only to 1999–2000.Margins and costs. Fuel, freight and tariffs squeeze companies that cannot pass costs on, and AI builders face costlier funding at the same time.Real incomes. Real disposable income fell 0.3% in September, the saving rate was 3.8%, and consumer sentiment is near 48, all of which weigh on consumer earnings.No policy cushion. When inflation is above target, central banks cannot cut to soften a fall, and stocks and bonds can drop together, which weakens diversification. That happened in the September–October bond rout.Liquidity and leverage. On October 30, stocks, gold and crypto all fell together, and more than $1.5 billion of crypto positions were liquidated, a sign of forced selling rather than a single-asset story.Growth. An oil shock plus hikes raises recession risk. The IEA sees demand falling, euro-area activity is slowing, and US real spending has stalled.
6. What history says
These figures are approximate, and history is a guide rather than a forecast.
1973–74: the Arab oil embargo roughly quadrupled crude. US inflation peaked above 12%, and the S&P 500 fell about 48% from January 1973 to October 1974.1979–82: the Iranian revolution roughly doubled oil again. Inflation peaked near 15%, the Fed pushed rates to about 20%, and the S&P 500 fell about 27% from late 1980 to August 1982.1990: Iraq’s invasion of Kuwait roughly doubled oil, and the S&P 500 fell about 20% from July to October 1990 as the US slipped into recession.2022: after Russia invaded Ukraine, Brent spiked above $120, US inflation peaked at 9.1% in June, the Fed raised rates by 4.25 points, and the S&P 500 fell about 25% from January to October.
The damage was usually greatest where inflation was already high, where central banks tightened hard into the shock, or where starting valuations were rich. Today inflation is far lower than in the 1970s, with core CPI at 2.6% and market-based expectations near 2.2%, and the S&P 500 is still up about 10.7% this year on strong earnings. But oil is up about 70%, central banks are hiking, and valuations are high.
7. Where markets stand now
On Friday, October 30, the S&P 500 fell 1.8% to 7,580, the Nasdaq Composite fell 2.9%, the Nasdaq-100 fell 3.5% and closed about 9.1% below its October 6 record, and the Philadelphia Semiconductor Index plunged 7.2%. The VIX touched its highest level since April and closed near 19.4. For October the Nasdaq lost 5.3%, its worst month since March 2025, while the Dow gained 1.7% as investors rotated into defensive areas. Gold fell 3.3% to a one-year low and Bitcoin slid with it. Futures rebounded on Monday as Brent fell.
Strategists disagree. Morgan Stanley’s Mike Wilson expects one more leg lower of about 9% in the S&P 500, to around 7,100, before a rally toward 8,000, while Yardeni Research has noted that a Nasdaq decline of this size is not unusual for such a volatile index. By the usual definition of a crash, a fall of 20% or more, nothing has happened yet. The risk is in the setup: thin valuation cushions, bond yields near 5%, and an oil price that governments cannot control.
8. Scenarios from here
None of these can be given reliable odds.
De-escalation. Iran’s two-day Hormuz plan gains traction, Brent moves toward $104 or lower, headline inflation eases and December hike odds fade. Yields fall, and stocks and crypto get relief. Core inflation and tariffs would still keep the Fed cautious.Escalation after the midterms. Brent pushes past $120, CPI re-accelerates, a December hike is locked in and inflation expectations drift up. Yields rise, and crash risk increases most for AI-funded names and leveraged positions.Stalemate. Brent stays in a $100–$120 range and the Fed hikes in December. Pressure builds slowly, and corporate earnings and AI funding decide the direction of stocks.
9. What to watch
Brent: the $104 and $120 lines, and any sign of tanker traffic through Hormuz.Tuesday, November 3: US midterm elections.Thursday, November 5: Bank of England decision and its vote split.Friday, November 6: US October jobs report.Tuesday, November 10: US October CPI, headline versus core, and shelter.Expectations: the University of Michigan’s November reading and five-year, five-year breakevens.Wednesday, December 9: Fed decision.Markets: the 10-year yield near 5%, the VIX, credit spreads, semiconductor stocks, gold and Bitcoin ETF flows.
Bottom line
Crude is the switch that most directly moves headline inflation, and headline inflation is what has pushed the Fed, the Bank of Japan, the Bank of England and the ECB toward tightening. It is not the only variable, and the Fed’s hikes are aimed at stopping oil from spreading into wages and expectations, not at oil itself. For markets, the danger from an oil-driven inflation shock is less an immediate crash than a squeeze: higher yields on stretched valuations, no central bank cushion, and leverage that can force selling. If Hormuz reopens, the squeeze eases quickly. If it does not, the next test comes after the midterms.
This article is for information only and is not financial advice. Markets are volatile and you can lose money. Do your own research.
Sources and data notes
Data are as of October 30 to November 2, 2026, and change quickly; oil quotes differ by contract and time of day. Oil prices draw on Trading Economics, Reuters and Bloomberg as relayed by FinanceFeeds, Mitrade and Discovery Alert. Pump prices draw on AAA, EIA and LendingTree. Inflation data draw on the Bureau of Labor Statistics release as reported by CNBC, Wichita Liberty, Admiral Markets and Portfolio Terminal, and on the Commerce Department’s PCE release. Inflation expectations draw on the University of Michigan and FatTail’s summary of FRED data. Fed views draw on the Federal Reserve’s press-conference transcripts, Reuters, Fortune and the Daily Caller News Foundation. Supply and demand data draw on the IEA’s October Oil Market Report as reported by gCaptain, and on US Energy Department data. Market data draw on market-close summaries from FNArena, Bloomberg, Tickmill and Market Index, and valuation data on FactSet as relayed by Seeking Alpha and Infrastructure Capital. Historical figures are approximate and from standard market histories. Strategist views are their own opinions.
#USMidtermElections #BinanceWithdrawalScamWarning #Verify1to1BinanceReserves #StrategyRepurchases$208MSTRCAdds811Bitcoin #FATFLaunchesReviewOfCryptoHubsMoneyLaunderingControls
Oil is the main swing variable in the 2026 inflation story and the most direct reason central banks have turned hawkish. US gasoline is up about 34% on the year, headline inflation is 3.7% against 2.6% at the core, and the Fed, the Bank of Japan, the Bank of England and the European Central Bank are all leaning toward tightening because an energy shock risks turning into a broader price problem. Oil is not the only variable: tariffs, services inflation and AI-driven demand matter too. But if you want one number that points to where inflation, interest rates and risk assets are heading, it is the price of crude.
This article walks through the chain with current data, tests the claim that oil is the main variable, and then asks what it means for market crashes.
The short version
Crude: Brent traded near $110 on Monday after settling at $113.43 on Friday, up about 70% from a year ago and about 10% over the past month. It peaked near $118 in March and sank to about $72 in early July before climbing back.Inflation: September CPI was 3.7% against 2.6% core. Gasoline was up 34.2% on the year and accounted for more than half of the monthly increase. PCE inflation was 3.6% (core 3.1%).Rates: the Fed hiked in September and held on October 28 with two votes for another hike, and markets price a December hike at roughly 70%–80%. The Bank of Japan, the Bank of England and the ECB are leaning the same way.Expectations are the battleground: consumers expect 3.5% inflation over the long run, while market-based measures sit near 2.2%. The Fed is hiking to stop that gap from closing upward.Crash risk: elevated but not realized. The Nasdaq-100 is about 9% below its record and the S&P 500 about 3% below its own, while the S&P is still up about 10.7% this year. Valuations leave little cushion against bond yields near 5%.
Market snapshot
Crude: Brent about $110 and WTI about $101 (November 2).US pump prices: regular gasoline $4.17 (November 1), up from $2.81 on January 8; diesel about $6.3.US inflation (September): CPI 3.7%, core CPI 2.6%; PCE 3.6%, core PCE 3.1%.Policy rates: Fed 3.75%–4.00%; Bank of Japan 1.25%; Bank of England 3.75%; ECB deposit rate 2.50%.10-year Treasury yield: 4.93% (October 30 close).Stocks (October 30 close): S&P 500 7,580; VIX 19.4.
1. From crude to the pump to the CPI
The arithmetic is simple. A barrel holds 42 gallons, so every $10 move in crude is about 24 cents a gallon of raw cost. Brent averaged roughly $65 in January and trades near $110 now, a rise of about $45, or roughly $1.07 a gallon. AAA’s national average for regular gasoline rose from $2.81 on January 8 to $4.17 on November 1, a $1.36 increase. On that rough arithmetic, crude explains about four-fifths of the rise at the pump (my calculation), with refining margins and other costs covering the rest. Diesel, which moves freight, is up even more: $6.32 a gallon on October 6, up 71.7% from a year earlier.
The September CPI shows the pass-through. Gasoline rose 9.1% in the month and 34.2% over the year, and the BLS said it accounted for more than half of the monthly increase in the overall index. Energy as a whole was up 20.4% on the year. By one estimate gasoline alone adds about one percentage point to the 3.7% annual rate, and the gap between headline CPI (3.7%) and core CPI (2.6%) is about 1.1 points. The Fed’s preferred PCE measure puts less weight on energy, so its gap is smaller: 3.6% headline against 3.1% core.
2. Is oil really the main variable?
The case for yes. Inflation has tracked the crude price. Quarterly PCE inflation ran at 5.0% annualized in the second quarter, when Brent peaked near $118, cooled to 2.1% in the third quarter as crude fell toward $72 in July, and then re-accelerated in September as crude climbed back. Fed officials have framed it the same way: St. Louis Fed President Alberto Musalem said in April that the oil shock would keep core inflation near 3% this year, and the Fed’s September projections put 2026 PCE inflation at 3.7% and core at 3.4%.
The case for nuance. Several other forces are at work.
Tariffs. Section 232 duties of 50% on steel, aluminum and copper took effect in April, and the Fed chair has described the inflation run-up as coming from both energy and tariffs.Services. Services excluding energy are running at 3.1% and shelter at 3.2%. Core PCE at 3.1% is above core CPI at 2.6%, and core CPI has risen at a 3.4% annualized pace over the past three months.AI demand. Reuters reports central banks citing brisk AI-related demand alongside the energy shock as inflation pressure.Limited spread so far. Core goods prices are up only 0.7% on the year, and the Cleveland Fed’s nowcast for October core CPI is about 2.5%, so the second-round effects the Fed fears are not yet broad.
A fair verdict. Oil is the main driver of headline inflation and the trigger for the hawkish turn. Whether it becomes the main driver of core inflation is the open question that rate decisions now turn on.
3. From inflation to rate hikes: the Fed’s logic
Asked in September how a quarter-point hike could help when it cannot reopen the Strait of Hormuz, Chair Kevin Warsh said the Fed “cannot affect any individual price,” but can make sure changes in relative prices do not broaden into second- and third-order effects. In other words, the hikes are aimed not at oil but at wages, expectations and the prices of everything else.
Critics say the Fed should look through the shock. Treasury Secretary Scott Bessent and some economists have urged that, and UBS’s Paul Donovan has called oil a one-off shock beyond central banks’ control, the fourth in a row after pandemic supply chains, Ukraine, tariffs and the Gulf war. The Fed’s counter is the expectations data:
Consumers: the University of Michigan survey shows year-ahead inflation expectations of 4.7%, versus 3.4% in February before the war began, and long-run expectations of 3.5%, above the 2.8%–3.2% range of 2024.Markets: the five-year, five-year forward breakeven is near 2.2%, so investors have not priced a lasting shift.Policy: the Fed hiked to 3.75%–4.00% in September and held on October 28 on a 10–2 vote, with two members preferring another hike.
The pattern is global. The Bank of Japan held at 1.25% on October 30 but said underlying inflation has reached its 2% target. The Bank of England, with UK inflation at 3.5% and motor fuel up 29.8%, is widely expected to raise Bank Rate from 3.75% on November 5. The ECB held at 2.50% on October 29 with euro-area inflation at 3.8% and energy up about 19%, and left December open.
4. The oil market today
Price. Brent fell about 3% on Monday to near $110 after settling at $113.43 on Friday, and WTI traded near $101. Brent is about 70% above a year ago.
Supply. IEA data show flows through the Strait of Hormuz averaged only 7.6 million barrels a day in August, against roughly a fifth of world oil before the war, and observed global stocks at the end of September were 509 million barrels below pre-war levels. The US Strategic Petroleum Reserve is at 282.7 million barrels, the lowest since 1982. Over the weekend, two tankers were reported struck by mines near Hormuz, the Houthis said they had attacked Saudi facilities on Thursday, and the Wall Street Journal has reported that Washington told Gulf allies to prepare for a short, intense campaign after the November 3 midterms.
Diplomacy. Prices eased on Monday because Iran’s foreign minister said a Qatar-brokered plan could reopen Hormuz within two days if the US meets Tehran’s conditions, and because of reports that the White House favors more diplomacy before any military escalation. OPEC+ held its December output target. One analyst note frames the near-term range as about $104 if talks progress and $120 if they stall after the midterms.
Demand. The IEA’s October report sees global oil demand falling 2.6 million barrels a day in 2026 as high prices and weaker activity bite. Demand destruction is how oil shocks eventually cap themselves, but at a cost to growth.
5. From inflation to market crashes: how the transmission works
This section is analysis, not a forecast. Inflation caused by an oil shock can hurt markets through six channels.
Discount rates. Higher yields reduce the present value of distant earnings. The 10-year Treasury yield rose from 4.18% on December 31 to about 5.24% on October 9 and closed October 30 at 4.93%. The S&P 500’s forward earnings yield of about 5.2% is roughly equal to that, which leaves little equity risk premium, and the Shiller CAPE near 41 is second only to 1999–2000.Margins and costs. Fuel, freight and tariffs squeeze companies that cannot pass costs on, and AI builders face costlier funding at the same time.Real incomes. Real disposable income fell 0.3% in September, the saving rate was 3.8%, and consumer sentiment is near 48, all of which weigh on consumer earnings.No policy cushion. When inflation is above target, central banks cannot cut to soften a fall, and stocks and bonds can drop together, which weakens diversification. That happened in the September–October bond rout.Liquidity and leverage. On October 30, stocks, gold and crypto all fell together, and more than $1.5 billion of crypto positions were liquidated, a sign of forced selling rather than a single-asset story.Growth. An oil shock plus hikes raises recession risk. The IEA sees demand falling, euro-area activity is slowing, and US real spending has stalled.
6. What history says
These figures are approximate, and history is a guide rather than a forecast.
1973–74: the Arab oil embargo roughly quadrupled crude. US inflation peaked above 12%, and the S&P 500 fell about 48% from January 1973 to October 1974.1979–82: the Iranian revolution roughly doubled oil again. Inflation peaked near 15%, the Fed pushed rates to about 20%, and the S&P 500 fell about 27% from late 1980 to August 1982.1990: Iraq’s invasion of Kuwait roughly doubled oil, and the S&P 500 fell about 20% from July to October 1990 as the US slipped into recession.2022: after Russia invaded Ukraine, Brent spiked above $120, US inflation peaked at 9.1% in June, the Fed raised rates by 4.25 points, and the S&P 500 fell about 25% from January to October.
The damage was usually greatest where inflation was already high, where central banks tightened hard into the shock, or where starting valuations were rich. Today inflation is far lower than in the 1970s, with core CPI at 2.6% and market-based expectations near 2.2%, and the S&P 500 is still up about 10.7% this year on strong earnings. But oil is up about 70%, central banks are hiking, and valuations are high.
7. Where markets stand now
On Friday, October 30, the S&P 500 fell 1.8% to 7,580, the Nasdaq Composite fell 2.9%, the Nasdaq-100 fell 3.5% and closed about 9.1% below its October 6 record, and the Philadelphia Semiconductor Index plunged 7.2%. The VIX touched its highest level since April and closed near 19.4. For October the Nasdaq lost 5.3%, its worst month since March 2025, while the Dow gained 1.7% as investors rotated into defensive areas. Gold fell 3.3% to a one-year low and Bitcoin slid with it. Futures rebounded on Monday as Brent fell.
Strategists disagree. Morgan Stanley’s Mike Wilson expects one more leg lower of about 9% in the S&P 500, to around 7,100, before a rally toward 8,000, while Yardeni Research has noted that a Nasdaq decline of this size is not unusual for such a volatile index. By the usual definition of a crash, a fall of 20% or more, nothing has happened yet. The risk is in the setup: thin valuation cushions, bond yields near 5%, and an oil price that governments cannot control.
8. Scenarios from here
None of these can be given reliable odds.
De-escalation. Iran’s two-day Hormuz plan gains traction, Brent moves toward $104 or lower, headline inflation eases and December hike odds fade. Yields fall, and stocks and crypto get relief. Core inflation and tariffs would still keep the Fed cautious.Escalation after the midterms. Brent pushes past $120, CPI re-accelerates, a December hike is locked in and inflation expectations drift up. Yields rise, and crash risk increases most for AI-funded names and leveraged positions.Stalemate. Brent stays in a $100–$120 range and the Fed hikes in December. Pressure builds slowly, and corporate earnings and AI funding decide the direction of stocks.
9. What to watch
Brent: the $104 and $120 lines, and any sign of tanker traffic through Hormuz.Tuesday, November 3: US midterm elections.Thursday, November 5: Bank of England decision and its vote split.Friday, November 6: US October jobs report.Tuesday, November 10: US October CPI, headline versus core, and shelter.Expectations: the University of Michigan’s November reading and five-year, five-year breakevens.Wednesday, December 9: Fed decision.Markets: the 10-year yield near 5%, the VIX, credit spreads, semiconductor stocks, gold and Bitcoin ETF flows.
Bottom line
Crude is the switch that most directly moves headline inflation, and headline inflation is what has pushed the Fed, the Bank of Japan, the Bank of England and the ECB toward tightening. It is not the only variable, and the Fed’s hikes are aimed at stopping oil from spreading into wages and expectations, not at oil itself. For markets, the danger from an oil-driven inflation shock is less an immediate crash than a squeeze: higher yields on stretched valuations, no central bank cushion, and leverage that can force selling. If Hormuz reopens, the squeeze eases quickly. If it does not, the next test comes after the midterms.
This article is for information only and is not financial advice. Markets are volatile and you can lose money. Do your own research.
Sources and data notes
Data are as of October 30 to November 2, 2026, and change quickly; oil quotes differ by contract and time of day. Oil prices draw on Trading Economics, Reuters and Bloomberg as relayed by FinanceFeeds, Mitrade and Discovery Alert. Pump prices draw on AAA, EIA and LendingTree. Inflation data draw on the Bureau of Labor Statistics release as reported by CNBC, Wichita Liberty, Admiral Markets and Portfolio Terminal, and on the Commerce Department’s PCE release. Inflation expectations draw on the University of Michigan and FatTail’s summary of FRED data. Fed views draw on the Federal Reserve’s press-conference transcripts, Reuters, Fortune and the Daily Caller News Foundation. Supply and demand data draw on the IEA’s October Oil Market Report as reported by gCaptain, and on US Energy Department data. Market data draw on market-close summaries from FNArena, Bloomberg, Tickmill and Market Index, and valuation data on FactSet as relayed by Seeking Alpha and Infrastructure Capital. Historical figures are approximate and from standard market histories. Strategist views are their own opinions.
#USMidtermElections #BinanceWithdrawalScamWarning #Verify1to1BinanceReserves #StrategyRepurchases$208MSTRCAdds811Bitcoin #FATFLaunchesReviewOfCryptoHubsMoneyLaunderingControls
796

·
--
Article
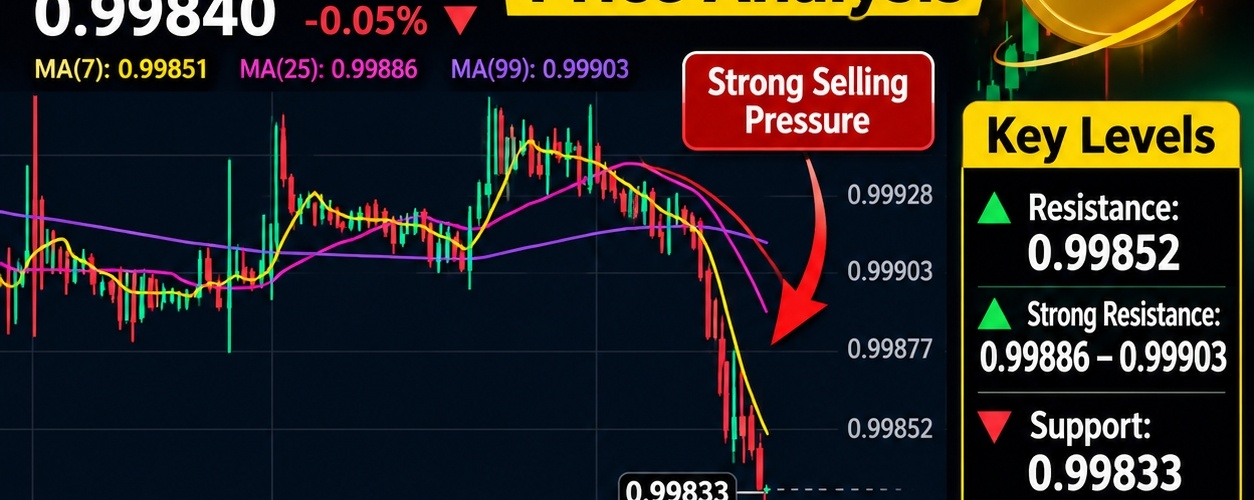
USD1/USDT Price Analysis: Sellers Take Control as RSI Signals Oversold Conditions$$USD1 /USDT is currently trading around $0.99840, showing a slight decline of approximately 0.05%.
Market Overview
The 15-minute chart shows strong selling pressure. The price has dropped below all three moving averages:
- MA(7): 0.99851
- MA(25): 0.99886
- MA(99): 0.99903
This indicates short-term bearish momentum.
RSI Analysis
The RSI(6) is around 26.46, suggesting that the market is in an oversold condition. A recovery may occur, but traders should wait for confirmation before entering a position.
Important Price Levels
- Support: 0.99833
- Resistance: 0.99852
- Stronger resistance: 0.99886–0.99903
Trading Strategy
{spot}(USD1USDT)
Traders should avoid rushing into buying during strong selling pressure. Watch for a stable price recovery, increased buying volume, and a break above short-term resistance before considering an entry.
Final Thoughts
USD1/USDT is showing short-term bearish signals, while its low RSI suggests possible selling exhaustion. Risk management and confirmation are essential before making any trading decision.
Trade Smart. Stay Patient. Protect Your Capital.
#BinanceRestores28FiatWithdrawals Binance #USD1 #USDT #CryptoAnalysis #TechnicalAnalysis #FATFLaunchesReviewOfCryptoHubsMoneyLaunderingControls TradingStrategy
USD1/USDT Price Analysis: Sellers Take Control as RSI Signals Oversold Conditions
$$USD1 /USDT is currently trading around $0.99840, showing a slight decline of approximately 0.05%.
Market Overview
The 15-minute chart shows strong selling pressure. The price has dropped below all three moving averages:
- MA(7): 0.99851
- MA(25): 0.99886
- MA(99): 0.99903
This indicates short-term bearish momentum.
RSI Analysis
The RSI(6) is around 26.46, suggesting that the market is in an oversold condition. A recovery may occur, but traders should wait for confirmation before entering a position.
Important Price Levels
- Support: 0.99833
- Resistance: 0.99852
- Stronger resistance: 0.99886–0.99903
Trading Strategy
Traders should avoid rushing into buying during strong selling pressure. Watch for a stable price recovery, increased buying volume, and a break above short-term resistance before considering an entry.
Final Thoughts
USD1/USDT is showing short-term bearish signals, while its low RSI suggests possible selling exhaustion. Risk management and confirmation are essential before making any trading decision.
Trade Smart. Stay Patient. Protect Your Capital.
#BinanceRestores28FiatWithdrawals Binance #USD1 #USDT #CryptoAnalysis #TechnicalAnalysis #FATFLaunchesReviewOfCryptoHubsMoneyLaunderingControls TradingStrategy
Market Overview
The 15-minute chart shows strong selling pressure. The price has dropped below all three moving averages:
- MA(7): 0.99851
- MA(25): 0.99886
- MA(99): 0.99903
This indicates short-term bearish momentum.
RSI Analysis
The RSI(6) is around 26.46, suggesting that the market is in an oversold condition. A recovery may occur, but traders should wait for confirmation before entering a position.
Important Price Levels
- Support: 0.99833
- Resistance: 0.99852
- Stronger resistance: 0.99886–0.99903
Trading Strategy
Traders should avoid rushing into buying during strong selling pressure. Watch for a stable price recovery, increased buying volume, and a break above short-term resistance before considering an entry.
Final Thoughts
USD1/USDT is showing short-term bearish signals, while its low RSI suggests possible selling exhaustion. Risk management and confirmation are essential before making any trading decision.
Trade Smart. Stay Patient. Protect Your Capital.
#BinanceRestores28FiatWithdrawals Binance #USD1 #USDT #CryptoAnalysis #TechnicalAnalysis #FATFLaunchesReviewOfCryptoHubsMoneyLaunderingControls TradingStrategy
1
252

·
--
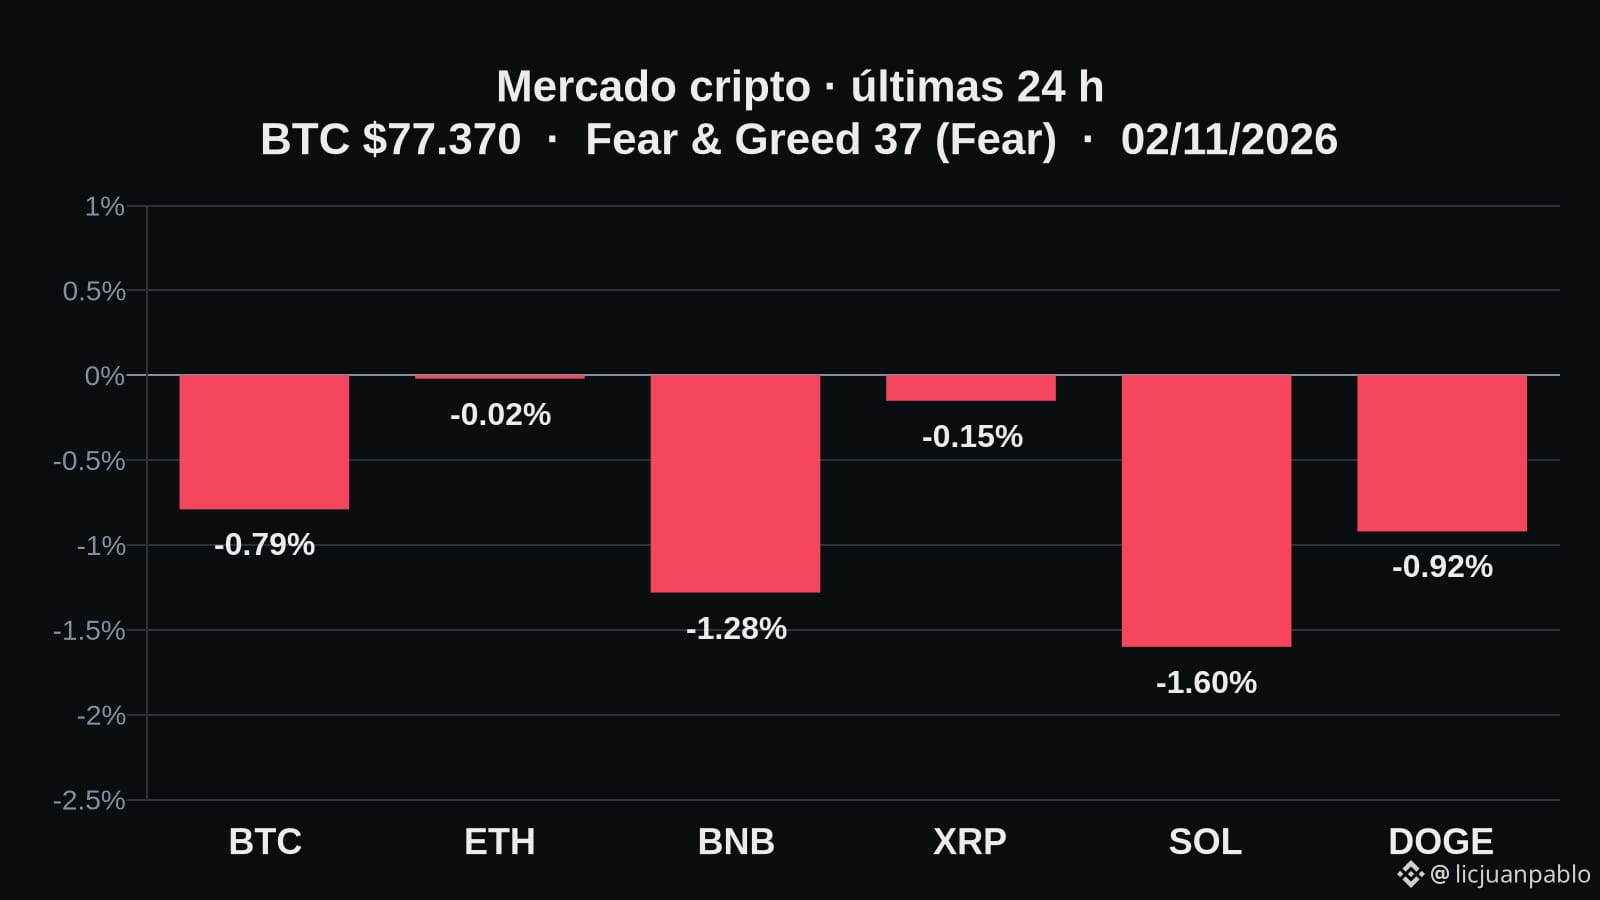
Did you know that $SOL fell 1.60 % in 24 h and is down -8.52 % over the past week? By contrast, $BTC barely lost 0.79 % in 24 h and is down -3.59 % in 7 d. That differential suggests that the pressure is concentrated in Solana, perhaps due to lower development activity or liquidity. How are you interpreting this for your network monitoring?
#FATFLaunchesReviewOfCryptoHubsMoneyLaunderingControls #Bitcoin
Did you know that $SOL fell 1.60 % in 24 h and is down -8.52 % over the past week? By contrast, $BTC barely lost 0.79 % in 24 h and is down -3.59 % in 7 d. That differential suggests that the pressure is concentrated in Solana, perhaps due to lower development activity or liquidity. How are you interpreting this for your network monitoring?
#FATFLaunchesReviewOfCryptoHubsMoneyLaunderingControls #Bitcoin
#FATFLaunchesReviewOfCryptoHubsMoneyLaunderingControls #Bitcoin
108

·
--
Bullish
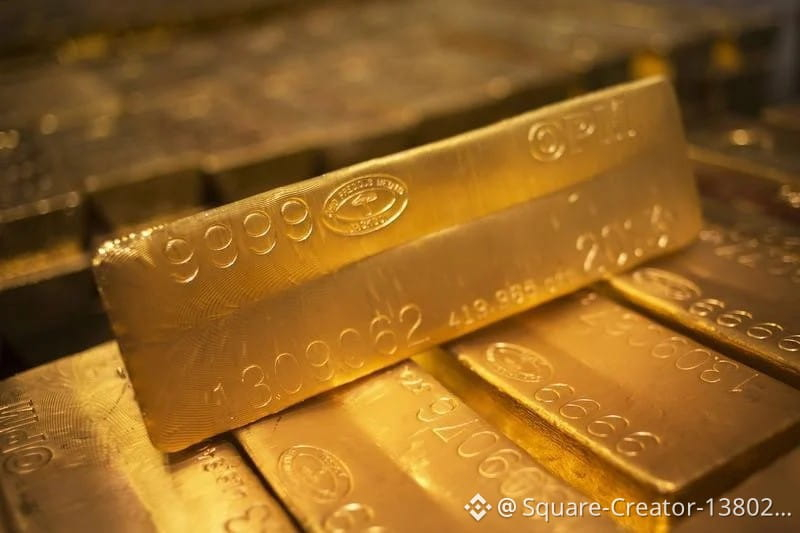
$TRUMP Gold price now | Gold news today:
Gold rises... Is the rebound a trap?
Breaking | Update 5:04 PM (Monday, November 2): Gold jumps 1.72% to $3,942.03 (day range $3,875.55–$3,950.50) after rebounding from a 52-week low of $3,870.17, and tests the broken $3,944–$3,976 floor as oil falls nearly 4%. WarrenAI analysis (5:05 PM) says the breakdown remains intact and that gold staying below $3,976 supports further declines, while a move back above it could turn the setup into a bear trap; support is at $3,820–$3,872. Traders await the ISM index (6:00 PM) and tomorrow’s midterm elections. Read the details in our breaking report: “Breaking: Gold jumps 1.72% to $3,942 and tests the broken $3,944 floor... Bear trap or rebound?”
{future}(TRUMPUSDT)
$XAU
{future}(XAUUSDT)
$XAG
{future}(XAGUSDT)
#USOctoberNFP-AreRateCutsStillPossible #AppleEarningsAhead-CanStockHitNewHigh #BinanceRestores28FiatWithdrawals #FATFLaunchesReviewOfCryptoHubsMoneyLaunderingControls #BinanceProcesses$4.65BWithdrawals
$TRUMP Gold price now | Gold news today:
Gold rises... Is the rebound a trap?
Breaking | Update 5:04 PM (Monday, November 2): Gold jumps 1.72% to $3,942.03 (day range $3,875.55–$3,950.50) after rebounding from a 52-week low of $3,870.17, and tests the broken $3,944–$3,976 floor as oil falls nearly 4%. WarrenAI analysis (5:05 PM) says the breakdown remains intact and that gold staying below $3,976 supports further declines, while a move back above it could turn the setup into a bear trap; support is at $3,820–$3,872. Traders await the ISM index (6:00 PM) and tomorrow’s midterm elections. Read the details in our breaking report: “Breaking: Gold jumps 1.72% to $3,942 and tests the broken $3,944 floor... Bear trap or rebound?”
$XAU
$XAG
#USOctoberNFP-AreRateCutsStillPossible #AppleEarningsAhead-CanStockHitNewHigh #BinanceRestores28FiatWithdrawals #FATFLaunchesReviewOfCryptoHubsMoneyLaunderingControls #BinanceProcesses$4.65BWithdrawals
Gold rises... Is the rebound a trap?
Breaking | Update 5:04 PM (Monday, November 2): Gold jumps 1.72% to $3,942.03 (day range $3,875.55–$3,950.50) after rebounding from a 52-week low of $3,870.17, and tests the broken $3,944–$3,976 floor as oil falls nearly 4%. WarrenAI analysis (5:05 PM) says the breakdown remains intact and that gold staying below $3,976 supports further declines, while a move back above it could turn the setup into a bear trap; support is at $3,820–$3,872. Traders await the ISM index (6:00 PM) and tomorrow’s midterm elections. Read the details in our breaking report: “Breaking: Gold jumps 1.72% to $3,942 and tests the broken $3,944 floor... Bear trap or rebound?”
$XAU
$XAG
#USOctoberNFP-AreRateCutsStillPossible #AppleEarningsAhead-CanStockHitNewHigh #BinanceRestores28FiatWithdrawals #FATFLaunchesReviewOfCryptoHubsMoneyLaunderingControls #BinanceProcesses$4.65BWithdrawals
2
156
Log in to explore more content
Join global crypto users on Binance Square
⚡️ Get latest and useful information about crypto.
💬 Trusted by the world’s largest crypto exchange.
👍 Discover real insights from verified creators.
Email / Phone number
Trending Topics
1
#BinanceWithdrawalScamWarning
30,934 views
589 Discussing
2
#USMidtermElections
590,303 views
3,162 Discussing
3
#USOctoberNFP-AreRateCutsStillPossible
39,954 views
495 Discussing
4
#AppleEarningsAhead-CanStockHitNewHigh
15,199 views
360 Discussing
5
#Verify1to1BinanceReserves
33,088 views
389 Discussing
6
#BinanceRestores28FiatWithdrawals
142,673 views
1,021 Discussing
7
#StrategyRepurchases$208MSTRCAdds811Bitcoin
6,634 views
17 Discussing
8
#FATFLaunchesReviewOfCryptoHubsMoneyLaunderingControls
619 views
14 Discussing
9
#BinanceProcesses$4.65BWithdrawals
112,718 views
367 Discussing
10
#HKMALaunchesSAGEAgenticFinanceProject
3,776 views
177 Discussing