
#ethusdt
ethusdt
6.6M views
15,813 Discussing
Hot
Latest

·
--
$ETH is back above $2,435 after defending $2,174 — but this is a vertical pump, not a safe breakout yet.
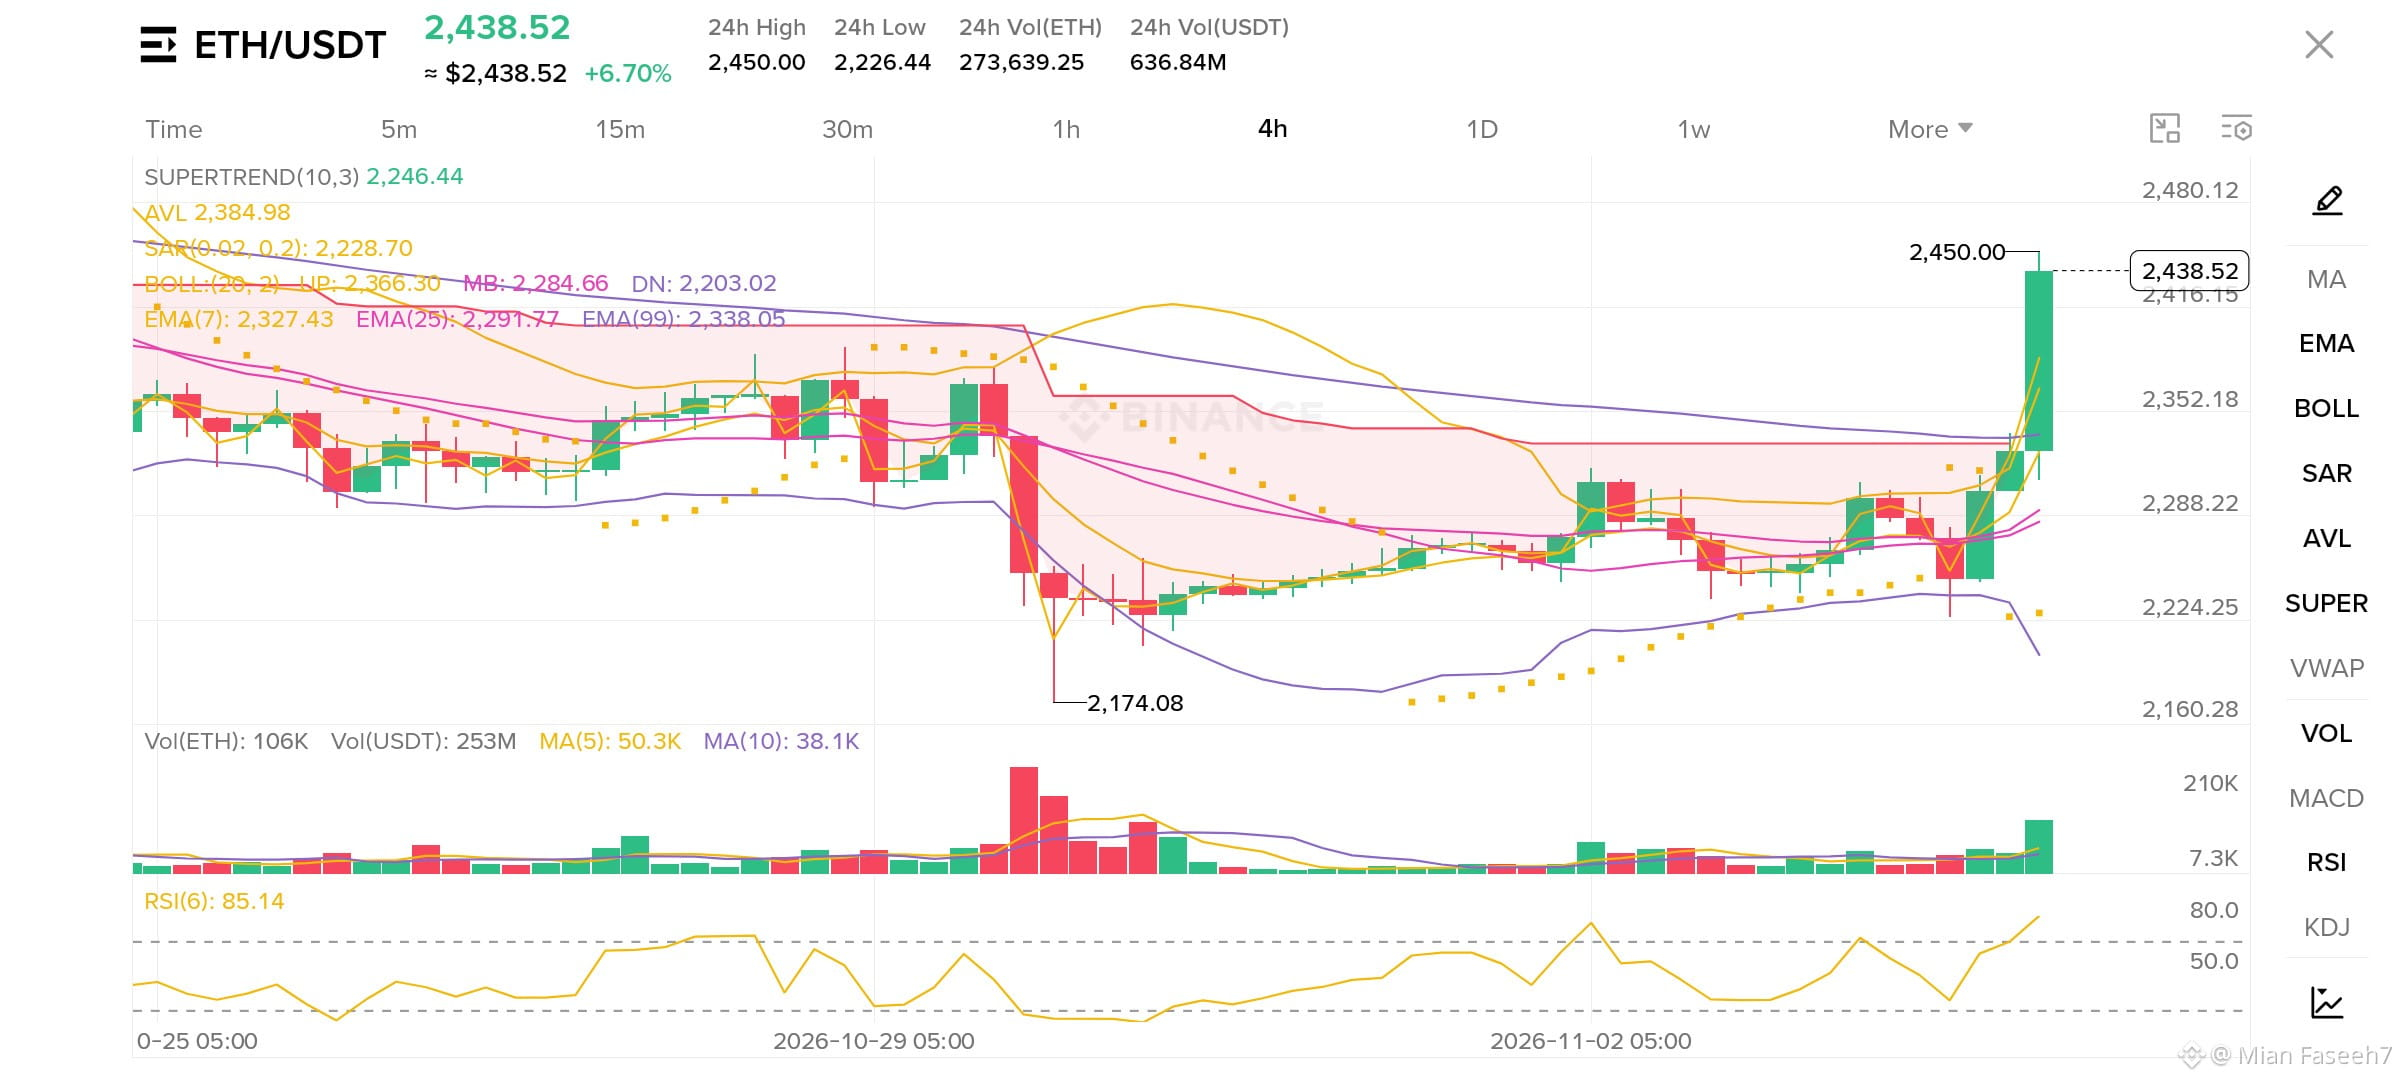
On the 4H chart price is now trading above ALL major EMAs - EMA 7 at $2,327, EMA 25 at $2,291 and EMA 99 at $2,338, which is keeping the structure strongly bullish. Supertrend is now green below at $2,246 and SAR dots are flipping under price, showing buyers are in full control. BOLL has expanded after the breakout, price is even above the Upper Band at $2,360, so momentum is very strong but also stretched.
RSI is at 85 — heavily overbought. That means a short-term pullback / cool-off is very possible. Chasing here is risky. Volume today is around $636M, much better than before, this pump has real buying behind it, but after a +6.53% move in one day, a healthy retest is normal.
*Levels to watch:*
Immediate Resistance: $2,450
Major Resistance: $2,480
Immediate Support: $2,360 / $2,338
Major Support: $2,284 / $2,174
{spot}(ETHUSDT)
*Scenario:*
If $ETH holds above $2,360 and closes 4H above $2,450 with volume, next target is $2,480 - $2,550. If it rejects from $2,450 and loses $2,360, we will likely retest $2,284 again. I am not chasing this green candle, I am waiting for a retest of $2,360.
Are you buying this pump or waiting for the $2,360 retest?
Follow for real-time updates, no fake signals.
If this analysis helped you, a small Tip is appreciated 🙏
#ETH #Ethereum #CryptoTrading #ETHUSDT
$ETH is back above $2,435 after defending $2,174 — but this is a vertical pump, not a safe breakout yet.
On the 4H chart price is now trading above ALL major EMAs - EMA 7 at $2,327, EMA 25 at $2,291 and EMA 99 at $2,338, which is keeping the structure strongly bullish. Supertrend is now green below at $2,246 and SAR dots are flipping under price, showing buyers are in full control. BOLL has expanded after the breakout, price is even above the Upper Band at $2,360, so momentum is very strong but also stretched.
RSI is at 85 — heavily overbought. That means a short-term pullback / cool-off is very possible. Chasing here is risky. Volume today is around $636M, much better than before, this pump has real buying behind it, but after a +6.53% move in one day, a healthy retest is normal.
*Levels to watch:*
Immediate Resistance: $2,450
Major Resistance: $2,480
Immediate Support: $2,360 / $2,338
Major Support: $2,284 / $2,174
*Scenario:*
If $ETH holds above $2,360 and closes 4H above $2,450 with volume, next target is $2,480 - $2,550. If it rejects from $2,450 and loses $2,360, we will likely retest $2,284 again. I am not chasing this green candle, I am waiting for a retest of $2,360.
Are you buying this pump or waiting for the $2,360 retest?
Follow for real-time updates, no fake signals.
If this analysis helped you, a small Tip is appreciated 🙏
#ETH #Ethereum #CryptoTrading #ETHUSDT
On the 4H chart price is now trading above ALL major EMAs - EMA 7 at $2,327, EMA 25 at $2,291 and EMA 99 at $2,338, which is keeping the structure strongly bullish. Supertrend is now green below at $2,246 and SAR dots are flipping under price, showing buyers are in full control. BOLL has expanded after the breakout, price is even above the Upper Band at $2,360, so momentum is very strong but also stretched.
RSI is at 85 — heavily overbought. That means a short-term pullback / cool-off is very possible. Chasing here is risky. Volume today is around $636M, much better than before, this pump has real buying behind it, but after a +6.53% move in one day, a healthy retest is normal.
*Levels to watch:*
Immediate Resistance: $2,450
Major Resistance: $2,480
Immediate Support: $2,360 / $2,338
Major Support: $2,284 / $2,174
*Scenario:*
If $ETH holds above $2,360 and closes 4H above $2,450 with volume, next target is $2,480 - $2,550. If it rejects from $2,450 and loses $2,360, we will likely retest $2,284 again. I am not chasing this green candle, I am waiting for a retest of $2,360.
Are you buying this pump or waiting for the $2,360 retest?
Follow for real-time updates, no fake signals.
If this analysis helped you, a small Tip is appreciated 🙏
#ETH #Ethereum #CryptoTrading #ETHUSDT
109


·
--
Bullish
🚀 Huge reversal loading on $ETH ! 💎
📍 Trade Setup:
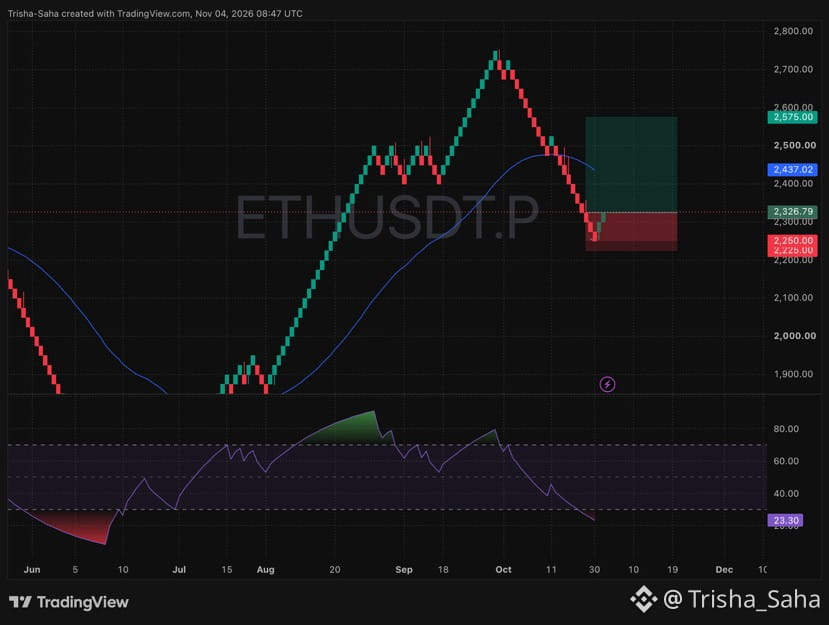
• Entry Zone: $2,300 – $2,326
• Stop Loss: $2,225
• Target: $2,575
⚡️ Chart Analysis :
• Price finding solid support at the lows with buyers stepping back in.
• Bullish momentum picking up speed after a sharp pullback.
Protect your capital like a pro—shift your Stop Loss to Break-Even the second we lock in +3% to +4% profit! 🛡️
I'm already in. Are you riding this pump? Drop a comment below! 👇
#ETH #ETHUSDT #Crypto #Trading
{future}(ETHUSDT)
🚀 Huge reversal loading on $ETH ! 💎
📍 Trade Setup:
• Entry Zone: $2,300 – $2,326
• Stop Loss: $2,225
• Target: $2,575
⚡️ Chart Analysis :
• Price finding solid support at the lows with buyers stepping back in.
• Bullish momentum picking up speed after a sharp pullback.
Protect your capital like a pro—shift your Stop Loss to Break-Even the second we lock in +3% to +4% profit! 🛡️
I'm already in. Are you riding this pump? Drop a comment below! 👇
#ETH #ETHUSDT #Crypto #Trading
📍 Trade Setup:
• Entry Zone: $2,300 – $2,326
• Stop Loss: $2,225
• Target: $2,575
⚡️ Chart Analysis :
• Price finding solid support at the lows with buyers stepping back in.
• Bullish momentum picking up speed after a sharp pullback.
Protect your capital like a pro—shift your Stop Loss to Break-Even the second we lock in +3% to +4% profit! 🛡️
I'm already in. Are you riding this pump? Drop a comment below! 👇
#ETH #ETHUSDT #Crypto #Trading
372
·
--
🚀 Ethereum (ETH) – Market Update
Ethereum is showing interesting price action! 📉
Market dips can create opportunities, but smart traders always wait for confirmation before entering a trade.
📊 Watch the key support and resistance levels.
🎯 Stay patient and manage your risk.
💡 Trade with a strategy, not emotions!
What is your prediction for ETH? Bullish 🟢 or Bearish 🔴?
#Ethereum #ETH #BinanceSquare #CryptoTrading #TradingStrategy #CryptoMarket #ETHUSDT
🚀 Ethereum (ETH) – Market Update
Ethereum is showing interesting price action! 📉
Market dips can create opportunities, but smart traders always wait for confirmation before entering a trade.
📊 Watch the key support and resistance levels.
🎯 Stay patient and manage your risk.
💡 Trade with a strategy, not emotions!
What is your prediction for ETH? Bullish 🟢 or Bearish 🔴?
#Ethereum #ETH #BinanceSquare #CryptoTrading #TradingStrategy #CryptoMarket #ETHUSDT
Ethereum is showing interesting price action! 📉
Market dips can create opportunities, but smart traders always wait for confirmation before entering a trade.
📊 Watch the key support and resistance levels.
🎯 Stay patient and manage your risk.
💡 Trade with a strategy, not emotions!
What is your prediction for ETH? Bullish 🟢 or Bearish 🔴?
#Ethereum #ETH #BinanceSquare #CryptoTrading #TradingStrategy #CryptoMarket #ETHUSDT

26

·
--
Bullish
🚀 ETHEREUM IS FINALLY SHOWING SOME SERIOUS STRENGTH! 🔥
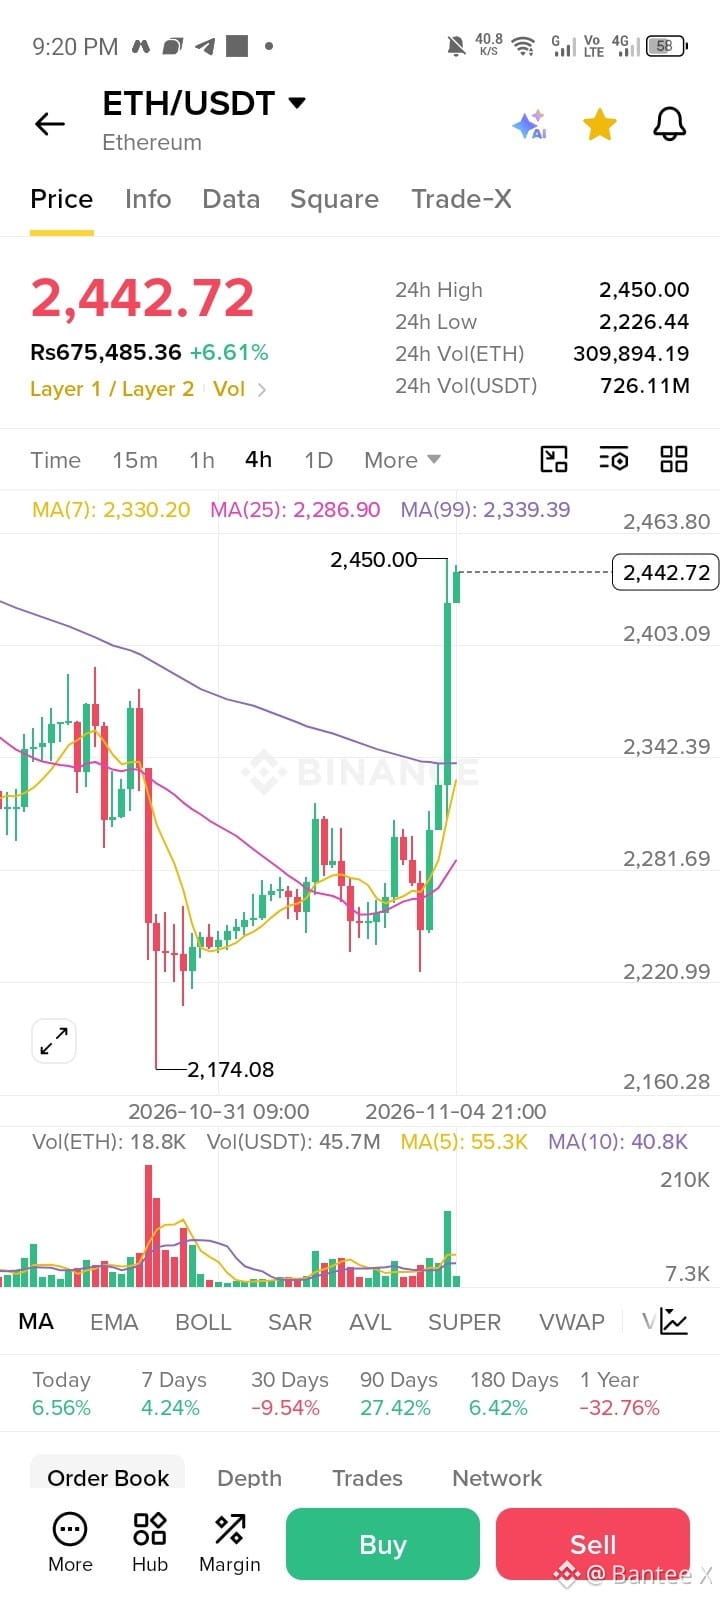
$ETH is making a powerful move, currently trading around $2,450 (+7.47%), with a strong bullish breakout on the 4H chart.
📊 WHAT THE CHART IS TELLING US:
ETH has broken out of its previous consolidation around $2,330 and reclaimed the $2,367 and $2,399 resistance levels.
Buyers are clearly showing strength, and bullish momentum is building.
🎯 KEY LEVELS TO WATCH:
🟢 Immediate support: $2,399
🟢 Major support: $2,367
🔴 Next psychological resistance: $2,480–$2,500
OUR GAME PLAN:
As long as ETH holds above $2,399, the bullish structure remains constructive.
A successful retest with continued buying volume could support another leg higher.
However, after such a sharp rally, a temporary pullback would not be surprising. Avoid chasing the green candle.👇
{spot}(ETHUSDT)
🧠 BANTEEX MARKET VIEW:
The momentum has shifted in favour of buyers. Now we're watching whether ETH can turn the breakout into sustained support.
Let the market confirm. We trade levels, not emotions. 🎯
🔥 Is ETH preparing for another leg up, or will we see a healthy retest first?
#ETH #ETHUSDT #USMidterms-WhatAreMarketsExpecting? #altcoins
🚀 ETHEREUM IS FINALLY SHOWING SOME SERIOUS STRENGTH! 🔥
$ETH is making a powerful move, currently trading around $2,450 (+7.47%), with a strong bullish breakout on the 4H chart.
📊 WHAT THE CHART IS TELLING US:
ETH has broken out of its previous consolidation around $2,330 and reclaimed the $2,367 and $2,399 resistance levels.
Buyers are clearly showing strength, and bullish momentum is building.
🎯 KEY LEVELS TO WATCH:
🟢 Immediate support: $2,399
🟢 Major support: $2,367
🔴 Next psychological resistance: $2,480–$2,500
OUR GAME PLAN:
As long as ETH holds above $2,399, the bullish structure remains constructive.
A successful retest with continued buying volume could support another leg higher.
However, after such a sharp rally, a temporary pullback would not be surprising. Avoid chasing the green candle.👇
🧠 BANTEEX MARKET VIEW:
The momentum has shifted in favour of buyers. Now we're watching whether ETH can turn the breakout into sustained support.
Let the market confirm. We trade levels, not emotions. 🎯
🔥 Is ETH preparing for another leg up, or will we see a healthy retest first?
#ETH #ETHUSDT #USMidterms-WhatAreMarketsExpecting? #altcoins
$ETH is making a powerful move, currently trading around $2,450 (+7.47%), with a strong bullish breakout on the 4H chart.
📊 WHAT THE CHART IS TELLING US:
ETH has broken out of its previous consolidation around $2,330 and reclaimed the $2,367 and $2,399 resistance levels.
Buyers are clearly showing strength, and bullish momentum is building.
🎯 KEY LEVELS TO WATCH:
🟢 Immediate support: $2,399
🟢 Major support: $2,367
🔴 Next psychological resistance: $2,480–$2,500
OUR GAME PLAN:
As long as ETH holds above $2,399, the bullish structure remains constructive.
A successful retest with continued buying volume could support another leg higher.
However, after such a sharp rally, a temporary pullback would not be surprising. Avoid chasing the green candle.👇
🧠 BANTEEX MARKET VIEW:
The momentum has shifted in favour of buyers. Now we're watching whether ETH can turn the breakout into sustained support.
Let the market confirm. We trade levels, not emotions. 🎯
🔥 Is ETH preparing for another leg up, or will we see a healthy retest first?
#ETH #ETHUSDT #USMidterms-WhatAreMarketsExpecting? #altcoins
50

·
--
🔴 $ETH /USDT — SHORT SIGNAL
Trade Plan:
Entry: $2,328 – $2,335
Stop Loss (SL): $2,355
Take Profit (TP):
TP1: $2,310
TP2: $2,290
TP3: $2,265
Trade here $ETH
{future}(ETHUSDT)
Analysis:
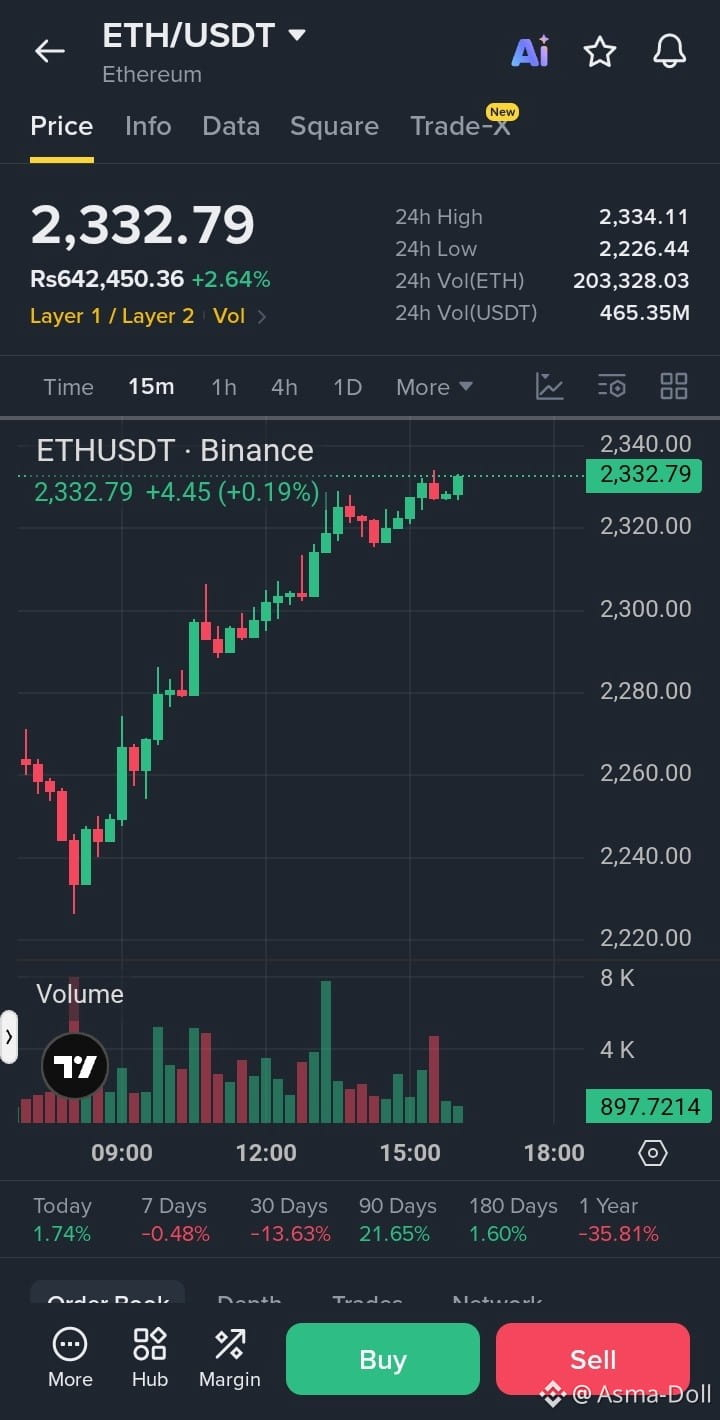
ETH approaching resistance near $2,334–$2,340.
Price showing a strong recovery from $2,226.
30-day performance remains weak at -13.63%.
Sellers may appear near the resistance zone.
Rejection could trigger a pullback toward $2,290.
Confirmation: Wait for a clean 15m candle close below $2,325 with strong selling volume before entering short.
Risk-to-Reward: Approximately 1:1 to 1:2.5.
⚠️ Invalidation: A strong breakout above $2,355 weakens the short setup.
Trade smart! ⚡
#ETH #ETHUSDT #Ethereum #CryptoSignals #BinanceFutures
🔴 $ETH /USDT — SHORT SIGNAL
Trade Plan:
Entry: $2,328 – $2,335
Stop Loss (SL): $2,355
Take Profit (TP):
TP1: $2,310
TP2: $2,290
TP3: $2,265
Trade here $ETH
Analysis:
ETH approaching resistance near $2,334–$2,340.
Price showing a strong recovery from $2,226.
30-day performance remains weak at -13.63%.
Sellers may appear near the resistance zone.
Rejection could trigger a pullback toward $2,290.
Confirmation: Wait for a clean 15m candle close below $2,325 with strong selling volume before entering short.
Risk-to-Reward: Approximately 1:1 to 1:2.5.
⚠️ Invalidation: A strong breakout above $2,355 weakens the short setup.
Trade smart! ⚡
#ETH #ETHUSDT #Ethereum #CryptoSignals #BinanceFutures
Trade Plan:
Entry: $2,328 – $2,335
Stop Loss (SL): $2,355
Take Profit (TP):
TP1: $2,310
TP2: $2,290
TP3: $2,265
Trade here $ETH
Analysis:
ETH approaching resistance near $2,334–$2,340.
Price showing a strong recovery from $2,226.
30-day performance remains weak at -13.63%.
Sellers may appear near the resistance zone.
Rejection could trigger a pullback toward $2,290.
Confirmation: Wait for a clean 15m candle close below $2,325 with strong selling volume before entering short.
Risk-to-Reward: Approximately 1:1 to 1:2.5.
⚠️ Invalidation: A strong breakout above $2,355 weakens the short setup.
Trade smart! ⚡
#ETH #ETHUSDT #Ethereum #CryptoSignals #BinanceFutures
43

Ethereum Pushes Toward $2,330 as Buyers Defend the Overnight Low
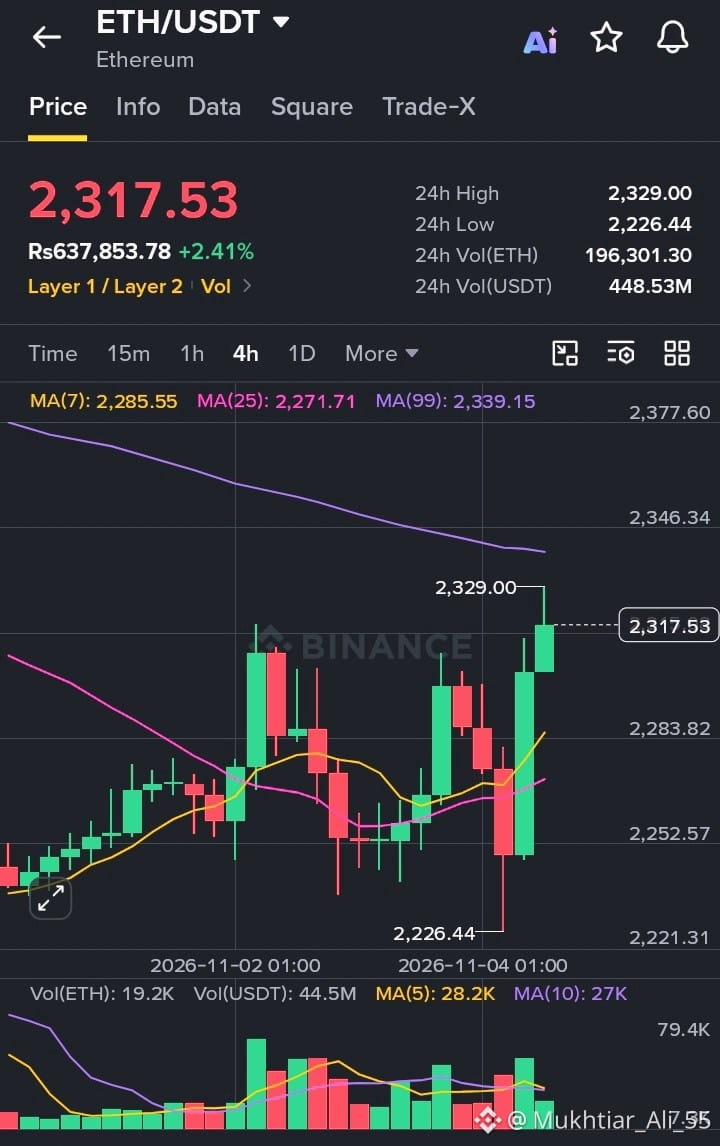
Ethereum is trading at $2,317.53 (about Rs637,854), up 2.41% on the day, and the 4-hour chart is starting to look constructive.
ETH dipped to a 24h low of $2,226.44 earlier in the session, but that sharp wick was bought up quickly. Since then, two strong green 4H candles have pushed price to a 24h high of $2,329.00, and it’s now holding just below that level.
What I’m watching:
Moving averages: MA(7) is at 2,285 and MA(25) at 2,271. Price is now trading above both, and the MA(7) has turned up and crossed above the MA(25), which is an early bullish sign.
Resistance: The MA(99) at 2,339 is still sloping downward and sits right above current price. The $2,346 zone is the next area to clear.
Support: $2,283 to $2,285 is the first level to hold on a pullback, with $2,226 as the key low to protect.
Volume: 24h volume is healthy at 196,301 ETH (about $448.5M). The last candle’s volume is a bit lighter, so I’d like to see participation increase on a breakout.
My take: Ethereum is showing real strength after the overnight flush, but it is pressing right into the MA(99), which has acted as a ceiling. A confirmed 4H close above $2,340 would open the door for a stronger move, while a drop back under $2,283 would suggest this is just another range bounce.
Staying patient and waiting for confirmation beats chasing a move into resistance.
#Ethereum #ETH #CryptoTrading #TechnicalAnalysis #ETHUSDT
$ETH
{spot}(ETHUSDT)
Ethereum Pushes Toward $2,330 as Buyers Defend the Overnight Low
Ethereum is trading at $2,317.53 (about Rs637,854), up 2.41% on the day, and the 4-hour chart is starting to look constructive.
ETH dipped to a 24h low of $2,226.44 earlier in the session, but that sharp wick was bought up quickly. Since then, two strong green 4H candles have pushed price to a 24h high of $2,329.00, and it’s now holding just below that level.
What I’m watching:
Moving averages: MA(7) is at 2,285 and MA(25) at 2,271. Price is now trading above both, and the MA(7) has turned up and crossed above the MA(25), which is an early bullish sign.
Resistance: The MA(99) at 2,339 is still sloping downward and sits right above current price. The $2,346 zone is the next area to clear.
Support: $2,283 to $2,285 is the first level to hold on a pullback, with $2,226 as the key low to protect.
Volume: 24h volume is healthy at 196,301 ETH (about $448.5M). The last candle’s volume is a bit lighter, so I’d like to see participation increase on a breakout.
My take: Ethereum is showing real strength after the overnight flush, but it is pressing right into the MA(99), which has acted as a ceiling. A confirmed 4H close above $2,340 would open the door for a stronger move, while a drop back under $2,283 would suggest this is just another range bounce.
Staying patient and waiting for confirmation beats chasing a move into resistance.
#Ethereum #ETH #CryptoTrading #TechnicalAnalysis #ETHUSDT
$ETH
Ethereum is trading at $2,317.53 (about Rs637,854), up 2.41% on the day, and the 4-hour chart is starting to look constructive.
ETH dipped to a 24h low of $2,226.44 earlier in the session, but that sharp wick was bought up quickly. Since then, two strong green 4H candles have pushed price to a 24h high of $2,329.00, and it’s now holding just below that level.
What I’m watching:
Moving averages: MA(7) is at 2,285 and MA(25) at 2,271. Price is now trading above both, and the MA(7) has turned up and crossed above the MA(25), which is an early bullish sign.
Resistance: The MA(99) at 2,339 is still sloping downward and sits right above current price. The $2,346 zone is the next area to clear.
Support: $2,283 to $2,285 is the first level to hold on a pullback, with $2,226 as the key low to protect.
Volume: 24h volume is healthy at 196,301 ETH (about $448.5M). The last candle’s volume is a bit lighter, so I’d like to see participation increase on a breakout.
My take: Ethereum is showing real strength after the overnight flush, but it is pressing right into the MA(99), which has acted as a ceiling. A confirmed 4H close above $2,340 would open the door for a stronger move, while a drop back under $2,283 would suggest this is just another range bounce.
Staying patient and waiting for confirmation beats chasing a move into resistance.
#Ethereum #ETH #CryptoTrading #TechnicalAnalysis #ETHUSDT
$ETH
50

·
--

Article
Ethereum Update !#ETHUSDT Condition: Ranging!!
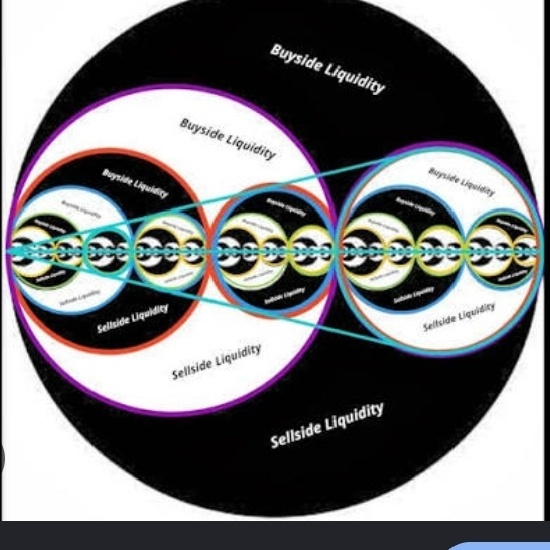
For Me , price is on a ranging phase, thought price can give Bullish move, but not the exact move I wanting. So hands off the chart till now. Though New York session grabbed a lot of liquidity already, we didn't make that Ship to Sail. No worries, we will get opportunities more often till then hands off the chart.
Liquidation Heatmap is the prove that liquidity has taken already but not the way we wanted.
$ETH
{future}(ETHUSDT)
Ethereum Update !
#ETHUSDT Condition: Ranging!!
For Me , price is on a ranging phase, thought price can give Bullish move, but not the exact move I wanting. So hands off the chart till now. Though New York session grabbed a lot of liquidity already, we didn't make that Ship to Sail. No worries, we will get opportunities more often till then hands off the chart.
Liquidation Heatmap is the prove that liquidity has taken already but not the way we wanted.
$ETH
For Me , price is on a ranging phase, thought price can give Bullish move, but not the exact move I wanting. So hands off the chart till now. Though New York session grabbed a lot of liquidity already, we didn't make that Ship to Sail. No worries, we will get opportunities more often till then hands off the chart.
Liquidation Heatmap is the prove that liquidity has taken already but not the way we wanted.
$ETH
175

·
--
Bullish
$ETH Trade Setup
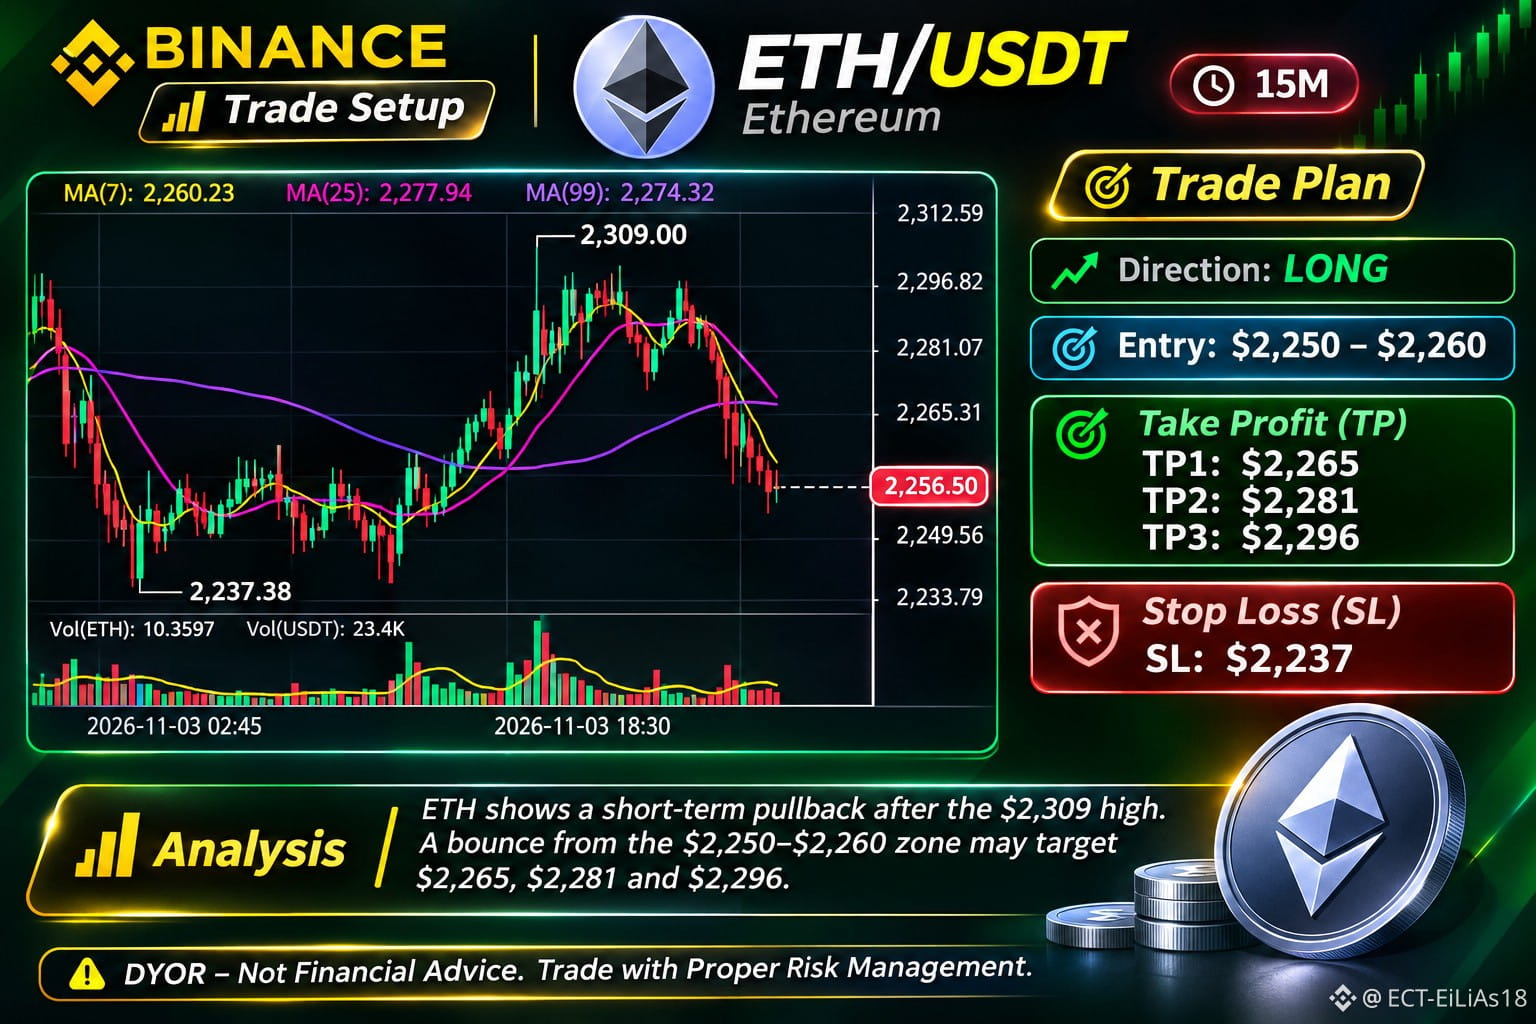
Ethereum is showing a short-term pullback after reaching $2,309. Watching the support zone for a possible bounce. 🚀
🔵 ENTRY: $2,250 – $2,260
🟢 TAKE PROFIT:
TP1: $2,265
TP2: $2,281
TP3: $2,296
🔴 STOP LOSS: $2,237
📈 Wait for confirmation before entering. Manage your risk wisely.
⚠️ DYOR | Not Financial Advice.
#ETH #Ethereum #ETHUSDT #Binance #CryptoTrading
$ETH Trade Setup
Ethereum is showing a short-term pullback after reaching $2,309. Watching the support zone for a possible bounce. 🚀
🔵 ENTRY: $2,250 – $2,260
🟢 TAKE PROFIT:
TP1: $2,265
TP2: $2,281
TP3: $2,296
🔴 STOP LOSS: $2,237
📈 Wait for confirmation before entering. Manage your risk wisely.
⚠️ DYOR | Not Financial Advice.
#ETH #Ethereum #ETHUSDT #Binance #CryptoTrading
Ethereum is showing a short-term pullback after reaching $2,309. Watching the support zone for a possible bounce. 🚀
🔵 ENTRY: $2,250 – $2,260
🟢 TAKE PROFIT:
TP1: $2,265
TP2: $2,281
TP3: $2,296
🔴 STOP LOSS: $2,237
📈 Wait for confirmation before entering. Manage your risk wisely.
⚠️ DYOR | Not Financial Advice.
#ETH #Ethereum #ETHUSDT #Binance #CryptoTrading
121

A 3.0% stop equals about 1.5% of the current price, so 2‑3x leverage keeps risk in line; ETH is stuck below the 1800‑1805 swing high, testing the 1775 support.
🔴 $ETH SHORT 📉 — Trade Plan
• Entry: $2,274.66 – $2,279.22
• Stop: $2,345.25 (-3.0%)
• Target 1: $2,242.79 (+1.5%)
• Target 2: $2,163.09 (+5.0%)
• R/R 1:1.7 | Confidence 65%
The market structure broke lower (CHoCH) and the order block at 1785 aligns with a fair‑value gap, while CVD shows heavy selling pressure confirming the down move. The POI confluence of OB and FVG makes the short entry feel solid.
The 3.0% stop is relatively tight, so 2‑3x leverage is appropriate.
Take half profit around the first target near 1740 before aiming for the final 1.7R level.
Not financial advice — trade only what you can afford to lose 🙏
$ETH #ETHUSDT #THORChain #TradingSignals #Write2Earn
A 3.0% stop equals about 1.5% of the current price, so 2‑3x leverage keeps risk in line; ETH is stuck below the 1800‑1805 swing high, testing the 1775 support.
🔴 $ETH SHORT 📉 — Trade Plan
• Entry: $2,274.66 – $2,279.22
• Stop: $2,345.25 (-3.0%)
• Target 1: $2,242.79 (+1.5%)
• Target 2: $2,163.09 (+5.0%)
• R/R 1:1.7 | Confidence 65%
The market structure broke lower (CHoCH) and the order block at 1785 aligns with a fair‑value gap, while CVD shows heavy selling pressure confirming the down move. The POI confluence of OB and FVG makes the short entry feel solid.
The 3.0% stop is relatively tight, so 2‑3x leverage is appropriate.
Take half profit around the first target near 1740 before aiming for the final 1.7R level.
Not financial advice — trade only what you can afford to lose 🙏
$ETH #ETHUSDT #THORChain #TradingSignals #Write2Earn
🔴 $ETH SHORT 📉 — Trade Plan
• Entry: $2,274.66 – $2,279.22
• Stop: $2,345.25 (-3.0%)
• Target 1: $2,242.79 (+1.5%)
• Target 2: $2,163.09 (+5.0%)
• R/R 1:1.7 | Confidence 65%
The market structure broke lower (CHoCH) and the order block at 1785 aligns with a fair‑value gap, while CVD shows heavy selling pressure confirming the down move. The POI confluence of OB and FVG makes the short entry feel solid.
The 3.0% stop is relatively tight, so 2‑3x leverage is appropriate.
Take half profit around the first target near 1740 before aiming for the final 1.7R level.
Not financial advice — trade only what you can afford to lose 🙏
$ETH #ETHUSDT #THORChain #TradingSignals #Write2Earn
96

·
--
🚨 ETH/USDT PREMIUM ALTCOIN SIGNAL 🚨
🔴 DIRECTION: SHORT
💰 ENTRY ZONE: $2,307 – $2,351
🎯 TAKE PROFIT TARGETS:
🥇 TP1: $2,220
🥈 TP2: $2,175
🥉 TP3: $2,157
🛑 STOP LOSS: $2,420
📊 TECHNICAL ANALYSIS:
✅ Bearish market structure
✅ RSI showing weak momentum
✅ Negative MACD
✅ Strong resistance confluence
✅ Price trading below key moving averages
⚡ ENTRY CONFIRMATION:
Wait for bearish rejection on the 4H chart before entering.
⚠️ Risk management is essential. No guaranteed profits. Always DYOR.
Trade smart. Protect your capital. 📉
#ETH #Ethereum #Binance #AltcoinSignals #cryptotrading #TechnicalAnalysis #ETHUSDT
🚨 ETH/USDT PREMIUM ALTCOIN SIGNAL 🚨
🔴 DIRECTION: SHORT
💰 ENTRY ZONE: $2,307 – $2,351
🎯 TAKE PROFIT TARGETS:
🥇 TP1: $2,220
🥈 TP2: $2,175
🥉 TP3: $2,157
🛑 STOP LOSS: $2,420
📊 TECHNICAL ANALYSIS:
✅ Bearish market structure
✅ RSI showing weak momentum
✅ Negative MACD
✅ Strong resistance confluence
✅ Price trading below key moving averages
⚡ ENTRY CONFIRMATION:
Wait for bearish rejection on the 4H chart before entering.
⚠️ Risk management is essential. No guaranteed profits. Always DYOR.
Trade smart. Protect your capital. 📉
#ETH #Ethereum #Binance #AltcoinSignals #cryptotrading #TechnicalAnalysis #ETHUSDT
🔴 DIRECTION: SHORT
💰 ENTRY ZONE: $2,307 – $2,351
🎯 TAKE PROFIT TARGETS:
🥇 TP1: $2,220
🥈 TP2: $2,175
🥉 TP3: $2,157
🛑 STOP LOSS: $2,420
📊 TECHNICAL ANALYSIS:
✅ Bearish market structure
✅ RSI showing weak momentum
✅ Negative MACD
✅ Strong resistance confluence
✅ Price trading below key moving averages
⚡ ENTRY CONFIRMATION:
Wait for bearish rejection on the 4H chart before entering.
⚠️ Risk management is essential. No guaranteed profits. Always DYOR.
Trade smart. Protect your capital. 📉
#ETH #Ethereum #Binance #AltcoinSignals #cryptotrading #TechnicalAnalysis #ETHUSDT
82

·
--
🔥 ETHEREUM NEAR $2,250 — WILL SUPPORT HOLD?
📊 $ETH /USDT | November 3, 2026
💰 Price: 2,250.70 USDT
📉 24H Change: Approximately −2.45%
📍 Trend: Short-term bearish
🕒 Snapshot: 04:10 UTC
Ethereum remains under selling pressure.
The November 2 completed session closed near $2,253 after trading between approximately $2,237 and $2,318.
The current recovery structure remains weak.
🎯 KEY TECHNICAL LEVELS
🟢 Support: $2,245 | $2,237
🔴 Resistance: $2,265 | $2,318
🔮 24–48H PRICE PREDICTION
🎯 Base case — Cautious bearish outlook
Ethereum may continue consolidating near recent lows while remaining below $2,265.
🚀 Bullish scenario
A sustained breakout above $2,265 could improve momentum.
The November 2 high near $2,318 would become a higher resistance reference.
🐻 Bearish scenario
Losing $2,237 could expose the previously traded $2,174 region.
Invalidation: A sustained recovery above $2,265 would weaken the immediate bearish outlook.
🏦 IMPORTANT MARKET DEVELOPMENT
Binance has scheduled additional withdrawal-service restoration for November 3, including Ethereum-related networks.
This may influence liquidity and exchange confidence.
However, the impact on ETH's price remains uncertain.
💡 TODAY'S TRADING LESSON: UNDERSTAND LIQUIDITY RISK
A technically attractive trade can still be dangerous when market liquidity deteriorates.
During uncertain conditions, large market orders may experience unexpected slippage.
Before entering a position, evaluate the bid-ask spread, order-book depth and your maximum acceptable loss.
{spot}(ETHUSDT)
A correct prediction doesn't guarantee profitable execution.
💬 Can Ethereum reclaim $2,265, or will buyers face another support test?
🔔 Follow for daily Ethereum predictions, technical analysis and practical risk-management education.
⚠️ Educational content only. Cryptocurrency trading involves substantial risk.
#Ethereum #ETHUSDT #CryptoTrading #RiskManagement #BinanceSquare
🔥 ETHEREUM NEAR $2,250 — WILL SUPPORT HOLD?
📊 $ETH /USDT | November 3, 2026
💰 Price: 2,250.70 USDT
📉 24H Change: Approximately −2.45%
📍 Trend: Short-term bearish
🕒 Snapshot: 04:10 UTC
Ethereum remains under selling pressure.
The November 2 completed session closed near $2,253 after trading between approximately $2,237 and $2,318.
The current recovery structure remains weak.
🎯 KEY TECHNICAL LEVELS
🟢 Support: $2,245 | $2,237
🔴 Resistance: $2,265 | $2,318
🔮 24–48H PRICE PREDICTION
🎯 Base case — Cautious bearish outlook
Ethereum may continue consolidating near recent lows while remaining below $2,265.
🚀 Bullish scenario
A sustained breakout above $2,265 could improve momentum.
The November 2 high near $2,318 would become a higher resistance reference.
🐻 Bearish scenario
Losing $2,237 could expose the previously traded $2,174 region.
Invalidation: A sustained recovery above $2,265 would weaken the immediate bearish outlook.
🏦 IMPORTANT MARKET DEVELOPMENT
Binance has scheduled additional withdrawal-service restoration for November 3, including Ethereum-related networks.
This may influence liquidity and exchange confidence.
However, the impact on ETH's price remains uncertain.
💡 TODAY'S TRADING LESSON: UNDERSTAND LIQUIDITY RISK
A technically attractive trade can still be dangerous when market liquidity deteriorates.
During uncertain conditions, large market orders may experience unexpected slippage.
Before entering a position, evaluate the bid-ask spread, order-book depth and your maximum acceptable loss.
A correct prediction doesn't guarantee profitable execution.
💬 Can Ethereum reclaim $2,265, or will buyers face another support test?
🔔 Follow for daily Ethereum predictions, technical analysis and practical risk-management education.
⚠️ Educational content only. Cryptocurrency trading involves substantial risk.
#Ethereum #ETHUSDT #CryptoTrading #RiskManagement #BinanceSquare
📊 $ETH /USDT | November 3, 2026
💰 Price: 2,250.70 USDT
📉 24H Change: Approximately −2.45%
📍 Trend: Short-term bearish
🕒 Snapshot: 04:10 UTC
Ethereum remains under selling pressure.
The November 2 completed session closed near $2,253 after trading between approximately $2,237 and $2,318.
The current recovery structure remains weak.
🎯 KEY TECHNICAL LEVELS
🟢 Support: $2,245 | $2,237
🔴 Resistance: $2,265 | $2,318
🔮 24–48H PRICE PREDICTION
🎯 Base case — Cautious bearish outlook
Ethereum may continue consolidating near recent lows while remaining below $2,265.
🚀 Bullish scenario
A sustained breakout above $2,265 could improve momentum.
The November 2 high near $2,318 would become a higher resistance reference.
🐻 Bearish scenario
Losing $2,237 could expose the previously traded $2,174 region.
Invalidation: A sustained recovery above $2,265 would weaken the immediate bearish outlook.
🏦 IMPORTANT MARKET DEVELOPMENT
Binance has scheduled additional withdrawal-service restoration for November 3, including Ethereum-related networks.
This may influence liquidity and exchange confidence.
However, the impact on ETH's price remains uncertain.
💡 TODAY'S TRADING LESSON: UNDERSTAND LIQUIDITY RISK
A technically attractive trade can still be dangerous when market liquidity deteriorates.
During uncertain conditions, large market orders may experience unexpected slippage.
Before entering a position, evaluate the bid-ask spread, order-book depth and your maximum acceptable loss.
A correct prediction doesn't guarantee profitable execution.
💬 Can Ethereum reclaim $2,265, or will buyers face another support test?
🔔 Follow for daily Ethereum predictions, technical analysis and practical risk-management education.
⚠️ Educational content only. Cryptocurrency trading involves substantial risk.
#Ethereum #ETHUSDT #CryptoTrading #RiskManagement #BinanceSquare
100
·
--
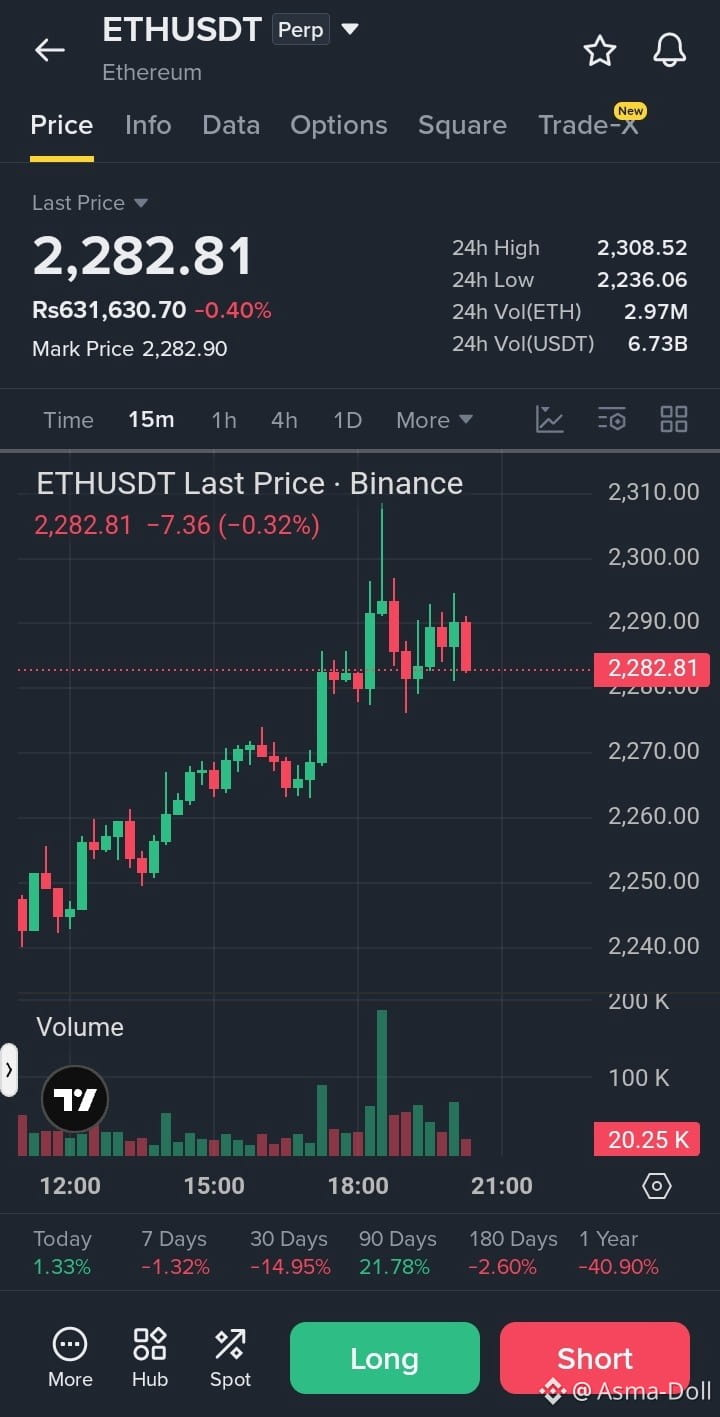
🔴 $ETH /USDT – SHORT SIGNAL
Trade Plan:
Direction: SHORT 📉
Entry: $2,280 – $2,290
Stop Loss (SL): $2,315
Take Profit Targets:
TP1: $2,260
TP2: $2,240
TP3: $2,215
Trade here $ETH
{future}(ETHUSDT)
Analysis:
ETH facing rejection near the $2,308 resistance zone.
Price showing weak momentum around $2,282.
Overall 30-day performance is down 14.95%.
Sellers may push price toward the $2,260 support.
Bearish continuation possible if buyers fail to defend support.
Confirmation:
Breakdown below $2,275 with strong selling volume confirms short momentum.
Avoid entering if ETH strongly reclaims $2,300.
Risk-to-Reward:
TP1: 1:0.57
TP2: 1:1.14
TP3: 1:1.86
⚠️ Invalidation: Exit if price breaks and holds above $2,315. Wait for confirmation; don't chase the move.
#ETHUSDT #Ethereum #ETHShort #CryptoSignals #BinanceFutures
🔴 $ETH /USDT – SHORT SIGNAL
Trade Plan:
Direction: SHORT 📉
Entry: $2,280 – $2,290
Stop Loss (SL): $2,315
Take Profit Targets:
TP1: $2,260
TP2: $2,240
TP3: $2,215
Trade here $ETH
Analysis:
ETH facing rejection near the $2,308 resistance zone.
Price showing weak momentum around $2,282.
Overall 30-day performance is down 14.95%.
Sellers may push price toward the $2,260 support.
Bearish continuation possible if buyers fail to defend support.
Confirmation:
Breakdown below $2,275 with strong selling volume confirms short momentum.
Avoid entering if ETH strongly reclaims $2,300.
Risk-to-Reward:
TP1: 1:0.57
TP2: 1:1.14
TP3: 1:1.86
⚠️ Invalidation: Exit if price breaks and holds above $2,315. Wait for confirmation; don't chase the move.
#ETHUSDT #Ethereum #ETHShort #CryptoSignals #BinanceFutures
Trade Plan:
Direction: SHORT 📉
Entry: $2,280 – $2,290
Stop Loss (SL): $2,315
Take Profit Targets:
TP1: $2,260
TP2: $2,240
TP3: $2,215
Trade here $ETH
Analysis:
ETH facing rejection near the $2,308 resistance zone.
Price showing weak momentum around $2,282.
Overall 30-day performance is down 14.95%.
Sellers may push price toward the $2,260 support.
Bearish continuation possible if buyers fail to defend support.
Confirmation:
Breakdown below $2,275 with strong selling volume confirms short momentum.
Avoid entering if ETH strongly reclaims $2,300.
Risk-to-Reward:
TP1: 1:0.57
TP2: 1:1.14
TP3: 1:1.86
⚠️ Invalidation: Exit if price breaks and holds above $2,315. Wait for confirmation; don't chase the move.
#ETHUSDT #Ethereum #ETHShort #CryptoSignals #BinanceFutures
10

Article
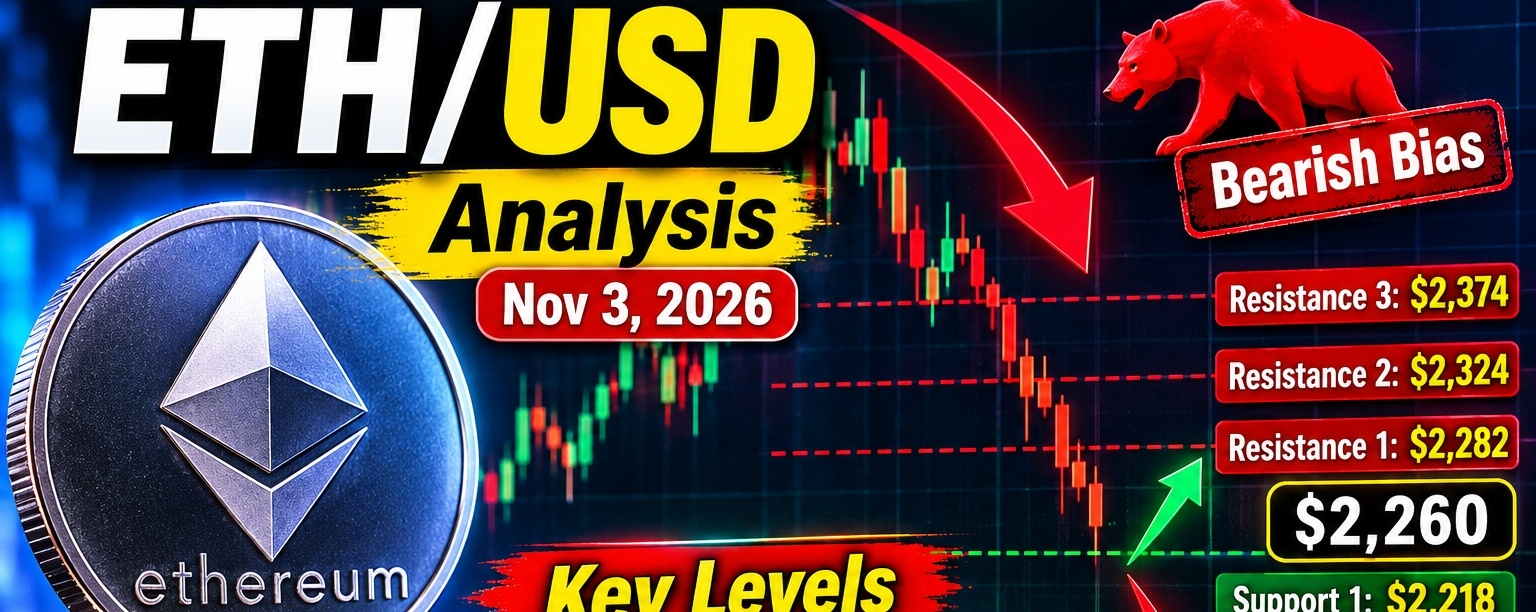
ETH/USD Technical Analysis — November 3, 2026$ETH /USD Technical Analysis — November 3, 2026
{spot}(ETHUSDT)
Ethereum ($ETH ) · Short-term trading outlook · USD

### $2,258–$2,266
Indicative market-price range from recent market data
Bearish bias
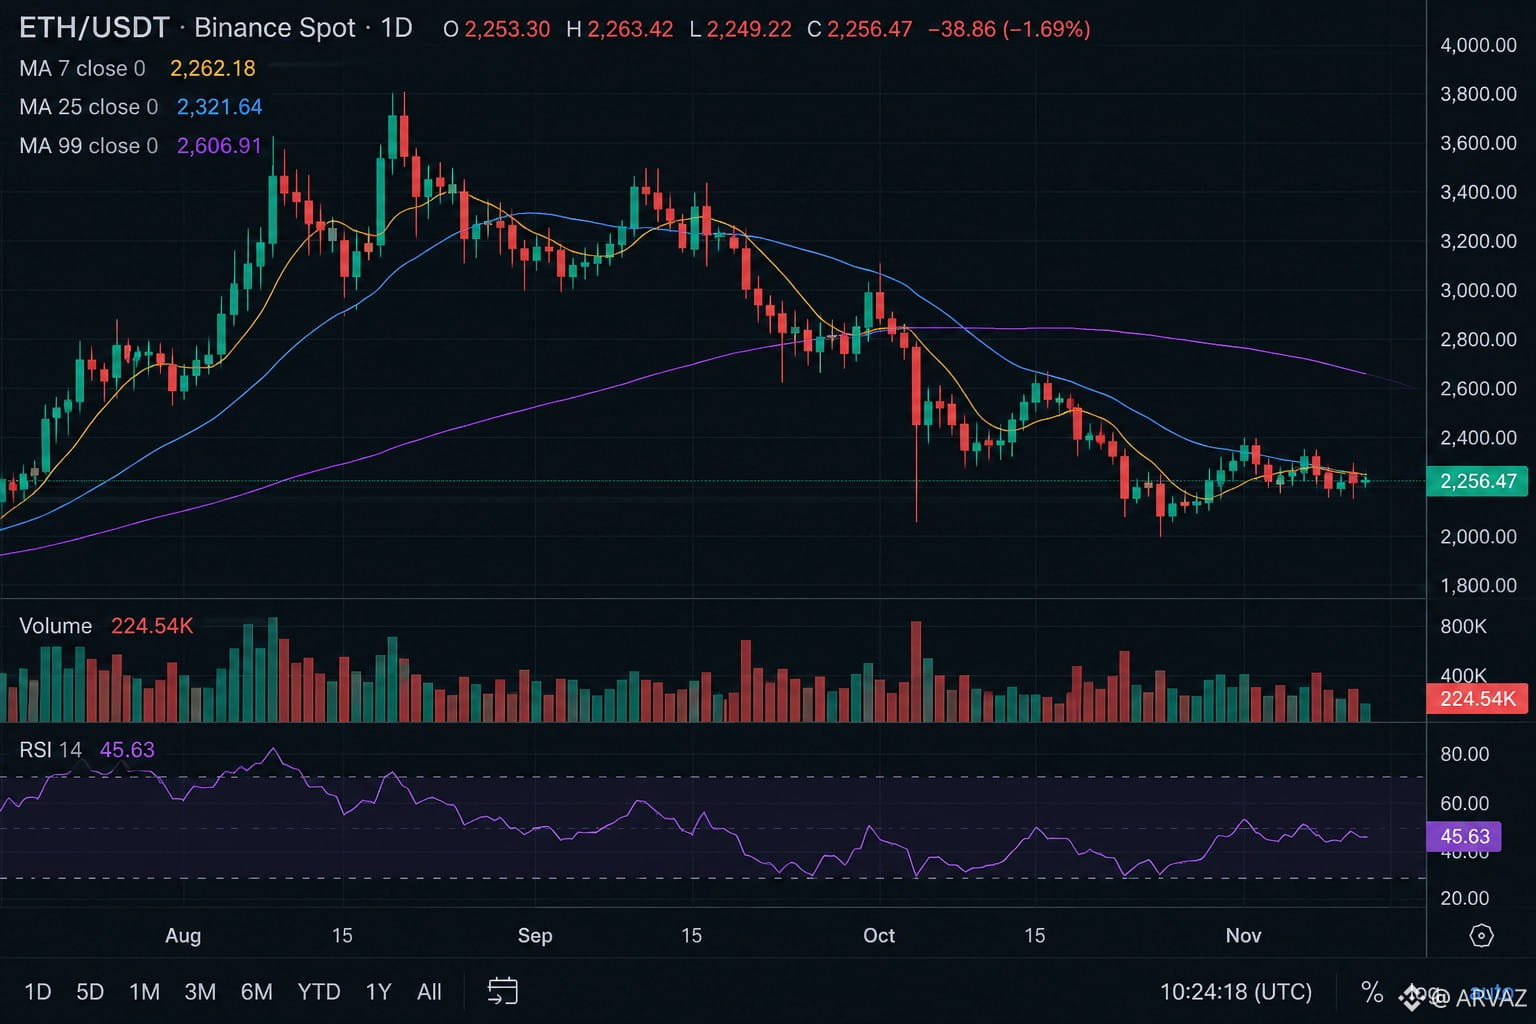
Ethereum is showing a bearish short-term technical structure, although small relief rallies remain possible. Recent market data places ETH around $2,260, with technical indicators leaning bearish and the daily RSI near 35. OHLCX Markets +1
### 1\. Key support and resistance levels
| Level | Price (USD) | Significance |
| ------------------ | ----------- | ----------------------- |
| Resistance 3 | $2,374 | Higher recovery target |
| Resistance 2 | $2,324 | Strong resistance zone |
| Resistance 1 | $2,282 | First bullish test |
| Current price area | $2,260 | Near-term decision zone |
| Support 1 | $2,218 | Important support |
| Support 2 | $2,164 | Next downside target |
| Support 3 | $2,039 | Deeper bearish target |
These are technical reference levels, not guaranteed price targets. COINOTAG +1
### 2\. Technical indicators
* RSI (14): approximately 34.6 — bearish momentum, approaching oversold territory.
* MACD: Below the signal line, indicating downside momentum.
* Moving averages: Most longer-period averages indicate selling pressure.
* Trend strength: The daily trend is bearish, while the broader weekly outlook is more neutral. COINOTAG +2
### 3\. $ETH /USD trading scenarios
Bearish scenario — higher probability for now
If ETH breaks below $2,218 and confirms the breakdown, the next levels to watch are $2,164 and potentially $2,039.
Bullish recovery scenario
If ETH reclaims $2,282 and holds above it, a recovery toward $2,324 and then $2,374 becomes possible.
Sideways scenario
If neither $2,218 support nor $2,282 resistance breaks decisively, ETH could remain range-bound in the near term.
### 4\. Trading plan
| Strategy | Confirmation | Target levels |
| ---------------- | --------------------------- | --------------------- |
| Sell setup | Breakdown below $2,218 | $2,164 → $2,039 |
| Buy setup | Break and hold above $2,282 | $2,324 → $2,374 |
| Wait and observe | Price between key levels | Wait for confirmation |
Use a stop-loss based on your timeframe and risk tolerance. Avoid entering a trade based only on a brief candle breakout.
### 5\. Final outlook
Short-term trend
Bearish
Key support
### $2,218
Key resistance
### $2,282
Bullish confirmation
### Above $2,282
My view: ETH/USD currently favors caution and selling pressure until buyers reclaim the $2,282 resistance zone. A confirmed break below $2,218 would strengthen the bearish case. OHLCX Markets +1
This is technical market analysis, not a guarantee or personalized financial advice.
Cryptocurrency prices can change rapidly, so verify the live chart before trading.
#Ethereum #viralpost #ETHUSDT #TrendingTopic
ETH/USD Technical Analysis — November 3, 2026
$ETH /USD Technical Analysis — November 3, 2026
Ethereum ($ETH ) · Short-term trading outlook · USD

### $2,258–$2,266
Indicative market-price range from recent market data
Bearish bias
Ethereum is showing a bearish short-term technical structure, although small relief rallies remain possible. Recent market data places ETH around $2,260, with technical indicators leaning bearish and the daily RSI near 35. OHLCX Markets +1
### 1\. Key support and resistance levels
| Level | Price (USD) | Significance |
| ------------------ | ----------- | ----------------------- |
| Resistance 3 | $2,374 | Higher recovery target |
| Resistance 2 | $2,324 | Strong resistance zone |
| Resistance 1 | $2,282 | First bullish test |
| Current price area | $2,260 | Near-term decision zone |
| Support 1 | $2,218 | Important support |
| Support 2 | $2,164 | Next downside target |
| Support 3 | $2,039 | Deeper bearish target |
These are technical reference levels, not guaranteed price targets. COINOTAG +1
### 2\. Technical indicators
* RSI (14): approximately 34.6 — bearish momentum, approaching oversold territory.
* MACD: Below the signal line, indicating downside momentum.
* Moving averages: Most longer-period averages indicate selling pressure.
* Trend strength: The daily trend is bearish, while the broader weekly outlook is more neutral. COINOTAG +2
### 3\. $ETH /USD trading scenarios
Bearish scenario — higher probability for now
If ETH breaks below $2,218 and confirms the breakdown, the next levels to watch are $2,164 and potentially $2,039.
Bullish recovery scenario
If ETH reclaims $2,282 and holds above it, a recovery toward $2,324 and then $2,374 becomes possible.
Sideways scenario
If neither $2,218 support nor $2,282 resistance breaks decisively, ETH could remain range-bound in the near term.
### 4\. Trading plan
| Strategy | Confirmation | Target levels |
| ---------------- | --------------------------- | --------------------- |
| Sell setup | Breakdown below $2,218 | $2,164 → $2,039 |
| Buy setup | Break and hold above $2,282 | $2,324 → $2,374 |
| Wait and observe | Price between key levels | Wait for confirmation |
Use a stop-loss based on your timeframe and risk tolerance. Avoid entering a trade based only on a brief candle breakout.
### 5\. Final outlook
Short-term trend
Bearish
Key support
### $2,218
Key resistance
### $2,282
Bullish confirmation
### Above $2,282
My view: ETH/USD currently favors caution and selling pressure until buyers reclaim the $2,282 resistance zone. A confirmed break below $2,218 would strengthen the bearish case. OHLCX Markets +1
This is technical market analysis, not a guarantee or personalized financial advice.
Cryptocurrency prices can change rapidly, so verify the live chart before trading.
#Ethereum #viralpost #ETHUSDT #TrendingTopic
Ethereum ($ETH ) · Short-term trading outlook · USD

### $2,258–$2,266
Indicative market-price range from recent market data
Bearish bias
Ethereum is showing a bearish short-term technical structure, although small relief rallies remain possible. Recent market data places ETH around $2,260, with technical indicators leaning bearish and the daily RSI near 35. OHLCX Markets +1
### 1\. Key support and resistance levels
| Level | Price (USD) | Significance |
| ------------------ | ----------- | ----------------------- |
| Resistance 3 | $2,374 | Higher recovery target |
| Resistance 2 | $2,324 | Strong resistance zone |
| Resistance 1 | $2,282 | First bullish test |
| Current price area | $2,260 | Near-term decision zone |
| Support 1 | $2,218 | Important support |
| Support 2 | $2,164 | Next downside target |
| Support 3 | $2,039 | Deeper bearish target |
These are technical reference levels, not guaranteed price targets. COINOTAG +1
### 2\. Technical indicators
* RSI (14): approximately 34.6 — bearish momentum, approaching oversold territory.
* MACD: Below the signal line, indicating downside momentum.
* Moving averages: Most longer-period averages indicate selling pressure.
* Trend strength: The daily trend is bearish, while the broader weekly outlook is more neutral. COINOTAG +2
### 3\. $ETH /USD trading scenarios
Bearish scenario — higher probability for now
If ETH breaks below $2,218 and confirms the breakdown, the next levels to watch are $2,164 and potentially $2,039.
Bullish recovery scenario
If ETH reclaims $2,282 and holds above it, a recovery toward $2,324 and then $2,374 becomes possible.
Sideways scenario
If neither $2,218 support nor $2,282 resistance breaks decisively, ETH could remain range-bound in the near term.
### 4\. Trading plan
| Strategy | Confirmation | Target levels |
| ---------------- | --------------------------- | --------------------- |
| Sell setup | Breakdown below $2,218 | $2,164 → $2,039 |
| Buy setup | Break and hold above $2,282 | $2,324 → $2,374 |
| Wait and observe | Price between key levels | Wait for confirmation |
Use a stop-loss based on your timeframe and risk tolerance. Avoid entering a trade based only on a brief candle breakout.
### 5\. Final outlook
Short-term trend
Bearish
Key support
### $2,218
Key resistance
### $2,282
Bullish confirmation
### Above $2,282
My view: ETH/USD currently favors caution and selling pressure until buyers reclaim the $2,282 resistance zone. A confirmed break below $2,218 would strengthen the bearish case. OHLCX Markets +1
This is technical market analysis, not a guarantee or personalized financial advice.
Cryptocurrency prices can change rapidly, so verify the live chart before trading.
#Ethereum #viralpost #ETHUSDT #TrendingTopic
54

·
--
🚀 ETHEREUM: IS THE NEXT MOVE UP?
$ETH
{spot}(ETHUSDT)
Ethereum is showing positive momentum, with approximately $11.46 BILLION in 24H trading volume! 🔥
📊 Market Snapshot
• Current Price: $2,249.55
• 24H Change: +0.5%
• 7D Change: +3.0%
• 24H Volume: $11.46B
📈 My Technical Outlook
ETH is showing signs of strength, but traders should watch for confirmation before entering a position.
🟢 Bulls need to maintain buying pressure.
🔴 Bears will look for a breakdown of short-term support.
👀 Volume confirmation will be important for the next move.
My question: Will ETH reclaim stronger bullish momentum, or are we heading for another correction?
Drop your ETH prediction below! 👇
#Ethereum #ETH #CryptoAnalysis #BinanceSquare #TechnicalAnalysis #CryptoTrading #Altcoins #ETHUSDT
🚀 ETHEREUM: IS THE NEXT MOVE UP?
$ETH
Ethereum is showing positive momentum, with approximately $11.46 BILLION in 24H trading volume! 🔥
📊 Market Snapshot
• Current Price: $2,249.55
• 24H Change: +0.5%
• 7D Change: +3.0%
• 24H Volume: $11.46B
📈 My Technical Outlook
ETH is showing signs of strength, but traders should watch for confirmation before entering a position.
🟢 Bulls need to maintain buying pressure.
🔴 Bears will look for a breakdown of short-term support.
👀 Volume confirmation will be important for the next move.
My question: Will ETH reclaim stronger bullish momentum, or are we heading for another correction?
Drop your ETH prediction below! 👇
#Ethereum #ETH #CryptoAnalysis #BinanceSquare #TechnicalAnalysis #CryptoTrading #Altcoins #ETHUSDT
$ETH
Ethereum is showing positive momentum, with approximately $11.46 BILLION in 24H trading volume! 🔥
📊 Market Snapshot
• Current Price: $2,249.55
• 24H Change: +0.5%
• 7D Change: +3.0%
• 24H Volume: $11.46B
📈 My Technical Outlook
ETH is showing signs of strength, but traders should watch for confirmation before entering a position.
🟢 Bulls need to maintain buying pressure.
🔴 Bears will look for a breakdown of short-term support.
👀 Volume confirmation will be important for the next move.
My question: Will ETH reclaim stronger bullish momentum, or are we heading for another correction?
Drop your ETH prediction below! 👇
#Ethereum #ETH #CryptoAnalysis #BinanceSquare #TechnicalAnalysis #CryptoTrading #Altcoins #ETHUSDT
69

·
--
🚨 ETHUSDT looking bearish! Current price $2259.19 is below SMA and sitting in the Discount Zone. Is this the dip you've been waiting for? 📉 With support at $2234.58 and resistance at $2317.59, the setup is primed for a short play. Risk/Reward 1:1.5 – manage your risk wisely! What's your move? Drop your thoughts below! #Crypto #Binance #ETHUSDT #Trading
🔔 Don't forget to follow for more updates! & Your Mr Zero
⚠️ Not financial advice - always DYOR.
Click Here To Trade 👇
🚨 ETHUSDT looking bearish! Current price $2259.19 is below SMA and sitting in the Discount Zone. Is this the dip you've been waiting for? 📉 With support at $2234.58 and resistance at $2317.59, the setup is primed for a short play. Risk/Reward 1:1.5 – manage your risk wisely! What's your move? Drop your thoughts below! #Crypto #Binance #ETHUSDT #Trading
🔔 Don't forget to follow for more updates! & Your Mr Zero
⚠️ Not financial advice - always DYOR.
Click Here To Trade 👇
🔔 Don't forget to follow for more updates! & Your Mr Zero
⚠️ Not financial advice - always DYOR.
Click Here To Trade 👇
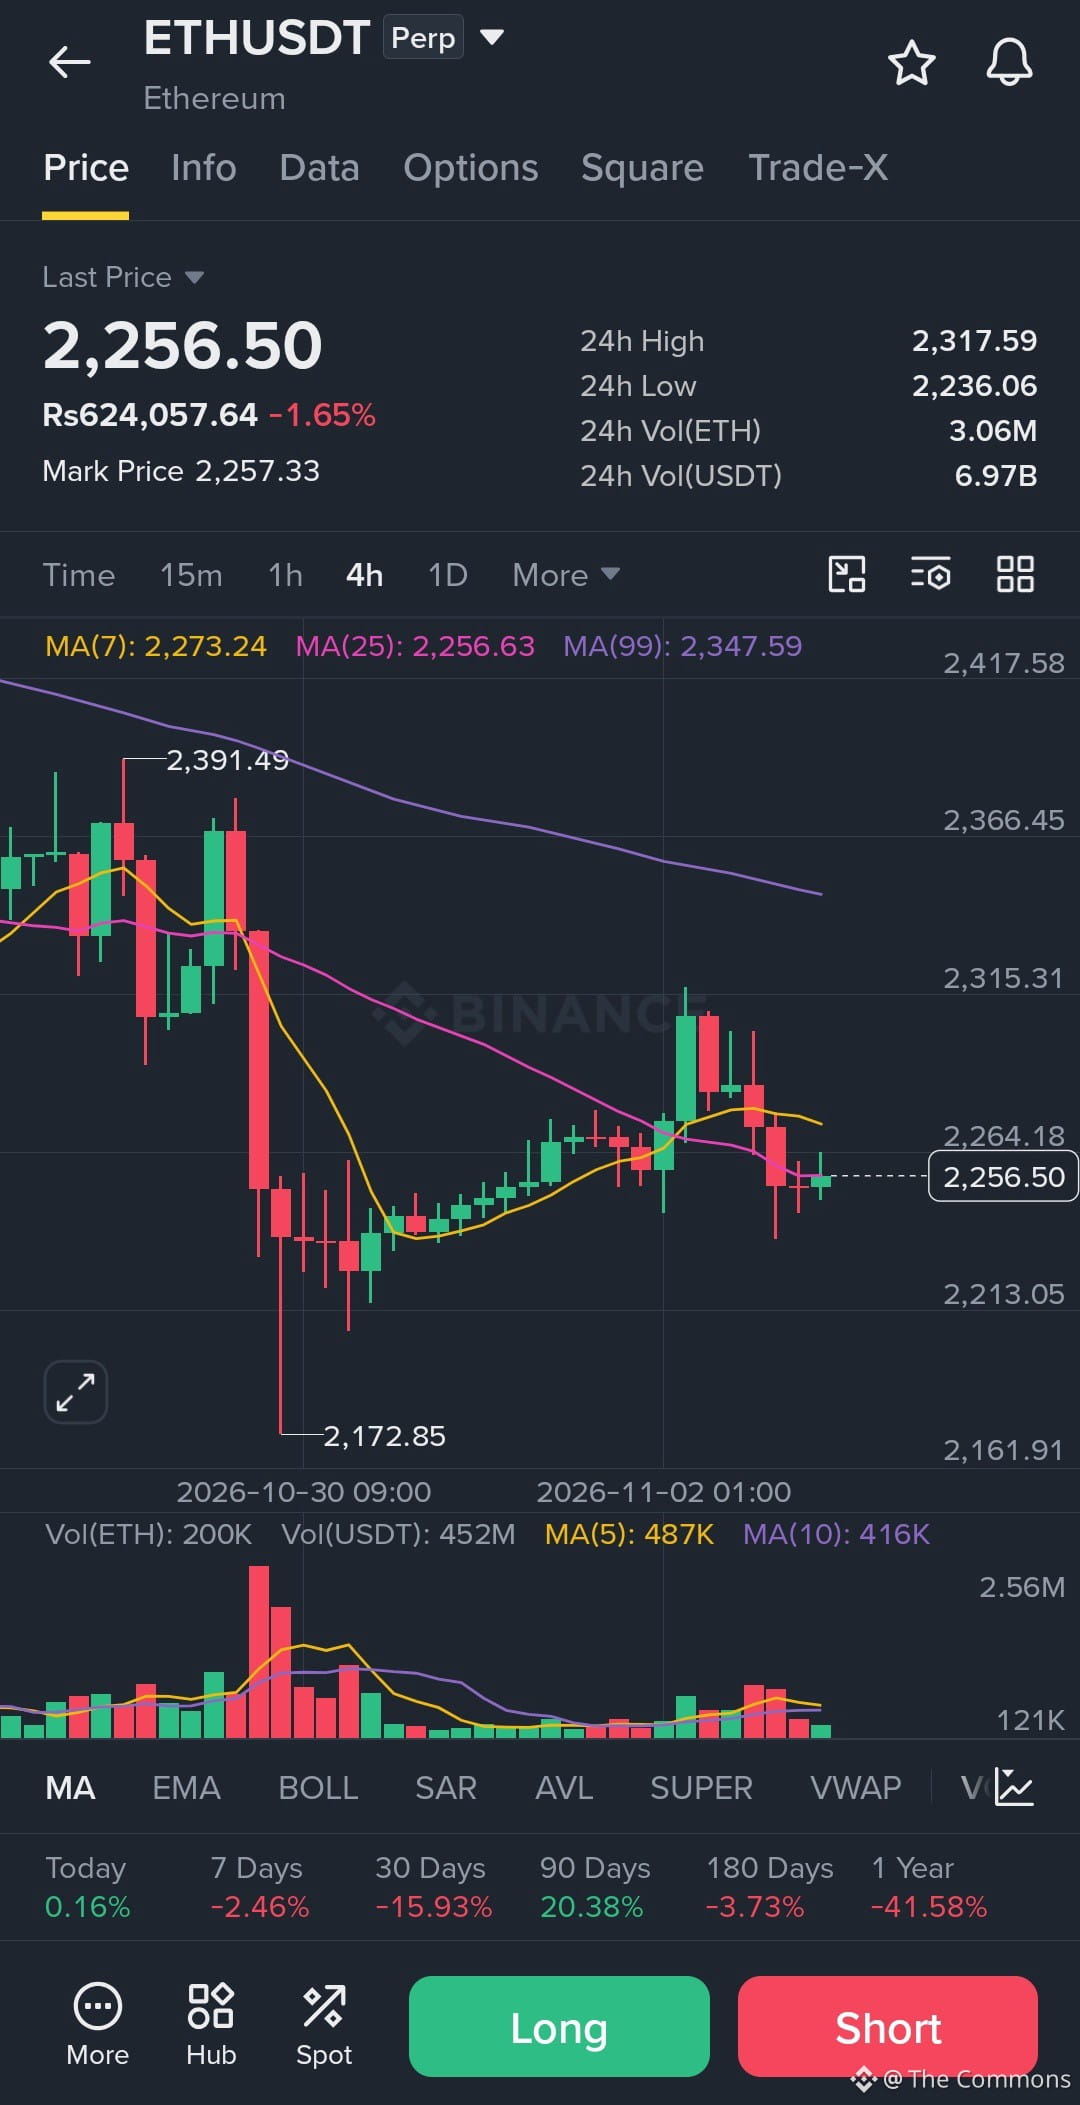
69
ETH is grinding lower, testing the 1,800 zone hard. Every candle’s trying to break the down‑trend line.
🔴 $ETH SHORT 📉
Entry $2,249.30-$2,253.80 | SL $2,319.10 (-3.0%) | TP1 $2,217.78 (+1.5%) | TP2 $2,138.97 (+5.0%) | R/R 1:1.7 | Conf 64%
The market just flipped the structure with a clean CHoCH, and the CVD turned bearish confirming the move. I see a fresh order block sitting right on a fair‑value gap, and the liquidity sweep knocked out the last short‑side liquidity. The POI confluence of the OB and FVG gives extra ammo for the short.
A 3.0 % stop is a bit tight for this swing, so stick to 2‑3× leverage.
Take half profit around the first target as it hits the next resistance.
Not financial advice — always manage your own risk 🙏
$ETH #ETHUSDT #THORChain #TradingSignals #Write2Earn
ETH is grinding lower, testing the 1,800 zone hard. Every candle’s trying to break the down‑trend line.
🔴 $ETH SHORT 📉
Entry $2,249.30-$2,253.80 | SL $2,319.10 (-3.0%) | TP1 $2,217.78 (+1.5%) | TP2 $2,138.97 (+5.0%) | R/R 1:1.7 | Conf 64%
The market just flipped the structure with a clean CHoCH, and the CVD turned bearish confirming the move. I see a fresh order block sitting right on a fair‑value gap, and the liquidity sweep knocked out the last short‑side liquidity. The POI confluence of the OB and FVG gives extra ammo for the short.
A 3.0 % stop is a bit tight for this swing, so stick to 2‑3× leverage.
Take half profit around the first target as it hits the next resistance.
Not financial advice — always manage your own risk 🙏
$ETH #ETHUSDT #THORChain #TradingSignals #Write2Earn
🔴 $ETH SHORT 📉
Entry $2,249.30-$2,253.80 | SL $2,319.10 (-3.0%) | TP1 $2,217.78 (+1.5%) | TP2 $2,138.97 (+5.0%) | R/R 1:1.7 | Conf 64%
The market just flipped the structure with a clean CHoCH, and the CVD turned bearish confirming the move. I see a fresh order block sitting right on a fair‑value gap, and the liquidity sweep knocked out the last short‑side liquidity. The POI confluence of the OB and FVG gives extra ammo for the short.
A 3.0 % stop is a bit tight for this swing, so stick to 2‑3× leverage.
Take half profit around the first target as it hits the next resistance.
Not financial advice — always manage your own risk 🙏
$ETH #ETHUSDT #THORChain #TradingSignals #Write2Earn
8


·
--
Bullish
$ETH
{future}(ETHUSDT)
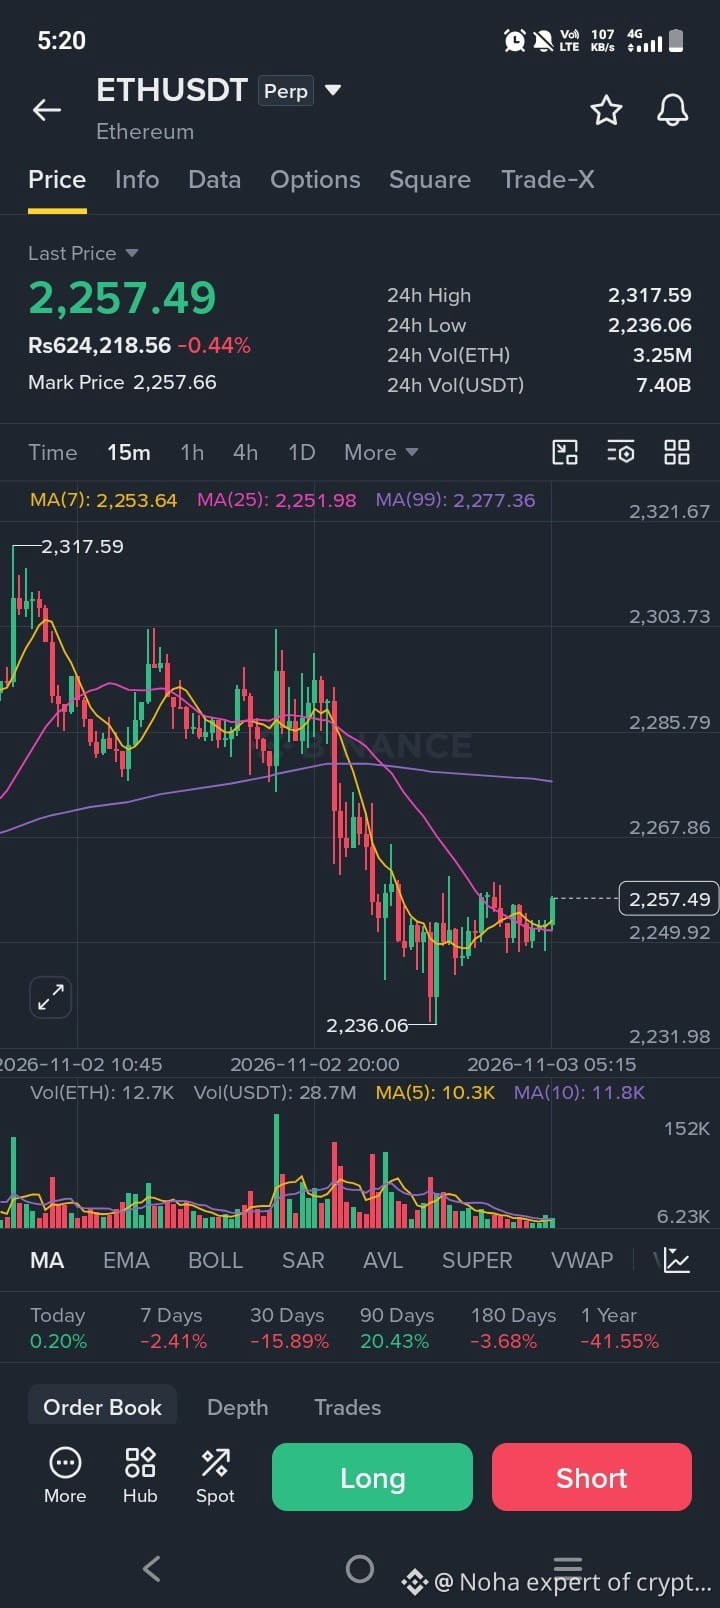
📊 #ETH/USDT Perp SIGNAL (15m)
🟢 LONG Entry: 2252 – 2258
(above MA7 and MA25)
🎯 Targets:
TP1: 2268
TP2: 2278
TP3: 2290
TP4: 2305
🛑 Stop Loss: 2238
⚠️ DYOR. Not financial advice.
#ETH #ETHUSDT #cryptotrading
$ETH
📊 #ETH/USDT Perp SIGNAL (15m)
🟢 LONG Entry: 2252 – 2258
(above MA7 and MA25)
🎯 Targets:
TP1: 2268
TP2: 2278
TP3: 2290
TP4: 2305
🛑 Stop Loss: 2238
⚠️ DYOR. Not financial advice.
#ETH #ETHUSDT #cryptotrading
📊 #ETH/USDT Perp SIGNAL (15m)
🟢 LONG Entry: 2252 – 2258
(above MA7 and MA25)
🎯 Targets:
TP1: 2268
TP2: 2278
TP3: 2290
TP4: 2305
🛑 Stop Loss: 2238
⚠️ DYOR. Not financial advice.
#ETH #ETHUSDT #cryptotrading
37

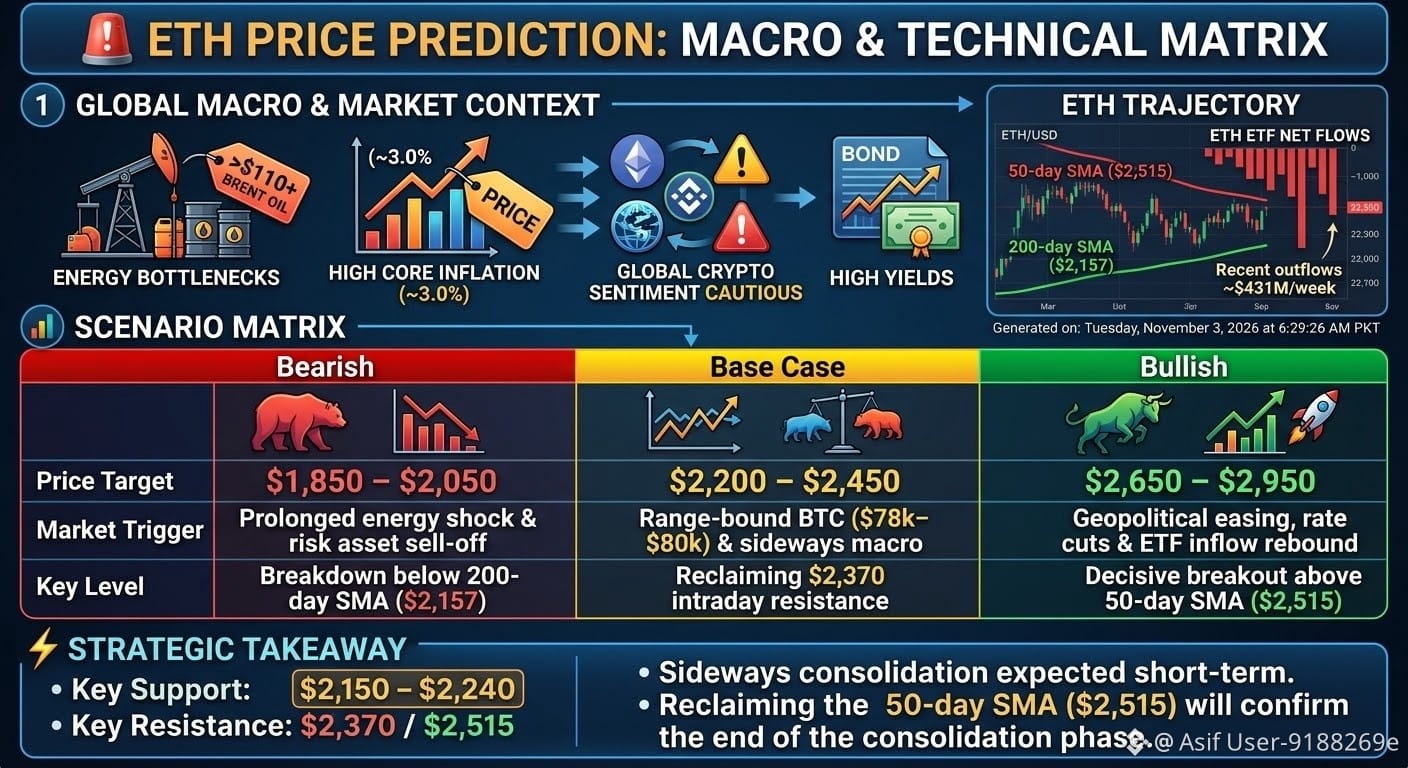
🚨 $ETH PRICE PREDICTION: MACRO & TECHNICAL MATRIX
Macro Context: Ongoing Middle East escalation & energy bottlenecks ($110+ Brent oil) keep core inflation high (~3.0%). High yields and recent exchange security events keep global crypto sentiment cautious.
ETH Trajectory: ETH is trading near $2,250 – $2,300, down ~24% YTD. Price trades below the 50-day SMA ($2,515) but holds above the 200-day SMA ($2,157). Recent ETF outflows (~$431M/week) act as near-term friction.
📊 SCENARIO MATRIX
Scenario
Market Trigger
Price Target
Key Level
Bearish
Prolonged energy shock & risk asset sell-off
$1,850 – $2,050
Breakdown below 200-day SMA ($2,157)
Base Case
Range-bound BTC ($78k–$80k) & sideways macro
$2,200 – $2,450
Reclaiming $2,370 intraday resistance
Bullish
Geopolitical easing, rate cuts & ETF inflow rebound
$2,650 – $2,950
Decisive breakout above 50-day SMA ($2,515)
⚡ STRATEGIC TAKEAWAY
Key Support: $2,150 – $2,240
Key Resistance: $2,370 / $2,515
Sideways consolidation expected short-term. Reclaiming the 50-day SMA ($2,515) will confirm the end of the consolidation phase.#trading #CryptoMarket #BinanceSquare #ETHUSDT
{spot}(ETHUSDT)
🚨 $ETH PRICE PREDICTION: MACRO & TECHNICAL MATRIX
Macro Context: Ongoing Middle East escalation & energy bottlenecks ($110+ Brent oil) keep core inflation high (~3.0%). High yields and recent exchange security events keep global crypto sentiment cautious.
ETH Trajectory: ETH is trading near $2,250 – $2,300, down ~24% YTD. Price trades below the 50-day SMA ($2,515) but holds above the 200-day SMA ($2,157). Recent ETF outflows (~$431M/week) act as near-term friction.
📊 SCENARIO MATRIX
Scenario
Market Trigger
Price Target
Key Level
Bearish
Prolonged energy shock & risk asset sell-off
$1,850 – $2,050
Breakdown below 200-day SMA ($2,157)
Base Case
Range-bound BTC ($78k–$80k) & sideways macro
$2,200 – $2,450
Reclaiming $2,370 intraday resistance
Bullish
Geopolitical easing, rate cuts & ETF inflow rebound
$2,650 – $2,950
Decisive breakout above 50-day SMA ($2,515)
⚡ STRATEGIC TAKEAWAY
Key Support: $2,150 – $2,240
Key Resistance: $2,370 / $2,515
Sideways consolidation expected short-term. Reclaiming the 50-day SMA ($2,515) will confirm the end of the consolidation phase.#trading #CryptoMarket #BinanceSquare #ETHUSDT
Macro Context: Ongoing Middle East escalation & energy bottlenecks ($110+ Brent oil) keep core inflation high (~3.0%). High yields and recent exchange security events keep global crypto sentiment cautious.
ETH Trajectory: ETH is trading near $2,250 – $2,300, down ~24% YTD. Price trades below the 50-day SMA ($2,515) but holds above the 200-day SMA ($2,157). Recent ETF outflows (~$431M/week) act as near-term friction.
📊 SCENARIO MATRIX
Scenario
Market Trigger
Price Target
Key Level
Bearish
Prolonged energy shock & risk asset sell-off
$1,850 – $2,050
Breakdown below 200-day SMA ($2,157)
Base Case
Range-bound BTC ($78k–$80k) & sideways macro
$2,200 – $2,450
Reclaiming $2,370 intraday resistance
Bullish
Geopolitical easing, rate cuts & ETF inflow rebound
$2,650 – $2,950
Decisive breakout above 50-day SMA ($2,515)
⚡ STRATEGIC TAKEAWAY
Key Support: $2,150 – $2,240
Key Resistance: $2,370 / $2,515
Sideways consolidation expected short-term. Reclaiming the 50-day SMA ($2,515) will confirm the end of the consolidation phase.#trading #CryptoMarket #BinanceSquare #ETHUSDT
30

🔴 ETHUSDT — FUTURES SHORT — TP3 HIT! 🎯
Our ETH call just proved true for TP3 — the prediction worked for this level, the final target of this trade.
ETHUSDT — FUTURES SHORT (1H SCALP)
Entry: $2,300–$2,310 (midpoint $2,305)
TP3: $2,250 — HIT at 17:45 UTC on 2 November (1m low $2,247.44)
Profit: +2.39% on the move from entry midpoint to TP3
In simple money terms, as an example only: on a $100 example with 50x leverage, that 2.39% move is +119.31%, or $119.31 profit on $100. This is only an example — 50x leverage also increases loss risk just as much, and this is not a guaranteed profit for anyone.
You can check our earlier post to verify this correct signal:
Original Post ID: 383891677034413
https://app.binance.com/uni-qr/cpos/383891677034413?r=DU9Y4GSY&l=en
Followers can check the earlier posts to verify the correct signal.
This is about this one signal and this TP3 level only — not a claim that every signal wins. All three targets are now hit — TP1 ($2,280), TP2 ($2,265) and TP3 ($2,250) — so this trade is complete.
Analysis Only — Not Financial Advice (NFA). Trading involves risk.
Follow Profit Direction for more signals, best signals and market updates. Share your opinion in the comments.
#ETH #ETHUSDT #CryptoTrading #FuturesTrading
🔴 ETHUSDT — FUTURES SHORT — TP3 HIT! 🎯
Our ETH call just proved true for TP3 — the prediction worked for this level, the final target of this trade.
ETHUSDT — FUTURES SHORT (1H SCALP)
Entry: $2,300–$2,310 (midpoint $2,305)
TP3: $2,250 — HIT at 17:45 UTC on 2 November (1m low $2,247.44)
Profit: +2.39% on the move from entry midpoint to TP3
In simple money terms, as an example only: on a $100 example with 50x leverage, that 2.39% move is +119.31%, or $119.31 profit on $100. This is only an example — 50x leverage also increases loss risk just as much, and this is not a guaranteed profit for anyone.
You can check our earlier post to verify this correct signal:
Original Post ID: 383891677034413
https://app.binance.com/uni-qr/cpos/383891677034413?r=DU9Y4GSY&l=en
Followers can check the earlier posts to verify the correct signal.
This is about this one signal and this TP3 level only — not a claim that every signal wins. All three targets are now hit — TP1 ($2,280), TP2 ($2,265) and TP3 ($2,250) — so this trade is complete.
Analysis Only — Not Financial Advice (NFA). Trading involves risk.
Follow Profit Direction for more signals, best signals and market updates. Share your opinion in the comments.
#ETH #ETHUSDT #CryptoTrading #FuturesTrading
Our ETH call just proved true for TP3 — the prediction worked for this level, the final target of this trade.
ETHUSDT — FUTURES SHORT (1H SCALP)
Entry: $2,300–$2,310 (midpoint $2,305)
TP3: $2,250 — HIT at 17:45 UTC on 2 November (1m low $2,247.44)
Profit: +2.39% on the move from entry midpoint to TP3
In simple money terms, as an example only: on a $100 example with 50x leverage, that 2.39% move is +119.31%, or $119.31 profit on $100. This is only an example — 50x leverage also increases loss risk just as much, and this is not a guaranteed profit for anyone.
You can check our earlier post to verify this correct signal:
Original Post ID: 383891677034413
https://app.binance.com/uni-qr/cpos/383891677034413?r=DU9Y4GSY&l=en
Followers can check the earlier posts to verify the correct signal.
This is about this one signal and this TP3 level only — not a claim that every signal wins. All three targets are now hit — TP1 ($2,280), TP2 ($2,265) and TP3 ($2,250) — so this trade is complete.
Analysis Only — Not Financial Advice (NFA). Trading involves risk.
Follow Profit Direction for more signals, best signals and market updates. Share your opinion in the comments.
#ETH #ETHUSDT #CryptoTrading #FuturesTrading

2
Log in to explore more content
Join global crypto users on Binance Square
⚡️ Get latest and useful information about crypto.
💬 Trusted by the world’s largest crypto exchange.
👍 Discover real insights from verified creators.
Email / Phone number
Trending Topics
1
#BTCRebounds80K
10,144 views
383 Discussing
2
#Binance98PercentReplenished
11,531 views
386 Discussing
3
#USMidterms-WhatAreMarketsExpecting?
251,783 views
1,852 Discussing
4
#USOctoberNFP-AreRateCutsStillPossible
345,588 views
2,694 Discussing
5
#AMDBeatsExpectations-AINarrativeContinues
70,746 views
701 Discussing
6
#CircleQ3Revenue865M
17,138 views
396 Discussing
7
#BinanceIncidentReport
440,085 views
1,997 Discussing
8
#USStocksOpenHigherAsDowGains1.9%
2,005 views
53 Discussing
9
#ADPUSPrivateEmployersAdd86000JobsInOctober
1,385 views
35 Discussing
10
#FrenchAssemblyPassesSelfCustodiedCryptoReportingAmendment
530 views
17 Discussing