
Nayeem Apan
615 Posts

Nayeem Apan
Report
Block User
Professional Trader Since 2021 | ICT & SMC Trader | DYOR | X-@nayeem_apan_ | Join My Trade Room |
Open Trade
Frequent Trader
5 Years
28 Following
1.8K+ Followers
2.5K Liked
Posts
Portfolio
All
Quotes
Videos
Live
PINNED
·
--
[Click Here to get Market Updates Daily for Free!!](https://www.binance.com/groupList?chatId=v1.00.QzJDSWRDcnlwdEZpeGRJVh_BicNb_zfyrjDTUf2xcWA&source=squareProfile)
👆👆👆👆👆👆👆👆👆👆👆👆👆👆👆👆
This is the LINK of My Chat Room!! Join & Stay Connected!
#BinanceSquareTalks
{spot}(BTCUSDT)
Click Here to get Market Updates Daily for Free!!
👆👆👆👆👆👆👆👆👆👆👆👆👆👆👆👆
This is the LINK of My Chat Room!! Join & Stay Connected!
#BinanceSquareTalks
👆👆👆👆👆👆👆👆👆👆👆👆👆👆👆👆
This is the LINK of My Chat Room!! Join & Stay Connected!
#BinanceSquareTalks
1
13
140
·
--

Article
NEAR MARKET UPDATE!!#NEARUSDT.P Signal- Long
This Coin will rise up. WHy ? Because price has broke the support will the confirmation from EMA CROSS ribbon- that shows us that price is now hunting for the liquidity that are resting above. On the correction we can take LONG entry. The setup is given down to my post !
Liquidation heatmap just shows us the liquidity levels, so that we can know how much market can go to that direction if it is on the way of the move.
Entry- 3.871
SL-3.781
TP-4.054
Leverage- 6x
$NEAR
{future}(NEARUSDT)
NEAR MARKET UPDATE!!
#NEARUSDT.P Signal- Long
This Coin will rise up. WHy ? Because price has broke the support will the confirmation from EMA CROSS ribbon- that shows us that price is now hunting for the liquidity that are resting above. On the correction we can take LONG entry. The setup is given down to my post !
Liquidation heatmap just shows us the liquidity levels, so that we can know how much market can go to that direction if it is on the way of the move.
Entry- 3.871
SL-3.781
TP-4.054
Leverage- 6x
$NEAR
This Coin will rise up. WHy ? Because price has broke the support will the confirmation from EMA CROSS ribbon- that shows us that price is now hunting for the liquidity that are resting above. On the correction we can take LONG entry. The setup is given down to my post !
Liquidation heatmap just shows us the liquidity levels, so that we can know how much market can go to that direction if it is on the way of the move.
Entry- 3.871
SL-3.781
TP-4.054
Leverage- 6x
$NEAR
87
·
--

Article
LSKUSDT PUMPS HIGH!!💥💥HUGE VOLATILE COIN! ONLY EXPERIENCED ONES CAN TAKE THIS SETUP!!💥💥
Coin- #LSKUSDT Setup- Long
We can see price is consolidating on the resistance , still less sellers are being trap, price can consolidate a little bit for more fuel. It can also give a wick from a little downside. But it will go UP for Sure according to my Analysis. MACD showing huge upward curves meaning a Bullish hit on the above.
Liquidation heatmap confirms us the bullish movement by showing us the how much quantity of Liquidity is resting above there.
Entry-0.1987👈
SL-0.1866$👈
Leverage- 4x👈
TP-0.2242👈
LSKUSDT PUMPS HIGH!!
💥💥HUGE VOLATILE COIN! ONLY EXPERIENCED ONES CAN TAKE THIS SETUP!!💥💥
Coin- #LSKUSDT Setup- Long
We can see price is consolidating on the resistance , still less sellers are being trap, price can consolidate a little bit for more fuel. It can also give a wick from a little downside. But it will go UP for Sure according to my Analysis. MACD showing huge upward curves meaning a Bullish hit on the above.
Liquidation heatmap confirms us the bullish movement by showing us the how much quantity of Liquidity is resting above there.
Entry-0.1987👈
SL-0.1866$👈
Leverage- 4x👈
TP-0.2242👈
Coin- #LSKUSDT Setup- Long
We can see price is consolidating on the resistance , still less sellers are being trap, price can consolidate a little bit for more fuel. It can also give a wick from a little downside. But it will go UP for Sure according to my Analysis. MACD showing huge upward curves meaning a Bullish hit on the above.
Liquidation heatmap confirms us the bullish movement by showing us the how much quantity of Liquidity is resting above there.
Entry-0.1987👈
SL-0.1866$👈
Leverage- 4x👈
TP-0.2242👈
241
·
--

Article
BNB will PUMP!!#BNBUSDT Signal- Long👆👆
👉👉READ MY POST CAREFULLY👈👈
👇👇👇👇👇👇👇👇👇👇👇👇
We can see that price wept the SSL & MSS bullish. It can get a correction and come a little bit down. On that correction we will enter Long position.
MACD is also showing a strong Bullish Momentum .
On the Liquidation Heatmap , we can see a lot of liquidity is resting above the 720 price of BNB. So market can give a strike above on that price. We need that scalping move. Almost no liquidity on the down side at all.
Signal-
Entry-697
SL-691
TP-717.50
Leverage-10x
$BNB
{future}(BNBUSDT)
BNB will PUMP!!
#BNBUSDT Signal- Long👆👆
👉👉READ MY POST CAREFULLY👈👈
👇👇👇👇👇👇👇👇👇👇👇👇
We can see that price wept the SSL & MSS bullish. It can get a correction and come a little bit down. On that correction we will enter Long position.
MACD is also showing a strong Bullish Momentum .
On the Liquidation Heatmap , we can see a lot of liquidity is resting above the 720 price of BNB. So market can give a strike above on that price. We need that scalping move. Almost no liquidity on the down side at all.
Signal-
Entry-697
SL-691
TP-717.50
Leverage-10x
$BNB
👉👉READ MY POST CAREFULLY👈👈
👇👇👇👇👇👇👇👇👇👇👇👇
We can see that price wept the SSL & MSS bullish. It can get a correction and come a little bit down. On that correction we will enter Long position.
MACD is also showing a strong Bullish Momentum .
On the Liquidation Heatmap , we can see a lot of liquidity is resting above the 720 price of BNB. So market can give a strike above on that price. We need that scalping move. Almost no liquidity on the down side at all.
Signal-
Entry-697
SL-691
TP-717.50
Leverage-10x
$BNB
70
·
--
Bearish
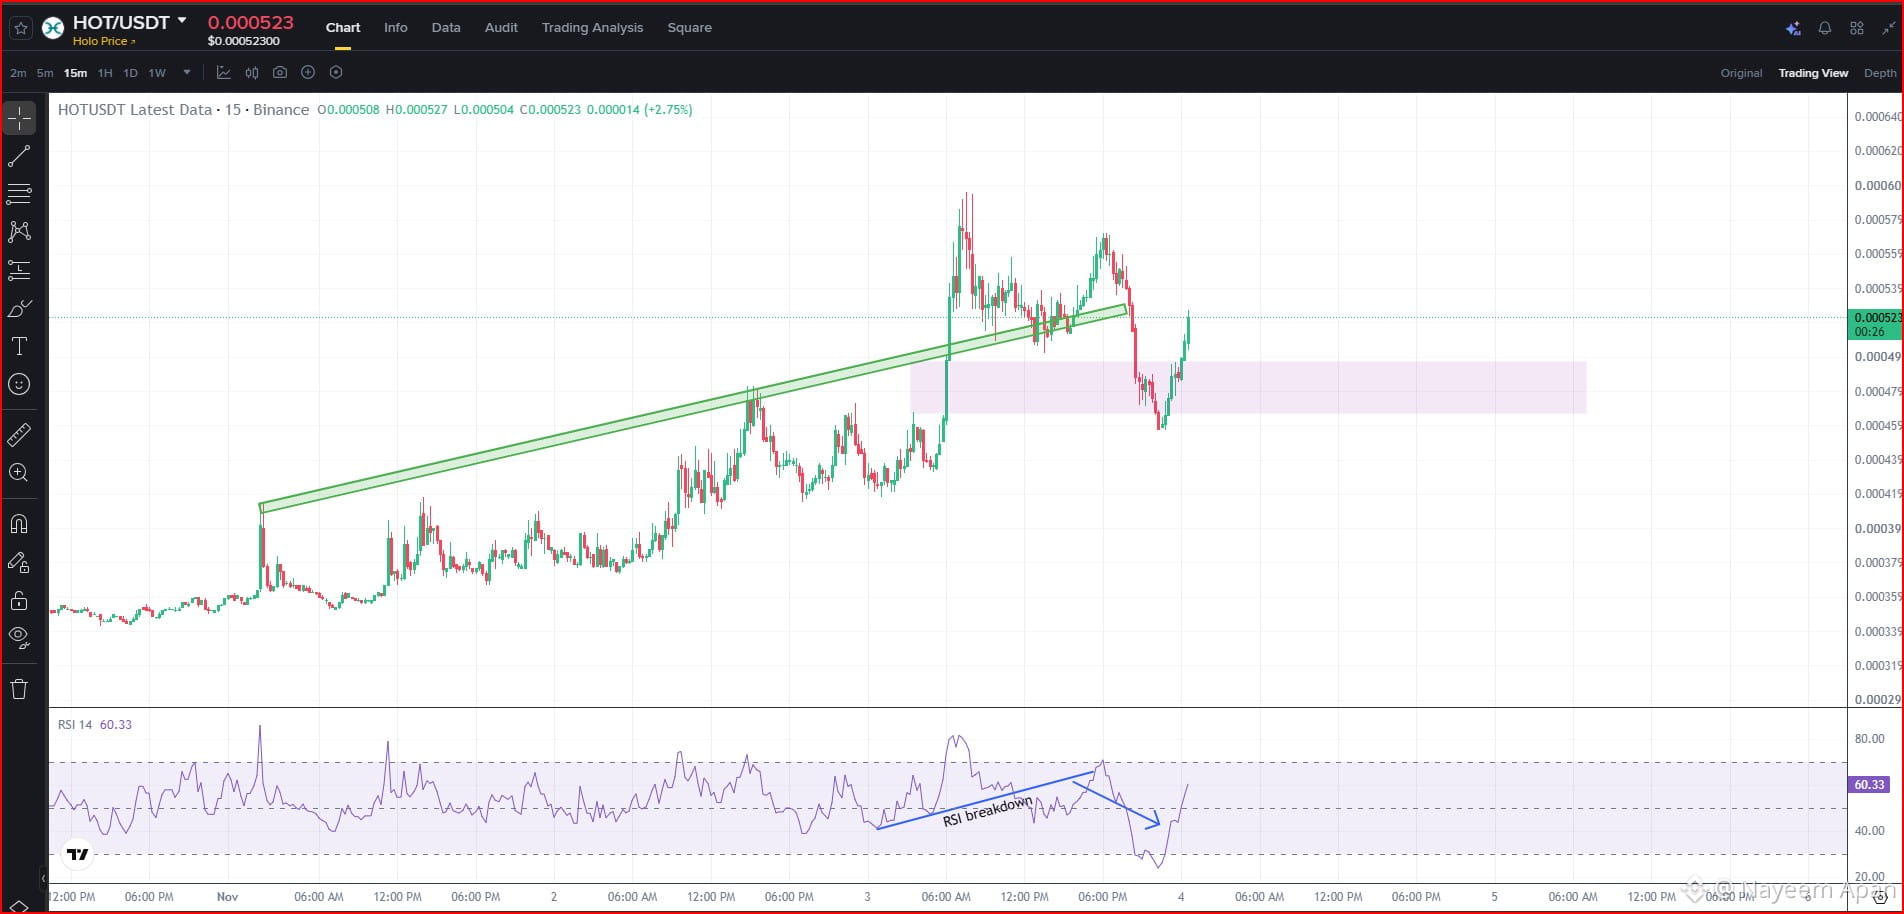
#hotusdt As I told 11hrs ago that this token will dump. And as you can see that price did fell down more than 12%. 💪💪
FOLLOW ME FOR MORE!!👈👈
$HOT
{future}(HOTUSDT)
#hotusdt As I told 11hrs ago that this token will dump. And as you can see that price did fell down more than 12%. 💪💪
FOLLOW ME FOR MORE!!👈👈
$HOT
FOLLOW ME FOR MORE!!👈👈
$HOT
Nayeem Apan
·
--
HOTUSDT UPDATE!!
#hotusdt This Coin is showing a Strong Bearish setup. This coin will fall . It setting UP a Trap for Buyers and Dump Hard anytime.
RSI- A strong bearish!👇👇
On the Liquidation Heatmap, we can see there's no Liquidity on the Up side at all. But price may move sideways a little bit more to generate Liquidity .
$HOT
👈
RSI- A strong bearish!👇👇
On the Liquidation Heatmap, we can see there's no Liquidity on the Up side at all. But price may move sideways a little bit more to generate Liquidity .
$HOT
👈
2
307
·
--
Bullish
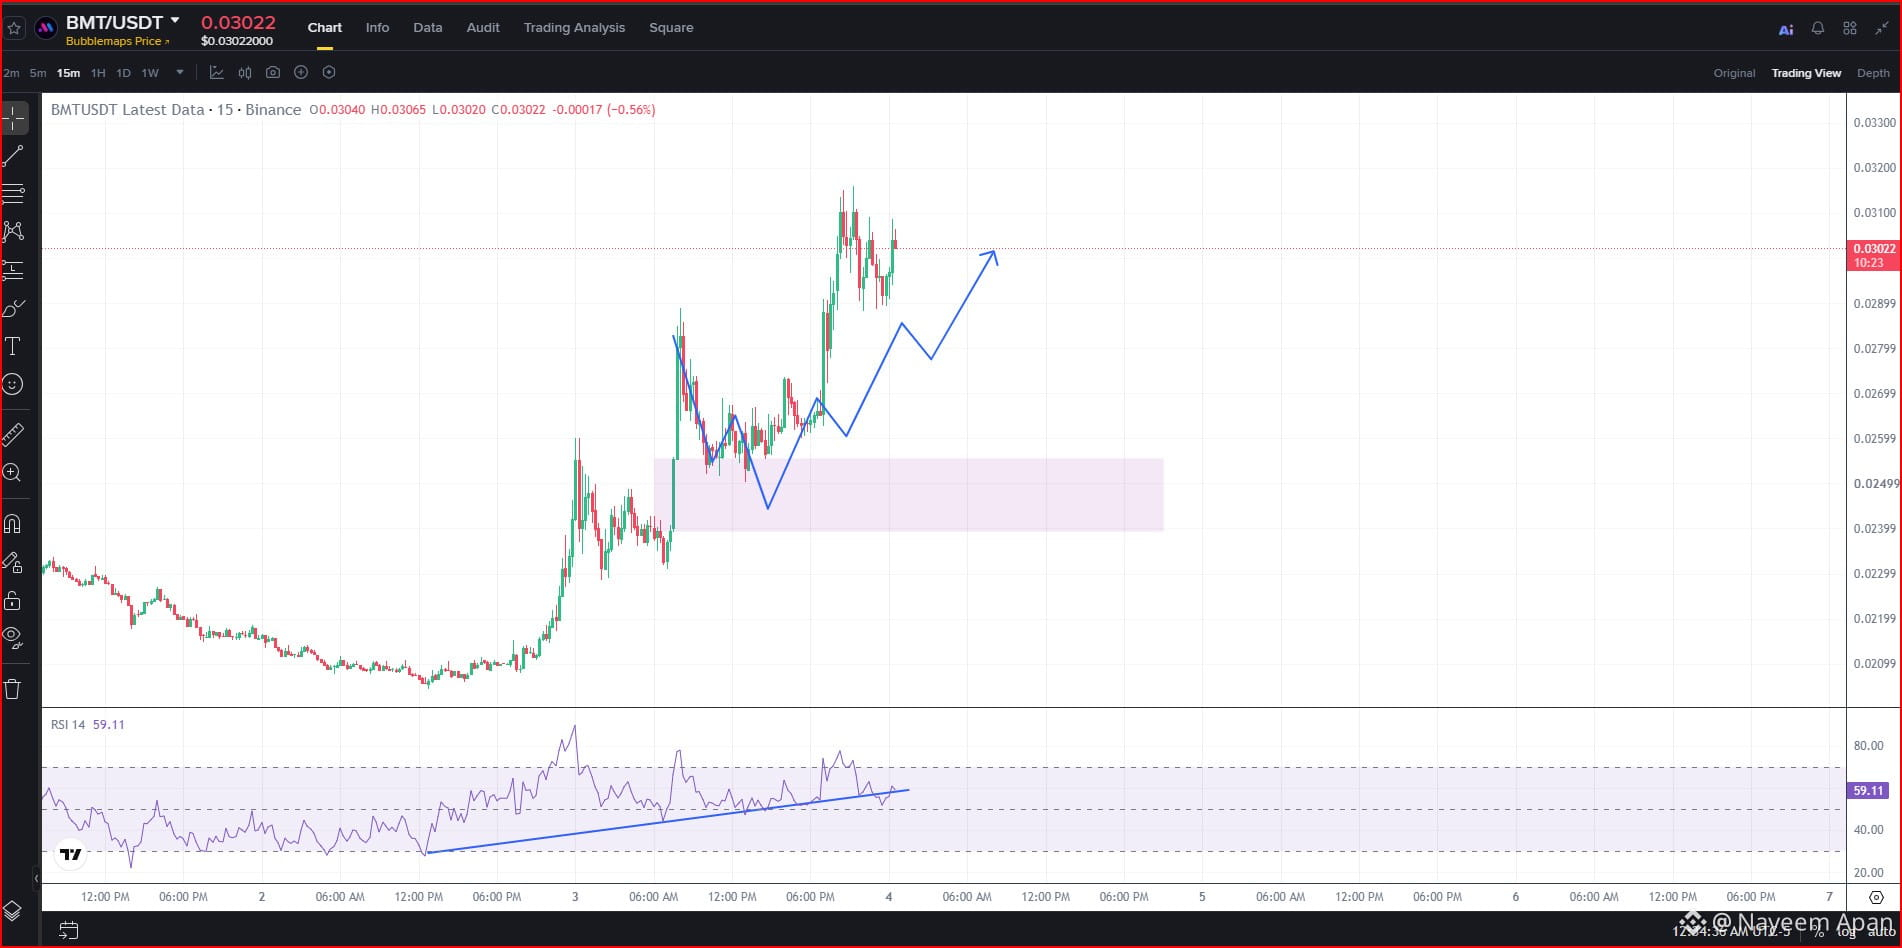
#BMTUSDT I told you guys that price will jump form this zone! And as you can already see that price did exactly what I said.
$BMT
{future}(BMTUSDT)
#BMTUSDT I told you guys that price will jump form this zone! And as you can already see that price did exactly what I said.
$BMT
$BMT
Nayeem Apan
·
--
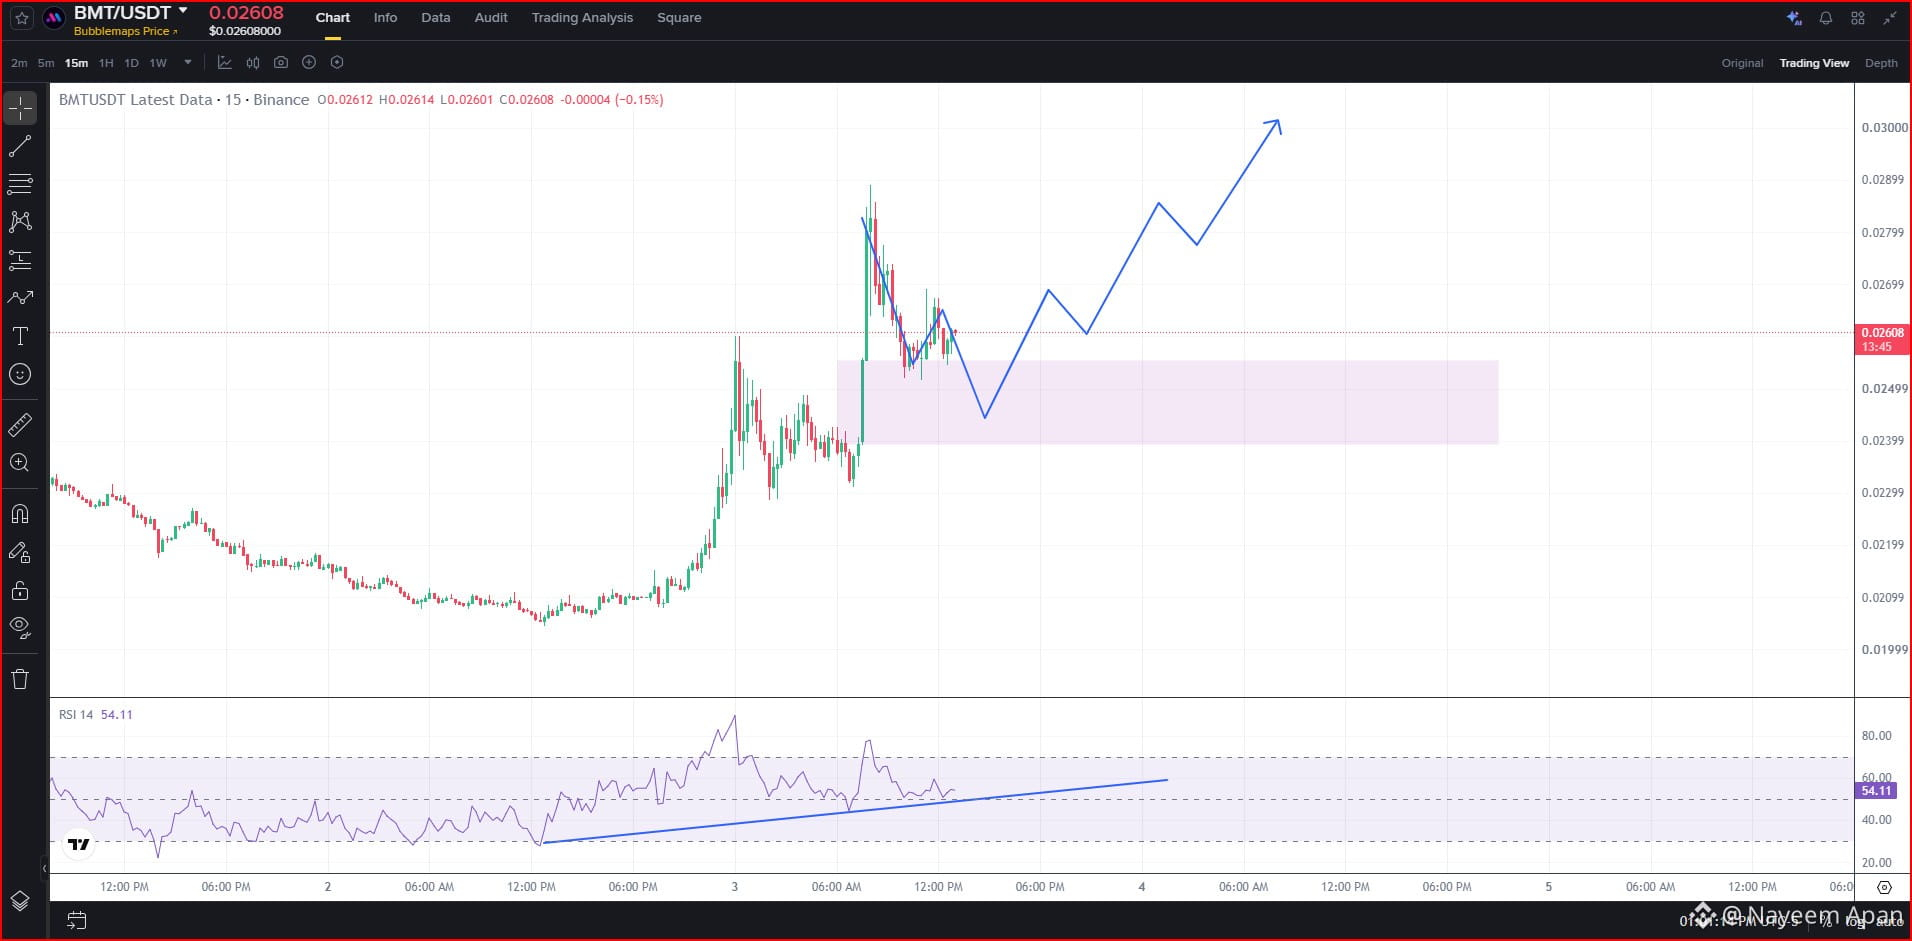
BullishCoin- #BMTUSDT Volatile Coin. Anytime this coin come a little bit closer.
RSI has already showing Bullishness.
Signal- Long 👈👈 #Bubblemaps
$BMT
RSI has already showing Bullishness.
Signal- Long 👈👈 #Bubblemaps
$BMT
106
·
--
Bullish
Coin- #BMTUSDT Volatile Coin. Anytime this coin come a little bit closer.
RSI has already showing Bullishness.
Signal- Long 👈👈 #Bubblemaps
$BMT
{future}(BMTUSDT)
Coin- #BMTUSDT Volatile Coin. Anytime this coin come a little bit closer.
RSI has already showing Bullishness.
Signal- Long 👈👈 #Bubblemaps
$BMT
RSI has already showing Bullishness.
Signal- Long 👈👈 #Bubblemaps
$BMT
1
1
219
·
--
Bearish
Take Profit Hit Guys!!💥💥
Take Profit Hit Guys!!💥💥
Nayeem Apan
·
--
SOLV TOKEN WILL CRASH!!
#SOLVUSDT Signal- SHORT!!
Entry- 0.004691
SL-0.004875
Leverage- 5x-8x.
TP- 0.004247
This coin will fall more, the cut is so deep that the bleeding will take time to stop!! It has taken a lot of Liquidity from above & also price gave a Bearish MSS. I do not see any rejection or I do not see any buyers pushing it at all.
In the Liquidation Heatmap, we can also see that a lot of liquidity is left in the lower price of the chart. No buyers at all.
$SOLV
💥💥
Entry- 0.004691
SL-0.004875
Leverage- 5x-8x.
TP- 0.004247
This coin will fall more, the cut is so deep that the bleeding will take time to stop!! It has taken a lot of Liquidity from above & also price gave a Bearish MSS. I do not see any rejection or I do not see any buyers pushing it at all.
In the Liquidation Heatmap, we can also see that a lot of liquidity is left in the lower price of the chart. No buyers at all.
$SOLV
💥💥

29
·
--

Article
HOTUSDT UPDATE!!#hotusdt This Coin is showing a Strong Bearish setup. This coin will fall . It setting UP a Trap for Buyers and Dump Hard anytime.
RSI- A strong bearish!👇👇
On the Liquidation Heatmap, we can see there's no Liquidity on the Up side at all. But price may move sideways a little bit more to generate Liquidity .
$HOT
👈
{future}(HOTUSDT)
HOTUSDT UPDATE!!
#hotusdt This Coin is showing a Strong Bearish setup. This coin will fall . It setting UP a Trap for Buyers and Dump Hard anytime.
RSI- A strong bearish!👇👇
On the Liquidation Heatmap, we can see there's no Liquidity on the Up side at all. But price may move sideways a little bit more to generate Liquidity .
$HOT
👈
RSI- A strong bearish!👇👇
On the Liquidation Heatmap, we can see there's no Liquidity on the Up side at all. But price may move sideways a little bit more to generate Liquidity .
$HOT
👈
1
1
222
·
--
Article
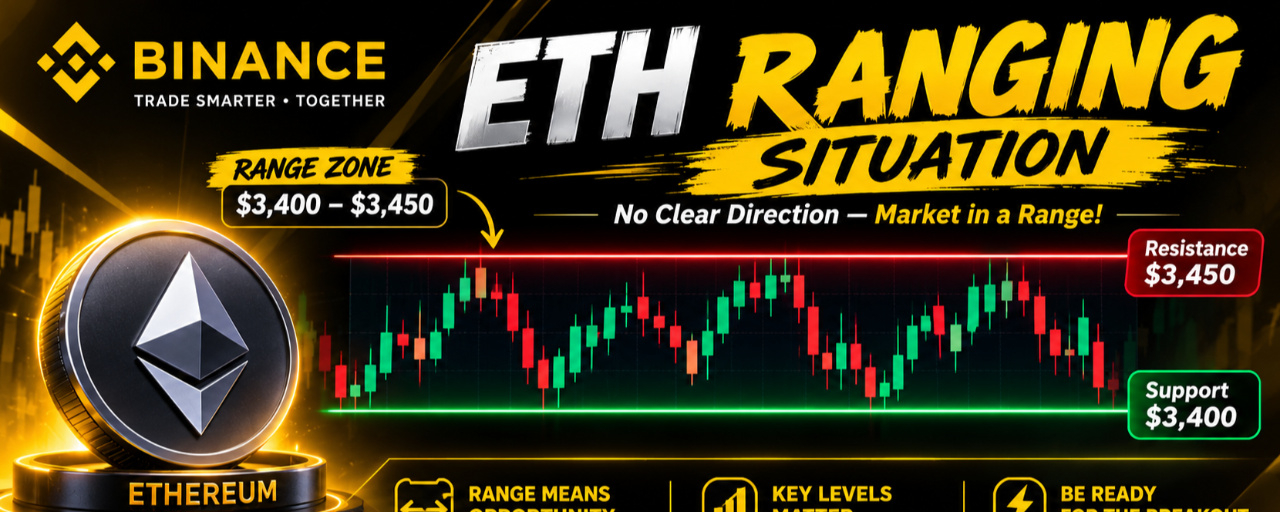
Ethereum Update !#ETHUSDT Condition: Ranging!!
For Me , price is on a ranging phase, thought price can give Bullish move, but not the exact move I wanting. So hands off the chart till now. Though New York session grabbed a lot of liquidity already, we didn't make that Ship to Sail. No worries, we will get opportunities more often till then hands off the chart.
Liquidation Heatmap is the prove that liquidity has taken already but not the way we wanted.
$ETH
{future}(ETHUSDT)
Ethereum Update !
#ETHUSDT Condition: Ranging!!
For Me , price is on a ranging phase, thought price can give Bullish move, but not the exact move I wanting. So hands off the chart till now. Though New York session grabbed a lot of liquidity already, we didn't make that Ship to Sail. No worries, we will get opportunities more often till then hands off the chart.
Liquidation Heatmap is the prove that liquidity has taken already but not the way we wanted.
$ETH
For Me , price is on a ranging phase, thought price can give Bullish move, but not the exact move I wanting. So hands off the chart till now. Though New York session grabbed a lot of liquidity already, we didn't make that Ship to Sail. No worries, we will get opportunities more often till then hands off the chart.
Liquidation Heatmap is the prove that liquidity has taken already but not the way we wanted.
$ETH
153
·
--

Article
SCALPING SETUP FOR ETCUSDT!#ETCUSDT Signal-LONG!!
Entry- 7.44😉
Leverage-8x💥
READ MY POST CAREFULLY
SL-7.31(Don't forget to trial your SL)👻
TP-7.73⭐
As we can see on the chart that price has given a breakout on the Long side by trapping the sellers. Now buyers are in control. A little rejection can come but eventually price will rise up. This is a Scalping setup. We can also the volume of the candles that price did broke that resistance with buyers control/pressure.
Heatmap shows us the position of the resting liquidity, we just need that rushed movement. Everything else is a Distraction.
$ETC
{future}(ETCUSDT)
SCALPING SETUP FOR ETCUSDT!
#ETCUSDT Signal-LONG!!
Entry- 7.44😉
Leverage-8x💥
READ MY POST CAREFULLY
SL-7.31(Don't forget to trial your SL)👻
TP-7.73⭐
As we can see on the chart that price has given a breakout on the Long side by trapping the sellers. Now buyers are in control. A little rejection can come but eventually price will rise up. This is a Scalping setup. We can also the volume of the candles that price did broke that resistance with buyers control/pressure.
Heatmap shows us the position of the resting liquidity, we just need that rushed movement. Everything else is a Distraction.
$ETC
Entry- 7.44😉
Leverage-8x💥
READ MY POST CAREFULLY
SL-7.31(Don't forget to trial your SL)👻
TP-7.73⭐
As we can see on the chart that price has given a breakout on the Long side by trapping the sellers. Now buyers are in control. A little rejection can come but eventually price will rise up. This is a Scalping setup. We can also the volume of the candles that price did broke that resistance with buyers control/pressure.
Heatmap shows us the position of the resting liquidity, we just need that rushed movement. Everything else is a Distraction.
$ETC
72
·
--
Article
SOLV TOKEN WILL CRASH!!#SOLVUSDT Signal- SHORT!!
Entry- 0.004691
SL-0.004875
Leverage- 5x-8x.
TP- 0.004247
This coin will fall more, the cut is so deep that the bleeding will take time to stop!! It has taken a lot of Liquidity from above & also price gave a Bearish MSS. I do not see any rejection or I do not see any buyers pushing it at all.
In the Liquidation Heatmap, we can also see that a lot of liquidity is left in the lower price of the chart. No buyers at all.
$SOLV
💥💥
{future}(SOLVUSDT)
SOLV TOKEN WILL CRASH!!
#SOLVUSDT Signal- SHORT!!
Entry- 0.004691
SL-0.004875
Leverage- 5x-8x.
TP- 0.004247
This coin will fall more, the cut is so deep that the bleeding will take time to stop!! It has taken a lot of Liquidity from above & also price gave a Bearish MSS. I do not see any rejection or I do not see any buyers pushing it at all.
In the Liquidation Heatmap, we can also see that a lot of liquidity is left in the lower price of the chart. No buyers at all.
$SOLV
💥💥
Entry- 0.004691
SL-0.004875
Leverage- 5x-8x.
TP- 0.004247
This coin will fall more, the cut is so deep that the bleeding will take time to stop!! It has taken a lot of Liquidity from above & also price gave a Bearish MSS. I do not see any rejection or I do not see any buyers pushing it at all.
In the Liquidation Heatmap, we can also see that a lot of liquidity is left in the lower price of the chart. No buyers at all.
$SOLV
💥💥
1
87
·
--
🎙️ Compounding Day 2 | 30$ to 50, 000 $ | Join Now | Ethereum |

End
02 h 31 m 26 s
564
4
1
·
--
🎙️ Compounding Day 1 | 30$ to 50, 000 $ | Join Now | Ethereum |

End
04 h 35 m 52 s
893
4
1
·
--

Article
IBMB bStockIBMB (IBM Tokenized bStock)
IBMB is Binance’s tokenized version of IBM stock. It moves with the actual IBM share price, trades 24/7, and you can convert it 1:1 back to the underlying stock on the platform (subject to the usual rules). Right now it’s sitting around the 230–250 area.
It’s been fairly quiet the last few days. Nothing explosive, just the usual slow movement you see on these tokenized names when the real stock isn’t doing much. Volume is decent but not heavy.
A couple of things I’m watching:
Yesterday’s high is still open above. If price sweeps that and then shows a clean shift the other way on the lower timeframe, the downside opens up.On the downside, the area under 230 has been holding so far. A clean break under that would bring the next lower pool into play.Dividends get handled as extra IBMB tokens (reinvested after taxes/fees), which is nice if you’re holding, but it doesn’t change the short-term price action much.
These bStocks can stay range-bound for a while, so I’m not forcing trades. Just marking the outside highs and lows and waiting for a real sweep instead of chasing the small inside moves.
Anyone else tracking both the IBMB chart and the actual IBM stock at the same time? How closely are you seeing them move together lately?
IBMB bStock
IBMB (IBM Tokenized bStock)
IBMB is Binance’s tokenized version of IBM stock. It moves with the actual IBM share price, trades 24/7, and you can convert it 1:1 back to the underlying stock on the platform (subject to the usual rules). Right now it’s sitting around the 230–250 area.
It’s been fairly quiet the last few days. Nothing explosive, just the usual slow movement you see on these tokenized names when the real stock isn’t doing much. Volume is decent but not heavy.
A couple of things I’m watching:
Yesterday’s high is still open above. If price sweeps that and then shows a clean shift the other way on the lower timeframe, the downside opens up.On the downside, the area under 230 has been holding so far. A clean break under that would bring the next lower pool into play.Dividends get handled as extra IBMB tokens (reinvested after taxes/fees), which is nice if you’re holding, but it doesn’t change the short-term price action much.
These bStocks can stay range-bound for a while, so I’m not forcing trades. Just marking the outside highs and lows and waiting for a real sweep instead of chasing the small inside moves.
Anyone else tracking both the IBMB chart and the actual IBM stock at the same time? How closely are you seeing them move together lately?
IBMB is Binance’s tokenized version of IBM stock. It moves with the actual IBM share price, trades 24/7, and you can convert it 1:1 back to the underlying stock on the platform (subject to the usual rules). Right now it’s sitting around the 230–250 area.
It’s been fairly quiet the last few days. Nothing explosive, just the usual slow movement you see on these tokenized names when the real stock isn’t doing much. Volume is decent but not heavy.
A couple of things I’m watching:
Yesterday’s high is still open above. If price sweeps that and then shows a clean shift the other way on the lower timeframe, the downside opens up.On the downside, the area under 230 has been holding so far. A clean break under that would bring the next lower pool into play.Dividends get handled as extra IBMB tokens (reinvested after taxes/fees), which is nice if you’re holding, but it doesn’t change the short-term price action much.
These bStocks can stay range-bound for a while, so I’m not forcing trades. Just marking the outside highs and lows and waiting for a real sweep instead of chasing the small inside moves.
Anyone else tracking both the IBMB chart and the actual IBM stock at the same time? How closely are you seeing them move together lately?
84
·
--
#EarningsSeason
Earnings season is always messy. One day a company beats and the stock rips, next day another one misses and everything cools off. Crypto feels it too — especially the tokenized stocks and the bigger names that move with the Nasdaq.
Right now it feels like people are waiting more than trading. A lot of eyes on the big reports this week. Some names already moved hard after hours, others are still sitting in the same range they were in last week. The hard part is knowing which reaction is real and which one is just noise before the next print.
I’ve been keeping the charts simple during this period. Mark the obvious highs and lows from before the earnings, then see if price actually sweeps them after the numbers come out. A lot of the time the first move is the trap. The second move, once the dust settles, is usually cleaner. Doesn’t always work, but it’s better than chasing the first candle.
Volume has been higher than usual on a few of the tokenized names too. Not sure if that’s people positioning ahead of the reports or just normal flow. Either way, the outside levels matter more than the small inside swings while these numbers are dropping.
How are you playing this earnings season? Sitting it out, or looking for the reaction after the reports? Any name you’re watching more than the others right now?
#EarningsSeason
Earnings season is always messy. One day a company beats and the stock rips, next day another one misses and everything cools off. Crypto feels it too — especially the tokenized stocks and the bigger names that move with the Nasdaq.
Right now it feels like people are waiting more than trading. A lot of eyes on the big reports this week. Some names already moved hard after hours, others are still sitting in the same range they were in last week. The hard part is knowing which reaction is real and which one is just noise before the next print.
I’ve been keeping the charts simple during this period. Mark the obvious highs and lows from before the earnings, then see if price actually sweeps them after the numbers come out. A lot of the time the first move is the trap. The second move, once the dust settles, is usually cleaner. Doesn’t always work, but it’s better than chasing the first candle.
Volume has been higher than usual on a few of the tokenized names too. Not sure if that’s people positioning ahead of the reports or just normal flow. Either way, the outside levels matter more than the small inside swings while these numbers are dropping.
How are you playing this earnings season? Sitting it out, or looking for the reaction after the reports? Any name you’re watching more than the others right now?
Earnings season is always messy. One day a company beats and the stock rips, next day another one misses and everything cools off. Crypto feels it too — especially the tokenized stocks and the bigger names that move with the Nasdaq.
Right now it feels like people are waiting more than trading. A lot of eyes on the big reports this week. Some names already moved hard after hours, others are still sitting in the same range they were in last week. The hard part is knowing which reaction is real and which one is just noise before the next print.
I’ve been keeping the charts simple during this period. Mark the obvious highs and lows from before the earnings, then see if price actually sweeps them after the numbers come out. A lot of the time the first move is the trap. The second move, once the dust settles, is usually cleaner. Doesn’t always work, but it’s better than chasing the first candle.
Volume has been higher than usual on a few of the tokenized names too. Not sure if that’s people positioning ahead of the reports or just normal flow. Either way, the outside levels matter more than the small inside swings while these numbers are dropping.
How are you playing this earnings season? Sitting it out, or looking for the reaction after the reports? Any name you’re watching more than the others right now?
762
·
--
Article
My Opinion On CRMBCRMB has been pretty quiet the last few days. Still hanging around the 240–250 zone. Nothing crazy, just the usual slow grind these tokenized stocks do when the real Salesforce stock isn’t moving much.
I’ve been watching two things at the same time: the CRMB chart and the actual CRM stock. Sometimes the tokenized version lags a bit, sometimes it moves first. Right now it feels like it’s just following.
A couple of levels I’m keeping an eye on:
Yesterday’s high is still open above. If price sweeps that and then shows a clean shift down on the lower timeframe, the other side becomes interesting.
On the downside, the area under 240 has been holding so far. If that breaks with strength, then the next lower pool comes into play.
Volume has been decent but not explosive. These bStocks can stay range-bound for a while, so I’m not forcing anything. Just marking the outside highs and lows and waiting for a real sweep.
Anyone else tracking both the tokenized version and the actual stock at the same time? Curious how you’re seeing the correlation lately.
#CRMB
My Opinion On CRMB
CRMB has been pretty quiet the last few days. Still hanging around the 240–250 zone. Nothing crazy, just the usual slow grind these tokenized stocks do when the real Salesforce stock isn’t moving much.
I’ve been watching two things at the same time: the CRMB chart and the actual CRM stock. Sometimes the tokenized version lags a bit, sometimes it moves first. Right now it feels like it’s just following.
A couple of levels I’m keeping an eye on:
Yesterday’s high is still open above. If price sweeps that and then shows a clean shift down on the lower timeframe, the other side becomes interesting.
On the downside, the area under 240 has been holding so far. If that breaks with strength, then the next lower pool comes into play.
Volume has been decent but not explosive. These bStocks can stay range-bound for a while, so I’m not forcing anything. Just marking the outside highs and lows and waiting for a real sweep.
Anyone else tracking both the tokenized version and the actual stock at the same time? Curious how you’re seeing the correlation lately.
#CRMB
I’ve been watching two things at the same time: the CRMB chart and the actual CRM stock. Sometimes the tokenized version lags a bit, sometimes it moves first. Right now it feels like it’s just following.
A couple of levels I’m keeping an eye on:
Yesterday’s high is still open above. If price sweeps that and then shows a clean shift down on the lower timeframe, the other side becomes interesting.
On the downside, the area under 240 has been holding so far. If that breaks with strength, then the next lower pool comes into play.
Volume has been decent but not explosive. These bStocks can stay range-bound for a while, so I’m not forcing anything. Just marking the outside highs and lows and waiting for a real sweep.
Anyone else tracking both the tokenized version and the actual stock at the same time? Curious how you’re seeing the correlation lately.
#CRMB
110
·
--
Ethereum SLOW!I can see that ETH, the mother of ALTS coin is SLOW & Moving side ways. No fuel to move. Meaning a Strong REACTION waiting.
#ETHUSDT
$ETH
{future}(ETHUSDT)
Ethereum SLOW!
I can see that ETH, the mother of ALTS coin is SLOW & Moving side ways. No fuel to move. Meaning a Strong REACTION waiting.
#ETHUSDT
$ETH
#ETHUSDT
$ETH
1
248
Log in to explore more content
Join global crypto users on Binance Square
⚡️ Get latest and useful information about crypto.
💬 Trusted by the world’s largest crypto exchange.
👍 Discover real insights from verified creators.
Email / Phone number
Trending Topics
USMidterms-WhatAreMarketsExpecting?
42,640 views
484 Discussing
Democratic Congressional Sweep Shakes Trump Trades in AI Stocks and Crypto
Binance News
·4 Likes
·2.5k views
USOctoberNFP-AreRateCutsStillPossible
220,540 views
1,754 Discussing
AMDBeatsExpectations-AINarrativeContinues
7,665 views
185 Discussing