
#etfcikisi5gun
etfcikisi5gun
13 views
2 Discussing
Hot
Latest

·
--
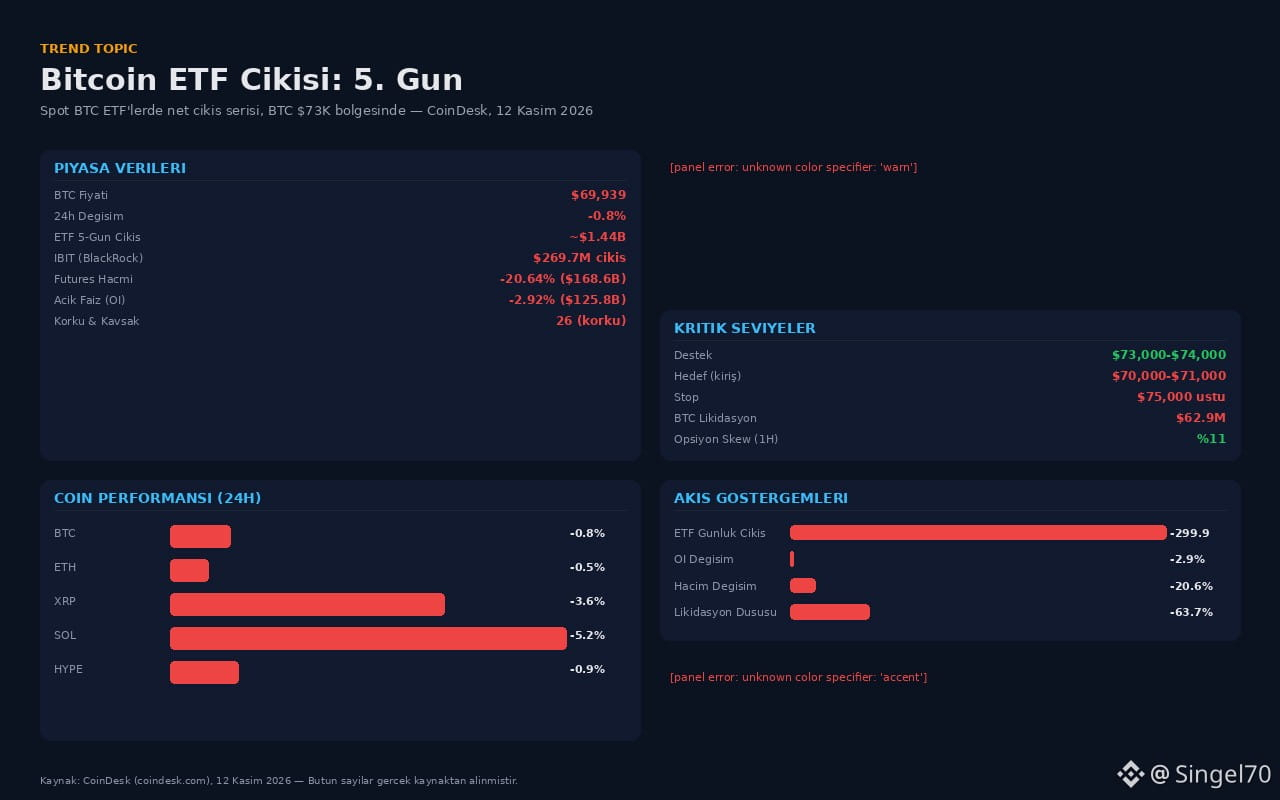
#ETFCikisi5Gun Bitcoin spot ETFs have seen continued net outflows for 5 days, while BTC is falling sharply around the $73K area. Is this just a technical correction?
📌 Key Data (CoinDesk, November 12, 2026, 06:30 EST):
- BTC: $69,939, down 0.8% in 24 hours, near its daily low
- Spot BTC ETFs: 5th day of outflows, totaling ~$1.44B (since November 5)
- BlackRock IBIT: 9th consecutive session of redemptions, with $269.7M in outflows
- Futures volume: -20.64%, at $168.6B
- Open interest (OI): -2.92%, at $125.8B
- BTC liquidations: $62.9M, 64.5% of them longs
- Fear & Greed Index: 26 (fear zone)
📉 Technical Analysis:
BTC futures OI fell 2.9%, while the price dropped 0.6%. CVD is negative — market orders are skewed toward selling. $73,000–$74,000 put options (November 13 expiration) indicate a strong support level. The 1-week skew is around 11%, with put premiums higher than call premiums.
🐋 On-Chain / Whale Evidence:
ETF flows have been negative for 5 days. IBIT's 9-session losing streak points to waning institutional demand. The more than 20% drop in futures volume and OI falling to $125.8B suggest positions are being closed and money is leaving the market.
🎯 Clear Plan:
Bias: Short/neutral looks stronger. The $73,000–$74,000 zone is critical support. If this level breaks, the next target is $70,000–$71,000. Stop: a close above $75,000. For a long position, wait for a confirmed close above $73K.
📌 Closing thought: If ETF outflows continue into a 6th day, how low could BTC fall? We look forward to your comments.
#BTC $BTC #ETF #Kripto #Market
This is not financial advice.
#ETFCikisi5Gun Bitcoin spot ETFs have seen continued net outflows for 5 days, while BTC is falling sharply around the $73K area. Is this just a technical correction?
📌 Key Data (CoinDesk, November 12, 2026, 06:30 EST):
- BTC: $69,939, down 0.8% in 24 hours, near its daily low
- Spot BTC ETFs: 5th day of outflows, totaling ~$1.44B (since November 5)
- BlackRock IBIT: 9th consecutive session of redemptions, with $269.7M in outflows
- Futures volume: -20.64%, at $168.6B
- Open interest (OI): -2.92%, at $125.8B
- BTC liquidations: $62.9M, 64.5% of them longs
- Fear & Greed Index: 26 (fear zone)
📉 Technical Analysis:
BTC futures OI fell 2.9%, while the price dropped 0.6%. CVD is negative — market orders are skewed toward selling. $73,000–$74,000 put options (November 13 expiration) indicate a strong support level. The 1-week skew is around 11%, with put premiums higher than call premiums.
🐋 On-Chain / Whale Evidence:
ETF flows have been negative for 5 days. IBIT's 9-session losing streak points to waning institutional demand. The more than 20% drop in futures volume and OI falling to $125.8B suggest positions are being closed and money is leaving the market.
🎯 Clear Plan:
Bias: Short/neutral looks stronger. The $73,000–$74,000 zone is critical support. If this level breaks, the next target is $70,000–$71,000. Stop: a close above $75,000. For a long position, wait for a confirmed close above $73K.
📌 Closing thought: If ETF outflows continue into a 6th day, how low could BTC fall? We look forward to your comments.
#BTC $BTC #ETF #Kripto #Market
This is not financial advice.
📌 Key Data (CoinDesk, November 12, 2026, 06:30 EST):
- BTC: $69,939, down 0.8% in 24 hours, near its daily low
- Spot BTC ETFs: 5th day of outflows, totaling ~$1.44B (since November 5)
- BlackRock IBIT: 9th consecutive session of redemptions, with $269.7M in outflows
- Futures volume: -20.64%, at $168.6B
- Open interest (OI): -2.92%, at $125.8B
- BTC liquidations: $62.9M, 64.5% of them longs
- Fear & Greed Index: 26 (fear zone)
📉 Technical Analysis:
BTC futures OI fell 2.9%, while the price dropped 0.6%. CVD is negative — market orders are skewed toward selling. $73,000–$74,000 put options (November 13 expiration) indicate a strong support level. The 1-week skew is around 11%, with put premiums higher than call premiums.
🐋 On-Chain / Whale Evidence:
ETF flows have been negative for 5 days. IBIT's 9-session losing streak points to waning institutional demand. The more than 20% drop in futures volume and OI falling to $125.8B suggest positions are being closed and money is leaving the market.
🎯 Clear Plan:
Bias: Short/neutral looks stronger. The $73,000–$74,000 zone is critical support. If this level breaks, the next target is $70,000–$71,000. Stop: a close above $75,000. For a long position, wait for a confirmed close above $73K.
📌 Closing thought: If ETF outflows continue into a 6th day, how low could BTC fall? We look forward to your comments.
#BTC $BTC #ETF #Kripto #Market
This is not financial advice.
86
Log in to explore more content
Join global crypto users on Binance Square
⚡️ Get latest and useful information about crypto.
💬 Trusted by the world’s largest crypto exchange.
👍 Discover real insights from verified creators.
Email / Phone number
Trending Topics
1
#WhatWillDriveCryptoandStocks’NextRebound?
58,830 views
813 Discussing
2
#Anthropic’s6xIPODemandSignalsPotentialRecordRaise
18,697 views
381 Discussing
3
#USCryptoETFsLose$1.48BInFiveDays
272 views
9 Discussing
4
#KoreaDigitalAssetBasicActFinalDraftExpectedEarlyJanuary
67 views
5 Discussing
5
#JaneStreetNearlyOctuplesFidelityBitcoinETFHoldings
5,519 views
105 Discussing
6
#HuangExitNvidiaStrategyInFocus
210,175 views
1,748 Discussing
7
#AnthropicRejectsIPODelayValuationinQuestion
833,766 views
5,882 Discussing
8
#FlopLabsTestnetAndAirdropToLaunchNov24
1,553 views
45 Discussing
9
#HedgeFundsCMEBitcoinNetShortsFall89%
23,180 views
303 Discussing
10
#BitMineReports$6.3BNetLossForFiscal2026
29,294 views
197 Discussing