

#cryptohorizon24
cryptohorizon24
276 views
8 Discussing
Hot
Latest

·
--
Bullish
🚨 Is Ethereum preparing to lead a new bull wave? 🚀$ETH
{spot}(ETHUSDT)
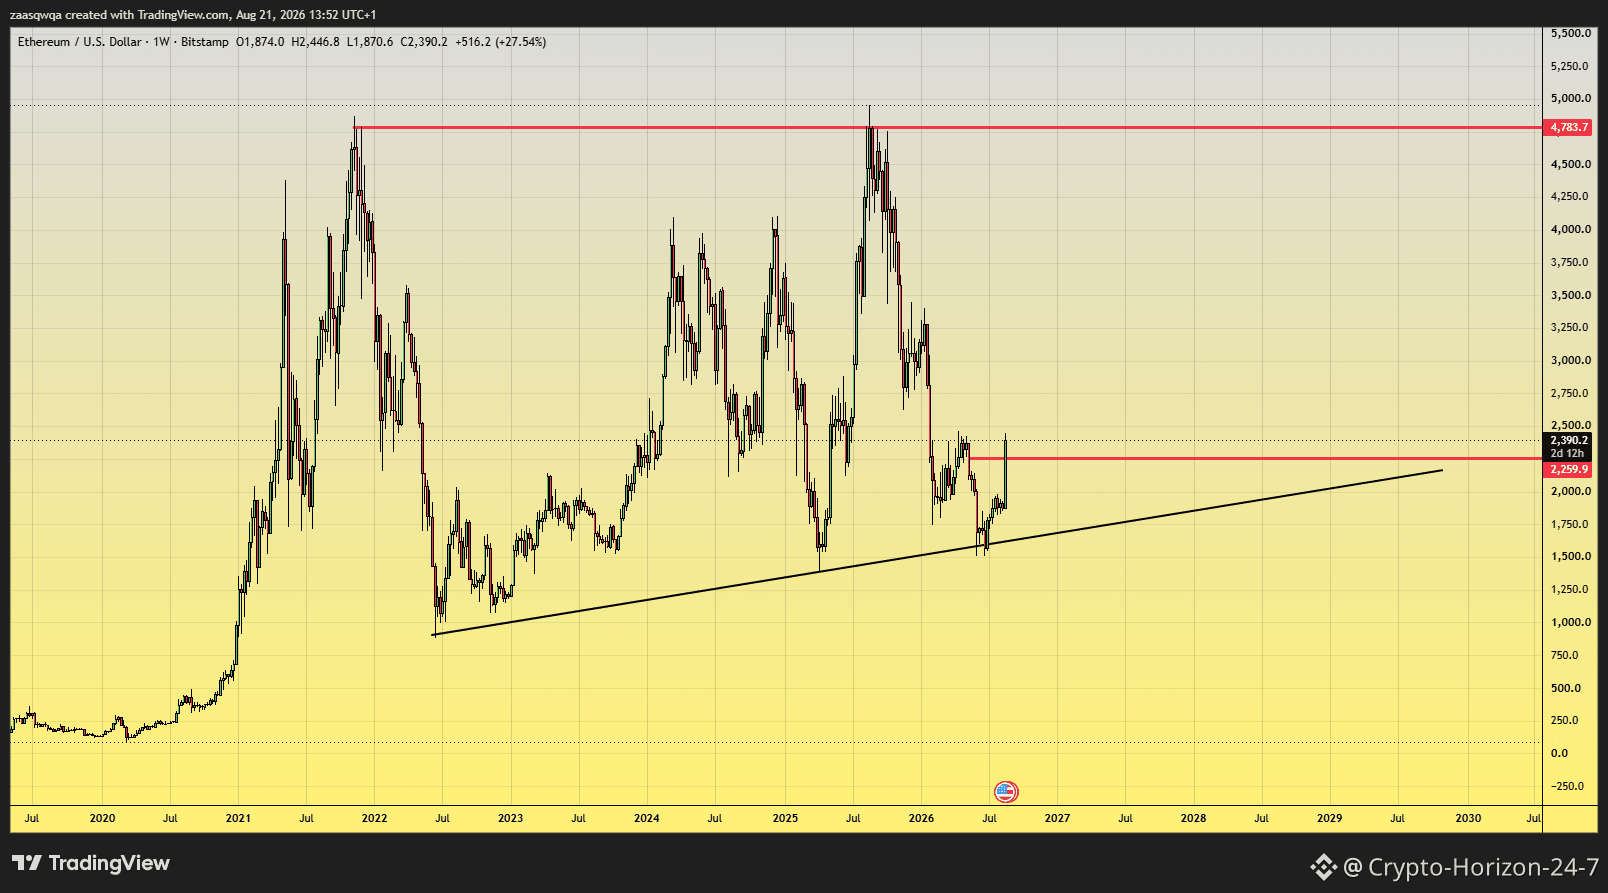
ETH has shown clear strength over the past few days, rising by roughly over 30% since the start of the week, reaching levels close to $2,400. In addition, spot Ethereum funds recorded strong inflows, totaling about $221 million on August 20, reflecting the continued interest from institutions.
📈 My personal view: The weekly chart shows that ETH is maintaining a long-term upward trend line, and with a break above the $2,259 zone, we could see continued momentum toward higher levels.
🎯 The most important zone now: $2,259$
🔥 A breakthrough of the upcoming resistance levels could make Ethereum one of the most prominent coins capable of leading a new upward wave in the altcoin market.
⚠️ But after this strong surge, we should pay attention to the possibility of a short correction before continuing higher; some indicators have moved into overbought zones.
📊 I always share daily market analyses and analyses of digital currencies—follow me for more updates and analyses.
$ETH $BTC
{spot}(BTCUSDT)
#Ethereum✅ #ETH #crypto T #تحليل_العملات_الرقمية #Cryptohorizon24
🚨 Is Ethereum preparing to lead a new bull wave? 🚀$ETH
ETH has shown clear strength over the past few days, rising by roughly over 30% since the start of the week, reaching levels close to $2,400. In addition, spot Ethereum funds recorded strong inflows, totaling about $221 million on August 20, reflecting the continued interest from institutions.
📈 My personal view: The weekly chart shows that ETH is maintaining a long-term upward trend line, and with a break above the $2,259 zone, we could see continued momentum toward higher levels.
🎯 The most important zone now: $2,259$
🔥 A breakthrough of the upcoming resistance levels could make Ethereum one of the most prominent coins capable of leading a new upward wave in the altcoin market.
⚠️ But after this strong surge, we should pay attention to the possibility of a short correction before continuing higher; some indicators have moved into overbought zones.
📊 I always share daily market analyses and analyses of digital currencies—follow me for more updates and analyses.
$ETH $BTC
#Ethereum✅ #ETH #crypto T #تحليل_العملات_الرقمية #Cryptohorizon24
ETH has shown clear strength over the past few days, rising by roughly over 30% since the start of the week, reaching levels close to $2,400. In addition, spot Ethereum funds recorded strong inflows, totaling about $221 million on August 20, reflecting the continued interest from institutions.
📈 My personal view: The weekly chart shows that ETH is maintaining a long-term upward trend line, and with a break above the $2,259 zone, we could see continued momentum toward higher levels.
🎯 The most important zone now: $2,259$
🔥 A breakthrough of the upcoming resistance levels could make Ethereum one of the most prominent coins capable of leading a new upward wave in the altcoin market.
⚠️ But after this strong surge, we should pay attention to the possibility of a short correction before continuing higher; some indicators have moved into overbought zones.
📊 I always share daily market analyses and analyses of digital currencies—follow me for more updates and analyses.
$ETH $BTC
#Ethereum✅ #ETH #crypto T #تحليل_العملات_الرقمية #Cryptohorizon24
2
90
·
--
Bullish
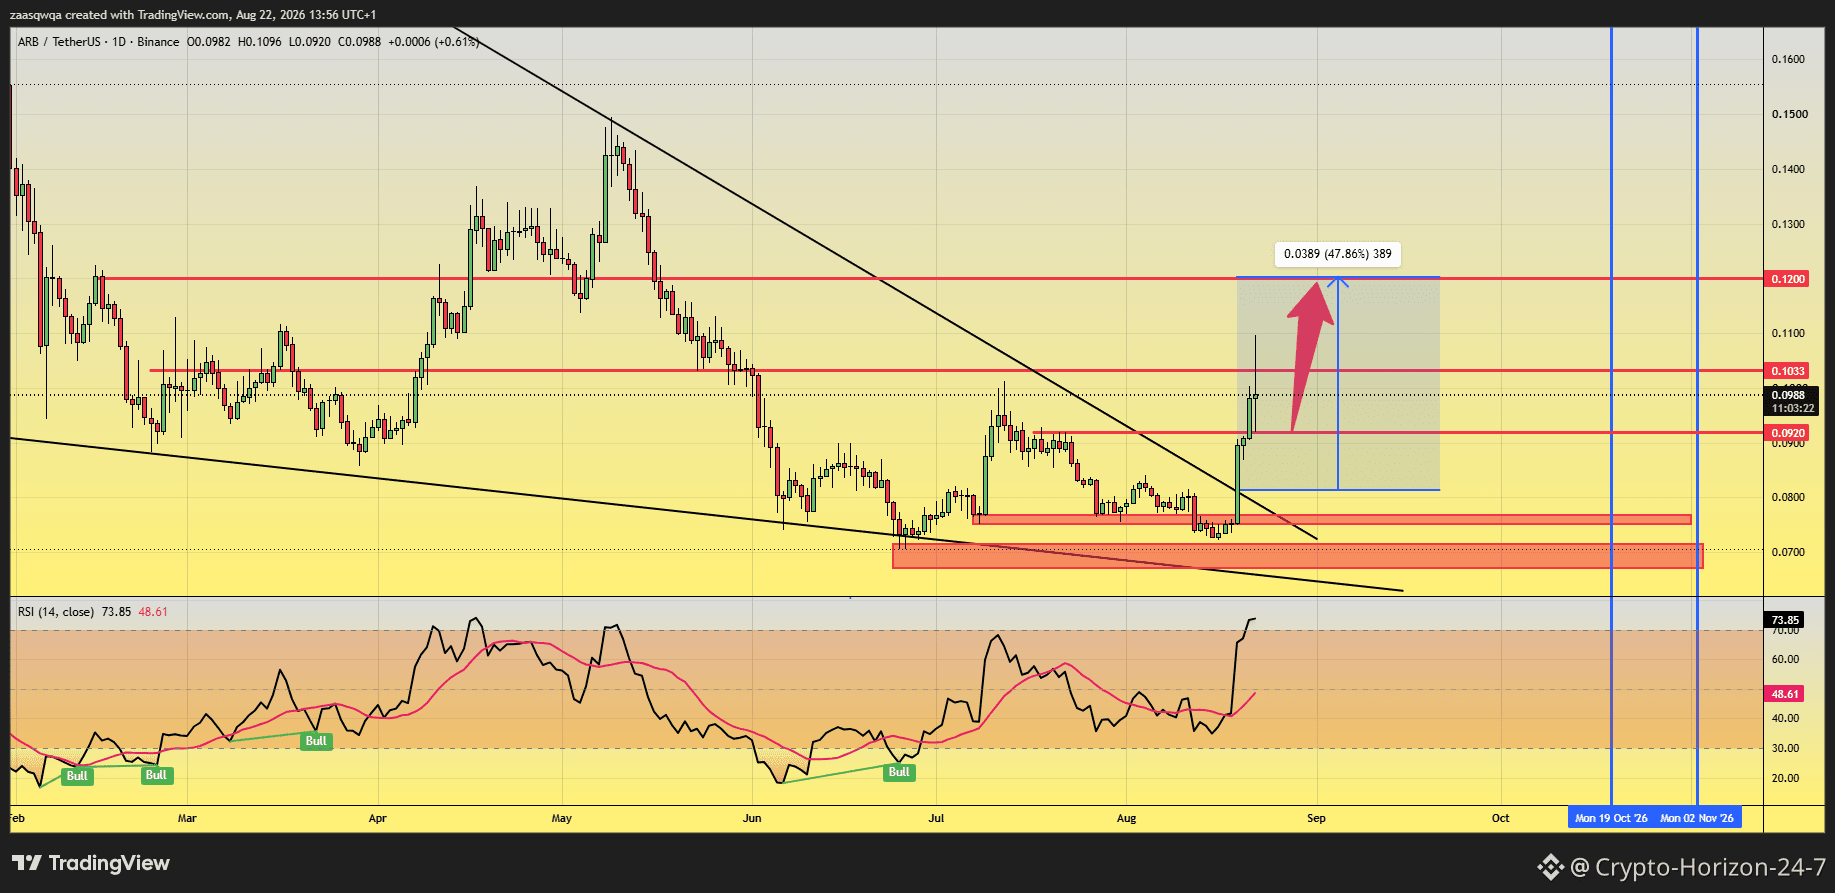
Spot currency deal $ARB is ongoing in an uptrend. As long as the upward momentum continues, God willing.
The deal so far is up 20% 🚀🚀
Target at 0.1200 with a medium resistance of 200 daily candles 👍
Following daily analyses and crypto news. Follow if you benefit and encourage me to research and publish information.
$BNB $BTC
#Binance #Cryptohorizon24 #bnb #ARB #ARB🔥🔥🔥 $$$
{spot}(BTCUSDT)
{spot}(BNBUSDT)
{spot}(ARBUSDT)
Spot currency deal $ARB is ongoing in an uptrend. As long as the upward momentum continues, God willing.
The deal so far is up 20% 🚀🚀
Target at 0.1200 with a medium resistance of 200 daily candles 👍
Following daily analyses and crypto news. Follow if you benefit and encourage me to research and publish information.
$BNB $BTC
#Binance #Cryptohorizon24 #bnb #ARB #ARB🔥🔥🔥 $$$
The deal so far is up 20% 🚀🚀
Target at 0.1200 with a medium resistance of 200 daily candles 👍
Following daily analyses and crypto news. Follow if you benefit and encourage me to research and publish information.
$BNB $BTC
#Binance #Cryptohorizon24 #bnb #ARB #ARB🔥🔥🔥 $$$
1
69
·
--
Bullish
$ARB 🚨 A strong breach/penetration for ARB may be about to begin! 🔥
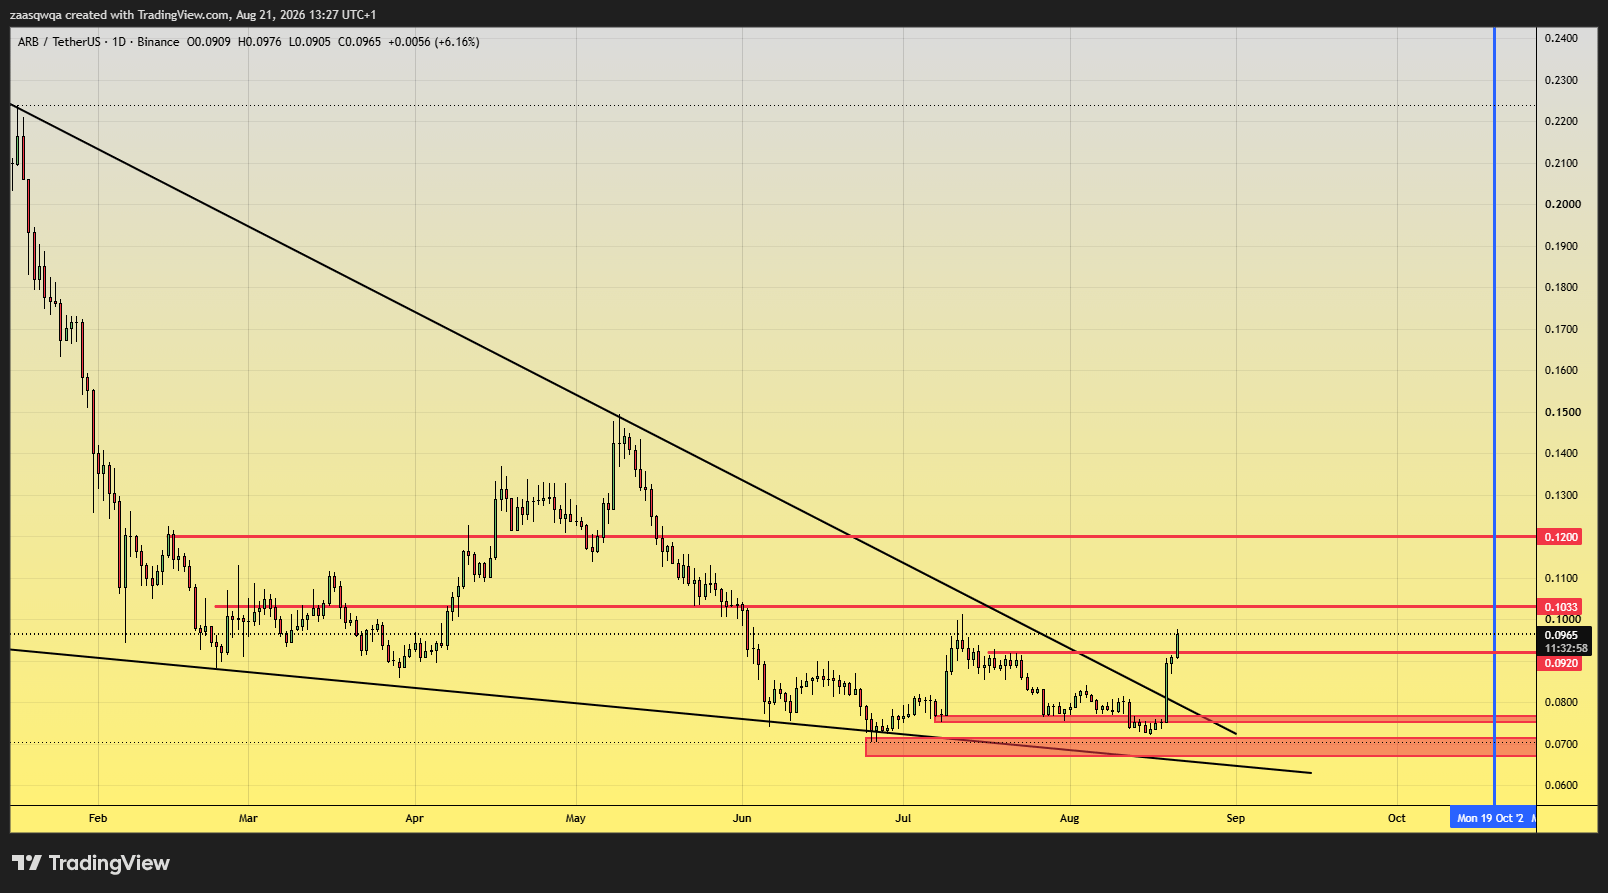
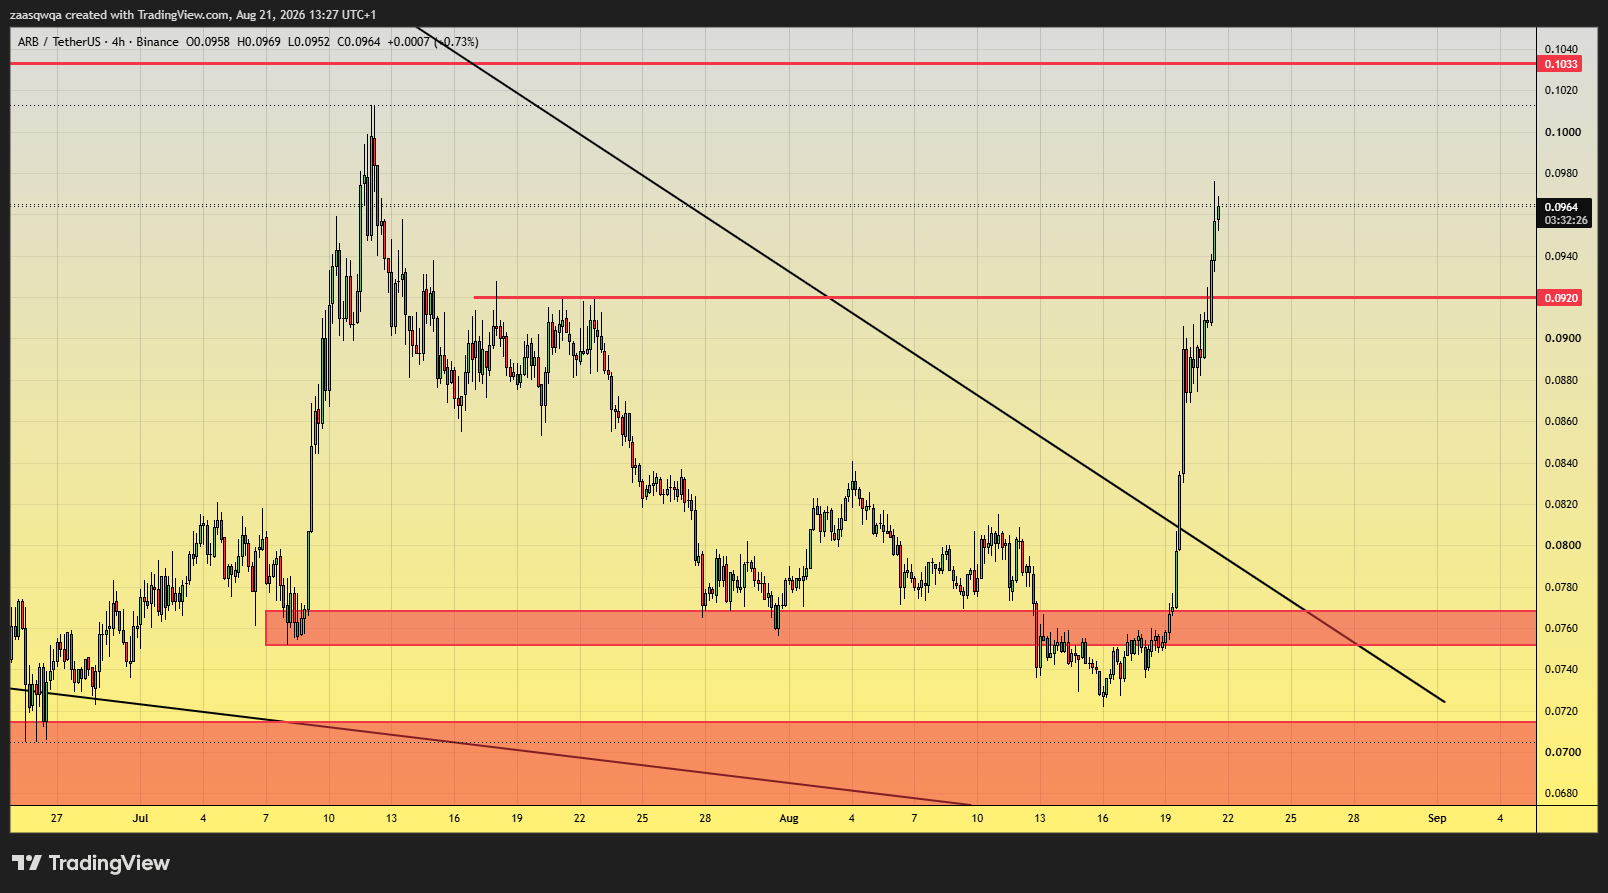
ARB coin has started showing positive signals after bouncing from the support zone of $0.067–$0.070. As the price approaches resistance at $0.092 and then $0.103, I see buying pressure increasing.
📈 My personal opinion: If ARB succeeds in breaking through $0.103 and holding above it, we may see a strong bullish price explosion 🚀, especially after a long period of pressure and decline.
🎯 The levels I’m watching:
$0.103 → $0.120 → $0.15$+
⚠️ Confirming the breakout and holding is important before considering the bullish scenario as certain.
📊 I always post daily market and cryptocurrency analyses. Follow me for more updates and analysis.
$ARB $BTC
{spot}(BTCUSDT)
{future}(ARBUSDT)
#Arbitrum #Cryptohorizon24 #ARBUSDT T #تحليل_العملات_الرقمية
$ARB 🚨 A strong breach/penetration for ARB may be about to begin! 🔥
ARB coin has started showing positive signals after bouncing from the support zone of $0.067–$0.070. As the price approaches resistance at $0.092 and then $0.103, I see buying pressure increasing.
📈 My personal opinion: If ARB succeeds in breaking through $0.103 and holding above it, we may see a strong bullish price explosion 🚀, especially after a long period of pressure and decline.
🎯 The levels I’m watching:
$0.103 → $0.120 → $0.15$+
⚠️ Confirming the breakout and holding is important before considering the bullish scenario as certain.
📊 I always post daily market and cryptocurrency analyses. Follow me for more updates and analysis.
$ARB $BTC
#Arbitrum #Cryptohorizon24 #ARBUSDT T #تحليل_العملات_الرقمية
ARB coin has started showing positive signals after bouncing from the support zone of $0.067–$0.070. As the price approaches resistance at $0.092 and then $0.103, I see buying pressure increasing.
📈 My personal opinion: If ARB succeeds in breaking through $0.103 and holding above it, we may see a strong bullish price explosion 🚀, especially after a long period of pressure and decline.
🎯 The levels I’m watching:
$0.103 → $0.120 → $0.15$+
⚠️ Confirming the breakout and holding is important before considering the bullish scenario as certain.
📊 I always post daily market and cryptocurrency analyses. Follow me for more updates and analysis.
$ARB $BTC
#Arbitrum #Cryptohorizon24 #ARBUSDT T #تحليل_العملات_الرقمية
2
209
·
--
Bullish
An Unrepeatable Opportunity or a New Trap? 📈💡
The same scene repeats in every market cycle: when prices fall and fear and doubt take over, most people pull back from buying—despite the fact that it’s often the best area to build investment positions in the long term.
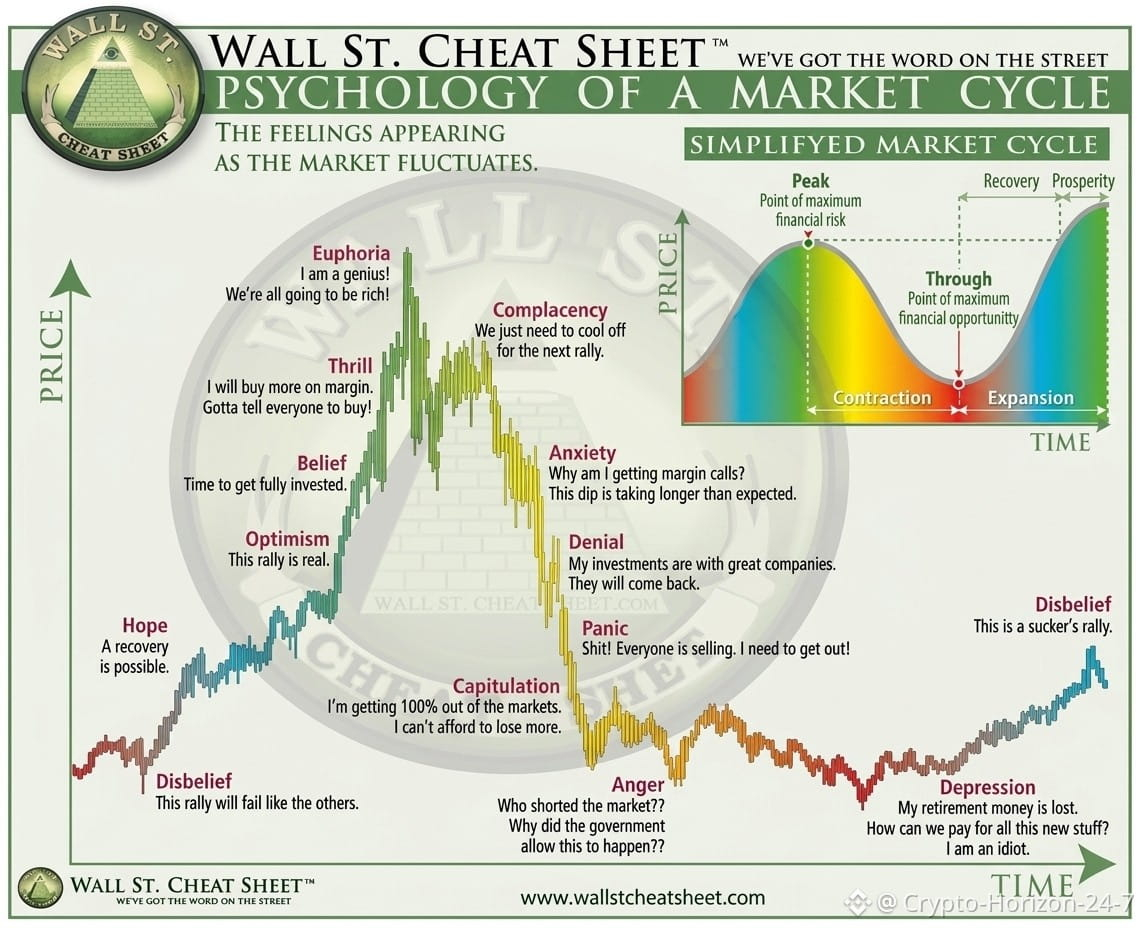
The chart illustrates the psychology of a market cycle (Psychology of a Market Cycle), and how emotions control traders’ decisions:
The Stage of Disbelief & Depression: this is the point where we see the greatest degree of financial opportunity (Point of Maximum Opportunity). Prices are at the bottom, the news is negative, and everyone loses hope.
The Stage of Optimism & Euphoria: the phase of rush-buying at the peaks—this is the most financially dangerous zone.
Conclusion:We are in the final stage before the rise #crypto
Markets don’t move in a straight line, and buying during pullbacks and calm periods requires discipline and a long-term perspective. Don’t let emotions drive your financial decisions—study your plan well before taking any step.
Follow up if you benefited from my motivation to research and share information ❤️❤️
$BTC $ETH $XRP
{spot}(XRPUSDT)
{spot}(BTCUSDT)
#TRUMP #Cryptohorizon24 #Analisatrader #Follow_Like_Comment
An Unrepeatable Opportunity or a New Trap? 📈💡
The same scene repeats in every market cycle: when prices fall and fear and doubt take over, most people pull back from buying—despite the fact that it’s often the best area to build investment positions in the long term.
The chart illustrates the psychology of a market cycle (Psychology of a Market Cycle), and how emotions control traders’ decisions:
The Stage of Disbelief & Depression: this is the point where we see the greatest degree of financial opportunity (Point of Maximum Opportunity). Prices are at the bottom, the news is negative, and everyone loses hope.
The Stage of Optimism & Euphoria: the phase of rush-buying at the peaks—this is the most financially dangerous zone.
Conclusion:We are in the final stage before the rise #crypto
Markets don’t move in a straight line, and buying during pullbacks and calm periods requires discipline and a long-term perspective. Don’t let emotions drive your financial decisions—study your plan well before taking any step.
Follow up if you benefited from my motivation to research and share information ❤️❤️
$BTC $ETH $XRP
#TRUMP #Cryptohorizon24 #Analisatrader #Follow_Like_Comment
The same scene repeats in every market cycle: when prices fall and fear and doubt take over, most people pull back from buying—despite the fact that it’s often the best area to build investment positions in the long term.
The chart illustrates the psychology of a market cycle (Psychology of a Market Cycle), and how emotions control traders’ decisions:
The Stage of Disbelief & Depression: this is the point where we see the greatest degree of financial opportunity (Point of Maximum Opportunity). Prices are at the bottom, the news is negative, and everyone loses hope.
The Stage of Optimism & Euphoria: the phase of rush-buying at the peaks—this is the most financially dangerous zone.
Conclusion:We are in the final stage before the rise #crypto
Markets don’t move in a straight line, and buying during pullbacks and calm periods requires discipline and a long-term perspective. Don’t let emotions drive your financial decisions—study your plan well before taking any step.
Follow up if you benefited from my motivation to research and share information ❤️❤️
$BTC $ETH $XRP
#TRUMP #Cryptohorizon24 #Analisatrader #Follow_Like_Comment
2
53
Article
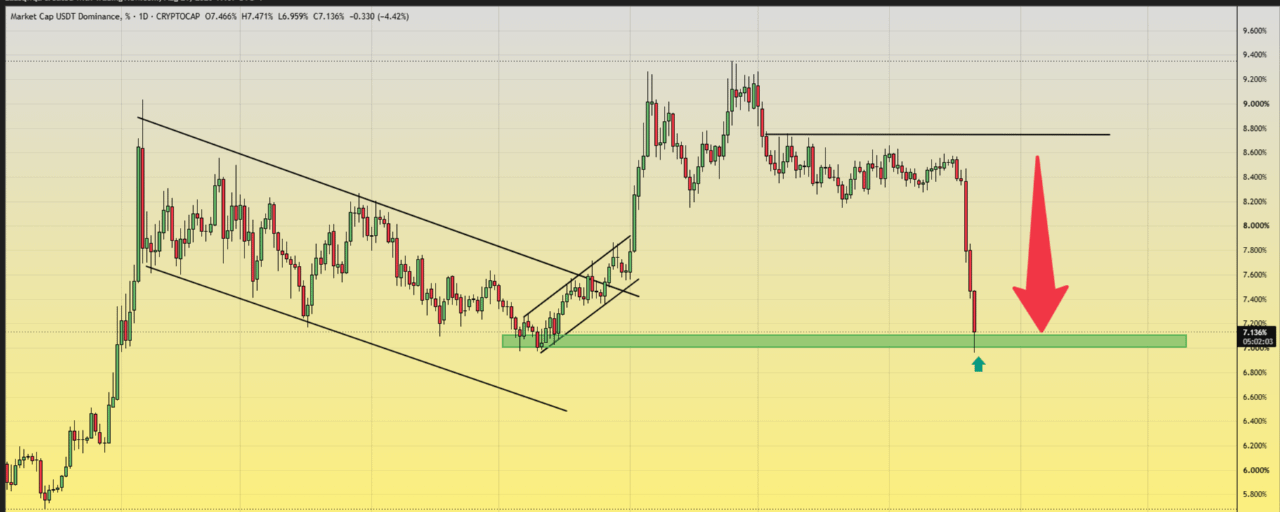
Analysis of USDT Dominance: The Fear and Greed Indicator in Crypto MarketsIn the volatile world of cryptocurrencies, USDT stablecoin stands out as a safe haven for traders. But what rising or falling dominance truly means is a more complex story. The attached chart dated 2026-08-21 shows USDT dominance at 7.155%, recording a notable decline of 4.16% on the day. This figure is not just a statistic—it is a gauge of fear and confidence in the market.
What is USDT Dominance?
The USDT dominance ratio (USDT.D) measures Tether's (USDT) share of the total cryptocurrency market capitalization. Since USDT is a stablecoin pegged to the US dollar, it functions as "digital cash" that traders use to hedge against volatility and to purchase other digital assets.
The Inverse Relationship with Bitcoin and the Market
There is a clear inverse relationship between USDT dominance and Bitcoin's price. When USDT.D rises, it means traders are selling their cryptocurrencies (especially Bitcoin and altcoins) and moving into USDT as a safe haven, anticipating price drops. Conversely, when USDT dominance falls, it signals a shift from USDT back into cryptocurrencies, reflecting confidence in rising prices.
Chart Analysis
The chart provided shows that USDT dominance has experienced a sharp decline from higher levels (near 9.6%) to settle at 7.155%. This significant drop can be interpreted in several ways:
1. "Risk-On" Signal
The decline in USDT dominance, as clearly shown in the chart, is considered a positive signal for the market. It means investors are beginning to move out of their safe haven (USDT) and inject money back into cryptocurrencies, anticipating an upward move. As one analyst on TradingView commented, this breakdown below the 8.17% level had already triggered "market participants to rush out of cash into risk assets, helping to fuel the major breakout in cryptocurrencies that followed."
2. Triple Bottom Formation
Technical analysis suggests that the dominance ratio may have formed a "triple bottom" around the 7% level, which is a key support zone. This technical pattern could indicate a potential rebound in dominance to the upside, which might signal a corrective wave in the crypto market soon.
3. Comparison with Previous Patterns
Analysts compare the current situation to similar patterns that occurred in 2022, when USDT dominance traded within an accumulation range between 5.8% and 9.5% during the bear market bottom. When it rebounded from the upper zone, capital began flowing back into risk assets, leading to a new upward wave.
What Does This Mean for Investors?
Declining USDT Dominance: Often a bullish signal, indicating a shift in market sentiment from fear to confidence, and could be a prelude to rising cryptocurrency prices. The current reading of 7.155% is relatively low compared to previous peaks, reinforcing this interpretation.
Rising USDT Dominance: Considered a bearish signal, as investors prefer to hold cash in anticipation of further declines. The "golden cross" phenomenon that previously occurred on the dominance chart was a precursor to a Bitcoin correction.
Conclusion
USDT dominance is not just a number—it is a "fear gauge" reflecting market psychology. The current decline to 7.155% as shown in the chart is a positive development, but caution is warranted. History shows that dominance can bounce off support levels, potentially leading to short-term corrections. Therefore, investors should monitor this indicator closely, especially around key support and resistance levels, and use it as a supplementary tool alongside other technical and fundamental analyses to make informed investment decisions.
Follow me if you found this helpful; it motivates me to research and share information.
$BTC $ETH $XRP
{spot}(XRPUSDT)
{spot}(ETHUSDT)
{spot}(BTCUSDT)
#Cryptohorizon24 #USDT.D #Follow_Like_Comment
Analysis of USDT Dominance: The Fear and Greed Indicator in Crypto Markets
In the volatile world of cryptocurrencies, USDT stablecoin stands out as a safe haven for traders. But what rising or falling dominance truly means is a more complex story. The attached chart dated 2026-08-21 shows USDT dominance at 7.155%, recording a notable decline of 4.16% on the day. This figure is not just a statistic—it is a gauge of fear and confidence in the market.
What is USDT Dominance?
The USDT dominance ratio (USDT.D) measures Tether's (USDT) share of the total cryptocurrency market capitalization. Since USDT is a stablecoin pegged to the US dollar, it functions as "digital cash" that traders use to hedge against volatility and to purchase other digital assets.
The Inverse Relationship with Bitcoin and the Market
There is a clear inverse relationship between USDT dominance and Bitcoin's price. When USDT.D rises, it means traders are selling their cryptocurrencies (especially Bitcoin and altcoins) and moving into USDT as a safe haven, anticipating price drops. Conversely, when USDT dominance falls, it signals a shift from USDT back into cryptocurrencies, reflecting confidence in rising prices.
Chart Analysis
The chart provided shows that USDT dominance has experienced a sharp decline from higher levels (near 9.6%) to settle at 7.155%. This significant drop can be interpreted in several ways:
1. "Risk-On" Signal
The decline in USDT dominance, as clearly shown in the chart, is considered a positive signal for the market. It means investors are beginning to move out of their safe haven (USDT) and inject money back into cryptocurrencies, anticipating an upward move. As one analyst on TradingView commented, this breakdown below the 8.17% level had already triggered "market participants to rush out of cash into risk assets, helping to fuel the major breakout in cryptocurrencies that followed."
2. Triple Bottom Formation
Technical analysis suggests that the dominance ratio may have formed a "triple bottom" around the 7% level, which is a key support zone. This technical pattern could indicate a potential rebound in dominance to the upside, which might signal a corrective wave in the crypto market soon.
3. Comparison with Previous Patterns
Analysts compare the current situation to similar patterns that occurred in 2022, when USDT dominance traded within an accumulation range between 5.8% and 9.5% during the bear market bottom. When it rebounded from the upper zone, capital began flowing back into risk assets, leading to a new upward wave.
What Does This Mean for Investors?
Declining USDT Dominance: Often a bullish signal, indicating a shift in market sentiment from fear to confidence, and could be a prelude to rising cryptocurrency prices. The current reading of 7.155% is relatively low compared to previous peaks, reinforcing this interpretation.
Rising USDT Dominance: Considered a bearish signal, as investors prefer to hold cash in anticipation of further declines. The "golden cross" phenomenon that previously occurred on the dominance chart was a precursor to a Bitcoin correction.
Conclusion
USDT dominance is not just a number—it is a "fear gauge" reflecting market psychology. The current decline to 7.155% as shown in the chart is a positive development, but caution is warranted. History shows that dominance can bounce off support levels, potentially leading to short-term corrections. Therefore, investors should monitor this indicator closely, especially around key support and resistance levels, and use it as a supplementary tool alongside other technical and fundamental analyses to make informed investment decisions.
Follow me if you found this helpful; it motivates me to research and share information.
$BTC $ETH $XRP
#Cryptohorizon24 #USDT.D #Follow_Like_Comment
What is USDT Dominance?
The USDT dominance ratio (USDT.D) measures Tether's (USDT) share of the total cryptocurrency market capitalization. Since USDT is a stablecoin pegged to the US dollar, it functions as "digital cash" that traders use to hedge against volatility and to purchase other digital assets.
The Inverse Relationship with Bitcoin and the Market
There is a clear inverse relationship between USDT dominance and Bitcoin's price. When USDT.D rises, it means traders are selling their cryptocurrencies (especially Bitcoin and altcoins) and moving into USDT as a safe haven, anticipating price drops. Conversely, when USDT dominance falls, it signals a shift from USDT back into cryptocurrencies, reflecting confidence in rising prices.
Chart Analysis
The chart provided shows that USDT dominance has experienced a sharp decline from higher levels (near 9.6%) to settle at 7.155%. This significant drop can be interpreted in several ways:
1. "Risk-On" Signal
The decline in USDT dominance, as clearly shown in the chart, is considered a positive signal for the market. It means investors are beginning to move out of their safe haven (USDT) and inject money back into cryptocurrencies, anticipating an upward move. As one analyst on TradingView commented, this breakdown below the 8.17% level had already triggered "market participants to rush out of cash into risk assets, helping to fuel the major breakout in cryptocurrencies that followed."
2. Triple Bottom Formation
Technical analysis suggests that the dominance ratio may have formed a "triple bottom" around the 7% level, which is a key support zone. This technical pattern could indicate a potential rebound in dominance to the upside, which might signal a corrective wave in the crypto market soon.
3. Comparison with Previous Patterns
Analysts compare the current situation to similar patterns that occurred in 2022, when USDT dominance traded within an accumulation range between 5.8% and 9.5% during the bear market bottom. When it rebounded from the upper zone, capital began flowing back into risk assets, leading to a new upward wave.
What Does This Mean for Investors?
Declining USDT Dominance: Often a bullish signal, indicating a shift in market sentiment from fear to confidence, and could be a prelude to rising cryptocurrency prices. The current reading of 7.155% is relatively low compared to previous peaks, reinforcing this interpretation.
Rising USDT Dominance: Considered a bearish signal, as investors prefer to hold cash in anticipation of further declines. The "golden cross" phenomenon that previously occurred on the dominance chart was a precursor to a Bitcoin correction.
Conclusion
USDT dominance is not just a number—it is a "fear gauge" reflecting market psychology. The current decline to 7.155% as shown in the chart is a positive development, but caution is warranted. History shows that dominance can bounce off support levels, potentially leading to short-term corrections. Therefore, investors should monitor this indicator closely, especially around key support and resistance levels, and use it as a supplementary tool alongside other technical and fundamental analyses to make informed investment decisions.
Follow me if you found this helpful; it motivates me to research and share information.
$BTC $ETH $XRP
#Cryptohorizon24 #USDT.D #Follow_Like_Comment
3
183
Log in to explore more content
Join global crypto users on Binance Square
⚡️ Get latest and useful information about crypto.
💬 Trusted by the world’s largest crypto exchange.
👍 Discover real insights from verified creators.
Email / Phone number
Trending Topics
1
#BinanceLaunchesBinanceIntelligence
39,249 views
484 Discussing
2
#EvernorthXRPTreasuryCompletesSPACMerger
34,701 views
327 Discussing
3
#ADAGains10%Above$0.27
31,495 views
211 Discussing
4
#ETHUp70%InQ3ButLiquidityFalls
226,266 views
1,411 Discussing
5
#EthStakingExitQueueHits2026High
83,793 views
957 Discussing
6
#FedOctoberHoldOdds82.3%
85,568 views
933 Discussing
7
#Nikkei225Jumps2.5%ToThreeMonthHigh
95,331 views
1,231 Discussing
8
#CircleMints$2.75BUSDCOnSolanaIn7Days
2,554 views
58 Discussing
9
#DriftHackVictimsBeginClaims
200,808 views
1,884 Discussing
10
#SolanaTokenizedStockVolumeTops$4.4BInSeptember
14,743 views
136 Discussing