
#bitcoinactivesupplyinprofitdropsbelow45
bitcoinactivesupplyinprofitdropsbelow45
401 views
14 Discussing
Hot
Latest


Article
Bitcoin Below 45%₿ Bitcoin Active Supply in Profit Drops Below 45% — Is More Pain Coming?
A major shift is happening in the Bitcoin market!
When less than 45% of Bitcoin's active supply is in profit, it signals that a large portion of holders may be facing unrealized losses.
But what does this mean for the market?
🔸 Is this a sign of growing bearish pressure?
🔸 Could panic selling push BTC even lower?
🔸 Or are long-term investors getting closer to a potential accumulation opportunity?
Historically, periods of widespread unrealized losses have sometimes created opportunities for patient investors.
However, market confirmation is always important.
What's your view? Is Bitcoin preparing for another drop, or are we getting closer to a strong recovery?
#BitcoinActiveSupplyInProfitDropsBelow45
Bitcoin Below 45%
₿ Bitcoin Active Supply in Profit Drops Below 45% — Is More Pain Coming?
A major shift is happening in the Bitcoin market!
When less than 45% of Bitcoin's active supply is in profit, it signals that a large portion of holders may be facing unrealized losses.
But what does this mean for the market?
🔸 Is this a sign of growing bearish pressure?
🔸 Could panic selling push BTC even lower?
🔸 Or are long-term investors getting closer to a potential accumulation opportunity?
Historically, periods of widespread unrealized losses have sometimes created opportunities for patient investors.
However, market confirmation is always important.
What's your view? Is Bitcoin preparing for another drop, or are we getting closer to a strong recovery?
#BitcoinActiveSupplyInProfitDropsBelow45
A major shift is happening in the Bitcoin market!
When less than 45% of Bitcoin's active supply is in profit, it signals that a large portion of holders may be facing unrealized losses.
But what does this mean for the market?
🔸 Is this a sign of growing bearish pressure?
🔸 Could panic selling push BTC even lower?
🔸 Or are long-term investors getting closer to a potential accumulation opportunity?
Historically, periods of widespread unrealized losses have sometimes created opportunities for patient investors.
However, market confirmation is always important.
What's your view? Is Bitcoin preparing for another drop, or are we getting closer to a strong recovery?
#BitcoinActiveSupplyInProfitDropsBelow45
95

·
--
More than half of Bitcoin's active supply is underwater right now. CryptoQuant analyst Darkfost flagged it today: less than 45% of the active supply is in profit once you exclude coins that haven't moved in ten years, so most of the coins actually trading are sitting on losses. Historically this metric dipping under 40% has lined up with correction bottoms, and we're not far from that zone. Meanwhile BTC is hovering around $67,400 after briefly dipping under $67,000, Strategy is now sitting on a $6.85 billion unrealized loss on its 850,364 BTC, and the fear index is at 16, deep in extreme fear. Everyone is hurting, which is usually when bottoms start forming, or when things get worse before they get better. Are you buying into this pain, or waiting for that sub-40% print first? #BitcoinActiveSupplyInProfitDropsBelow45% $BTC
More than half of Bitcoin's active supply is underwater right now. CryptoQuant analyst Darkfost flagged it today: less than 45% of the active supply is in profit once you exclude coins that haven't moved in ten years, so most of the coins actually trading are sitting on losses. Historically this metric dipping under 40% has lined up with correction bottoms, and we're not far from that zone. Meanwhile BTC is hovering around $67,400 after briefly dipping under $67,000, Strategy is now sitting on a $6.85 billion unrealized loss on its 850,364 BTC, and the fear index is at 16, deep in extreme fear. Everyone is hurting, which is usually when bottoms start forming, or when things get worse before they get better. Are you buying into this pain, or waiting for that sub-40% print first? #BitcoinActiveSupplyInProfitDropsBelow45% $BTC

32


Bitcoin's active supply held by profitable addresses has fallen below the 45% threshold, a significant indicator often watched by traders. This metric suggests that a smaller portion of circulating BTC is currently in profit, which could signal a shift in market sentiment or potential accumulation phases. Historically, such drops have preceded periods of recovery or consolidation, as holders who are underwater might be less inclined to sell, while those still in profit might be cautious. The current market dynamics warrant close observation to see if this trend continues and what impact it has on future price movements for $BTC.
Disclaimer: This is not investment advice.
#BitcoinActiveSupplyInProfitDropsBelow45% $BTC
Bitcoin's active supply held by profitable addresses has fallen below the 45% threshold, a significant indicator often watched by traders. This metric suggests that a smaller portion of circulating BTC is currently in profit, which could signal a shift in market sentiment or potential accumulation phases. Historically, such drops have preceded periods of recovery or consolidation, as holders who are underwater might be less inclined to sell, while those still in profit might be cautious. The current market dynamics warrant close observation to see if this trend continues and what impact it has on future price movements for $BTC .
Disclaimer: This is not investment advice.
#BitcoinActiveSupplyInProfitDropsBelow45% $BTC
Disclaimer: This is not investment advice.
#BitcoinActiveSupplyInProfitDropsBelow45% $BTC
41

·
--
#BitcoinActiveSupplyInProfitDropsBelow45%
🧊 Under 45% in Profit. History Says Watch 40%
More active BTC now sits at a loss than in profit, a stress sign seen late in sell-offs.
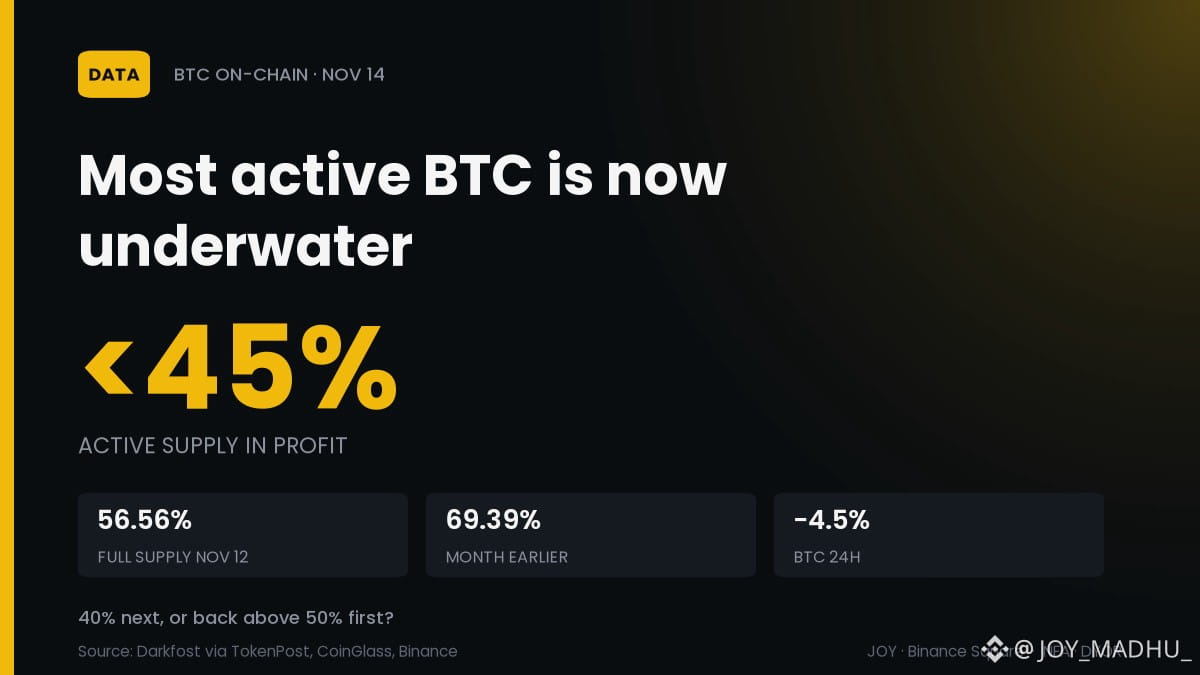
📊 Under 45% of active supply in profit (Darkfost, ex 10Y+ dormant coins)
📈 Full supply: 56.56% in profit Nov 12 vs 69.39% a month earlier
📉 BTC ~$66,070, down ~4.5% in 24h and ~13% since Nov 7 close
⚠️ Readings under 40% have often lined up with pullback lows
My read: a stress gauge, not a bottom signal on its own.
Will active supply in profit hit 40% before Dec 31, or climb back above 50% first? 👇
$BTC
#BitcoinActiveSupplyInProfitDropsBelow45% #BTC #OnChain
#BitcoinActiveSupplyInProfitDropsBelow45%
🧊 Under 45% in Profit. History Says Watch 40%
More active BTC now sits at a loss than in profit, a stress sign seen late in sell-offs.
📊 Under 45% of active supply in profit (Darkfost, ex 10Y+ dormant coins)
📈 Full supply: 56.56% in profit Nov 12 vs 69.39% a month earlier
📉 BTC ~$66,070, down ~4.5% in 24h and ~13% since Nov 7 close
⚠️ Readings under 40% have often lined up with pullback lows
My read: a stress gauge, not a bottom signal on its own.
Will active supply in profit hit 40% before Dec 31, or climb back above 50% first? 👇
$BTC
#BitcoinActiveSupplyInProfitDropsBelow45% #BTC #OnChain
🧊 Under 45% in Profit. History Says Watch 40%
More active BTC now sits at a loss than in profit, a stress sign seen late in sell-offs.
📊 Under 45% of active supply in profit (Darkfost, ex 10Y+ dormant coins)
📈 Full supply: 56.56% in profit Nov 12 vs 69.39% a month earlier
📉 BTC ~$66,070, down ~4.5% in 24h and ~13% since Nov 7 close
⚠️ Readings under 40% have often lined up with pullback lows
My read: a stress gauge, not a bottom signal on its own.
Will active supply in profit hit 40% before Dec 31, or climb back above 50% first? 👇
$BTC
#BitcoinActiveSupplyInProfitDropsBelow45% #BTC #OnChain
3

·
--
BTC Active Supply in Loss Gains Attention | 45% and 54% Use Different Metrics | I’ll Manage Risk Before Considering a Rebound
My stance is defensive. Binance Square is discussing the claim that “the share of active BTC supply in profit has fallen below 45%.” That figure is worth watching, but it should not be presented as meaning that only 45% of all BTC is in profit. The Binance News post explicitly says that coins unmoved for more than ten years were excluded from the calculation. I also checked Glassnode’s public “Percent of Bitcoin Supply in Profit” page, which shows approximately 54.277% based on a broader definition of supply. The two figures cover different sets of coins, so the difference alone is not enough to say which one is wrong, nor should 45% be described as a confirmed on-chain figure for all BTC. The original report did not provide an active-supply data series that I could independently verify, so I treat 45% as that report’s estimate, not as a precise trading signal.
Why does this matter for BTC? A falling share of supply in profit means more participants have a cost basis above the current price, which could lead to selling pressure from holders looking to break even during a rebound. At the same time, a concentration of unrealized losses may draw contrarian investors’ attention to the potential for mean reversion. But the indicator cannot tell us when selling pressure will end, and whether coins that have been unmoved for ten years are included can significantly change the denominator. Glassnode defines the share of total supply in profit by comparing the price of each Bitcoin UTXO when it was created with the current price. It measures unrealized profit and loss; it is not exchange deposits or a prediction of how much BTC will inevitably be sold. Calling a bottom based on a single threshold risks mistaking a statistical description for an entry trigger.
The market reaction is more immediate than the headline. Binance’s public BTC/USDT 24-hour market data shows a latest price of around $65,114, down approximately 4.8% over 24 hours, with an intraday low near $65,067. That is another step down from the roughly $66,662 I recorded last time. Price data and on-chain indicators reflect different points in time, so we cannot conclude that this drop was caused entirely by this data point. My near-term areas to watch are $65,000 and the intraday-low zone. If prices remain below them, my short-term stabilization thesis is invalidated. To the upside, I’ll look first at $66,000, then $66,800. Only if price reclaims and holds above that area would it make sense to turn the idea of “a large share of supply in loss” into a rebound plan.
If I were trading this myself, I would stay out for now and consider only a small spot long after confirmation—not try to catch a sharp drop. If price reclaims and holds above $66,000, then retests and holds that level, I would use no more than 2% of my total capital to test an entry. The first target would be $66,800, where I’d take half off; I’d hold the rest for $68,000. I’d set the initial stop below $64,900, with predefined risk on the trade capped at 0.4% of my account. If price falls back below $65,000 after entry, or if the rebound lacks sustained volume and reverses after a brief rise, I’d close the remaining position. If price breaks below $65,000 first, I’d cancel the entry plan and reassess after a new low. If no trigger occurs, I’ll stay in cash; a plan is not a trade.
Sources: Binance Square trending topics and the original Binance News post, Glassnode’s public indicator definition, and Binance’s public BTC/USDT market data. #BitcoinActiveSupplyInProfitDropsBelow45% #BTC
The above is solely my personal market observation and does not constitute investment advice.
BTC Active Supply in Loss Gains Attention | 45% and 54% Use Different Metrics | I’ll Manage Risk Before Considering a Rebound
My stance is defensive. Binance Square is discussing the claim that “the share of active BTC supply in profit has fallen below 45%.” That figure is worth watching, but it should not be presented as meaning that only 45% of all BTC is in profit. The Binance News post explicitly says that coins unmoved for more than ten years were excluded from the calculation. I also checked Glassnode’s public “Percent of Bitcoin Supply in Profit” page, which shows approximately 54.277% based on a broader definition of supply. The two figures cover different sets of coins, so the difference alone is not enough to say which one is wrong, nor should 45% be described as a confirmed on-chain figure for all BTC. The original report did not provide an active-supply data series that I could independently verify, so I treat 45% as that report’s estimate, not as a precise trading signal.
Why does this matter for BTC? A falling share of supply in profit means more participants have a cost basis above the current price, which could lead to selling pressure from holders looking to break even during a rebound. At the same time, a concentration of unrealized losses may draw contrarian investors’ attention to the potential for mean reversion. But the indicator cannot tell us when selling pressure will end, and whether coins that have been unmoved for ten years are included can significantly change the denominator. Glassnode defines the share of total supply in profit by comparing the price of each Bitcoin UTXO when it was created with the current price. It measures unrealized profit and loss; it is not exchange deposits or a prediction of how much BTC will inevitably be sold. Calling a bottom based on a single threshold risks mistaking a statistical description for an entry trigger.
The market reaction is more immediate than the headline. Binance’s public BTC/USDT 24-hour market data shows a latest price of around $65,114, down approximately 4.8% over 24 hours, with an intraday low near $65,067. That is another step down from the roughly $66,662 I recorded last time. Price data and on-chain indicators reflect different points in time, so we cannot conclude that this drop was caused entirely by this data point. My near-term areas to watch are $65,000 and the intraday-low zone. If prices remain below them, my short-term stabilization thesis is invalidated. To the upside, I’ll look first at $66,000, then $66,800. Only if price reclaims and holds above that area would it make sense to turn the idea of “a large share of supply in loss” into a rebound plan.
If I were trading this myself, I would stay out for now and consider only a small spot long after confirmation—not try to catch a sharp drop. If price reclaims and holds above $66,000, then retests and holds that level, I would use no more than 2% of my total capital to test an entry. The first target would be $66,800, where I’d take half off; I’d hold the rest for $68,000. I’d set the initial stop below $64,900, with predefined risk on the trade capped at 0.4% of my account. If price falls back below $65,000 after entry, or if the rebound lacks sustained volume and reverses after a brief rise, I’d close the remaining position. If price breaks below $65,000 first, I’d cancel the entry plan and reassess after a new low. If no trigger occurs, I’ll stay in cash; a plan is not a trade.
Sources: Binance Square trending topics and the original Binance News post, Glassnode’s public indicator definition, and Binance’s public BTC/USDT market data. #BitcoinActiveSupplyInProfitDropsBelow45% #BTC
The above is solely my personal market observation and does not constitute investment advice.
My stance is defensive. Binance Square is discussing the claim that “the share of active BTC supply in profit has fallen below 45%.” That figure is worth watching, but it should not be presented as meaning that only 45% of all BTC is in profit. The Binance News post explicitly says that coins unmoved for more than ten years were excluded from the calculation. I also checked Glassnode’s public “Percent of Bitcoin Supply in Profit” page, which shows approximately 54.277% based on a broader definition of supply. The two figures cover different sets of coins, so the difference alone is not enough to say which one is wrong, nor should 45% be described as a confirmed on-chain figure for all BTC. The original report did not provide an active-supply data series that I could independently verify, so I treat 45% as that report’s estimate, not as a precise trading signal.
Why does this matter for BTC? A falling share of supply in profit means more participants have a cost basis above the current price, which could lead to selling pressure from holders looking to break even during a rebound. At the same time, a concentration of unrealized losses may draw contrarian investors’ attention to the potential for mean reversion. But the indicator cannot tell us when selling pressure will end, and whether coins that have been unmoved for ten years are included can significantly change the denominator. Glassnode defines the share of total supply in profit by comparing the price of each Bitcoin UTXO when it was created with the current price. It measures unrealized profit and loss; it is not exchange deposits or a prediction of how much BTC will inevitably be sold. Calling a bottom based on a single threshold risks mistaking a statistical description for an entry trigger.
The market reaction is more immediate than the headline. Binance’s public BTC/USDT 24-hour market data shows a latest price of around $65,114, down approximately 4.8% over 24 hours, with an intraday low near $65,067. That is another step down from the roughly $66,662 I recorded last time. Price data and on-chain indicators reflect different points in time, so we cannot conclude that this drop was caused entirely by this data point. My near-term areas to watch are $65,000 and the intraday-low zone. If prices remain below them, my short-term stabilization thesis is invalidated. To the upside, I’ll look first at $66,000, then $66,800. Only if price reclaims and holds above that area would it make sense to turn the idea of “a large share of supply in loss” into a rebound plan.
If I were trading this myself, I would stay out for now and consider only a small spot long after confirmation—not try to catch a sharp drop. If price reclaims and holds above $66,000, then retests and holds that level, I would use no more than 2% of my total capital to test an entry. The first target would be $66,800, where I’d take half off; I’d hold the rest for $68,000. I’d set the initial stop below $64,900, with predefined risk on the trade capped at 0.4% of my account. If price falls back below $65,000 after entry, or if the rebound lacks sustained volume and reverses after a brief rise, I’d close the remaining position. If price breaks below $65,000 first, I’d cancel the entry plan and reassess after a new low. If no trigger occurs, I’ll stay in cash; a plan is not a trade.
Sources: Binance Square trending topics and the original Binance News post, Glassnode’s public indicator definition, and Binance’s public BTC/USDT market data. #BitcoinActiveSupplyInProfitDropsBelow45% #BTC
The above is solely my personal market observation and does not constitute investment advice.

14

·
--
“It fell $BTC below $66,000… Should I sell before I lose more?”
The Fear and Greed Index is at 16 (extreme fear). Less than 45% of the active supply is in profit, meaning most new buyers are at a loss.
Selling out of fear turns a paper loss into a real loss.
Will you sell now or hold on?
#BitcoinActiveSupplyInProfitDropsBelow45% #Bitcoin
“It fell $BTC below $66,000… Should I sell before I lose more?”
The Fear and Greed Index is at 16 (extreme fear). Less than 45% of the active supply is in profit, meaning most new buyers are at a loss.
Selling out of fear turns a paper loss into a real loss.
Will you sell now or hold on?
#BitcoinActiveSupplyInProfitDropsBelow45% #Bitcoin
The Fear and Greed Index is at 16 (extreme fear). Less than 45% of the active supply is in profit, meaning most new buyers are at a loss.
Selling out of fear turns a paper loss into a real loss.
Will you sell now or hold on?
#BitcoinActiveSupplyInProfitDropsBelow45% #Bitcoin

106

·
--
Bullish
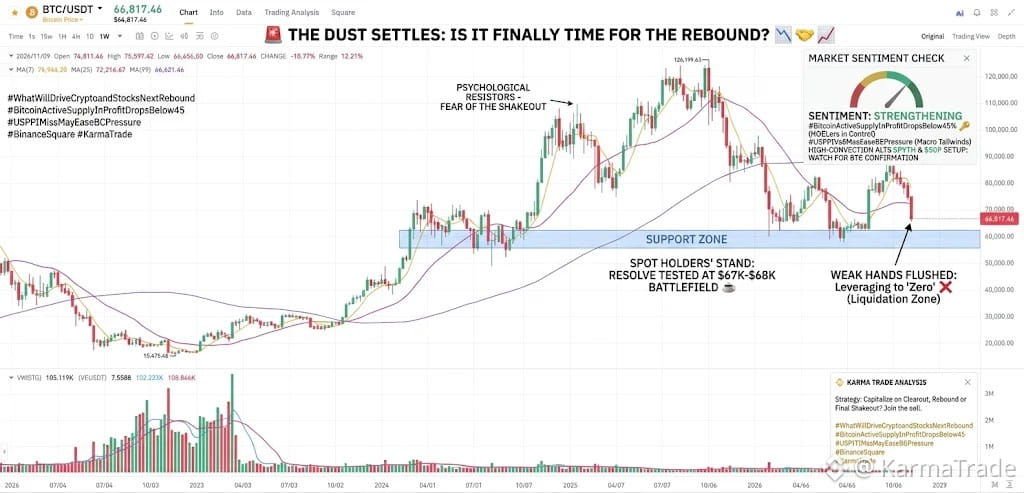
🚨 THE DUST SETTLES: IS IT FINALLY TIME FOR THE REBOUND? 📉🤝📈
Remember all those panic posts on Crypto Twitter 48 hours ago screaming "Pack it up, zero is coming!"?
Well, look at the charts today. While the leverage junkies were busy liquidating their souls down toward $67,081, spot holders are sipping coffee and watching the market test everyone's psychological resolve.
Let’s check the reality of the board today:
$BTC is holding ground around the $67K–$68K battlefield, forcing a massive reality check on active supply. Did you know #BitcoinActiveSupplyInProfitDropsBelow45%? Translation: The weak hands are officially flushed, and only the conviction holders are left holding the keys.
Macro cross-currents are swirling: With #USPPIMissMayEaseBCPressure taking some heat off risk assets, the entire market is asking one question: #WhatWillDriveCryptoandStocks’NextRebound?
Meanwhile, high-conviction altcoins like $PYTH and $XRP are setting up for the next major move once BTC confirms its floor.
Let’s talk strategy: With weak hands cleared out and macro pressure easing—is it finally time for the big rebound, or are we due for one more shakeout first?
Drop your call below! 👇📊
#WhatWillDriveCryptoandStocksNextRebound #BitcoinActiveSupplyInProfitDropsBelow45 #USPPIMissMayEaseBCPressure #BinanceSquare
{spot}(BTCUSDT)
🚨 THE DUST SETTLES: IS IT FINALLY TIME FOR THE REBOUND? 📉🤝📈
Remember all those panic posts on Crypto Twitter 48 hours ago screaming "Pack it up, zero is coming!"?
Well, look at the charts today. While the leverage junkies were busy liquidating their souls down toward $67,081, spot holders are sipping coffee and watching the market test everyone's psychological resolve.
Let’s check the reality of the board today:
$BTC is holding ground around the $67K–$68K battlefield, forcing a massive reality check on active supply. Did you know #BitcoinActiveSupplyInProfitDropsBelow45%? Translation: The weak hands are officially flushed, and only the conviction holders are left holding the keys.
Macro cross-currents are swirling: With #USPPIMissMayEaseBCPressure taking some heat off risk assets, the entire market is asking one question: #WhatWillDriveCryptoandStocks’NextRebound?
Meanwhile, high-conviction altcoins like $PYTH and $XRP are setting up for the next major move once BTC confirms its floor.
Let’s talk strategy: With weak hands cleared out and macro pressure easing—is it finally time for the big rebound, or are we due for one more shakeout first?
Drop your call below! 👇📊
#WhatWillDriveCryptoandStocksNextRebound #BitcoinActiveSupplyInProfitDropsBelow45 #USPPIMissMayEaseBCPressure #BinanceSquare
Remember all those panic posts on Crypto Twitter 48 hours ago screaming "Pack it up, zero is coming!"?
Well, look at the charts today. While the leverage junkies were busy liquidating their souls down toward $67,081, spot holders are sipping coffee and watching the market test everyone's psychological resolve.
Let’s check the reality of the board today:
$BTC is holding ground around the $67K–$68K battlefield, forcing a massive reality check on active supply. Did you know #BitcoinActiveSupplyInProfitDropsBelow45%? Translation: The weak hands are officially flushed, and only the conviction holders are left holding the keys.
Macro cross-currents are swirling: With #USPPIMissMayEaseBCPressure taking some heat off risk assets, the entire market is asking one question: #WhatWillDriveCryptoandStocks’NextRebound?
Meanwhile, high-conviction altcoins like $PYTH and $XRP are setting up for the next major move once BTC confirms its floor.
Let’s talk strategy: With weak hands cleared out and macro pressure easing—is it finally time for the big rebound, or are we due for one more shakeout first?
Drop your call below! 👇📊
#WhatWillDriveCryptoandStocksNextRebound #BitcoinActiveSupplyInProfitDropsBelow45 #USPPIMissMayEaseBCPressure #BinanceSquare
2
732

·
--
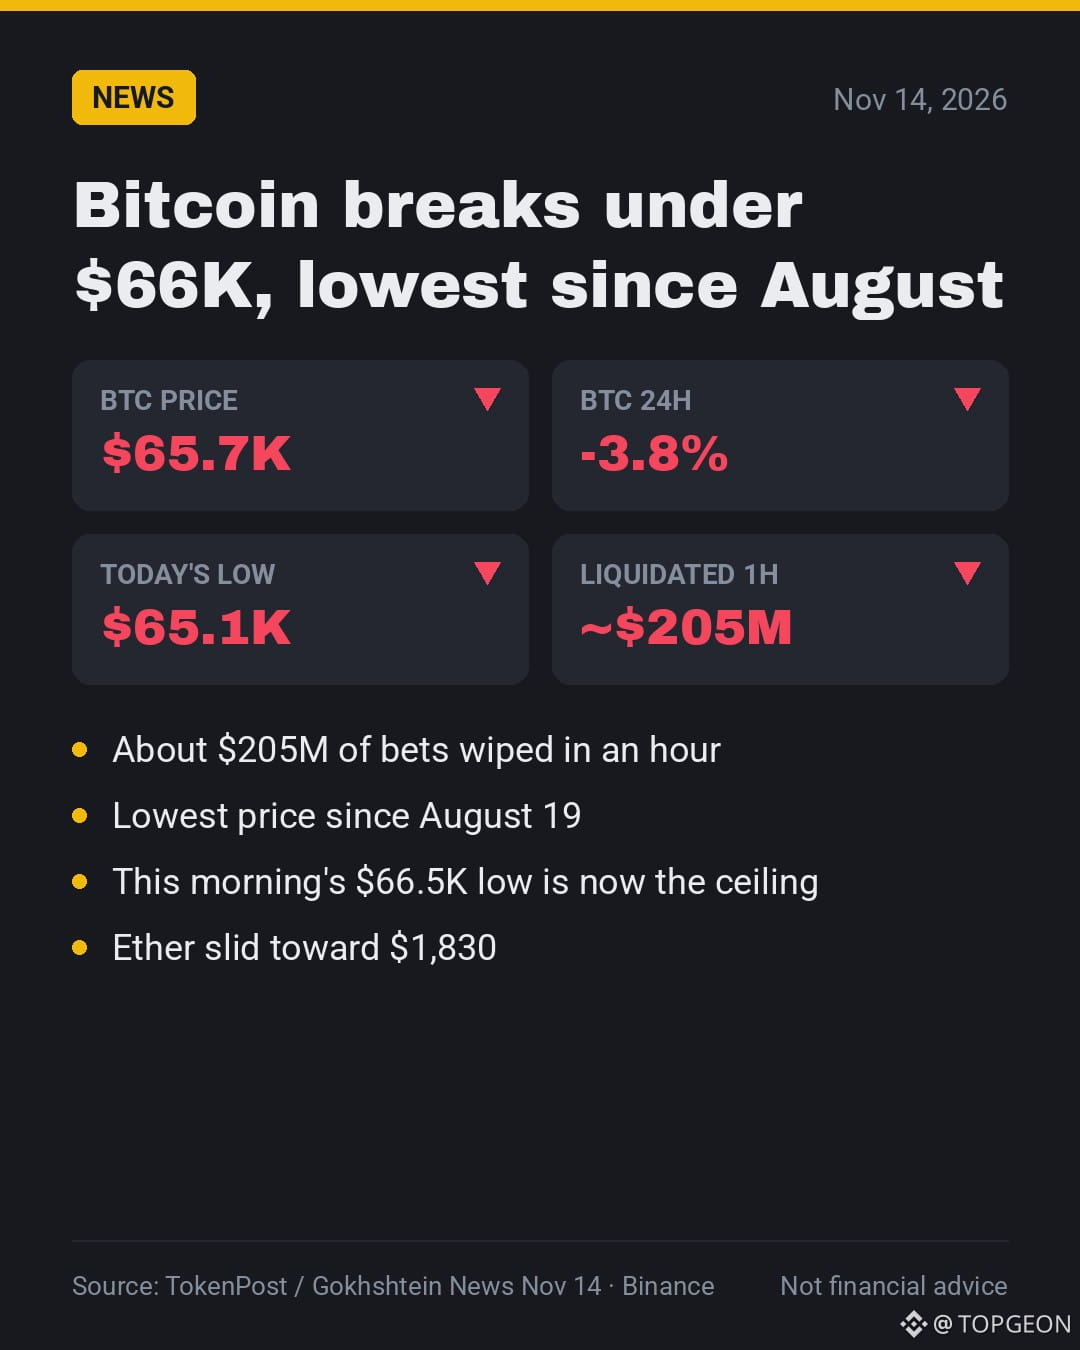
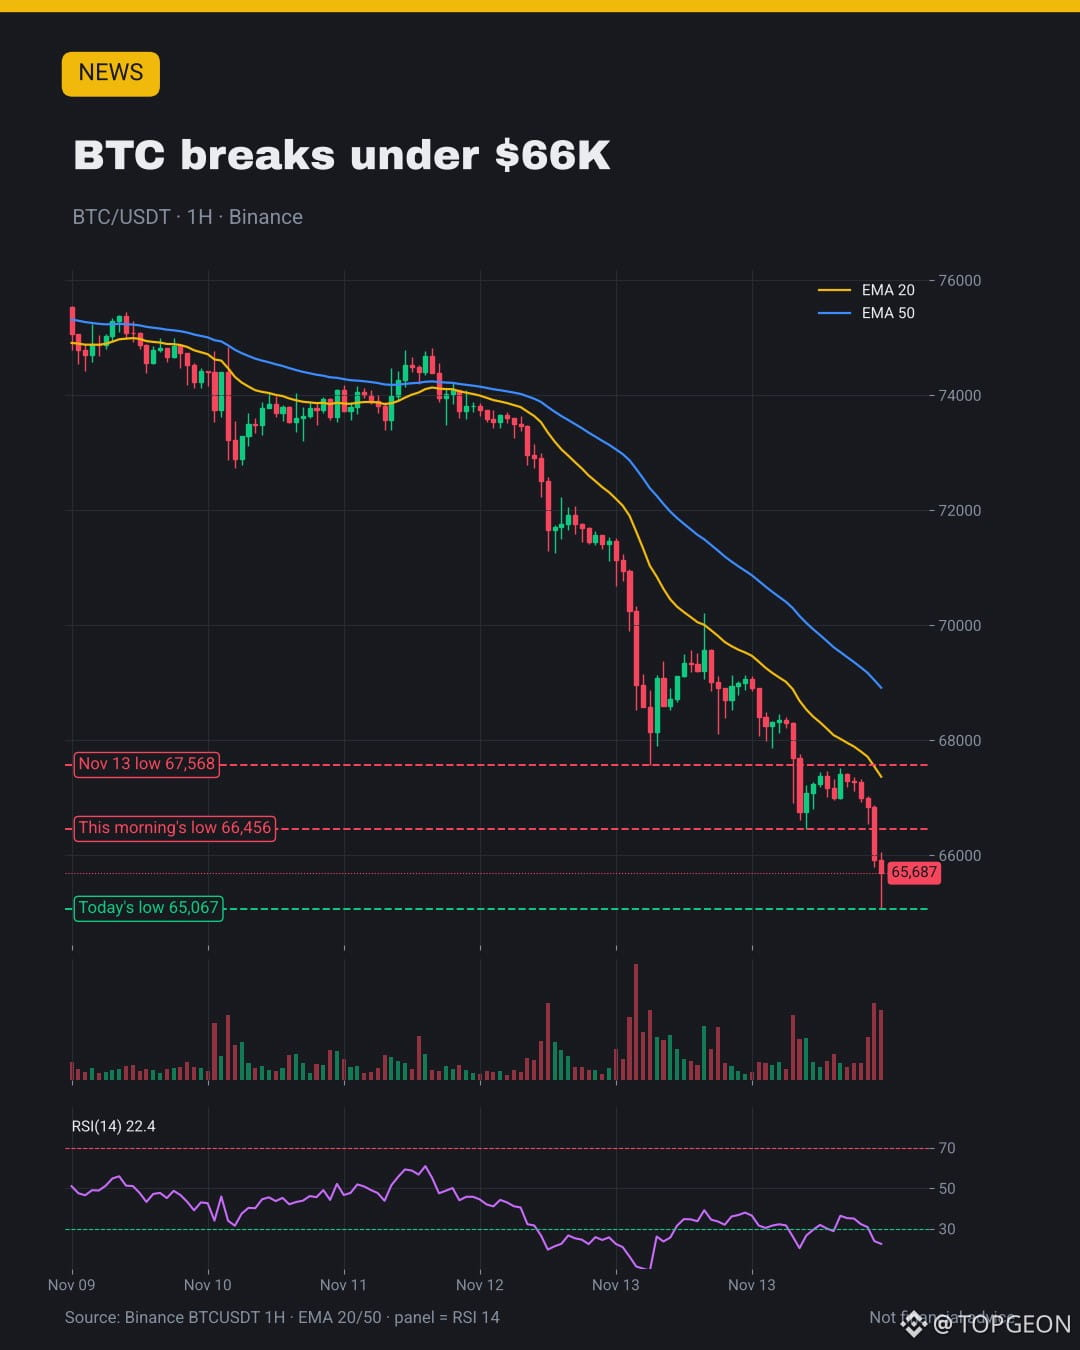
🚨 $BTC just broke under $66K, now $65.7K, lowest since mid-August.
💥 About $205M of bets got wiped in an hour as sellers piled in.
🤔 Every bounce this week has been sold, and buyers look tired.
👀 What to watch: $66.5K, this morning's low, is now the ceiling.
💬 Panic bottom or more room to fall? 👇
#BitcoinActiveSupplyInProfitDropsBelow45% #Bitcoin
🚨 $BTC just broke under $66K, now $65.7K, lowest since mid-August.
💥 About $205M of bets got wiped in an hour as sellers piled in.
🤔 Every bounce this week has been sold, and buyers look tired.
👀 What to watch: $66.5K, this morning's low, is now the ceiling.
💬 Panic bottom or more room to fall? 👇
#BitcoinActiveSupplyInProfitDropsBelow45% #Bitcoin
💥 About $205M of bets got wiped in an hour as sellers piled in.
🤔 Every bounce this week has been sold, and buyers look tired.
👀 What to watch: $66.5K, this morning's low, is now the ceiling.
💬 Panic bottom or more room to fall? 👇
#BitcoinActiveSupplyInProfitDropsBelow45% #Bitcoin
84

·
--
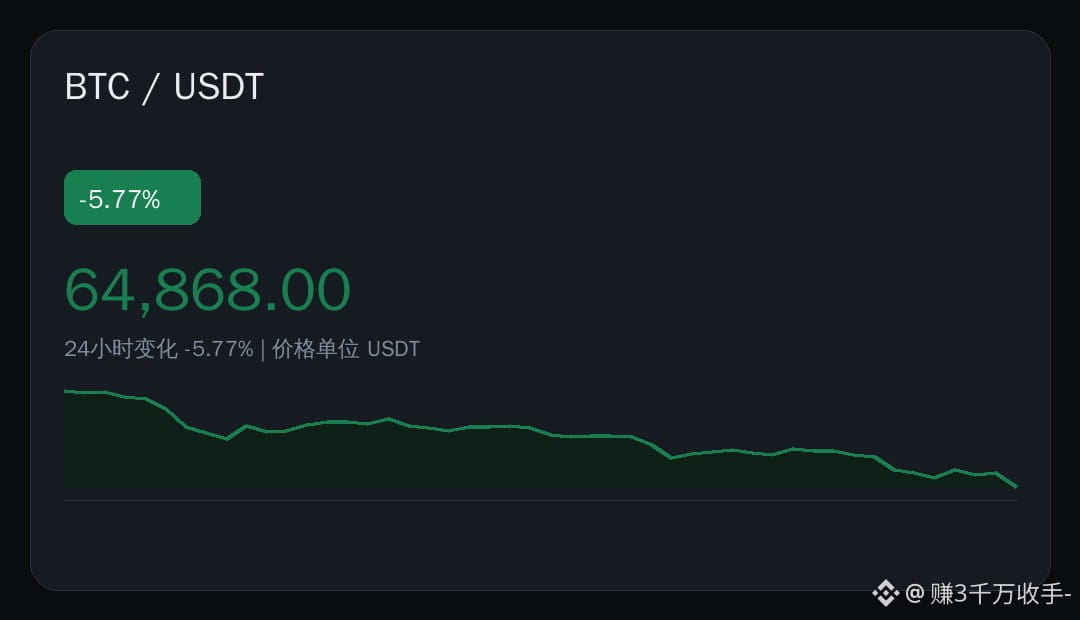
⚠️ A steady slide: $BTC 24 hours -5.77%, current price 64868.00 USDT.
📊 Data snapshot
· Current price: 64868.00 USDT
· 24h: -5.77%
· Range: 64510.01 — 68839.65
· Trading volume: 1815663421.58 USDT
Don’t rush to conclusions
This move has been pretty grueling. Volume is more interesting than price, and bulls and bears are clearly still battling it out. Are you watching?👇
#市场观察 #BTC #Binance #BitcoinActiveSupplyInProfitDropsBelow45%
⚠️ A steady slide: $BTC 24 hours -5.77%, current price 64868.00 USDT.
📊 Data snapshot
· Current price: 64868.00 USDT
· 24h: -5.77%
· Range: 64510.01 — 68839.65
· Trading volume: 1815663421.58 USDT
Don’t rush to conclusions
This move has been pretty grueling. Volume is more interesting than price, and bulls and bears are clearly still battling it out. Are you watching?👇
#市场观察 #BTC #Binance #BitcoinActiveSupplyInProfitDropsBelow45%
📊 Data snapshot
· Current price: 64868.00 USDT
· 24h: -5.77%
· Range: 64510.01 — 68839.65
· Trading volume: 1815663421.58 USDT
Don’t rush to conclusions
This move has been pretty grueling. Volume is more interesting than price, and bulls and bears are clearly still battling it out. Are you watching?👇
#市场观察 #BTC #Binance #BitcoinActiveSupplyInProfitDropsBelow45%
·
--
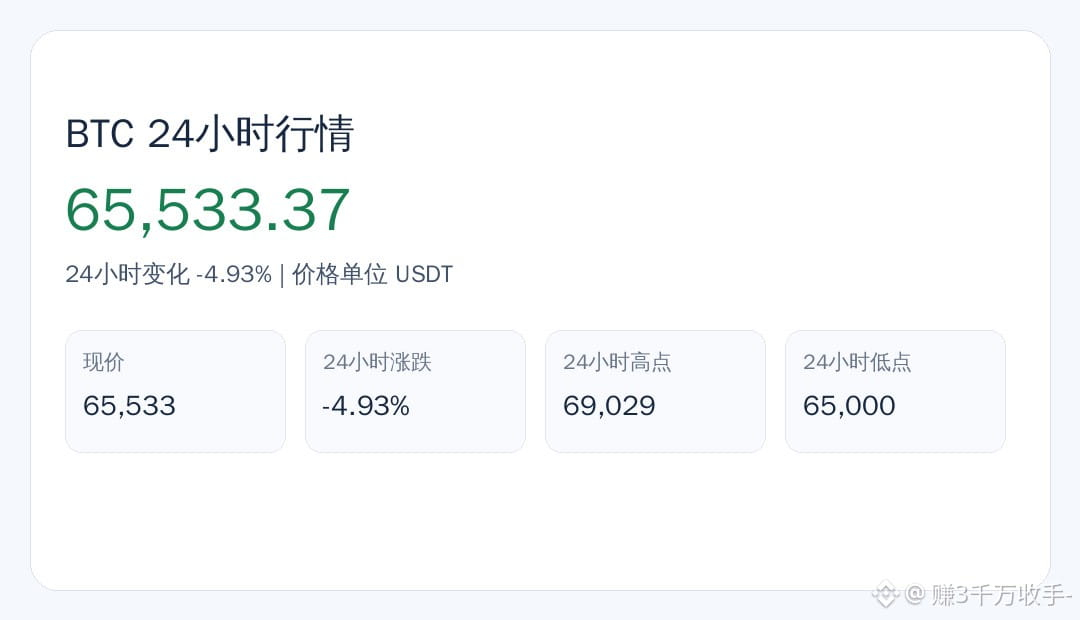
💡 Spotted a detail | Latest data for $BTC : 24 hours -4.93%, current price 65533.37 USDT.
📊 Data snapshot
· Current price: 65533.37 USDT
· 24h: -4.93%
· Range: 65000.00 — 69028.60
· Trading volume: 1735157406.87 USDT
Sentiment lies behind the numbers; volume speaks before price.
What do you think of this move—wait for confirmation before acting? 👇
#市场观察 #BTC #Binance #BitcoinActiveSupplyInProfitDropsBelow45%
💡 Spotted a detail | Latest data for $BTC : 24 hours -4.93%, current price 65533.37 USDT.
📊 Data snapshot
· Current price: 65533.37 USDT
· 24h: -4.93%
· Range: 65000.00 — 69028.60
· Trading volume: 1735157406.87 USDT
Sentiment lies behind the numbers; volume speaks before price.
What do you think of this move—wait for confirmation before acting? 👇
#市场观察 #BTC #Binance #BitcoinActiveSupplyInProfitDropsBelow45%
📊 Data snapshot
· Current price: 65533.37 USDT
· 24h: -4.93%
· Range: 65000.00 — 69028.60
· Trading volume: 1735157406.87 USDT
Sentiment lies behind the numbers; volume speaks before price.
What do you think of this move—wait for confirmation before acting? 👇
#市场观察 #BTC #Binance #BitcoinActiveSupplyInProfitDropsBelow45%
1
·
--
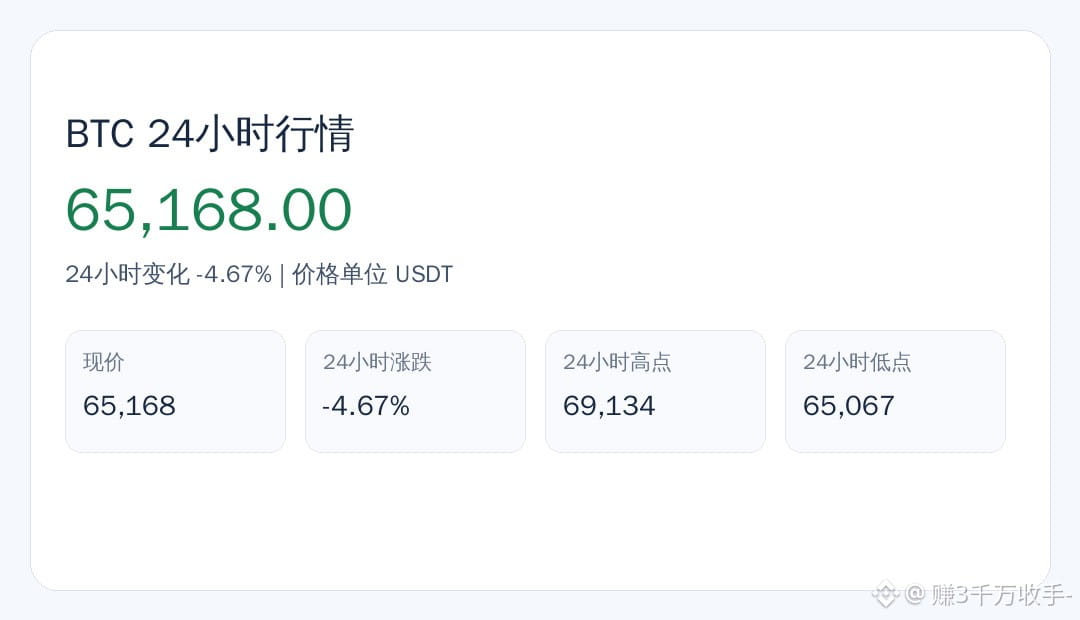
📉 Ouch! $BTC 24 hours: -4.67%, current price 65168.00 USDT.
📊 Data snapshot
· Current price: 65168.00 USDT
· 24h: -4.67%
· Range: 65066.66 — 69134.01
· Trading volume: 1544646450.53 USDT
Volatility doesn’t necessarily mean opportunity. Volume can tell you more than price, and bulls and bears are really going at it right now.
What do you think? 👇
#市场观察 #BTC #Binance #BitcoinActiveSupplyInProfitDropsBelow45%
📉 Ouch! $BTC 24 hours: -4.67%, current price 65168.00 USDT.
📊 Data snapshot
· Current price: 65168.00 USDT
· 24h: -4.67%
· Range: 65066.66 — 69134.01
· Trading volume: 1544646450.53 USDT
Volatility doesn’t necessarily mean opportunity. Volume can tell you more than price, and bulls and bears are really going at it right now.
What do you think? 👇
#市场观察 #BTC #Binance #BitcoinActiveSupplyInProfitDropsBelow45%
📊 Data snapshot
· Current price: 65168.00 USDT
· 24h: -4.67%
· Range: 65066.66 — 69134.01
· Trading volume: 1544646450.53 USDT
Volatility doesn’t necessarily mean opportunity. Volume can tell you more than price, and bulls and bears are really going at it right now.
What do you think? 👇
#市场观察 #BTC #Binance #BitcoinActiveSupplyInProfitDropsBelow45%
3
Log in to explore more content
Join global crypto users on Binance Square
⚡️ Get latest and useful information about crypto.
💬 Trusted by the world’s largest crypto exchange.
👍 Discover real insights from verified creators.
Email / Phone number
Trending Topics
1
#WhoWillSucceedJensenHuangatNvidia?
149,873 views
1,567 Discussing
2
#WhatWillDriveCryptoandStocks’NextRebound?
546,924 views
3,410 Discussing
3
#BitcoinActiveSupplyInProfitDropsBelow45%
65,509 views
667 Discussing
4
#KavaSaysAbnormalActivityLimitedToKavaLend
35,519 views
371 Discussing
5
#USSpotXRPETFsSeeLargestWeeklyOutflowIn8Months
27,312 views
324 Discussing
6
#USPPIMissMayEaseBTCPressure
282,626 views
2,223 Discussing
7
#WORPTLetsTouristsConvertCryptoToThaiBaht
9,456 views
88 Discussing
8
#TONStrategyReports$23.97MQ3NetLoss
10,134 views
42 Discussing
9
#PolkadotCommunityApprovesNewStrategyWith97%Vote
26,515 views
285 Discussing
10
#dYdXPlansV9.9UpgradeToShiftUSDCToInjective
24,297 views
243 Discussing