
#bitcoin2026lows
bitcoin2026lows
239 views
4 Discussing
Hot
Latest

·
--
Bitcoin drops to new 2026 low
Bitcoin hit fresh 2026 lows on Monday as spot ETF outflows accelerated and equities weakened further. The decline triggered stop-loss cascades across leveraged positions, pushing prices below the previous support zone that had held for weeks.
A bearish monthly options expiry is approaching with massive open interest clustered below current levels. Strategy's growing unrealized losses on its Bitcoin treasury have widened the gap between crypto and AI stock returns, adding to bearish sentiment across the market.
On-chain data shows long-term holders quietly accumulating despite the downturn. Historical patterns suggest major bottoms form during periods of maximum fear and forced liquidation — the current setup mirrors previous capitulation events before recovery.
Key question for the week: Does US equity weakness drag Bitcoin further, or does ETF outflow exhaustion signal a reversal? Watch daily inflow data closely. 👇
#Bitcoin2026Lows #ETFOutflows #CryptoMarketAnalysis
Bitcoin drops to new 2026 low
Bitcoin hit fresh 2026 lows on Monday as spot ETF outflows accelerated and equities weakened further. The decline triggered stop-loss cascades across leveraged positions, pushing prices below the previous support zone that had held for weeks.
A bearish monthly options expiry is approaching with massive open interest clustered below current levels. Strategy's growing unrealized losses on its Bitcoin treasury have widened the gap between crypto and AI stock returns, adding to bearish sentiment across the market.
On-chain data shows long-term holders quietly accumulating despite the downturn. Historical patterns suggest major bottoms form during periods of maximum fear and forced liquidation — the current setup mirrors previous capitulation events before recovery.
Key question for the week: Does US equity weakness drag Bitcoin further, or does ETF outflow exhaustion signal a reversal? Watch daily inflow data closely. 👇
#Bitcoin2026Lows #ETFOutflows #CryptoMarketAnalysis
Bitcoin hit fresh 2026 lows on Monday as spot ETF outflows accelerated and equities weakened further. The decline triggered stop-loss cascades across leveraged positions, pushing prices below the previous support zone that had held for weeks.
A bearish monthly options expiry is approaching with massive open interest clustered below current levels. Strategy's growing unrealized losses on its Bitcoin treasury have widened the gap between crypto and AI stock returns, adding to bearish sentiment across the market.
On-chain data shows long-term holders quietly accumulating despite the downturn. Historical patterns suggest major bottoms form during periods of maximum fear and forced liquidation — the current setup mirrors previous capitulation events before recovery.
Key question for the week: Does US equity weakness drag Bitcoin further, or does ETF outflow exhaustion signal a reversal? Watch daily inflow data closely. 👇
#Bitcoin2026Lows #ETFOutflows #CryptoMarketAnalysis
BTC+1.18%
MSTRUS+2.06%
1
3
·
--
Bitcoin drops to new 2026 lows. Bounces at $58K.
Bitcoin fell below $58,000 yesterday, marking its lowest point since the 2026 correction began. The selloff was triggered by a broader tech rout that saw major indices drop 3-5% in a single session.
Derivatives data paints a concerning picture. Open interest remains elevated while funding rates have turned deeply negative. This suggests traders are aggressively betting on further downside, with leveraged shorts piling in at record levels.
The macro picture adds pressure. Rising bond yields, geopolitical tensions, and a weakening dollar are all pulling risk assets lower. Bitcoin's correlation with tech stocks remains above 0.7, meaning any NASDAQ weakness flows directly into crypto markets.
However, the bounce at $58K was sharp and accompanied by heavy volume. Historically, capitulation-style selloffs like this have preceded strong reversals. The question is whether this is the bottom or just a pause before more pain.
Is this the capitulation bottom or another dead cat bounce? Drop your take below. 👇
#Bitcoin2026Lows #CryptoMarketAnalysis #DerivativesSignal
Bitcoin drops to new 2026 lows. Bounces at $58K.
Bitcoin fell below $58,000 yesterday, marking its lowest point since the 2026 correction began. The selloff was triggered by a broader tech rout that saw major indices drop 3-5% in a single session.
Derivatives data paints a concerning picture. Open interest remains elevated while funding rates have turned deeply negative. This suggests traders are aggressively betting on further downside, with leveraged shorts piling in at record levels.
The macro picture adds pressure. Rising bond yields, geopolitical tensions, and a weakening dollar are all pulling risk assets lower. Bitcoin's correlation with tech stocks remains above 0.7, meaning any NASDAQ weakness flows directly into crypto markets.
However, the bounce at $58K was sharp and accompanied by heavy volume. Historically, capitulation-style selloffs like this have preceded strong reversals. The question is whether this is the bottom or just a pause before more pain.
Is this the capitulation bottom or another dead cat bounce? Drop your take below. 👇
#Bitcoin2026Lows #CryptoMarketAnalysis #DerivativesSignal
Bitcoin fell below $58,000 yesterday, marking its lowest point since the 2026 correction began. The selloff was triggered by a broader tech rout that saw major indices drop 3-5% in a single session.
Derivatives data paints a concerning picture. Open interest remains elevated while funding rates have turned deeply negative. This suggests traders are aggressively betting on further downside, with leveraged shorts piling in at record levels.
The macro picture adds pressure. Rising bond yields, geopolitical tensions, and a weakening dollar are all pulling risk assets lower. Bitcoin's correlation with tech stocks remains above 0.7, meaning any NASDAQ weakness flows directly into crypto markets.
However, the bounce at $58K was sharp and accompanied by heavy volume. Historically, capitulation-style selloffs like this have preceded strong reversals. The question is whether this is the bottom or just a pause before more pain.
Is this the capitulation bottom or another dead cat bounce? Drop your take below. 👇
#Bitcoin2026Lows #CryptoMarketAnalysis #DerivativesSignal
1
5

·
--
Bullish
🟠 Bitcoin doesn’t need you to guess the next move. It needs you to accumulate.
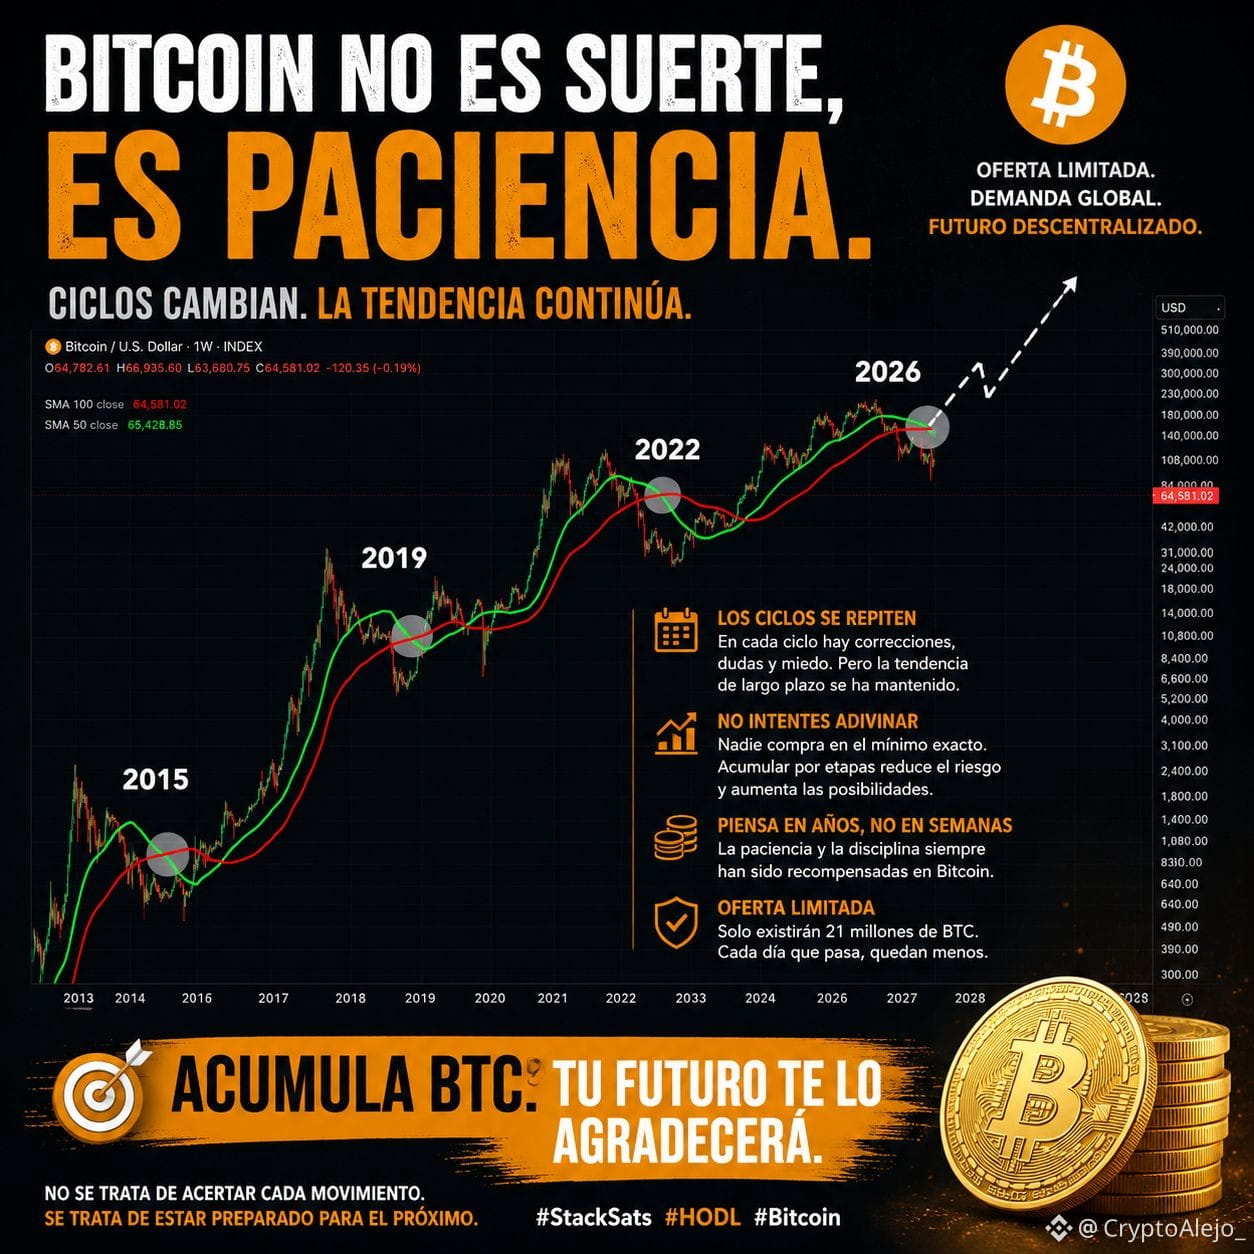
There’s something interesting in this long-term chart of $BTC
{spot}(BTCUSDT): the same trend structures seem to repeat again and again.
2015 → 2019 → 2022 → 2026.
In each cycle, there are periods of correction, consolidation, and doubt. But then, when the trend regains strength, Bitcoin ends up showing why the time horizon matters.
This image is not a guarantee that history will repeat exactly. Markets don’t work like a clock. But it does remind us of something:
👉 Whoever tries to buy at the perfect low can end up waiting too long.
👉 Whoever builds a position gradually can take advantage of periods of uncertainty.
👉 And whoever thinks in years, not just in weeks, has a completely different perspective.
Today, many people are trying to guess what the next top will be or the next pullback.
I’d rather ask a different question:
How much BTC do I want to have when the next big cycle arrives? 🟠
Because if we truly believe in Bitcoin long term, corrections stop being only moments of fear.
They can also be times to accumulate with discipline, manage risk, and think beyond the daily noise.
⏳ The market will keep changing.
₿ Bitcoin’s supply will remain limited.
📈 And the cycles will keep teaching us that patience is also a strategy.
It’s not about getting every move right.
It’s about being ready for the next one.
Are you accumulating BTC for the next cycle, or are you still waiting for the perfect entry? 👇
#bitcoin #BTC走势分析 #crypto #Bitcoin2026Lows #BTCAccumulationMode
🟠 Bitcoin doesn’t need you to guess the next move. It needs you to accumulate.
There’s something interesting in this long-term chart of $BTC : the same trend structures seem to repeat again and again.
2015 → 2019 → 2022 → 2026.
In each cycle, there are periods of correction, consolidation, and doubt. But then, when the trend regains strength, Bitcoin ends up showing why the time horizon matters.
This image is not a guarantee that history will repeat exactly. Markets don’t work like a clock. But it does remind us of something:
👉 Whoever tries to buy at the perfect low can end up waiting too long.
👉 Whoever builds a position gradually can take advantage of periods of uncertainty.
👉 And whoever thinks in years, not just in weeks, has a completely different perspective.
Today, many people are trying to guess what the next top will be or the next pullback.
I’d rather ask a different question:
How much BTC do I want to have when the next big cycle arrives? 🟠
Because if we truly believe in Bitcoin long term, corrections stop being only moments of fear.
They can also be times to accumulate with discipline, manage risk, and think beyond the daily noise.
⏳ The market will keep changing.
₿ Bitcoin’s supply will remain limited.
📈 And the cycles will keep teaching us that patience is also a strategy.
It’s not about getting every move right.
It’s about being ready for the next one.
Are you accumulating BTC for the next cycle, or are you still waiting for the perfect entry? 👇
#bitcoin #BTC走势分析 #crypto #Bitcoin2026Lows #BTCAccumulationMode
There’s something interesting in this long-term chart of $BTC : the same trend structures seem to repeat again and again.
2015 → 2019 → 2022 → 2026.
In each cycle, there are periods of correction, consolidation, and doubt. But then, when the trend regains strength, Bitcoin ends up showing why the time horizon matters.
This image is not a guarantee that history will repeat exactly. Markets don’t work like a clock. But it does remind us of something:
👉 Whoever tries to buy at the perfect low can end up waiting too long.
👉 Whoever builds a position gradually can take advantage of periods of uncertainty.
👉 And whoever thinks in years, not just in weeks, has a completely different perspective.
Today, many people are trying to guess what the next top will be or the next pullback.
I’d rather ask a different question:
How much BTC do I want to have when the next big cycle arrives? 🟠
Because if we truly believe in Bitcoin long term, corrections stop being only moments of fear.
They can also be times to accumulate with discipline, manage risk, and think beyond the daily noise.
⏳ The market will keep changing.
₿ Bitcoin’s supply will remain limited.
📈 And the cycles will keep teaching us that patience is also a strategy.
It’s not about getting every move right.
It’s about being ready for the next one.
Are you accumulating BTC for the next cycle, or are you still waiting for the perfect entry? 👇
#bitcoin #BTC走势分析 #crypto #Bitcoin2026Lows #BTCAccumulationMode
1
473
Log in to explore more content
Join global crypto users on Binance Square
⚡️ Get latest and useful information about crypto.
💬 Trusted by the world’s largest crypto exchange.
👍 Discover real insights from verified creators.
Email / Phone number
Trending Topics
1
#AIStocksWhatNext
526,440 views
3,914 Discussing
2
#IranSetsConditionsToEndSevenMonthWar
0 views
1 Discussing
3
#CardanoJoinsX402PaymentStandard
0 views
1 Discussing
4
#BitcoinTops$87KAtEightMonthHigh
1,687 views
40 Discussing
5
#ZECBreaksAbove$1600AtRecordHigh
758 views
29 Discussing
6
#BitwiseNEARStakingETPAssetsTop$100M
14,685 views
61 Discussing
7
#BitcoinBreaksAboveMayHighNears$86K
24,457 views
245 Discussing
8
#DogecoinRises15%
82,309 views
1,415 Discussing
9
#$14BBitcoinOptionsExpireFriday
7,098 views
105 Discussing
10
#BNBMarketCapPassesBNYMellon
50,651 views
1,061 Discussing