Binance Square

btcnextmove

30.7M views
28,626 Discussing
Bitcoin is at a crossroads after recent market fluctuations. Will it rebound to new highs, or is a deeper correction ahead? What’s your view on BTC’s next move? Join the discussion and share your analysis!
Muhammad Waris 06
·
--
Peter Schiff Says Bitcoin May Fall to $75,000Peter Schiff has spent over a decade predicting Bitcoin’s demise. So when he says the next stop is $75,000, the instinct for many crypto natives is to dismiss it outright. But this time, the call deserves a closer look not because Schiff has suddenly become a reliable oracle, but because the number he chose tells a story about how much the market has already changed, and what structural risks remain beneath the surface. The Context: Bitcoin Already Broke $80K Schiff’s warning came as Bitcoin slipped below the $80,000 mark on Saturday, October 24, trading as low as roughly $79,146 before settling near $80,300 . The drop represents a roughly one third decline from its 52-week high near $116,000 . In Schiff’s words: “Now that it’s below $80K, the next stop is likely $75K” . The selloff was not merely a psychological milestone. Over $800 million in crypto positions were liquidated in roughly a day, with long positions accounting for the bulk of forced closures . U.S. spot Bitcoin ETFs recorded approximately $635.6 million in net outflows over the week, led by BlackRock’s IBIT and Fidelity’s FBTC . Why $75,000 Is Not the “Doom” It Sounds Like For years, Schiff’s Bitcoin target was effectively zero. He compared it to tulip mania at $350, called it a bubble at $20,000, and insisted on its inevitable collapse even as Bitcoin crossed $100,000 in December 2024 . A $75,000 target from Schiff is, paradoxically, a concession. It sits only about seven percent below a market that has already fallen roughly 31% from its peak . More importantly, $75,000 aligns with technical and structural levels that independent analysts are watching not because Schiff said so, but because the data converges there. Coinbase Institutional identified $80,000 $82,000 as key near-term support, anchored by the ETF cost basis near $81,300 and the 50-day moving average. If that zone fails, Coinbase’s strategists see the next support near $73,000 $75,000 . Blockchain.news data showed Bitcoin trading below all five short-term moving averages at the time of Schiff’s call, with the 200-day SMA sitting near $72,942 just below Schiff’s target . In other words, Schiff picked a number that the market itself had already flagged as a plausible downside zone. That does not make it inevitable, but it makes it harder to dismiss as pure contrarianism. The ETF Liquidity Trap Schiff Is Pointing At The sharpest part of Schiff’s warning was not the price target itself, but his observation about who gets hurt and when. “A very long weekend for Bitcoiners,” he said, “especially for ETF investors who can’t sell until Monday” . This is a structural critique that deserves serious attention. Bitcoin trades 24/7. U.S. listed spot Bitcoin ETFs do not. An investor holding IBIT or FBTC cannot react to a weekend crash until the market reopens on Monday. By then, the damage may already be done. For anyone using ETFs as their primary Bitcoin exposure a group that has grown substantially—this creates an asymmetry: they bear the downside of continuous trading without the ability to act on it. Schiff also noted that a fall to $75,000 would narrow Strategy’s paper gains. Strategy holds over 640,000 BTC at an average cost of roughly $73,981, meaning $75,000 would leave only about $1,019 per coin in cushion before other considerations . The claim that it would “erase” Strategy’s gains is technically overstated, but the broader point that the most visible corporate holder’s margin for error is thinning is not unreasonable. The Credibility Problem Cuts Both Ways None of this makes Schiff a trustworthy forecaster. His track record is a graveyard of missed calls, each more extreme than the last . When someone has predicted zero for over a decade, a $75,000 target looks less like prescience and more like a reluctant adjustment to reality. But the inverse is also true: dismissing a warning solely because of the messenger is its own form of bias. The $75,000 level is not Schiff’s invention. It is a zone where ETF cost bases, moving averages, and institutional support estimates overlap . The macro backdrop hot producer prices, rising odds of a December rate hike, and weakening demand from corporate treasuries as ETFs take over as the marginal buyer is genuinely challenging for risk assets . What to Watch The immediate question is whether $80,000 holds. If it does, Schiff’s call joins the long list of premature obituaries. If it fails, the $73,000-$75,000 zone becomes the next real test—not because Schiff predicted it, but because that is where the market’s structural supports sit. For ETF holders, Schiff’s weekend warning is a reminder that convenience has a cost. Bitcoin never sleeps. Your brokerage account does. That gap is worth understanding, regardless of what happens next. $BTC #BTCNextMove

Peter Schiff Says Bitcoin May Fall to $75,000

Peter Schiff has spent over a decade predicting Bitcoin’s demise. So when he says the next stop is $75,000, the instinct for many crypto natives is to dismiss it outright. But this time, the call deserves a closer look not because Schiff has suddenly become a reliable oracle, but because the number he chose tells a story about how much the market has already changed, and what structural risks remain beneath the surface.
The Context: Bitcoin Already Broke $80K
Schiff’s warning came as Bitcoin slipped below the $80,000 mark on Saturday, October 24, trading as low as roughly $79,146 before settling near $80,300 . The drop represents a roughly one third decline from its 52-week high near $116,000 . In Schiff’s words: “Now that it’s below $80K, the next stop is likely $75K” .
The selloff was not merely a psychological milestone. Over $800 million in crypto positions were liquidated in roughly a day, with long positions accounting for the bulk of forced closures . U.S. spot Bitcoin ETFs recorded approximately $635.6 million in net outflows over the week, led by BlackRock’s IBIT and Fidelity’s FBTC .
Why $75,000 Is Not the “Doom” It Sounds Like
For years, Schiff’s Bitcoin target was effectively zero. He compared it to tulip mania at $350, called it a bubble at $20,000, and insisted on its inevitable collapse even as Bitcoin crossed $100,000 in December 2024 . A $75,000 target from Schiff is, paradoxically, a concession. It sits only about seven percent below a market that has already fallen roughly 31% from its peak .
More importantly, $75,000 aligns with technical and structural levels that independent analysts are watching not because Schiff said so, but because the data converges there.
Coinbase Institutional identified $80,000 $82,000 as key near-term support, anchored by the ETF cost basis near $81,300 and the 50-day moving average. If that zone fails, Coinbase’s strategists see the next support near $73,000 $75,000 . Blockchain.news data showed Bitcoin trading below all five short-term moving averages at the time of Schiff’s call, with the 200-day SMA sitting near $72,942 just below Schiff’s target .
In other words, Schiff picked a number that the market itself had already flagged as a plausible downside zone. That does not make it inevitable, but it makes it harder to dismiss as pure contrarianism.
The ETF Liquidity Trap Schiff Is Pointing At
The sharpest part of Schiff’s warning was not the price target itself, but his observation about who gets hurt and when. “A very long weekend for Bitcoiners,” he said, “especially for ETF investors who can’t sell until Monday” .
This is a structural critique that deserves serious attention. Bitcoin trades 24/7. U.S. listed spot Bitcoin ETFs do not. An investor holding IBIT or FBTC cannot react to a weekend crash until the market reopens on Monday. By then, the damage may already be done. For anyone using ETFs as their primary Bitcoin exposure a group that has grown substantially—this creates an asymmetry: they bear the downside of continuous trading without the ability to act on it.
Schiff also noted that a fall to $75,000 would narrow Strategy’s paper gains. Strategy holds over 640,000 BTC at an average cost of roughly $73,981, meaning $75,000 would leave only about $1,019 per coin in cushion before other considerations . The claim that it would “erase” Strategy’s gains is technically overstated, but the broader point that the most visible corporate holder’s margin for error is thinning is not unreasonable.
The Credibility Problem Cuts Both Ways
None of this makes Schiff a trustworthy forecaster. His track record is a graveyard of missed calls, each more extreme than the last . When someone has predicted zero for over a decade, a $75,000 target looks less like prescience and more like a reluctant adjustment to reality.
But the inverse is also true: dismissing a warning solely because of the messenger is its own form of bias. The $75,000 level is not Schiff’s invention. It is a zone where ETF cost bases, moving averages, and institutional support estimates overlap . The macro backdrop hot producer prices, rising odds of a December rate hike, and weakening demand from corporate treasuries as ETFs take over as the marginal buyer is genuinely challenging for risk assets .
What to Watch
The immediate question is whether $80,000 holds. If it does, Schiff’s call joins the long list of premature obituaries. If it fails, the $73,000-$75,000 zone becomes the next real test—not because Schiff predicted it, but because that is where the market’s structural supports sit.
For ETF holders, Schiff’s weekend warning is a reminder that convenience has a cost. Bitcoin never sleeps. Your brokerage account does. That gap is worth understanding, regardless of what happens next.
$BTC
#BTCNextMove
$BTC If quantum "breaks" Bitcoin, it can also kill: • The entire global banking system • SWIFT payment networks • Global stock markets • Military communication systems • Nuclear security infrastructure • Every website relying on HTTPS encryption The entire digital financial system would face a crisis. In other words: I’m buying the crypto dip. #BTC走势分析 #BTC #BTCNextMove {spot}(BTCUSDT)
$BTC If quantum "breaks" Bitcoin, it can also kill:

• The entire global banking system
• SWIFT payment networks
• Global stock markets
• Military communication systems
• Nuclear security infrastructure
• Every website relying on HTTPS encryption

The entire digital financial system would face a crisis.

In other words: I’m buying the crypto dip.
#BTC走势分析 #BTC #BTCNextMove
🚨 The #Bitcoin bull run may not have even started yet. 🇺🇸 President Donald Trump said: “We don’t want to sell $BTC for a fraction of its long-term value. Together, we will make America the undisputed #Bitcoin superpower.” If this vision becomes reality, Bitcoin could play a much bigger role in America’s future. ₿ $BTC $ETH {spot}(ETHUSDT) #BTC #CryptoNewss #BTCNextMove
🚨 The #Bitcoin bull run may not have even started yet.

🇺🇸 President Donald Trump said:

“We don’t want to sell $BTC for a fraction of its long-term value.

Together, we will make America the undisputed #Bitcoin superpower.”

If this vision becomes reality, Bitcoin could play a much bigger role in America’s future. ₿

$BTC
$ETH

#BTC #CryptoNewss #BTCNextMove
Article
**$BTC Next Move: Breakout or Dump?** 📊🚨 **$BTC Next Move: Breakout or Dump?** 📊 {spot}(BTCUSDT) Bitcoin ($BTC C) is currently hovering right around the critical **$59,500 – $60,000** zone. After facing some heavy liquidations and institutional outflows recently, the entire crypto market is holding its breath. The direction of the next massive move relies heavily on two key levels: * **🟢 Bullish View:** Reclaiming and holding above **$61,000** could trigger short liquidation and push us right back into a recovery rally. * **🔴 Bearish View:** Failing to hold the psychological **$58,000 – $59,000** support line could open the doors for a deeper retest toward $55,000. Volitility is expanding, and a major move is brewing! 👇 **What do you think?** Will BTC smash through resistance or are we heading for a deeper dump? Vote or comment your target below! 🚀👇 #Bitcoin #BTC #cryptouniverseofficial toTrading #Binance nceSquare #MarketAnalysis #CryptoNews #TechnicalAnalysis #BTCNextMove

**$BTC Next Move: Breakout or Dump?** 📊

🚨 **$BTC Next Move: Breakout or Dump?** 📊
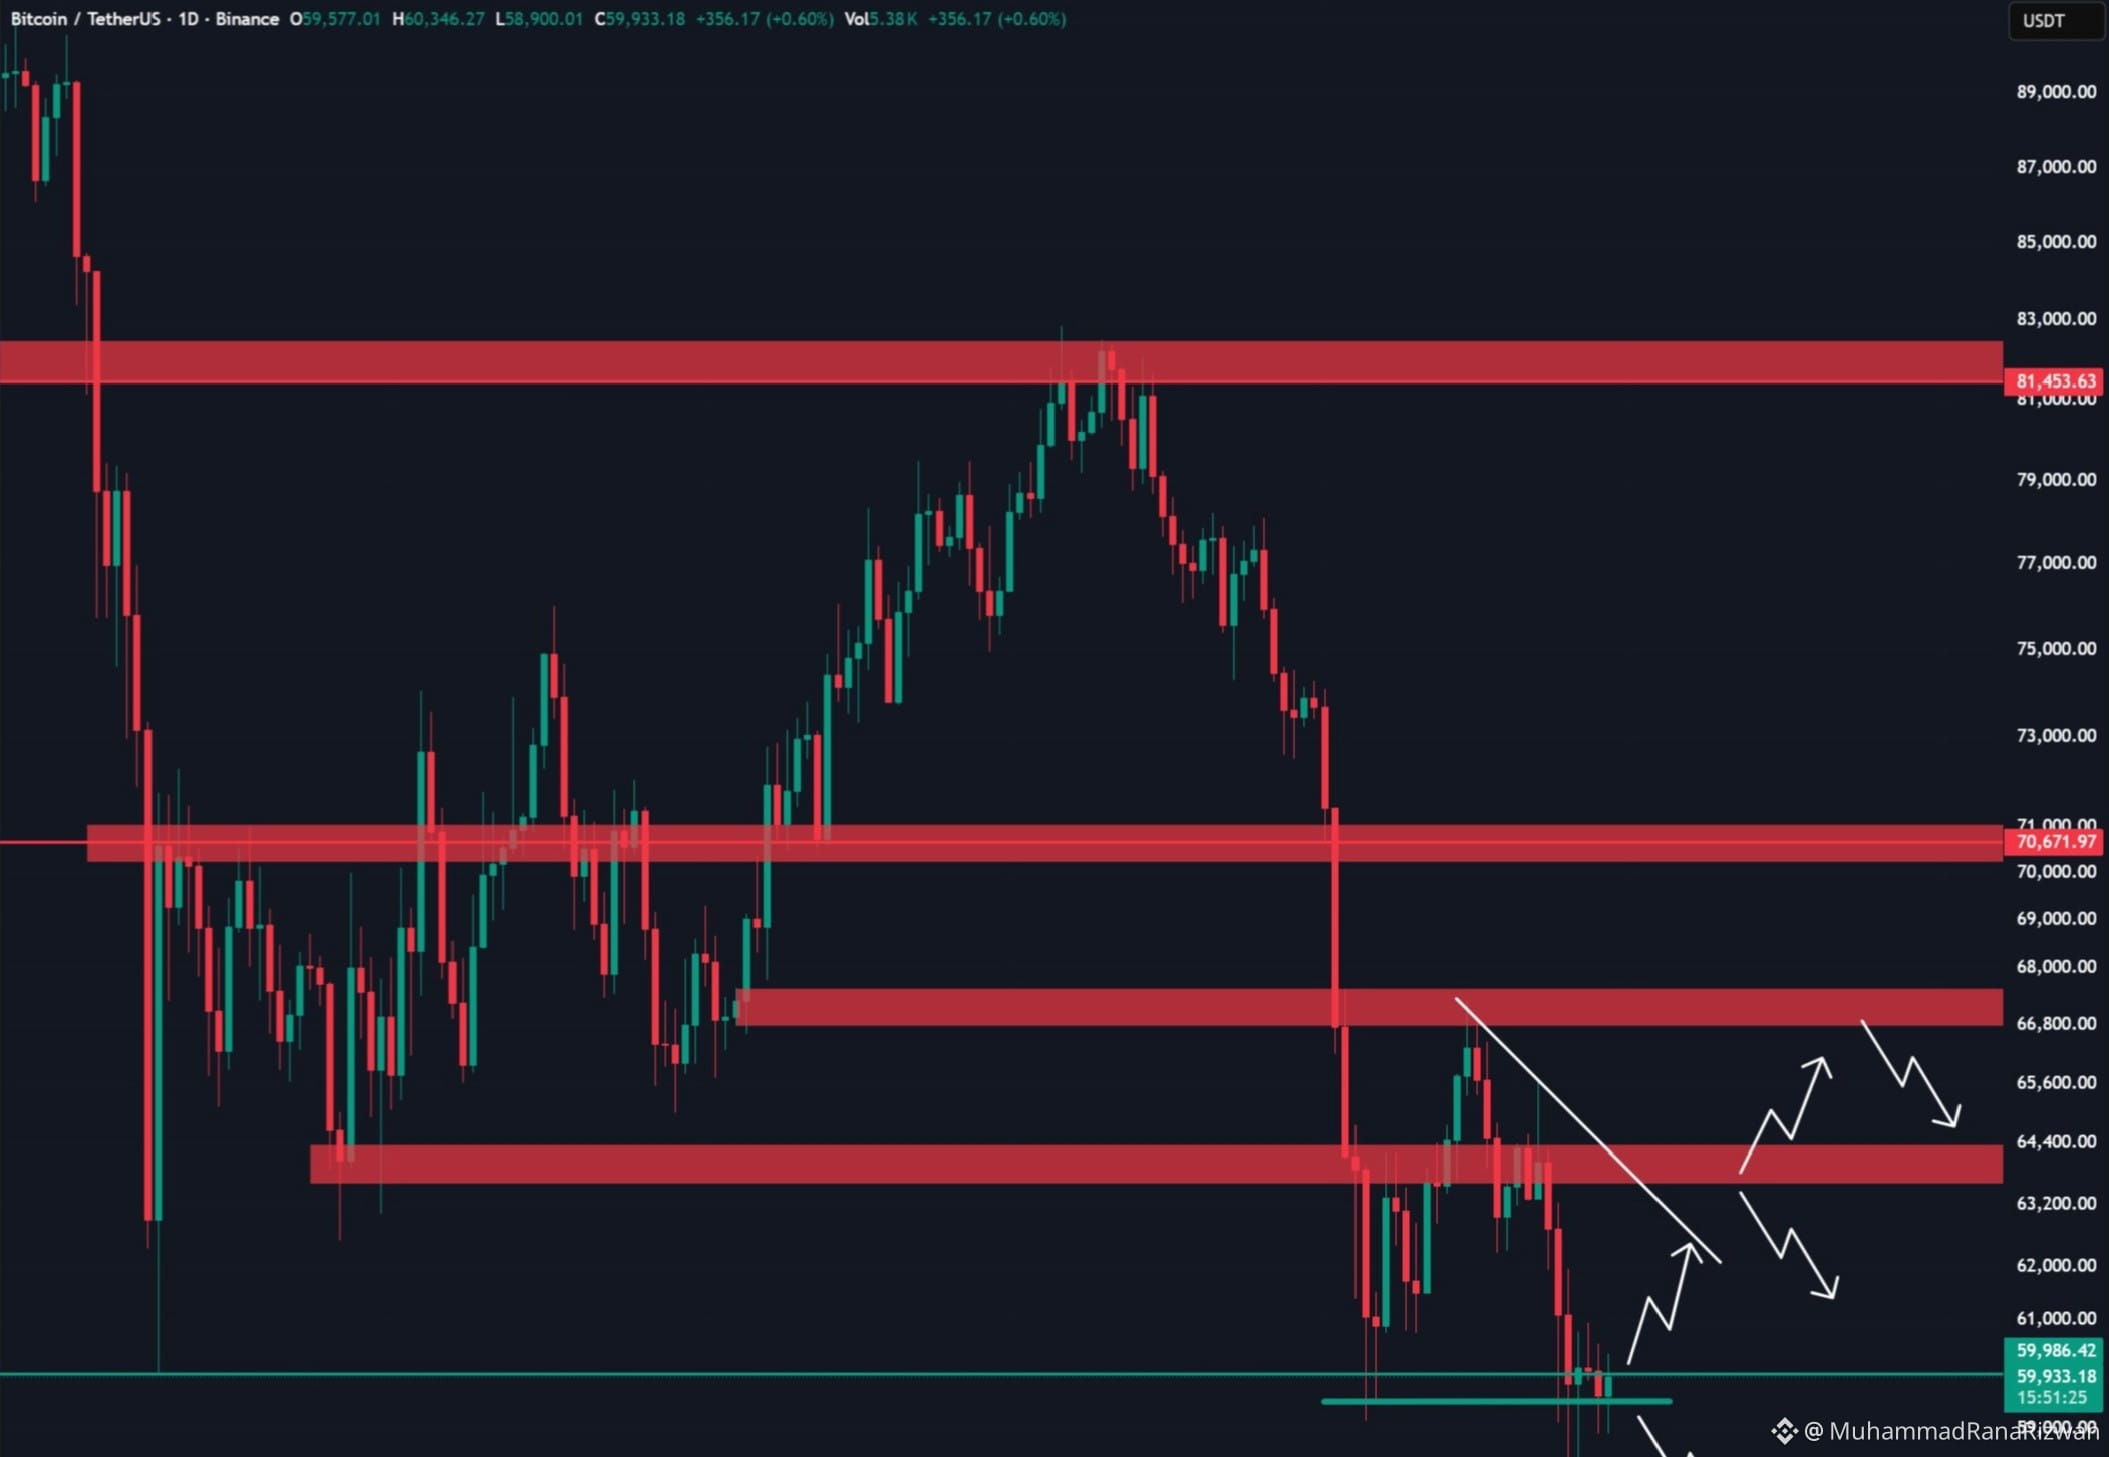
Bitcoin ($BTC C) is currently hovering right around the critical **$59,500 – $60,000** zone. After facing some heavy liquidations and institutional outflows recently, the entire crypto market is holding its breath.
The direction of the next massive move relies heavily on two key levels:
* **🟢 Bullish View:** Reclaiming and holding above **$61,000** could trigger short liquidation and push us right back into a recovery rally.
* **🔴 Bearish View:** Failing to hold the psychological **$58,000 – $59,000** support line could open the doors for a deeper retest toward $55,000.
Volitility is expanding, and a major move is brewing!
👇 **What do you think?**
Will BTC smash through resistance or are we heading for a deeper dump? Vote or comment your target below! 🚀👇
#Bitcoin #BTC #cryptouniverseofficial toTrading #Binance nceSquare #MarketAnalysis #CryptoNews #TechnicalAnalysis #BTCNextMove
·
--
Bearish
$BTC {spot}(BTCUSDT) #btc is hovering around the $60,000 level. It seems like liquidation hunting has been going on as the price has been moving within a $2,000-$3,000 range for almost a week. From here, Bitcoin needs to reclaim the $62,000 zone for any relief rally. On the downside, losing the $58,000 level will push Bitcoin towards the $55,000-$56,000 zone. #BTC #BTCNextMove BitcoinSpotETFsPost$1.79BOutflows#USFuturesRise
$BTC
#btc is hovering around the $60,000 level.

It seems like liquidation hunting has been going on as the price has been moving within a $2,000-$3,000 range for almost a week.

From here, Bitcoin needs to reclaim the $62,000 zone for any relief rally.

On the downside, losing the $58,000 level will push Bitcoin towards the $55,000-$56,000 zone.
#BTC #BTCNextMove BitcoinSpotETFsPost$1.79BOutflows#USFuturesRise
Article
BTC Volatility Shock: +16% Up, Then -83%$BITCOIN Volatility Shock: +16% Up, Then -83% Down in 5 Minutes $BITCOIN traders witnessed an extraordinary burst of volatility as BTC briefly surged by 16% before plunging by 83% within just five minutes. The move triggered widespread liquidations, rapid position unwinds, and intense market speculation across major exchanges. Such extreme price swings are often associated with thin liquidity, large leveraged positions, sudden order-book imbalances, or temporary pricing anomalies. While the dramatic candle attracted significant attention, traders are being urged to verify exchange data and avoid making emotional decisions during periods of heightened volatility. $NVDAB {spot}(NVDABUSDT) #BTCNextMove #BTC🔥🔥🔥🔥🔥

BTC Volatility Shock: +16% Up, Then -83%

$BITCOIN Volatility Shock: +16% Up, Then -83% Down in 5 Minutes
$BITCOIN traders witnessed an extraordinary burst of volatility as BTC briefly surged by 16% before plunging by 83% within just five minutes. The move triggered widespread liquidations, rapid position unwinds, and intense market speculation across major exchanges.
Such extreme price swings are often associated with thin liquidity, large leveraged positions, sudden order-book imbalances, or temporary pricing anomalies. While the dramatic candle attracted significant attention, traders are being urged to verify exchange data and avoid making emotional decisions during periods of heightened volatility.
$NVDAB
#BTCNextMove #BTC🔥🔥🔥🔥🔥
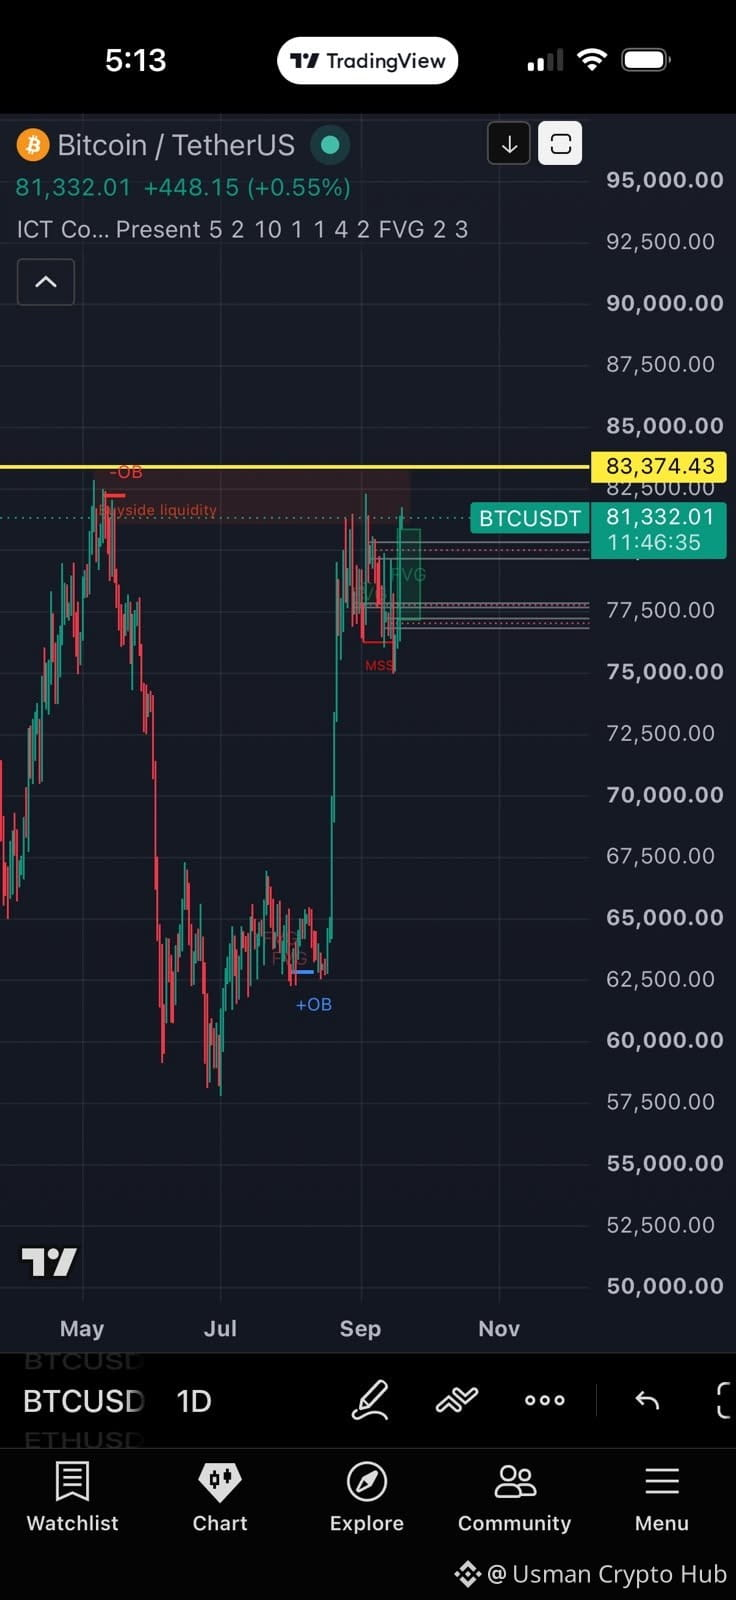
*Just my personal opinion, not financial advice. My marking could be wrong, but if it’s correct, we may see a small dump, then a move up to sweep Monday’s high, followed by a possible revisit of the $76K area.*✅ #Btc #BTCNextMove $BTC {future}(BTCUSDT)
*Just my personal opinion, not financial advice. My marking could be wrong, but if it’s correct, we may see a small dump, then a move up to sweep Monday’s high, followed by a possible revisit of the $76K area.*✅
#Btc #BTCNextMove $BTC
·
--
$BTC triggered $1.1 billion in liquidations and most traders still don't know what comes next. Here's what the charts are actually saying: {spot}(BTCUSDT) 📍 Current price: ~$66,000 📍 RSI: 35 — technically oversold territory 📍 50-day EMA: $61,454 — acting as key support 📍 200-day MA: $61,968 — price is dancing right around this level The bearish case: MACD is negative, selling pressure is still there, and macro headwinds (Fed rates, strong dollar) are keeping institutional buyers cautious. The bull case: RSI at 35 is where $BTC has historically bounced. ETF inflows returned last week. If $63,000 holds as support, next target is $66,500. My take? This isn't a crash. This is the market shaking out weak hands before the next move. The real question is are you a weak hand right now, or are you holding? Drop your honest answer below 👇 #BTC #CryptoAnalysis #BTCNextMove #BinanceSquare
$BTC triggered $1.1 billion in liquidations and most traders still don't know what comes next.

Here's what the charts are actually saying:

📍 Current price: ~$66,000
📍 RSI: 35 — technically oversold territory
📍 50-day EMA: $61,454 — acting as key support
📍 200-day MA: $61,968 — price is dancing right around this level

The bearish case: MACD is negative, selling pressure is still there, and macro headwinds (Fed rates, strong dollar) are keeping institutional buyers cautious.

The bull case: RSI at 35 is where $BTC has historically bounced. ETF inflows returned last week. If $63,000 holds as support, next target is $66,500.

My take? This isn't a crash. This is the market shaking out weak hands before the next move.

The real question is are you a weak hand right now, or are you holding?
Drop your honest answer below 👇

#BTC #CryptoAnalysis #BTCNextMove #BinanceSquare
·
--
Bearish
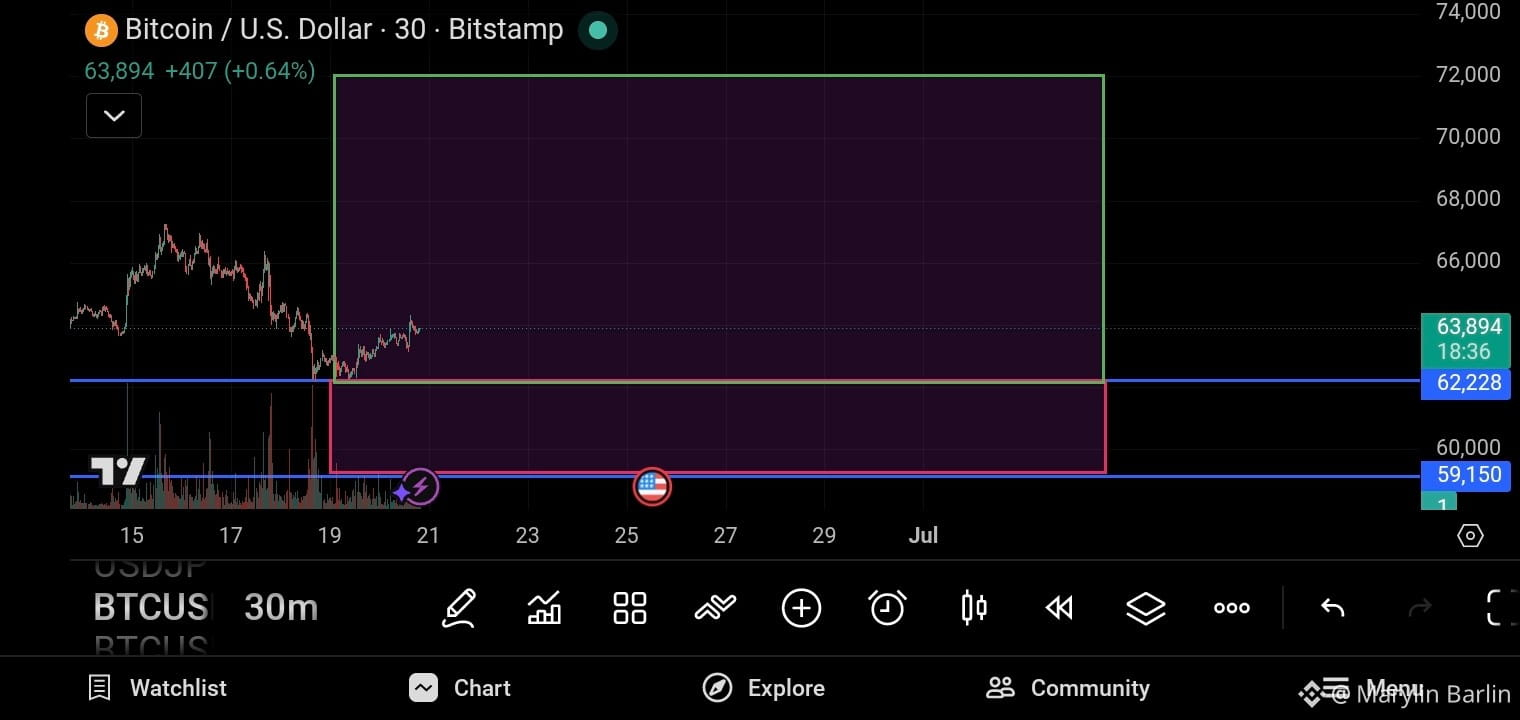
What will be Next move of market so On the base of chart Reading there are two major Support level for BTC no.1 is 62000$ if market gets support from this level the market can go bullish. no2. if market breaks this support then wait for 59100$ then you can go long or buy BTC let's wait this. #BTC #BTCNextMove
What will be Next move of market
so On the base of chart Reading
there are two major Support level for BTC
no.1 is 62000$ if market gets support from this level the market can go bullish.
no2. if market breaks this support then wait for 59100$ then you can go long or buy BTC
let's wait this. #BTC #BTCNextMove
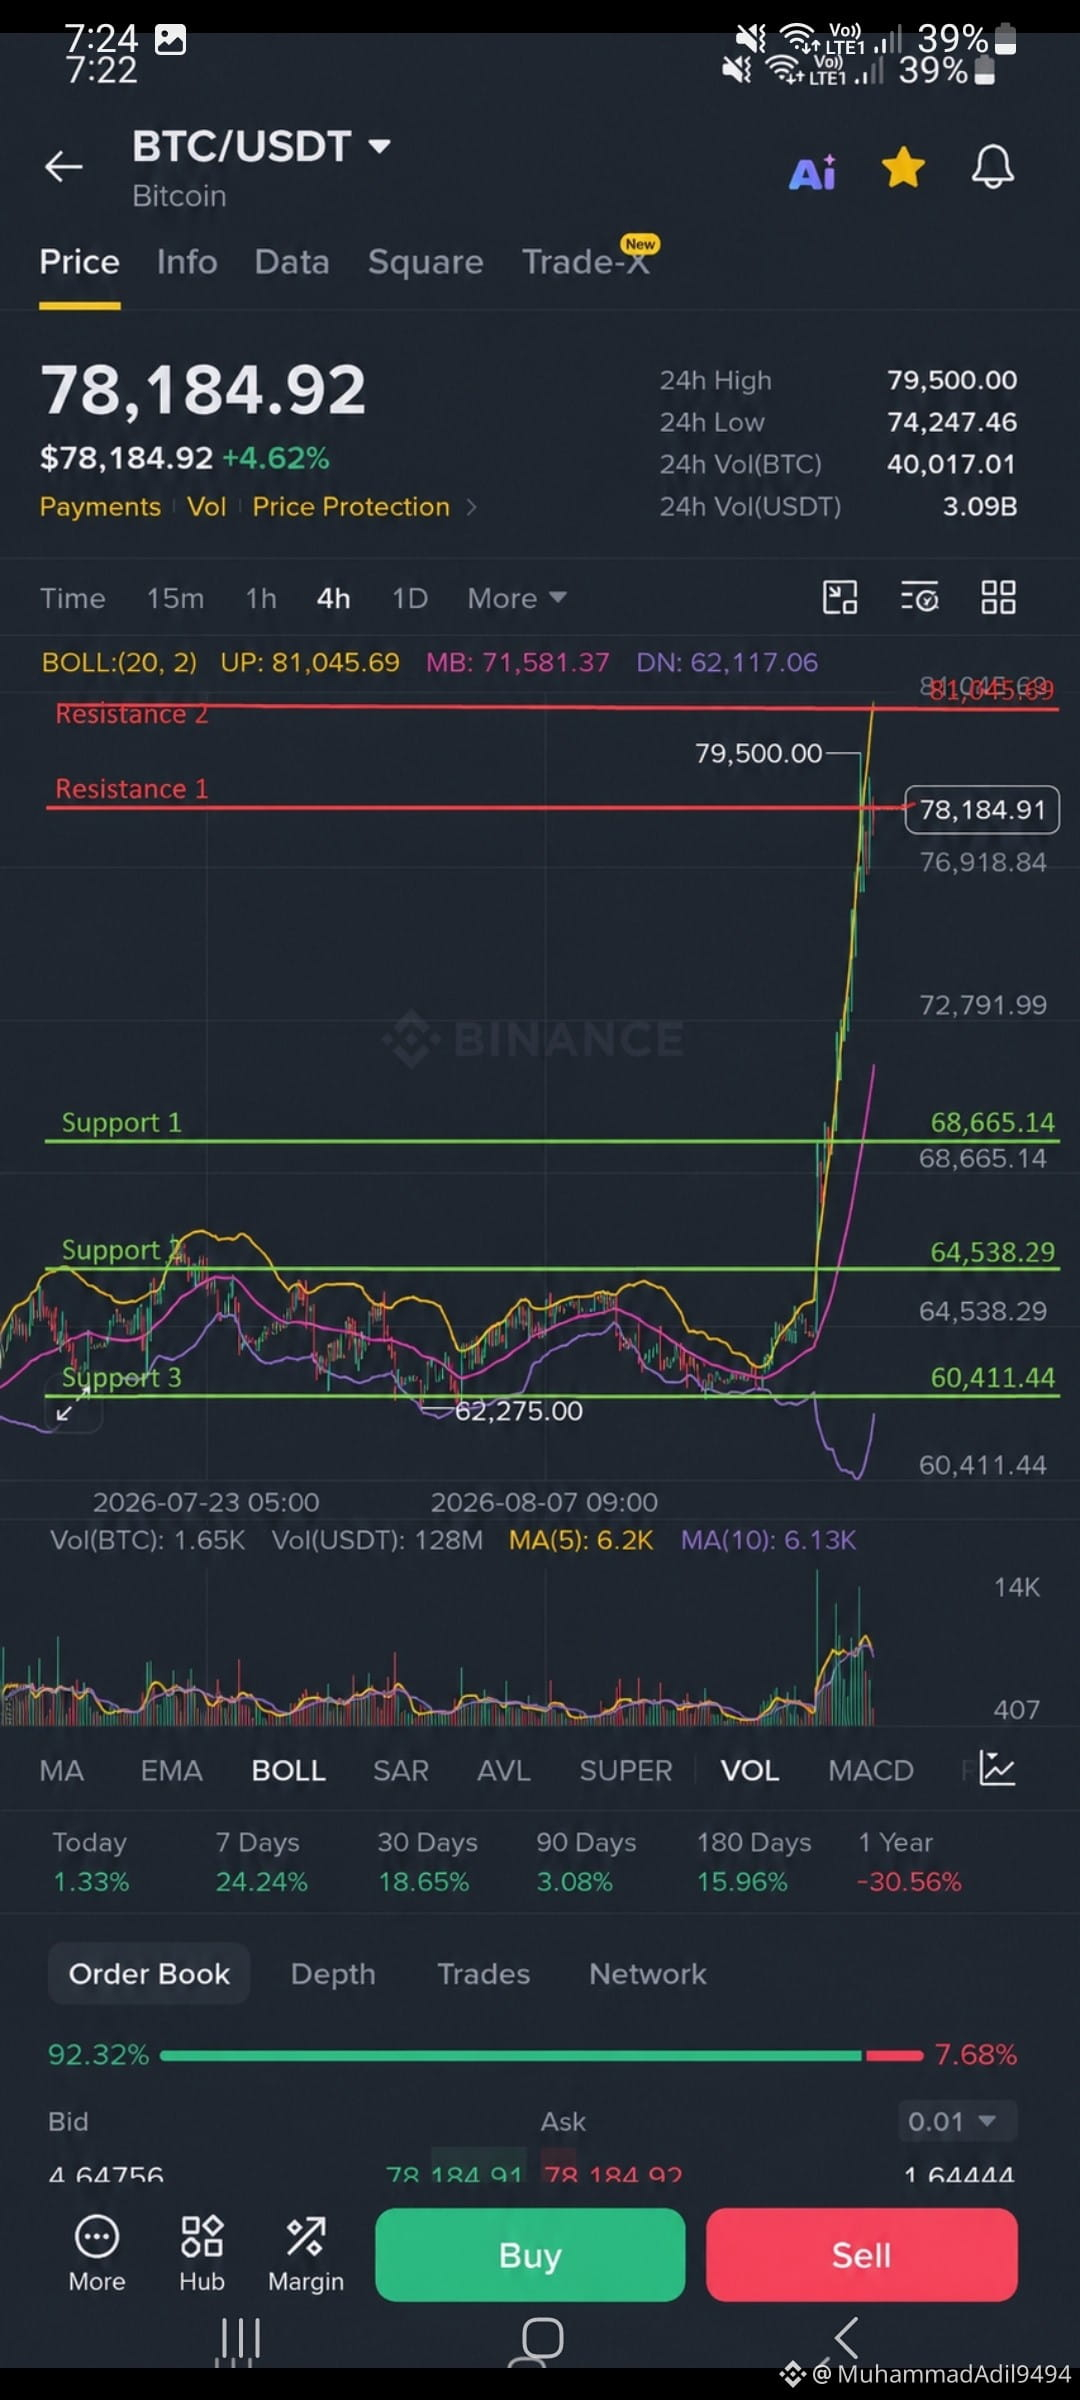
#Btc #Update #market #Btcnextmove Based on this BTC/USDT 4H chart, the key levels are: 🔴 Resistance R1: $79,500 — recent high R2: $81,000–$81,050 — Bollinger upper band / next major resistance 🟢 Support S1: $76,900 — immediate support S2: $72,800 — next support S3: $68,650–$68,700 — strong previous breakout area S4: $64,500 — major support S5: $62,275 — recent swing low Current price: ~$78,185. So BTC is currently between $76.9K support and $79.5K resistance. A 4H close above $79.5K could open the way toward $81K+; losing $76.9K could bring a pullback toward $72.8K.
#Btc #Update #market #Btcnextmove
Based on this BTC/USDT 4H chart, the key levels are:
🔴 Resistance
R1: $79,500 — recent high
R2: $81,000–$81,050 — Bollinger upper band / next major resistance
🟢 Support
S1: $76,900 — immediate support
S2: $72,800 — next support
S3: $68,650–$68,700 — strong previous breakout area
S4: $64,500 — major support
S5: $62,275 — recent swing low
Current price: ~$78,185.
So BTC is currently between $76.9K support and $79.5K resistance. A 4H close above $79.5K could open the way toward $81K+; losing $76.9K could bring a pullback toward $72.8K.
·
--
Bullish
Will BTC hit $70,000 or $90,000 first?

Will BTC hit $70,000 or $90,000 first?

49%$70k50%$90k
Volume $39.72
📊 NEW SIGNAL Asset: $BTC /USD BIAS: BUY CONFIDENCE: 9.0/10 ⏳ WAIT FOR CONFIRMATION BUY ABOVE: 65,750 🎯 TP1: 66,000 🎯 TP2: 66,350 🎯 TP3: 66,800 🛑 SL: 65,450 ✅ Confirm: M5 aur M15 dono 65,750 ke upar strong bullish candle close dein aur volume increase ho. ❌ Cancel: M15 candle 65,450 ke neeche close de ya price 65,300 ke neeche sustain kare. 📌 Reason: • H4 bullish structure intact hai aur higher highs continue hain. • H1 EMA20 aur EMA50 dono ke upar trade kar raha hai. • M15 me breakout ke baad bullish flag jaisi consolidation nazar aa rahi hai. • M5 me buyers control me hain aur resistance ko repeatedly test kar rahe hain. • Agar 65,750 decisively break hota hai to liquidity move 66k+ ki taraf ja sakta hai. ⚠️ DISCLAIMER: This analysis is for educational purposes only and is not financial advice. Always manage your risk and trade at your own responsibility. {future}(BTCUSDT) #BitcoinReclaims$65K #KoreanTradersCutLeverageToThreeMonthLow #BTCNextMove #SolvBTCExploitedAfterDeployerKeyLeak
📊 NEW SIGNAL

Asset: $BTC /USD

BIAS: BUY

CONFIDENCE: 9.0/10

⏳ WAIT FOR CONFIRMATION

BUY ABOVE: 65,750

🎯 TP1: 66,000
🎯 TP2: 66,350
🎯 TP3: 66,800

🛑 SL: 65,450

✅ Confirm:
M5 aur M15 dono 65,750 ke upar strong bullish candle close dein aur volume increase ho.

❌ Cancel:
M15 candle 65,450 ke neeche close de ya price 65,300 ke neeche sustain kare.

📌 Reason:
• H4 bullish structure intact hai aur higher highs continue hain.
• H1 EMA20 aur EMA50 dono ke upar trade kar raha hai.
• M15 me breakout ke baad bullish flag jaisi consolidation nazar aa rahi hai.
• M5 me buyers control me hain aur resistance ko repeatedly test kar rahe hain.
• Agar 65,750 decisively break hota hai to liquidity move 66k+ ki taraf ja sakta hai.

⚠️ DISCLAIMER:
This analysis is for educational purposes only and is not financial advice. Always manage your risk and trade at your own responsibility.
#BitcoinReclaims$65K #KoreanTradersCutLeverageToThreeMonthLow #BTCNextMove #SolvBTCExploitedAfterDeployerKeyLeak
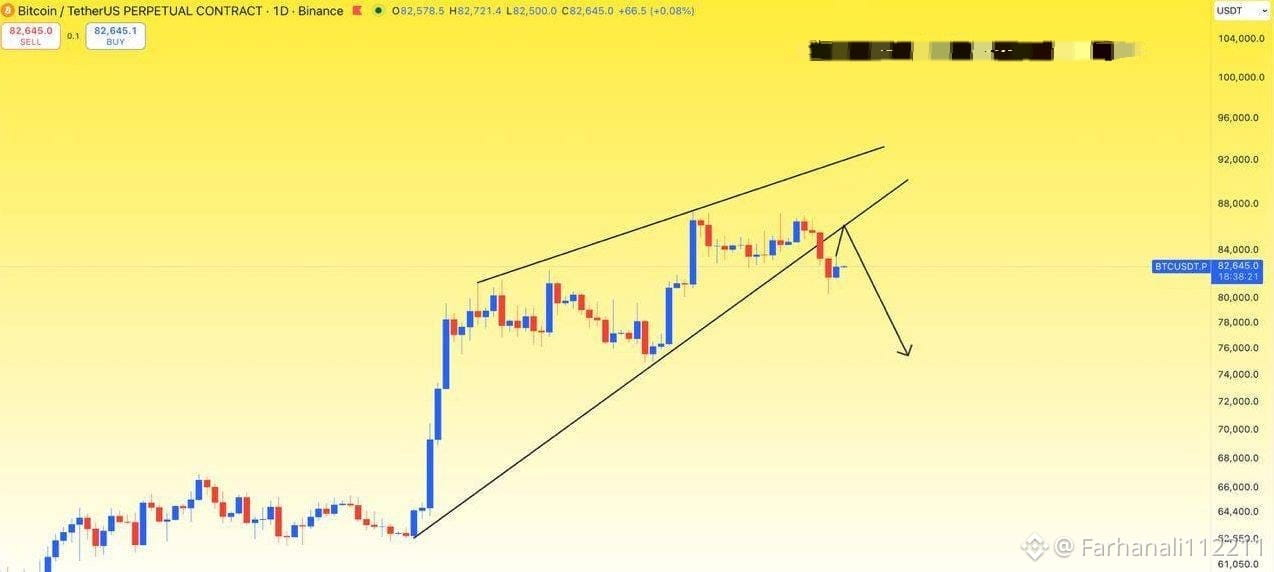
July Lows Coming Again? Well Atleast We See $70k, Next Plan Will Be Updated After That! $BTC #BTCNextMove 🔴

·
--
Bullish
📈 What is Bitcoins next move ? Core Market Movers * BTC: Dropped below $63,000, signaling a pivot toward selective trading. While blind momentum plays proved risky, specific altcoins managed significant rallies. * BTW: Climbed +43% this week following a massive +167% jump the week prior, hitting a fresh ATH near $0.30. RSI indicates heavily overbought conditions driven by high FOMO. * WLD: Rebounded +11%, ending a seven-week slide. The last time a downstreak of this length snapped (back in May), it triggered a 100%+ run. * WLFI: Up +10.5%. Reclaiming $0.10 remains the major milestone after holding a multi-month range between $0.05–$0.10. Notable Pullbacks * UNI: Fell -17%, breaking a six-week green streak as profit-taking set in. $4.50 is the critical support level to defend. * ADA: Slid -9.8%, with the $0.15 zone serving as crucial support to maintain its macro range. * PEPE: Declined -8.8%. Needs to reclaim $0.000003 to regain bullish structure, while $0.000002 acts as immediate downside support. High-Beta Outliers * AKE: +150% * H: +100.5% * VTCN: +87% Capital hasn't exited the space—it's just moving with much higher precision. Indiscriminately chasing breakouts in this environment carries steep downside risk. Always manage your risk and DYOR. #BTCNextMove #PriceCorrection #DYOR!! #1MViews

📈 What is Bitcoins next move ?
Core Market Movers
* BTC: Dropped below $63,000, signaling a pivot toward selective trading. While blind momentum plays proved risky, specific altcoins managed significant rallies.
* BTW: Climbed +43% this week following a massive +167% jump the week prior, hitting a fresh ATH near $0.30. RSI indicates heavily overbought conditions driven by high FOMO.
* WLD: Rebounded +11%, ending a seven-week slide. The last time a downstreak of this length snapped (back in May), it triggered a 100%+ run.
* WLFI: Up +10.5%. Reclaiming $0.10 remains the major milestone after holding a multi-month range between $0.05–$0.10.
Notable Pullbacks
* UNI: Fell -17%, breaking a six-week green streak as profit-taking set in. $4.50 is the critical support level to defend.
* ADA: Slid -9.8%, with the $0.15 zone serving as crucial support to maintain its macro range.
* PEPE: Declined -8.8%. Needs to reclaim $0.000003 to regain bullish structure, while $0.000002 acts as immediate downside support.
High-Beta Outliers
* AKE: +150%
* H: +100.5%
* VTCN: +87%
Capital hasn't exited the space—it's just moving with much higher precision. Indiscriminately chasing breakouts in this environment carries steep downside risk. Always manage your risk and DYOR.
#BTCNextMove #PriceCorrection #DYOR!! #1MViews
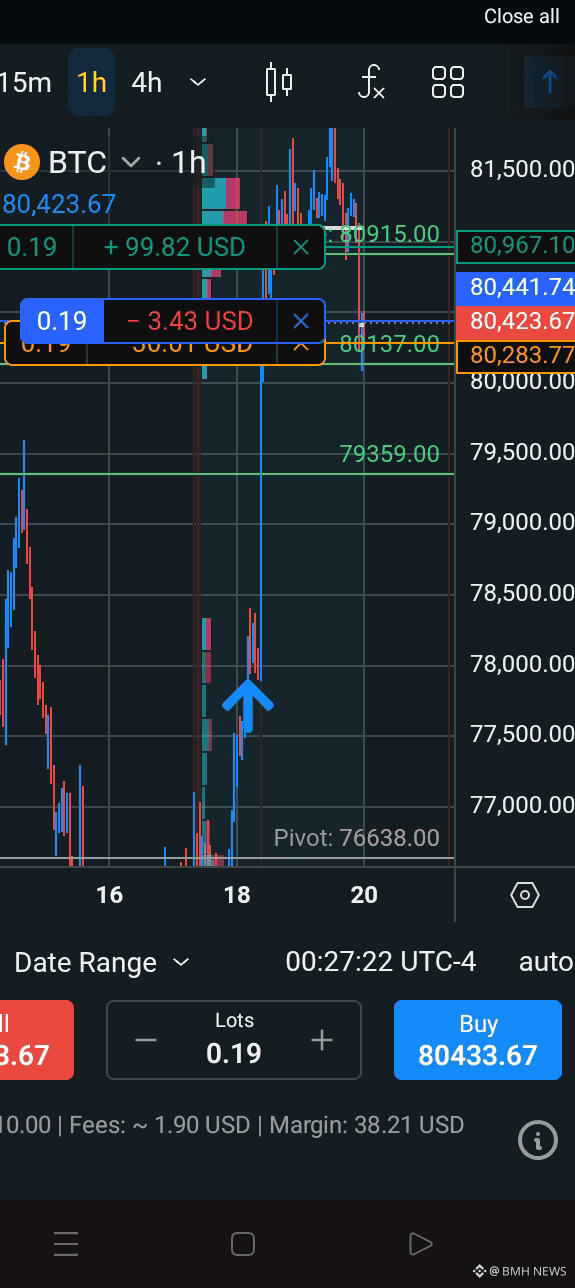
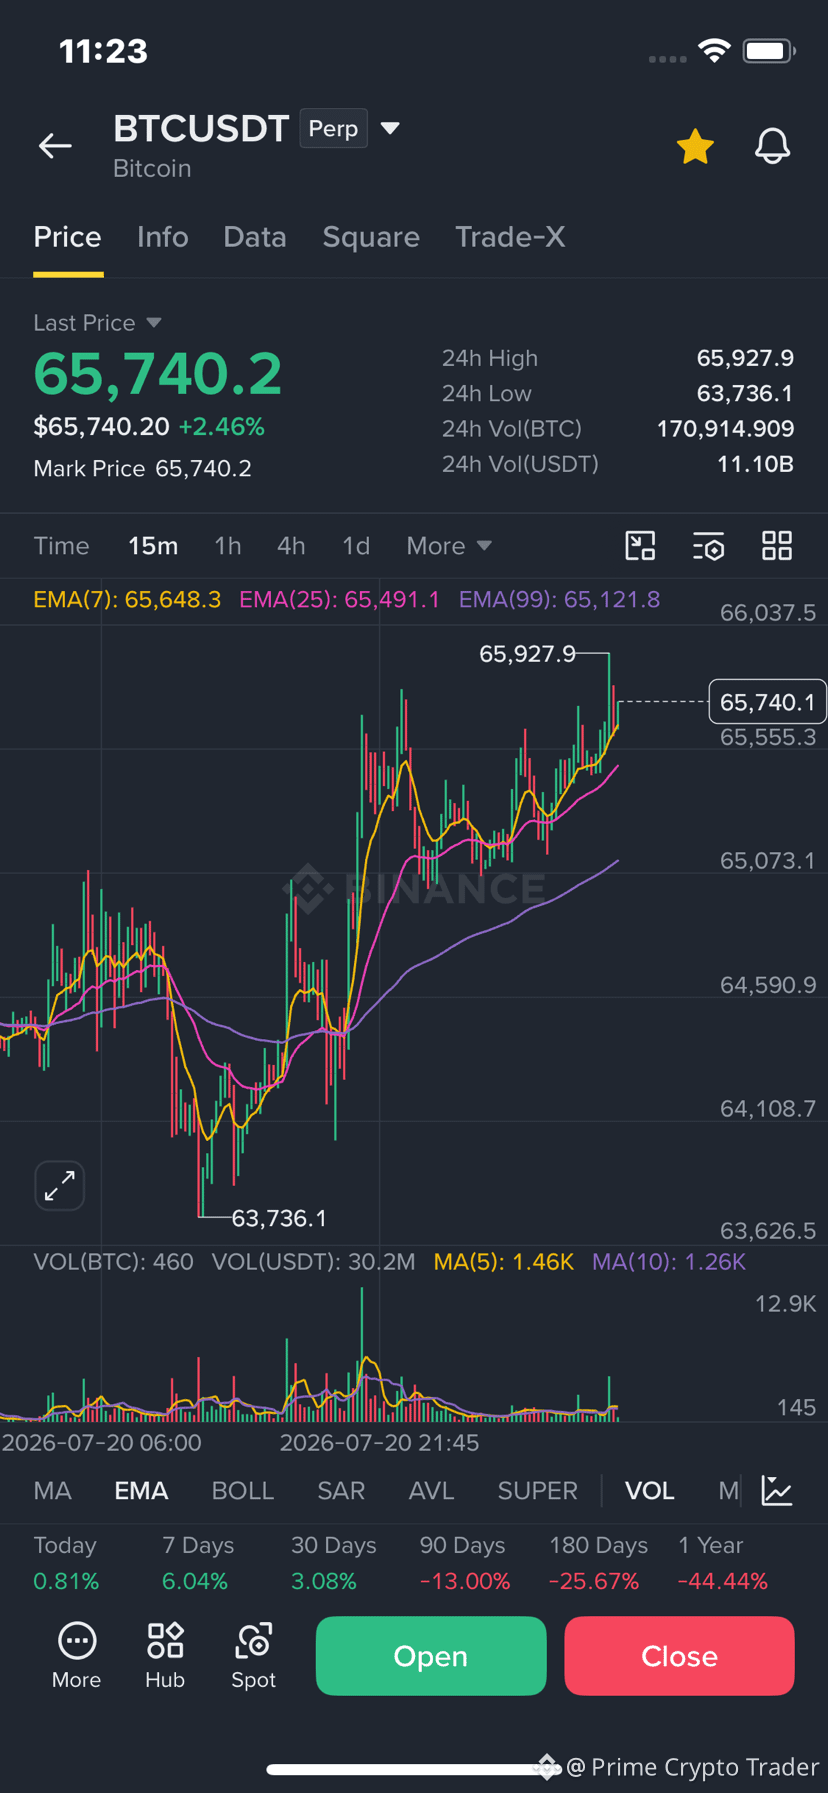
$BTC Hy My Friends , i invest Some amount in BTC , What Do you think about #BTC what is Next Price Target 🎯 Will i face the loss or Profit in Spot ? #BTCNextMove 👇🏼 {future}(BTCUSDT)
$BTC Hy My Friends , i invest Some amount in BTC , What Do you think about #BTC what is Next Price Target 🎯 Will i face the loss or Profit in Spot ? #BTCNextMove
👇🏼
60,000
35%
61,000
12%
62,000
0%
63,000
53%
17 votes • Voting closed
Log in to explore more content
Join global crypto users on Binance Square
⚡️ Get latest and useful information about crypto.
💬 Trusted by the world’s largest crypto exchange.
👍 Discover real insights from verified creators.
Email / Phone number