
#btcreboundsabove
btcreboundsabove
1,150 views
84 Discussing
Hot
Latest
$BTC REBOUNDS ABOVE $60K - But Is This Real Recovery Or Just A Trap? 👀
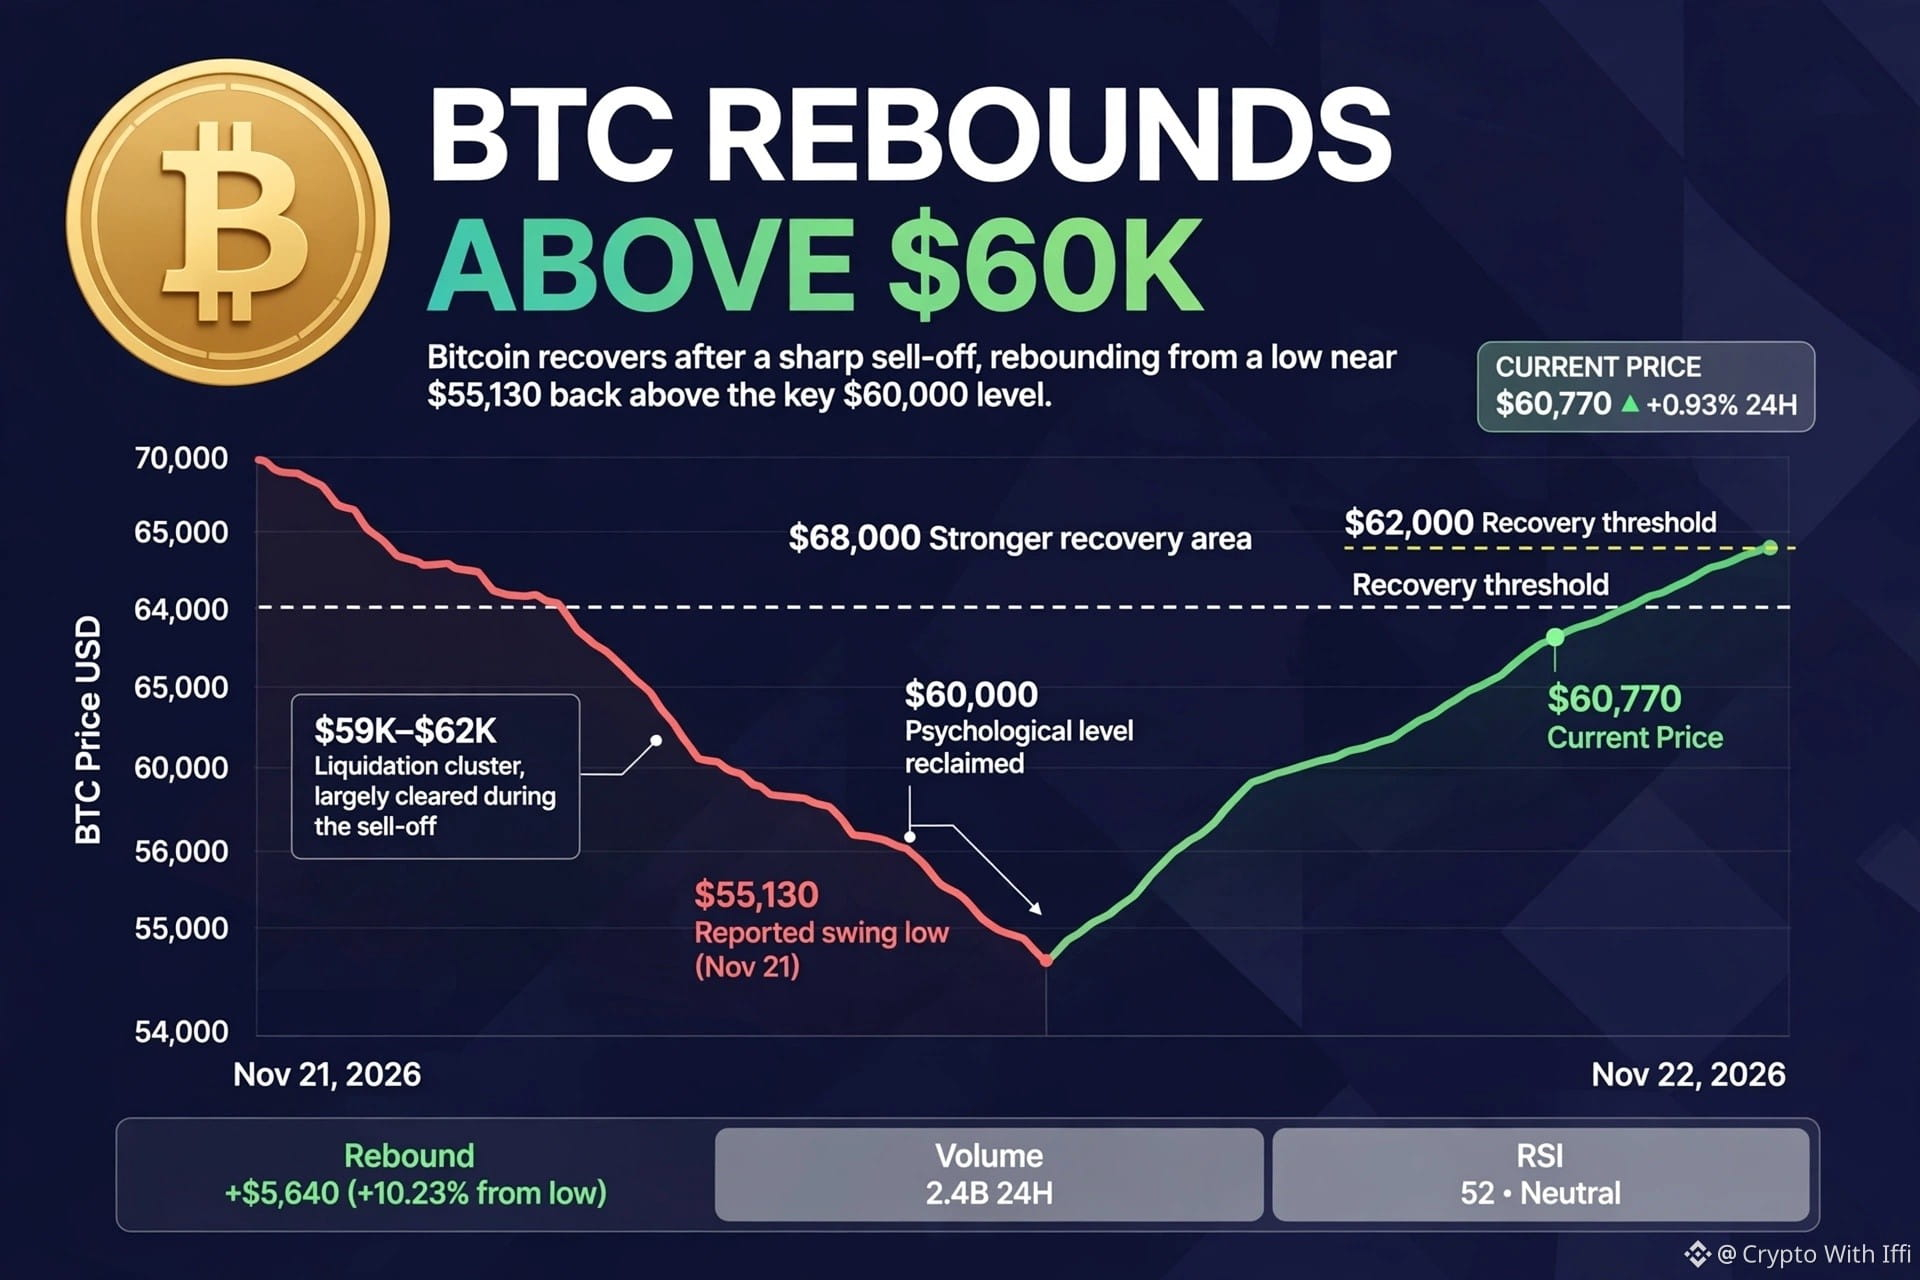
Bitcoin is back above $60,000 again!
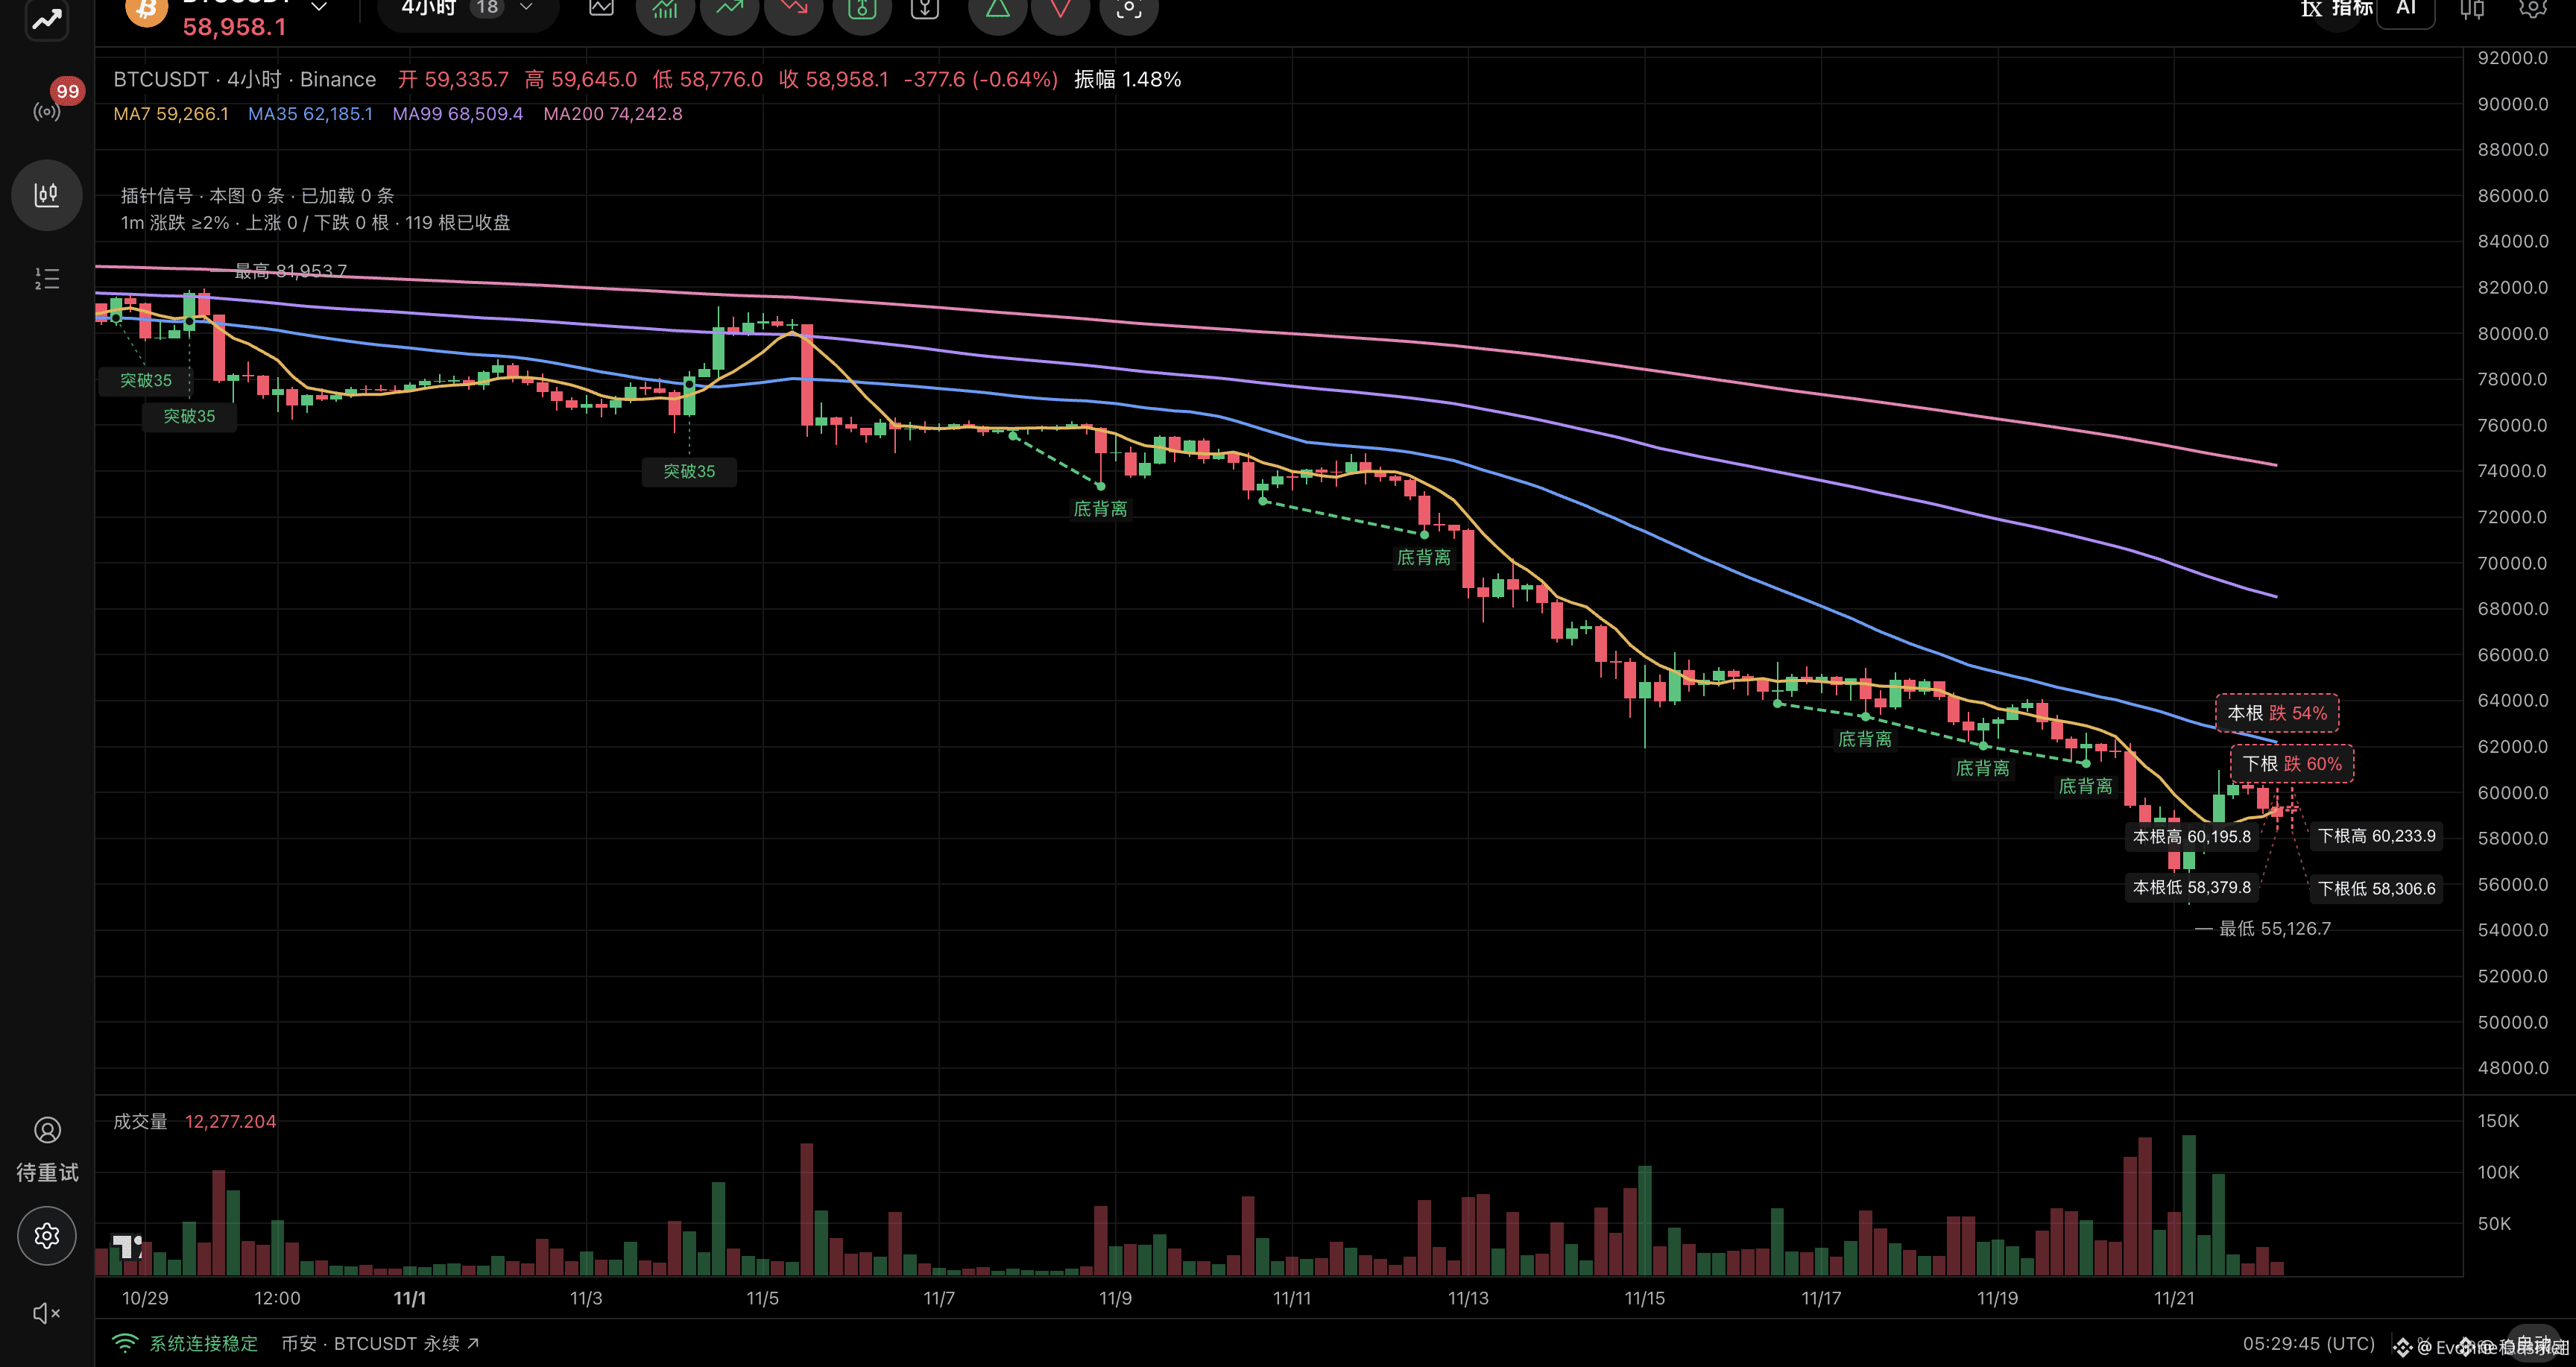
After a brutal sell-off, BTC dumped to a low near $55,130 - its lowest level since September 2024. That move wiped out approx $1.8 BILLION in leveraged positions, and long traders took the biggest hit.
Now BTC is trading around $60,770, up +3% to +5% in last 24h. Buyers are finally stepping in at lower levels.
But let's be real...
This is NOT a confirmed trend reversal yet.
Why I am still cautious:
1. BTC needs to HOLD above $60K and build momentum. If it fails here, we can see renewed selling pressure again.
2. This bounce looks more like short-covering after a huge dump, not strong whale accumulation.
3. Next key check is Monday ETF flow data - that will show if real demand is coming back or not.
My plan is simple:
No FOMO, No chasing green candles.
Wait for confirmation above $60,886. If BTC holds, then short-term recovery is possible. If it loses $58,700 pivot, then $55,150 low can be tested again.
After such a sharp decline, patience is better than prediction.
What do you think guys?
Is this a real bottom or just a dead-cat bounce before another dip?
Drop your view in comments 👇
$BTC #BTCReboundsAbove
$BTC REBOUNDS ABOVE $60K - But Is This Real Recovery Or Just A Trap? 👀
Bitcoin is back above $60,000 again!
After a brutal sell-off, BTC dumped to a low near $55,130 - its lowest level since September 2024. That move wiped out approx $1.8 BILLION in leveraged positions, and long traders took the biggest hit.
Now BTC is trading around $60,770, up +3% to +5% in last 24h. Buyers are finally stepping in at lower levels.
But let's be real...
This is NOT a confirmed trend reversal yet.
Why I am still cautious:
1. BTC needs to HOLD above $60K and build momentum. If it fails here, we can see renewed selling pressure again.
2. This bounce looks more like short-covering after a huge dump, not strong whale accumulation.
3. Next key check is Monday ETF flow data - that will show if real demand is coming back or not.
My plan is simple:
No FOMO, No chasing green candles.
Wait for confirmation above $60,886. If BTC holds, then short-term recovery is possible. If it loses $58,700 pivot, then $55,150 low can be tested again.
After such a sharp decline, patience is better than prediction.
What do you think guys?
Is this a real bottom or just a dead-cat bounce before another dip?
Drop your view in comments 👇
$BTC #BTCReboundsAbove
Bitcoin is back above $60,000 again!
After a brutal sell-off, BTC dumped to a low near $55,130 - its lowest level since September 2024. That move wiped out approx $1.8 BILLION in leveraged positions, and long traders took the biggest hit.
Now BTC is trading around $60,770, up +3% to +5% in last 24h. Buyers are finally stepping in at lower levels.
But let's be real...
This is NOT a confirmed trend reversal yet.
Why I am still cautious:
1. BTC needs to HOLD above $60K and build momentum. If it fails here, we can see renewed selling pressure again.
2. This bounce looks more like short-covering after a huge dump, not strong whale accumulation.
3. Next key check is Monday ETF flow data - that will show if real demand is coming back or not.
My plan is simple:
No FOMO, No chasing green candles.
Wait for confirmation above $60,886. If BTC holds, then short-term recovery is possible. If it loses $58,700 pivot, then $55,150 low can be tested again.
After such a sharp decline, patience is better than prediction.
What do you think guys?
Is this a real bottom or just a dead-cat bounce before another dip?
Drop your view in comments 👇
$BTC #BTCReboundsAbove
1
1
2
312

·
--
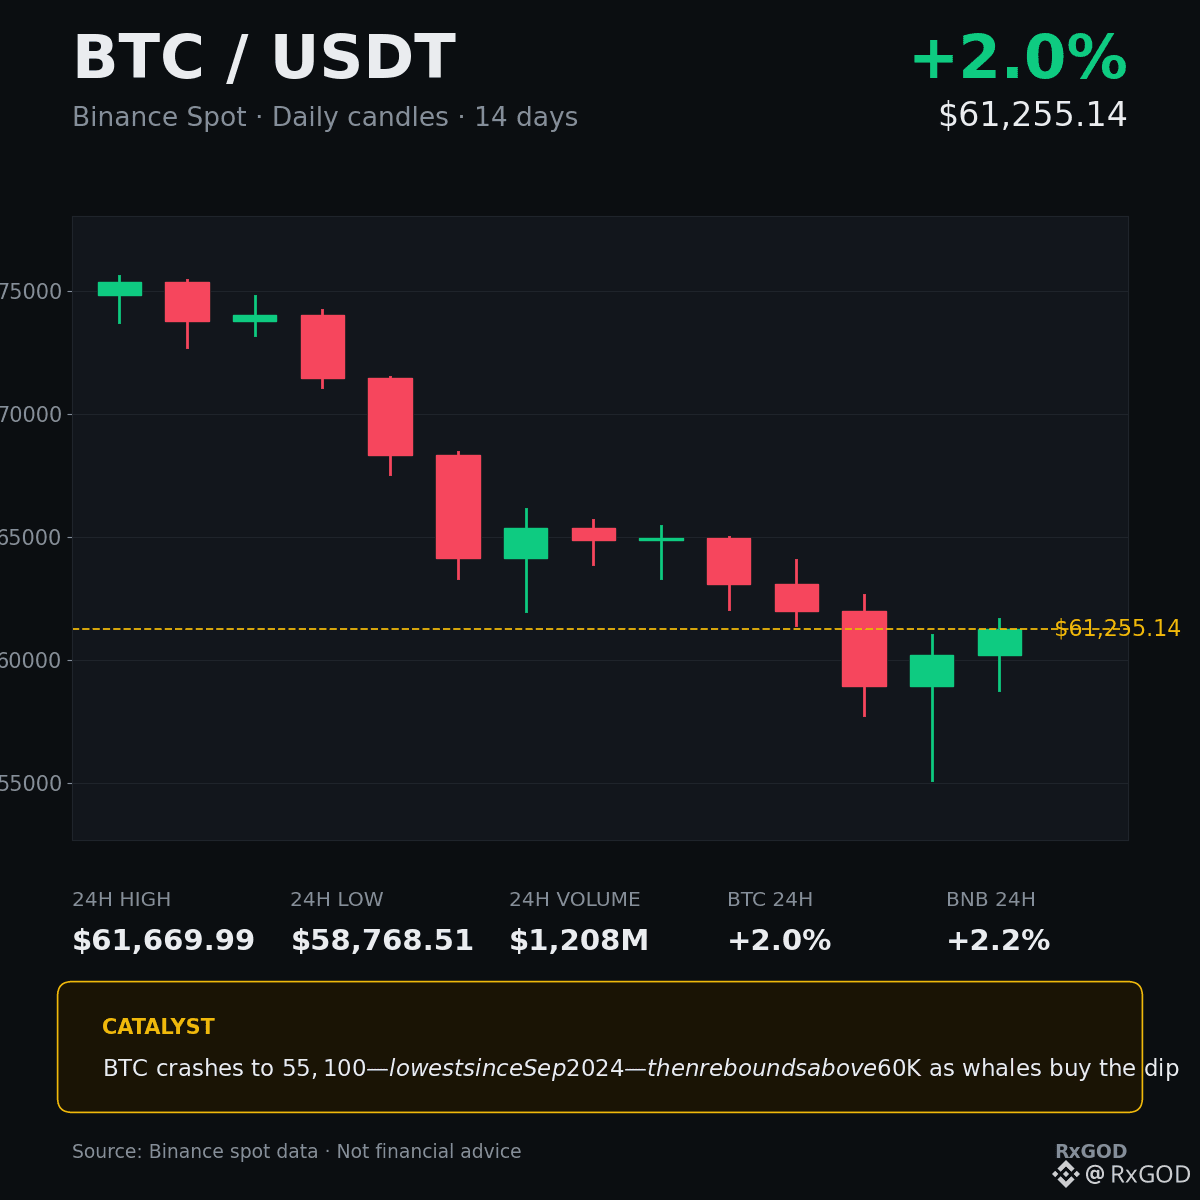
Bitcoin just staged one of the wildest weekend reversals of the year — crashing to $55,100, its lowest since September 2024, then clawing back above $60,000 within hours.
$BTC fell below $60,000 on Friday for the first time since July, then flushed to around $55,100 early Saturday before closing the day near $60,089, up 2.18%. It now trades around $61,205 on Binance, up 2.07% in 24 hours on $1.21B spot volume.
The move was driven by forced selling first, then buying: roughly $1.36–2.67B in crypto positions were liquidated in 24 hours, and the flush triggered short covering plus whale dip-buying — Abraxas Capital and other large wallets stepped in as $BTC reclaimed $60,000, making it the top trending topic on Binance Square.
But the backdrop is still fragile. US spot Bitcoin ETFs saw $582 million in net outflows on November 19, BlackRock's IBIT alone losing $541 million in its largest single-day outflow, with November outflows near $3.47B. The Nasdaq fell over 4% on Friday as AI-valuation fears spread, and the Fear & Greed Index sits at 8 — Extreme Fear.
Technically, this is a bounce inside a downtrend, not a confirmed reversal. $BTC is still down 18.8% over 14 days, sitting near the lower third of its $55,130–$75,599 range. Holding the ~$58,700 pivot matters; losing it reopens the $55,150 low, while resistance sits at $64,000–$64,500. $BNB and the wider market are following Bitcoin's lead for now.
Not financial advice — DYOR.
#BTCReboundsAbove$60KAmidWhaleDipBuying #ExtremeFear #CryptoNews #Bitcoin
Bitcoin just staged one of the wildest weekend reversals of the year — crashing to $55,100, its lowest since September 2024, then clawing back above $60,000 within hours.
$BTC fell below $60,000 on Friday for the first time since July, then flushed to around $55,100 early Saturday before closing the day near $60,089, up 2.18%. It now trades around $61,205 on Binance, up 2.07% in 24 hours on $1.21B spot volume.
The move was driven by forced selling first, then buying: roughly $1.36–2.67B in crypto positions were liquidated in 24 hours, and the flush triggered short covering plus whale dip-buying — Abraxas Capital and other large wallets stepped in as $BTC reclaimed $60,000, making it the top trending topic on Binance Square.
But the backdrop is still fragile. US spot Bitcoin ETFs saw $582 million in net outflows on November 19, BlackRock's IBIT alone losing $541 million in its largest single-day outflow, with November outflows near $3.47B. The Nasdaq fell over 4% on Friday as AI-valuation fears spread, and the Fear & Greed Index sits at 8 — Extreme Fear.
Technically, this is a bounce inside a downtrend, not a confirmed reversal. $BTC is still down 18.8% over 14 days, sitting near the lower third of its $55,130–$75,599 range. Holding the ~$58,700 pivot matters; losing it reopens the $55,150 low, while resistance sits at $64,000–$64,500. $BNB and the wider market are following Bitcoin's lead for now.
Not financial advice — DYOR.
#BTCReboundsAbove$60KAmidWhaleDipBuying #ExtremeFear #CryptoNews #Bitcoin
$BTC fell below $60,000 on Friday for the first time since July, then flushed to around $55,100 early Saturday before closing the day near $60,089, up 2.18%. It now trades around $61,205 on Binance, up 2.07% in 24 hours on $1.21B spot volume.
The move was driven by forced selling first, then buying: roughly $1.36–2.67B in crypto positions were liquidated in 24 hours, and the flush triggered short covering plus whale dip-buying — Abraxas Capital and other large wallets stepped in as $BTC reclaimed $60,000, making it the top trending topic on Binance Square.
But the backdrop is still fragile. US spot Bitcoin ETFs saw $582 million in net outflows on November 19, BlackRock's IBIT alone losing $541 million in its largest single-day outflow, with November outflows near $3.47B. The Nasdaq fell over 4% on Friday as AI-valuation fears spread, and the Fear & Greed Index sits at 8 — Extreme Fear.
Technically, this is a bounce inside a downtrend, not a confirmed reversal. $BTC is still down 18.8% over 14 days, sitting near the lower third of its $55,130–$75,599 range. Holding the ~$58,700 pivot matters; losing it reopens the $55,150 low, while resistance sits at $64,000–$64,500. $BNB and the wider market are following Bitcoin's lead for now.
Not financial advice — DYOR.
#BTCReboundsAbove$60KAmidWhaleDipBuying #ExtremeFear #CryptoNews #Bitcoin
48

📰 $BTC Rebounds Above $60K Amid Whale Dip Buying
Bitcoin is holding above $60K — $60,630 on Binance spot (live check 21:30 ICT 22 Nov) — and the rebound is still the #1 trending topic on Binance Square.
The contrast traders are watching:
• Fear & Greed is still at 8 — Extreme Fear, even as price recovers
• Square is discussing whale dip-buying as the fuel behind the bounce
• Majors are holding green: $ETH $1,703, $BNB $555, SOL $70.10
Question for the week: is this a real reversal, or a relief bounce inside Extreme Fear?
#BTCReboundsAbove$60KAmidWhaleDipBuying
Not financial advice. DYOR.
$BTC $ETH $BNB
📰 $BTC Rebounds Above $60K Amid Whale Dip Buying
Bitcoin is holding above $60K — $60,630 on Binance spot (live check 21:30 ICT 22 Nov) — and the rebound is still the #1 trending topic on Binance Square.
The contrast traders are watching:
• Fear & Greed is still at 8 — Extreme Fear, even as price recovers
• Square is discussing whale dip-buying as the fuel behind the bounce
• Majors are holding green: $ETH $1,703, $BNB $555, SOL $70.10
Question for the week: is this a real reversal, or a relief bounce inside Extreme Fear?
#BTCReboundsAbove$60KAmidWhaleDipBuying
Not financial advice. DYOR.
$BTC $ETH $BNB
Bitcoin is holding above $60K — $60,630 on Binance spot (live check 21:30 ICT 22 Nov) — and the rebound is still the #1 trending topic on Binance Square.
The contrast traders are watching:
• Fear & Greed is still at 8 — Extreme Fear, even as price recovers
• Square is discussing whale dip-buying as the fuel behind the bounce
• Majors are holding green: $ETH $1,703, $BNB $555, SOL $70.10
Question for the week: is this a real reversal, or a relief bounce inside Extreme Fear?
#BTCReboundsAbove$60KAmidWhaleDipBuying
Not financial advice. DYOR.
$BTC $ETH $BNB
109

·
--
🚨 $BTC Back Above $60K — Bottom or Bull Trap?
Bitcoin dipped to around $55,600 on Nov 21, then reclaimed $60,000 the same evening. Two whale moves stand out:
🐋 Abraxas Capital withdrew 17,597 BTC (~$1.04B) from exchanges at an average of ~$59,206 (per Lookonchain). Coins leaving exchanges usually signal holding, not selling.
💵 Garrett Jin moved $65M in stablecoins onto exchanges and posted "time to bid." Stablecoins landing on exchanges = fresh buying power.
So is this the bottom? Here's how I read it:
✅ Bull case: Whales accumulating near $59K gives that zone real support. Holding above $60K flips it from resistance back into support.
⚠️ Bear case: Global stocks are on their longest losing streak since 2023, and BlackRock's IBIT just posted a record $541M single-day outflow. A relief bounce inside a downtrend is still a downtrend until price reclaims higher levels.
👀 Don't ignore $ETH: it's bouncing with BTC around $1,714. Historically ETH moves harder than BTC in both directions — if BTC holds $60K, ETH tends to lead the recovery; if BTC loses $55.6K, ETH usually falls faster.
Levels I'm watching:
• $60K — needs to hold on a daily close
• $55.6K — the Nov 21 low; losing it invalidates the bounce
I'm not chasing here. I'd rather wait for a daily close above $60K or a retest of the whale zone around $59K.
Are whales calling the bottom — or getting trapped? 👇
Not financial advice. DYOR.
#BTCReboundsAbove$60KAmidWhaleDipBuying #BlackRockIBITPostsRecord$541MSingleDayOutflow #Bitcoin
🚨 $BTC Back Above $60K — Bottom or Bull Trap?
Bitcoin dipped to around $55,600 on Nov 21, then reclaimed $60,000 the same evening. Two whale moves stand out:
🐋 Abraxas Capital withdrew 17,597 BTC (~$1.04B) from exchanges at an average of ~$59,206 (per Lookonchain). Coins leaving exchanges usually signal holding, not selling.
💵 Garrett Jin moved $65M in stablecoins onto exchanges and posted "time to bid." Stablecoins landing on exchanges = fresh buying power.
So is this the bottom? Here's how I read it:
✅ Bull case: Whales accumulating near $59K gives that zone real support. Holding above $60K flips it from resistance back into support.
⚠️ Bear case: Global stocks are on their longest losing streak since 2023, and BlackRock's IBIT just posted a record $541M single-day outflow. A relief bounce inside a downtrend is still a downtrend until price reclaims higher levels.
👀 Don't ignore $ETH : it's bouncing with BTC around $1,714. Historically ETH moves harder than BTC in both directions — if BTC holds $60K, ETH tends to lead the recovery; if BTC loses $55.6K, ETH usually falls faster.
Levels I'm watching:
• $60K — needs to hold on a daily close
• $55.6K — the Nov 21 low; losing it invalidates the bounce
I'm not chasing here. I'd rather wait for a daily close above $60K or a retest of the whale zone around $59K.
Are whales calling the bottom — or getting trapped? 👇
Not financial advice. DYOR.
#BTCReboundsAbove$60KAmidWhaleDipBuying #BlackRockIBITPostsRecord$541MSingleDayOutflow #Bitcoin
Bitcoin dipped to around $55,600 on Nov 21, then reclaimed $60,000 the same evening. Two whale moves stand out:
🐋 Abraxas Capital withdrew 17,597 BTC (~$1.04B) from exchanges at an average of ~$59,206 (per Lookonchain). Coins leaving exchanges usually signal holding, not selling.
💵 Garrett Jin moved $65M in stablecoins onto exchanges and posted "time to bid." Stablecoins landing on exchanges = fresh buying power.
So is this the bottom? Here's how I read it:
✅ Bull case: Whales accumulating near $59K gives that zone real support. Holding above $60K flips it from resistance back into support.
⚠️ Bear case: Global stocks are on their longest losing streak since 2023, and BlackRock's IBIT just posted a record $541M single-day outflow. A relief bounce inside a downtrend is still a downtrend until price reclaims higher levels.
👀 Don't ignore $ETH : it's bouncing with BTC around $1,714. Historically ETH moves harder than BTC in both directions — if BTC holds $60K, ETH tends to lead the recovery; if BTC loses $55.6K, ETH usually falls faster.
Levels I'm watching:
• $60K — needs to hold on a daily close
• $55.6K — the Nov 21 low; losing it invalidates the bounce
I'm not chasing here. I'd rather wait for a daily close above $60K or a retest of the whale zone around $59K.
Are whales calling the bottom — or getting trapped? 👇
Not financial advice. DYOR.
#BTCReboundsAbove$60KAmidWhaleDipBuying #BlackRockIBITPostsRecord$541MSingleDayOutflow #Bitcoin
131

Whale Orderbook Analysis: Spot Bids Defend $60,593.6 BTC After Liquidity Sweep
The recovery of Bitcoin above $60,000 (#BTCReboundsAbove$60KAmidWhaleDipBuying) is confirming an essential market microstructure pattern: aggressive absorption of retail panic seller volume.
Key On-Chain & Technical Metrics:
1. Bid Cluster Density: Spot bid walls between $58.2K and $59.5K absorbed over 12,000 BTC in market sell orders during the flush.
2. Derivatives Cleansing: Open interest saw a healthy leverage reset, forcing aggressive late shorters to pay negative funding rates.
3. Market Rotation: Capital is steadily trickling into Layer-1 assets like Solana as macro anxiety eases.
Rule for Small Accounts: Never chase green 5-minute wicks with market orders. Place resting limit orders at support zones to secure maker rebates.
Are you adding spot at current levels or waiting for the weekly candle close? 👇
#BTCReboundsAbove$60KAmidWhaleDipBuying #CryptoTrading #Bitcoin $BTC $USDC
Whale Orderbook Analysis: Spot Bids Defend $60,593.6 BTC After Liquidity Sweep
The recovery of Bitcoin above $60,000 (#BTCReboundsAbove$60KAmidWhaleDipBuying) is confirming an essential market microstructure pattern: aggressive absorption of retail panic seller volume.
Key On-Chain & Technical Metrics:
1. Bid Cluster Density: Spot bid walls between $58.2K and $59.5K absorbed over 12,000 BTC in market sell orders during the flush.
2. Derivatives Cleansing: Open interest saw a healthy leverage reset, forcing aggressive late shorters to pay negative funding rates.
3. Market Rotation: Capital is steadily trickling into Layer-1 assets like Solana as macro anxiety eases.
Rule for Small Accounts: Never chase green 5-minute wicks with market orders. Place resting limit orders at support zones to secure maker rebates.
Are you adding spot at current levels or waiting for the weekly candle close? 👇
#BTCReboundsAbove$60KAmidWhaleDipBuying #CryptoTrading #Bitcoin $BTC $USDC
The recovery of Bitcoin above $60,000 (#BTCReboundsAbove$60KAmidWhaleDipBuying) is confirming an essential market microstructure pattern: aggressive absorption of retail panic seller volume.
Key On-Chain & Technical Metrics:
1. Bid Cluster Density: Spot bid walls between $58.2K and $59.5K absorbed over 12,000 BTC in market sell orders during the flush.
2. Derivatives Cleansing: Open interest saw a healthy leverage reset, forcing aggressive late shorters to pay negative funding rates.
3. Market Rotation: Capital is steadily trickling into Layer-1 assets like Solana as macro anxiety eases.
Rule for Small Accounts: Never chase green 5-minute wicks with market orders. Place resting limit orders at support zones to secure maker rebates.
Are you adding spot at current levels or waiting for the weekly candle close? 👇
#BTCReboundsAbove$60KAmidWhaleDipBuying #CryptoTrading #Bitcoin $BTC $USDC
50
Whale Accumulation Reclaims $60K: Why On-Chain Orderbooks Signal a Sustained Rebound
Bitcoin has reclaimed the pivotal $60,000 threshold (#BTCReboundsAbove$60KAmidWhaleDipBuying) backed by heavy taker absorption across Binance spot orderbooks. As retail flushed during the recent dip to $57.7K, whale clusters absorbed over $400M in spot liquidity.
Simultaneously, Solana announced its 2027 roadmap targeting a 2x compute capacity expansion (#SolanaSets2027RoadmapToDoubleComputeCapacity), underpinning long-term network fundamentals as $SOL defends $68-$70 support.
Disciplined traders should prioritize low-leverage, risk-defined entries and zero-fee maker setups over FOMO market orders.
Are you accumulating the dip or waiting for a confirmed weekly close above $62K? Drop your outlook below! 👇
#BTCReboundsAbove$60KAmidWhaleDipBuying #SolanaSets2027RoadmapToDoubleComputeCapacity #CryptoTrading $BTC $SOL $USDC
Whale Accumulation Reclaims $60K: Why On-Chain Orderbooks Signal a Sustained Rebound
Bitcoin has reclaimed the pivotal $60,000 threshold (#BTCReboundsAbove$60KAmidWhaleDipBuying) backed by heavy taker absorption across Binance spot orderbooks. As retail flushed during the recent dip to $57.7K, whale clusters absorbed over $400M in spot liquidity.
Simultaneously, Solana announced its 2027 roadmap targeting a 2x compute capacity expansion (#SolanaSets2027RoadmapToDoubleComputeCapacity), underpinning long-term network fundamentals as $SOL defends $68-$70 support.
Disciplined traders should prioritize low-leverage, risk-defined entries and zero-fee maker setups over FOMO market orders.
Are you accumulating the dip or waiting for a confirmed weekly close above $62K? Drop your outlook below! 👇
#BTCReboundsAbove$60KAmidWhaleDipBuying #SolanaSets2027RoadmapToDoubleComputeCapacity #CryptoTrading $BTC $SOL $USDC
Bitcoin has reclaimed the pivotal $60,000 threshold (#BTCReboundsAbove$60KAmidWhaleDipBuying) backed by heavy taker absorption across Binance spot orderbooks. As retail flushed during the recent dip to $57.7K, whale clusters absorbed over $400M in spot liquidity.
Simultaneously, Solana announced its 2027 roadmap targeting a 2x compute capacity expansion (#SolanaSets2027RoadmapToDoubleComputeCapacity), underpinning long-term network fundamentals as $SOL defends $68-$70 support.
Disciplined traders should prioritize low-leverage, risk-defined entries and zero-fee maker setups over FOMO market orders.
Are you accumulating the dip or waiting for a confirmed weekly close above $62K? Drop your outlook below! 👇
#BTCReboundsAbove$60KAmidWhaleDipBuying #SolanaSets2027RoadmapToDoubleComputeCapacity #CryptoTrading $BTC $SOL $USDC
103

·
--
#BTCReboundsAbove$60KAmidWhaleDipBuying
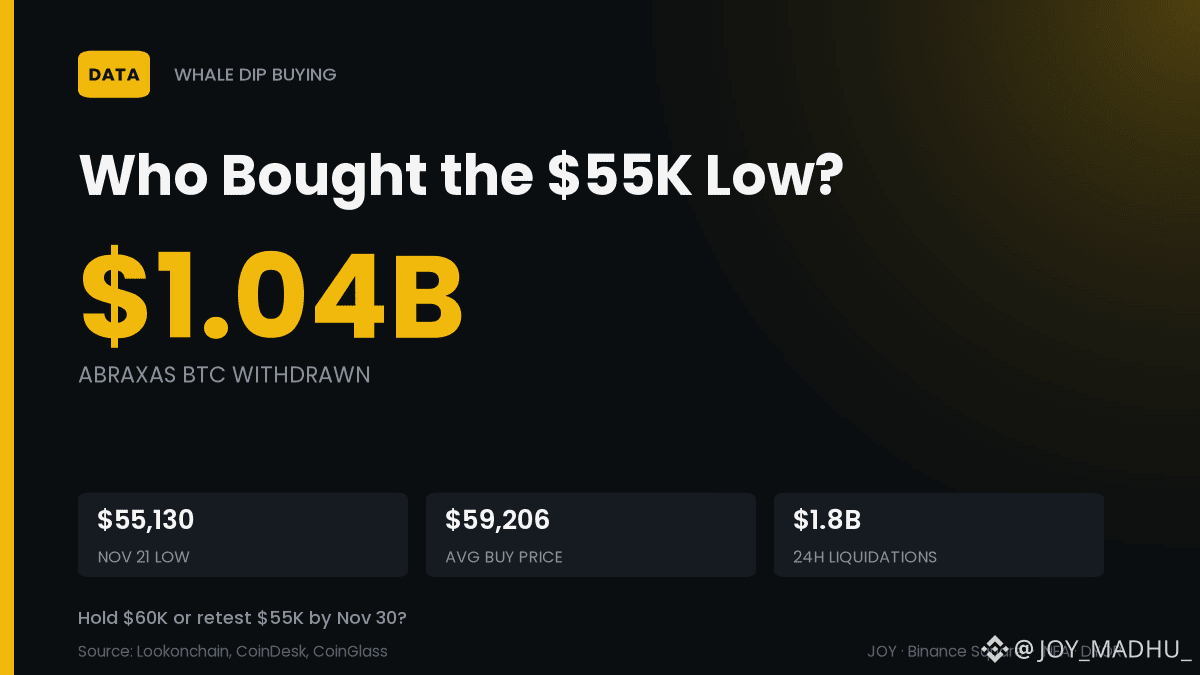
🐋 Who Bought the $55K Low? One Fund Pulled $1.04B of BTC
Bitcoin bounced 9% off a two-year low as whales pulled coins and leveraged longs got wiped out.
📊 Abraxas Capital: 17,597 BTC (~$1.04B) off exchanges, avg ~$59,206
📉 Nov 21 low of $55,130, weakest since Sept 2024 (CoinDesk)
⚠️ $1.8B liquidated in 24h, $1.3B of it longs (CoinGlass)
🏦 Garrett Jin: $65M stablecoins to Binance, "time to bid"
Watch next: Monday's US open after a 4%+ Nasdaq drop. Bounces may fade without ETF inflows.
BTC by Nov 30: holds $60K, or retests $55K first? 👇
$BTC
#BTCReboundsAbove$60KAmidWhaleDipBuying #Bitcoin #CryptoNews
#BTCReboundsAbove$60KAmidWhaleDipBuying
🐋 Who Bought the $55K Low? One Fund Pulled $1.04B of BTC
Bitcoin bounced 9% off a two-year low as whales pulled coins and leveraged longs got wiped out.
📊 Abraxas Capital: 17,597 BTC (~$1.04B) off exchanges, avg ~$59,206
📉 Nov 21 low of $55,130, weakest since Sept 2024 (CoinDesk)
⚠️ $1.8B liquidated in 24h, $1.3B of it longs (CoinGlass)
🏦 Garrett Jin: $65M stablecoins to Binance, "time to bid"
Watch next: Monday's US open after a 4%+ Nasdaq drop. Bounces may fade without ETF inflows.
BTC by Nov 30: holds $60K, or retests $55K first? 👇
$BTC
#BTCReboundsAbove$60KAmidWhaleDipBuying #Bitcoin #CryptoNews
🐋 Who Bought the $55K Low? One Fund Pulled $1.04B of BTC
Bitcoin bounced 9% off a two-year low as whales pulled coins and leveraged longs got wiped out.
📊 Abraxas Capital: 17,597 BTC (~$1.04B) off exchanges, avg ~$59,206
📉 Nov 21 low of $55,130, weakest since Sept 2024 (CoinDesk)
⚠️ $1.8B liquidated in 24h, $1.3B of it longs (CoinGlass)
🏦 Garrett Jin: $65M stablecoins to Binance, "time to bid"
Watch next: Monday's US open after a 4%+ Nasdaq drop. Bounces may fade without ETF inflows.
BTC by Nov 30: holds $60K, or retests $55K first? 👇
$BTC
#BTCReboundsAbove$60KAmidWhaleDipBuying #Bitcoin #CryptoNews
13

Everyone thinks a $BTC rebound above a key level means the bottom is in, but actually that's often when the real losses start.
You've sat through the dump, then the first green candle hits and your brain either screams to chase it or dump everything. Both of those reactions have cost people real money in markets like this.
Think of this bounce like a tired boxer getting up off the canvas. Standing up is not the same as winning the fight. With the Fear and Greed Index at 7, $BTC can pop just enough to squeeze shorts and pull in late buyers, then roll over again. You see the same pattern in $ETH and $SOL when the market is this nervous.
Three traps keep showing up on these rebounds. First, treating that first green candle as proof the risk is gone. Second, stacking leverage because the chart finally looks alive. Third, forgetting that a rebound in extreme fear is usually a pause, not a new trend. Treat it like a yellow light, not a green one.
Where do you think this bounce actually goes from here?
#BTCReboundsAbove #BlackRockIBITPostsRecord #GlobalStocksFaceLongestLosingStreakSince2023
Everyone thinks a $BTC rebound above a key level means the bottom is in, but actually that's often when the real losses start.
You've sat through the dump, then the first green candle hits and your brain either screams to chase it or dump everything. Both of those reactions have cost people real money in markets like this.
Think of this bounce like a tired boxer getting up off the canvas. Standing up is not the same as winning the fight. With the Fear and Greed Index at 7, $BTC can pop just enough to squeeze shorts and pull in late buyers, then roll over again. You see the same pattern in $ETH and $SOL when the market is this nervous.
Three traps keep showing up on these rebounds. First, treating that first green candle as proof the risk is gone. Second, stacking leverage because the chart finally looks alive. Third, forgetting that a rebound in extreme fear is usually a pause, not a new trend. Treat it like a yellow light, not a green one.
Where do you think this bounce actually goes from here?
#BTCReboundsAbove #BlackRockIBITPostsRecord #GlobalStocksFaceLongestLosingStreakSince2023
You've sat through the dump, then the first green candle hits and your brain either screams to chase it or dump everything. Both of those reactions have cost people real money in markets like this.
Think of this bounce like a tired boxer getting up off the canvas. Standing up is not the same as winning the fight. With the Fear and Greed Index at 7, $BTC can pop just enough to squeeze shorts and pull in late buyers, then roll over again. You see the same pattern in $ETH and $SOL when the market is this nervous.
Three traps keep showing up on these rebounds. First, treating that first green candle as proof the risk is gone. Second, stacking leverage because the chart finally looks alive. Third, forgetting that a rebound in extreme fear is usually a pause, not a new trend. Treat it like a yellow light, not a green one.
Where do you think this bounce actually goes from here?
#BTCReboundsAbove #BlackRockIBITPostsRecord #GlobalStocksFaceLongestLosingStreakSince2023
53

·
--
Here's what happened when $BTC climbed back above a level most traders had already abandoned.
You sold into the panic because the Fear and Greed Index hit 7, extreme fear, and holding felt like catching a falling knife. Now the rebound is unfolding and the people who waited for confirmation are watching from the sidelines.
This one is a case study worth comparing to 2022. Back then, every bounce during extreme fear got dumped until the actual bottom formed months later. This time the tape looks different. While global stocks grind through their longest losing streak since 2023, Bitcoin is moving independently. Sticky institutional demand, the kind that kept showing up in IBIT even when retail vanished, is a factor we simply did not have in previous cycles.
$ETH and $SOL usually lag these $BTC recoveries by a session or two, then catch a bid once fear starts to crack. That sequence has repeated after almost every capitulation since 2020. Whether this is another dead cat or the first real bid after extreme fear is the whole question right now.
Where do you think this goes from here?
#BTCReboundsAbove #GlobalStocksFaceLongestLosingStreakSince2023 #BlackRockIBITPostsRecord
Here's what happened when $BTC climbed back above a level most traders had already abandoned.
You sold into the panic because the Fear and Greed Index hit 7, extreme fear, and holding felt like catching a falling knife. Now the rebound is unfolding and the people who waited for confirmation are watching from the sidelines.
This one is a case study worth comparing to 2022. Back then, every bounce during extreme fear got dumped until the actual bottom formed months later. This time the tape looks different. While global stocks grind through their longest losing streak since 2023, Bitcoin is moving independently. Sticky institutional demand, the kind that kept showing up in IBIT even when retail vanished, is a factor we simply did not have in previous cycles.
$ETH and $SOL usually lag these $BTC recoveries by a session or two, then catch a bid once fear starts to crack. That sequence has repeated after almost every capitulation since 2020. Whether this is another dead cat or the first real bid after extreme fear is the whole question right now.
Where do you think this goes from here?
#BTCReboundsAbove #GlobalStocksFaceLongestLosingStreakSince2023 #BlackRockIBITPostsRecord
You sold into the panic because the Fear and Greed Index hit 7, extreme fear, and holding felt like catching a falling knife. Now the rebound is unfolding and the people who waited for confirmation are watching from the sidelines.
This one is a case study worth comparing to 2022. Back then, every bounce during extreme fear got dumped until the actual bottom formed months later. This time the tape looks different. While global stocks grind through their longest losing streak since 2023, Bitcoin is moving independently. Sticky institutional demand, the kind that kept showing up in IBIT even when retail vanished, is a factor we simply did not have in previous cycles.
$ETH and $SOL usually lag these $BTC recoveries by a session or two, then catch a bid once fear starts to crack. That sequence has repeated after almost every capitulation since 2020. Whether this is another dead cat or the first real bid after extreme fear is the whole question right now.
Where do you think this goes from here?
#BTCReboundsAbove #GlobalStocksFaceLongestLosingStreakSince2023 #BlackRockIBITPostsRecord

61

·
--
Bitcoin just bounced off a two-year low and nobody can agree what it means yet.
Yesterday BTC tagged around $55,100, the lowest in two years, then ripped back above $60,000 and closed the day around $60,100. That is roughly a 9 percent round trip in a single day. This morning it is hovering just under $60,000 again, so the level is still being fought over.
The whale angle is real. On-chain trackers say Abraxas Capital pulled about 17,600 BTC, roughly $1 billion, off Binance and Kraken during the dip. Big buy orders kept showing up on Binance too, one $9.2 million print right at $60,052.
But here is the honest part. A lot of that bounce was forced buying. About $1 billion in longs got liquidated on the way down, then nearly $69 million in shorts got squeezed on the way back up. And the ETFs are still bleeding, $582 million out on Thursday alone, $541 million of it from BlackRock's IBIT.
So this is not a confirmed reversal. It is a bounce with whales buying and shorts getting punished, while the big money is still walking out the door. The test is simple. Does $60,000 hold into Monday when the ETF numbers come back?
$BTC
Are you buying this dip, or waiting to see if $60,000 actually holds first?
#BTCReboundsAbove$60KAmidWhaleDipBuying
Bitcoin just bounced off a two-year low and nobody can agree what it means yet.
Yesterday BTC tagged around $55,100, the lowest in two years, then ripped back above $60,000 and closed the day around $60,100. That is roughly a 9 percent round trip in a single day. This morning it is hovering just under $60,000 again, so the level is still being fought over.
The whale angle is real. On-chain trackers say Abraxas Capital pulled about 17,600 BTC, roughly $1 billion, off Binance and Kraken during the dip. Big buy orders kept showing up on Binance too, one $9.2 million print right at $60,052.
But here is the honest part. A lot of that bounce was forced buying. About $1 billion in longs got liquidated on the way down, then nearly $69 million in shorts got squeezed on the way back up. And the ETFs are still bleeding, $582 million out on Thursday alone, $541 million of it from BlackRock's IBIT.
So this is not a confirmed reversal. It is a bounce with whales buying and shorts getting punished, while the big money is still walking out the door. The test is simple. Does $60,000 hold into Monday when the ETF numbers come back?
$BTC
Are you buying this dip, or waiting to see if $60,000 actually holds first?
#BTCReboundsAbove$60KAmidWhaleDipBuying
Yesterday BTC tagged around $55,100, the lowest in two years, then ripped back above $60,000 and closed the day around $60,100. That is roughly a 9 percent round trip in a single day. This morning it is hovering just under $60,000 again, so the level is still being fought over.
The whale angle is real. On-chain trackers say Abraxas Capital pulled about 17,600 BTC, roughly $1 billion, off Binance and Kraken during the dip. Big buy orders kept showing up on Binance too, one $9.2 million print right at $60,052.
But here is the honest part. A lot of that bounce was forced buying. About $1 billion in longs got liquidated on the way down, then nearly $69 million in shorts got squeezed on the way back up. And the ETFs are still bleeding, $582 million out on Thursday alone, $541 million of it from BlackRock's IBIT.
So this is not a confirmed reversal. It is a bounce with whales buying and shorts getting punished, while the big money is still walking out the door. The test is simple. Does $60,000 hold into Monday when the ETF numbers come back?
$BTC
Are you buying this dip, or waiting to see if $60,000 actually holds first?
#BTCReboundsAbove$60KAmidWhaleDipBuying

91

·
--
Article
BTC is back above $60,000. Does whale dip-buying mean the trend has reversed?BTC is back above $60,000. Does whale dip-buying mean the trend has reversed?
BTC has climbed back above $60,000, and the market immediately attributed the move to “whales buying the dip.” But the real question is not simply whether large holders are buying. It is whether those purchases can offset the preceding downtrend, whether spot demand is strong enough, and whether leverage is building up again during the rebound.
## What happened?
The Binance Square trending page currently featured the topic `#BTCReboundsAbove$60KAmidWhaleDipBuying`. At around 13:28 Beijing time, the page showed one person discussing it. This visible level of interest was not high, so I did not treat the topic title as fact and continued to verify it against on-chain records and Binance market data.
BTC is back above $60,000. Does whale dip-buying mean the trend has reversed?
BTC is back above $60,000. Does whale dip-buying mean the trend has reversed?
BTC has climbed back above $60,000, and the market immediately attributed the move to “whales buying the dip.” But the real question is not simply whether large holders are buying. It is whether those purchases can offset the preceding downtrend, whether spot demand is strong enough, and whether leverage is building up again during the rebound.
## What happened?
The Binance Square trending page currently featured the topic `#BTCReboundsAbove$60KAmidWhaleDipBuying`. At around 13:28 Beijing time, the page showed one person discussing it. This visible level of interest was not high, so I did not treat the topic title as fact and continued to verify it against on-chain records and Binance market data.
BTC has climbed back above $60,000, and the market immediately attributed the move to “whales buying the dip.” But the real question is not simply whether large holders are buying. It is whether those purchases can offset the preceding downtrend, whether spot demand is strong enough, and whether leverage is building up again during the rebound.
## What happened?
The Binance Square trending page currently featured the topic `#BTCReboundsAbove$60KAmidWhaleDipBuying`. At around 13:28 Beijing time, the page showed one person discussing it. This visible level of interest was not high, so I did not treat the topic title as fact and continued to verify it against on-chain records and Binance market data.
风中浪客:
鲸鱼一抄底就喊反转,急啥 $BTC
1
236

·
--
$1 BILLION WHALE SHOPPING SPREE WHILE YOU PANIC?! 🐋
$BTC bounced from $55,127 to $60,226, as Abraxas Capital scooped up 17,597 BTC (~$1.04 billion) below $60K. Meanwhile, 290,000 traders got wiped out, 91% of them long.
The $62K wall is next—break through or bounce off? Are you team whale or team panic? 👇
#Bitcoin #BTCReboundsAbove$60KAmidWhaleDipBuying
$1 BILLION WHALE SHOPPING SPREE WHILE YOU PANIC?! 🐋
$BTC bounced from $55,127 to $60,226, as Abraxas Capital scooped up 17,597 BTC (~$1.04 billion) below $60K. Meanwhile, 290,000 traders got wiped out, 91% of them long.
The $62K wall is next—break through or bounce off? Are you team whale or team panic? 👇
#Bitcoin #BTCReboundsAbove$60KAmidWhaleDipBuying
$BTC bounced from $55,127 to $60,226, as Abraxas Capital scooped up 17,597 BTC (~$1.04 billion) below $60K. Meanwhile, 290,000 traders got wiped out, 91% of them long.
The $62K wall is next—break through or bounce off? Are you team whale or team panic? 👇
#Bitcoin #BTCReboundsAbove$60KAmidWhaleDipBuying

386

·
--
BTC Returns to $61K | PCE and GDP Released Wednesday | Stay Disciplined Before a Breakout
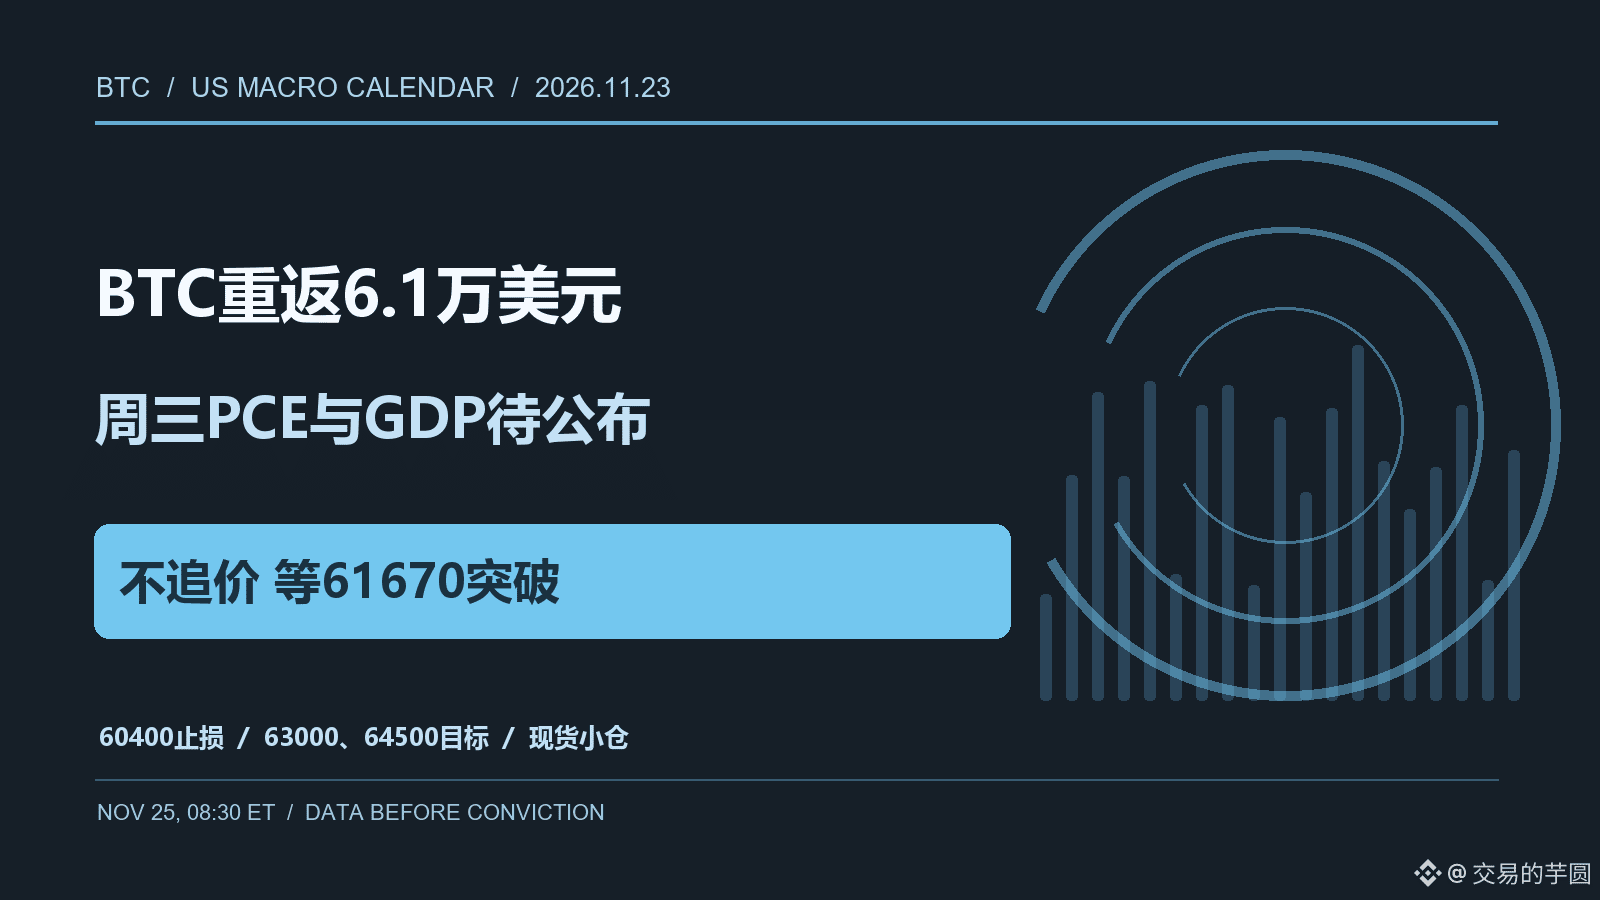
I’m cautiously bullish, but the weekend rebound cannot replace next week’s test from macroeconomic data. The currently trending topic on Binance Square, #BTCReboundsAbove$60KAmidWhaleDipBuying, is still being discussed; “whale dip buying” is a market narrative. BTC transfers out of exchanges alone cannot prove the purchase price on the same day, the ultimate owner, or that the BTC won’t be sold later. I’m more focused on a date and time confirmed by a primary source: the latest release schedule from the U.S. Bureau of Economic Analysis (BEA) lists the October Personal Income and Outlays report and the second estimate of third-quarter GDP for release at 8:30 a.m. Eastern Time on November 25. The former includes the PCE inflation measure watched by the market, while the latter could lead to revisions in growth assessments. Neither report is out yet, so any specific figures are only forecasts.
With both data releases due at the same time, BTC will face signals on both inflation and growth. Hotter inflation could heighten concerns that interest rates will stay high, while weaker growth could dampen risk appetite. Easing inflation alongside resilient growth would be more likely to support a rebound. This describes a transmission mechanism; it is not a prediction of the data. The Federal Reserve calendar also lists the release of the Beige Book on November 25. It offers regional economic insights, but it is not an interest-rate decision for that day. Write the event time into your plan before trading.
How has the market reacted so far? At just after midnight Beijing time today, BTC/USDT on Binance was around $61,045, up about 2.09% over 24 hours, with a range low of around $58,769 and a high of around $61,670. The price has climbed back above $60,000, but has yet to clear the high of this range. The rebound is real, but trend confirmation is still one step away. Farside previously listed net outflows of about $582.3 million from U.S. spot BTC funds on November 19. In the November 20 totals, the IBIT column was still blank; an unfilled figure cannot be treated as zero, and an incomplete aggregate cannot be counted as a confirmed inflow. Spot trading continues over the weekend, but U.S. fund subscriptions and redemptions do not generate new regular trading-day data as a result.
My key levels are $60,000, $61,670, and $63,000. If BTC holds above $61,670, the rebound structure may have a chance to test $63,000. If it falls back below $60,000 and cannot reclaim it on the 4-hour timeframe, my short-term bullish view is invalidated. If there is severe slippage when the macro data is released, I’d rather wait for the first round of price discovery to finish. As for corporate holdings, Strategy’s public ledger should be updated based on official disclosures. Holdings charts on social media may reflect hints or market expectations, but they should not be treated as proof that the company has already added to its holdings.
If I were trading this myself, I wouldn’t chase an entry near $61,000 right now. I’d only consider a trend-following spot long, risking no more than 2% of total capital on any single trade. The entry trigger would be BTC/USDT first breaking above $61,670, then holding $61,300 on a pullback, with active trading volume and normal bid-ask spreads. If those conditions don’t appear, I’d stay flat. The first target is $63,000, where I’d take half off; the second target is $64,500, where I’d take off half of the remaining position. The initial stop is $60,400. If triggered, a 4-hour close below $60,400 would mean closing the entire position. If Wednesday’s data shifts the existing risk appetite, I’d exit and reassess even if the stop hasn’t been hit. If $60,000 is lost first, this long setup is canceled; I wouldn’t use high leverage to gamble on the data.
Sources: BEA release schedule, Federal Reserve calendar, Binance spot market data, Farside fund flow table. #BTCReboundsAbove$60KAmidWhaleDipBuying #BTC
The above is solely my personal market observation and does not constitute investment advice.
BTC Returns to $61K | PCE and GDP Released Wednesday | Stay Disciplined Before a Breakout
I’m cautiously bullish, but the weekend rebound cannot replace next week’s test from macroeconomic data. The currently trending topic on Binance Square, #BTCReboundsAbove$60KAmidWhaleDipBuying, is still being discussed; “whale dip buying” is a market narrative. BTC transfers out of exchanges alone cannot prove the purchase price on the same day, the ultimate owner, or that the BTC won’t be sold later. I’m more focused on a date and time confirmed by a primary source: the latest release schedule from the U.S. Bureau of Economic Analysis (BEA) lists the October Personal Income and Outlays report and the second estimate of third-quarter GDP for release at 8:30 a.m. Eastern Time on November 25. The former includes the PCE inflation measure watched by the market, while the latter could lead to revisions in growth assessments. Neither report is out yet, so any specific figures are only forecasts.
With both data releases due at the same time, BTC will face signals on both inflation and growth. Hotter inflation could heighten concerns that interest rates will stay high, while weaker growth could dampen risk appetite. Easing inflation alongside resilient growth would be more likely to support a rebound. This describes a transmission mechanism; it is not a prediction of the data. The Federal Reserve calendar also lists the release of the Beige Book on November 25. It offers regional economic insights, but it is not an interest-rate decision for that day. Write the event time into your plan before trading.
How has the market reacted so far? At just after midnight Beijing time today, BTC/USDT on Binance was around $61,045, up about 2.09% over 24 hours, with a range low of around $58,769 and a high of around $61,670. The price has climbed back above $60,000, but has yet to clear the high of this range. The rebound is real, but trend confirmation is still one step away. Farside previously listed net outflows of about $582.3 million from U.S. spot BTC funds on November 19. In the November 20 totals, the IBIT column was still blank; an unfilled figure cannot be treated as zero, and an incomplete aggregate cannot be counted as a confirmed inflow. Spot trading continues over the weekend, but U.S. fund subscriptions and redemptions do not generate new regular trading-day data as a result.
My key levels are $60,000, $61,670, and $63,000. If BTC holds above $61,670, the rebound structure may have a chance to test $63,000. If it falls back below $60,000 and cannot reclaim it on the 4-hour timeframe, my short-term bullish view is invalidated. If there is severe slippage when the macro data is released, I’d rather wait for the first round of price discovery to finish. As for corporate holdings, Strategy’s public ledger should be updated based on official disclosures. Holdings charts on social media may reflect hints or market expectations, but they should not be treated as proof that the company has already added to its holdings.
If I were trading this myself, I wouldn’t chase an entry near $61,000 right now. I’d only consider a trend-following spot long, risking no more than 2% of total capital on any single trade. The entry trigger would be BTC/USDT first breaking above $61,670, then holding $61,300 on a pullback, with active trading volume and normal bid-ask spreads. If those conditions don’t appear, I’d stay flat. The first target is $63,000, where I’d take half off; the second target is $64,500, where I’d take off half of the remaining position. The initial stop is $60,400. If triggered, a 4-hour close below $60,400 would mean closing the entire position. If Wednesday’s data shifts the existing risk appetite, I’d exit and reassess even if the stop hasn’t been hit. If $60,000 is lost first, this long setup is canceled; I wouldn’t use high leverage to gamble on the data.
Sources: BEA release schedule, Federal Reserve calendar, Binance spot market data, Farside fund flow table. #BTCReboundsAbove$60KAmidWhaleDipBuying #BTC
The above is solely my personal market observation and does not constitute investment advice.
I’m cautiously bullish, but the weekend rebound cannot replace next week’s test from macroeconomic data. The currently trending topic on Binance Square, #BTCReboundsAbove$60KAmidWhaleDipBuying, is still being discussed; “whale dip buying” is a market narrative. BTC transfers out of exchanges alone cannot prove the purchase price on the same day, the ultimate owner, or that the BTC won’t be sold later. I’m more focused on a date and time confirmed by a primary source: the latest release schedule from the U.S. Bureau of Economic Analysis (BEA) lists the October Personal Income and Outlays report and the second estimate of third-quarter GDP for release at 8:30 a.m. Eastern Time on November 25. The former includes the PCE inflation measure watched by the market, while the latter could lead to revisions in growth assessments. Neither report is out yet, so any specific figures are only forecasts.
With both data releases due at the same time, BTC will face signals on both inflation and growth. Hotter inflation could heighten concerns that interest rates will stay high, while weaker growth could dampen risk appetite. Easing inflation alongside resilient growth would be more likely to support a rebound. This describes a transmission mechanism; it is not a prediction of the data. The Federal Reserve calendar also lists the release of the Beige Book on November 25. It offers regional economic insights, but it is not an interest-rate decision for that day. Write the event time into your plan before trading.
How has the market reacted so far? At just after midnight Beijing time today, BTC/USDT on Binance was around $61,045, up about 2.09% over 24 hours, with a range low of around $58,769 and a high of around $61,670. The price has climbed back above $60,000, but has yet to clear the high of this range. The rebound is real, but trend confirmation is still one step away. Farside previously listed net outflows of about $582.3 million from U.S. spot BTC funds on November 19. In the November 20 totals, the IBIT column was still blank; an unfilled figure cannot be treated as zero, and an incomplete aggregate cannot be counted as a confirmed inflow. Spot trading continues over the weekend, but U.S. fund subscriptions and redemptions do not generate new regular trading-day data as a result.
My key levels are $60,000, $61,670, and $63,000. If BTC holds above $61,670, the rebound structure may have a chance to test $63,000. If it falls back below $60,000 and cannot reclaim it on the 4-hour timeframe, my short-term bullish view is invalidated. If there is severe slippage when the macro data is released, I’d rather wait for the first round of price discovery to finish. As for corporate holdings, Strategy’s public ledger should be updated based on official disclosures. Holdings charts on social media may reflect hints or market expectations, but they should not be treated as proof that the company has already added to its holdings.
If I were trading this myself, I wouldn’t chase an entry near $61,000 right now. I’d only consider a trend-following spot long, risking no more than 2% of total capital on any single trade. The entry trigger would be BTC/USDT first breaking above $61,670, then holding $61,300 on a pullback, with active trading volume and normal bid-ask spreads. If those conditions don’t appear, I’d stay flat. The first target is $63,000, where I’d take half off; the second target is $64,500, where I’d take off half of the remaining position. The initial stop is $60,400. If triggered, a 4-hour close below $60,400 would mean closing the entire position. If Wednesday’s data shifts the existing risk appetite, I’d exit and reassess even if the stop hasn’t been hit. If $60,000 is lost first, this long setup is canceled; I wouldn’t use high leverage to gamble on the data.
Sources: BEA release schedule, Federal Reserve calendar, Binance spot market data, Farside fund flow table. #BTCReboundsAbove$60KAmidWhaleDipBuying #BTC
The above is solely my personal market observation and does not constitute investment advice.
3

·
--

Article
BTC | A Cool-Headed Look at the Numbers | 2026-11-22🔥 It’s moving up! $BTC 24h +2.96%, current price 60555.67 USDT.
📊 Data Snapshot
· Current price: 60555.67 USDT
· 24h: +2.96%
· Range: 58744.48 — 61669.99
· Trading volume: 1590164975.42 USDT
Emotions behind the numbers
Volume is picking up with this move—it’s more worth watching than the price itself
Bulls and bears are clearly wrestling at this level
Are you watching? 👇
## How to read these figures
The 24-hour window is rolling; the percentage change and trading volume come from the same API snapshot. The highs and lows describe only the observed range—they are not future support or resistance levels. Trading volume is the total of both sides and does not indicate the direction of one-sided capital flows. A single snapshot is not evidence of a trend.
BTC | A Cool-Headed Look at the Numbers | 2026-11-22
🔥 It’s moving up! $BTC 24h +2.96%, current price 60555.67 USDT.
📊 Data Snapshot
· Current price: 60555.67 USDT
· 24h: +2.96%
· Range: 58744.48 — 61669.99
· Trading volume: 1590164975.42 USDT
Emotions behind the numbers
Volume is picking up with this move—it’s more worth watching than the price itself
Bulls and bears are clearly wrestling at this level
Are you watching? 👇
## How to read these figures
The 24-hour window is rolling; the percentage change and trading volume come from the same API snapshot. The highs and lows describe only the observed range—they are not future support or resistance levels. Trading volume is the total of both sides and does not indicate the direction of one-sided capital flows. A single snapshot is not evidence of a trend.
📊 Data Snapshot
· Current price: 60555.67 USDT
· 24h: +2.96%
· Range: 58744.48 — 61669.99
· Trading volume: 1590164975.42 USDT
Emotions behind the numbers
Volume is picking up with this move—it’s more worth watching than the price itself
Bulls and bears are clearly wrestling at this level
Are you watching? 👇
## How to read these figures
The 24-hour window is rolling; the percentage change and trading volume come from the same API snapshot. The highs and lows describe only the observed range—they are not future support or resistance levels. Trading volume is the total of both sides and does not indicate the direction of one-sided capital flows. A single snapshot is not evidence of a trend.
1
·
--
BTC’s rebound still awaits confirmation from capital flows|BTCO adds Bank of New York Mellon as custodian|Don’t mistake infrastructure for buying demand
My stance is cautiously bullish, but I’m still waiting for capital flows and price action to confirm the move together. People are still discussing Bitcoin’s return to $60,000 and “whales buying the dip” on social media. The enthusiasm is real, but wallet ownership and the timing of purchases can’t be inferred from transfers alone. Today, let’s look at the institutional chain from another angle: Invesco Galaxy Bitcoin ETF’s SEC 8-K filing disclosed that the fund signed a digital asset custody agreement with the Bank of New York Mellon on November 6. The bank is expected to establish segregated custody accounts to receive and hold the fund’s bitcoin; the existing Coinbase custody arrangement is unaffected. The filing says the sponsor expects to use both custodians. This is an expansion of custody arrangements—not a new bitcoin position added today, and certainly not the SEC just approving a new ETF.
The way this could affect BTC is through operational and counterparty risk for institutions holding spot assets. A multi-custodian structure could reduce reliance on a single service provider and make it easier for large investors to assess the process. But whether it brings additional demand depends on redemptions and creations, actual custody allocations, and sustained net inflows. The nominal value of a contract cannot be translated into buying demand. In the Farside table, BTCO’s entry for November 20 is zero, and the BTC funds show total outflows of $124.5 million, but IBIT’s entry for that day is blank, so the full market net figure still needs to be updated. The full table showed outflows of $582.3 million on November 19. Infrastructure can improve while short-term fund flows remain weak; both can be true at the same time.
How has the market reacted so far? Binance spot BTC was around $60,821 just now, up about 1.65% over 24 hours, with a range of roughly $58,769 to $61,670. The price has held above $60,000, but has yet to regain a firm footing at the intraday high. For now, I’m treating $61,670 as the breakout confirmation level, $60,000 as the dividing line for sentiment and structure, and around $58,770 as the downside risk level. If BTC quickly falls back below $60,000 after a breakout, or if fund outflows continue while spot volume fails to pick up, I’ll withdraw my short-term bullish view. Strategy’s latest official ledger disclosure is still the November 16 purchase of 485 BTC, bringing its total to 850,849. If social media images imply a new purchase, that should be treated as fact only after the company or the SEC formally updates its disclosures.
If I were trading this myself, I wouldn’t chase the rally right now; I’d only take a small spot position in the direction of the trend. I’d consider a long using 3% of total capital only if BTC firmly moves above $61,670 and then retests the $61,200–$61,670 range and holds. The first target would be $63,000, where I’d sell half; the second would be $64,500, with a trailing stop on the remainder. I’d stop out if the price fell below $60,400 after entry. If the entry condition isn’t met, I’d stay out of the market; a plan should not be presented as a completed trade. If $60,000 gives way first, I’d pause the bullish plan and watch whether $58,770 holds, without averaging down against the trend. If a custody or exchange security incident occurs after entry, or completed ETF data shows more severe capital pressure than expected, I’d actively reduce the position—even close it entirely—even if the price stop hasn’t been hit. The contract is a medium-term point to monitor; trade execution should still prioritize confirmation from capital flows and price action.
#BTCReboundsAbove$60KAmidWhaleDipBuying #BTC
The above is solely my personal market observation and does not constitute investment advice.
BTC’s rebound still awaits confirmation from capital flows|BTCO adds Bank of New York Mellon as custodian|Don’t mistake infrastructure for buying demand
My stance is cautiously bullish, but I’m still waiting for capital flows and price action to confirm the move together. People are still discussing Bitcoin’s return to $60,000 and “whales buying the dip” on social media. The enthusiasm is real, but wallet ownership and the timing of purchases can’t be inferred from transfers alone. Today, let’s look at the institutional chain from another angle: Invesco Galaxy Bitcoin ETF’s SEC 8-K filing disclosed that the fund signed a digital asset custody agreement with the Bank of New York Mellon on November 6. The bank is expected to establish segregated custody accounts to receive and hold the fund’s bitcoin; the existing Coinbase custody arrangement is unaffected. The filing says the sponsor expects to use both custodians. This is an expansion of custody arrangements—not a new bitcoin position added today, and certainly not the SEC just approving a new ETF.
The way this could affect BTC is through operational and counterparty risk for institutions holding spot assets. A multi-custodian structure could reduce reliance on a single service provider and make it easier for large investors to assess the process. But whether it brings additional demand depends on redemptions and creations, actual custody allocations, and sustained net inflows. The nominal value of a contract cannot be translated into buying demand. In the Farside table, BTCO’s entry for November 20 is zero, and the BTC funds show total outflows of $124.5 million, but IBIT’s entry for that day is blank, so the full market net figure still needs to be updated. The full table showed outflows of $582.3 million on November 19. Infrastructure can improve while short-term fund flows remain weak; both can be true at the same time.
How has the market reacted so far? Binance spot BTC was around $60,821 just now, up about 1.65% over 24 hours, with a range of roughly $58,769 to $61,670. The price has held above $60,000, but has yet to regain a firm footing at the intraday high. For now, I’m treating $61,670 as the breakout confirmation level, $60,000 as the dividing line for sentiment and structure, and around $58,770 as the downside risk level. If BTC quickly falls back below $60,000 after a breakout, or if fund outflows continue while spot volume fails to pick up, I’ll withdraw my short-term bullish view. Strategy’s latest official ledger disclosure is still the November 16 purchase of 485 BTC, bringing its total to 850,849. If social media images imply a new purchase, that should be treated as fact only after the company or the SEC formally updates its disclosures.
If I were trading this myself, I wouldn’t chase the rally right now; I’d only take a small spot position in the direction of the trend. I’d consider a long using 3% of total capital only if BTC firmly moves above $61,670 and then retests the $61,200–$61,670 range and holds. The first target would be $63,000, where I’d sell half; the second would be $64,500, with a trailing stop on the remainder. I’d stop out if the price fell below $60,400 after entry. If the entry condition isn’t met, I’d stay out of the market; a plan should not be presented as a completed trade. If $60,000 gives way first, I’d pause the bullish plan and watch whether $58,770 holds, without averaging down against the trend. If a custody or exchange security incident occurs after entry, or completed ETF data shows more severe capital pressure than expected, I’d actively reduce the position—even close it entirely—even if the price stop hasn’t been hit. The contract is a medium-term point to monitor; trade execution should still prioritize confirmation from capital flows and price action.
#BTCReboundsAbove$60KAmidWhaleDipBuying #BTC
The above is solely my personal market observation and does not constitute investment advice.
My stance is cautiously bullish, but I’m still waiting for capital flows and price action to confirm the move together. People are still discussing Bitcoin’s return to $60,000 and “whales buying the dip” on social media. The enthusiasm is real, but wallet ownership and the timing of purchases can’t be inferred from transfers alone. Today, let’s look at the institutional chain from another angle: Invesco Galaxy Bitcoin ETF’s SEC 8-K filing disclosed that the fund signed a digital asset custody agreement with the Bank of New York Mellon on November 6. The bank is expected to establish segregated custody accounts to receive and hold the fund’s bitcoin; the existing Coinbase custody arrangement is unaffected. The filing says the sponsor expects to use both custodians. This is an expansion of custody arrangements—not a new bitcoin position added today, and certainly not the SEC just approving a new ETF.
The way this could affect BTC is through operational and counterparty risk for institutions holding spot assets. A multi-custodian structure could reduce reliance on a single service provider and make it easier for large investors to assess the process. But whether it brings additional demand depends on redemptions and creations, actual custody allocations, and sustained net inflows. The nominal value of a contract cannot be translated into buying demand. In the Farside table, BTCO’s entry for November 20 is zero, and the BTC funds show total outflows of $124.5 million, but IBIT’s entry for that day is blank, so the full market net figure still needs to be updated. The full table showed outflows of $582.3 million on November 19. Infrastructure can improve while short-term fund flows remain weak; both can be true at the same time.
How has the market reacted so far? Binance spot BTC was around $60,821 just now, up about 1.65% over 24 hours, with a range of roughly $58,769 to $61,670. The price has held above $60,000, but has yet to regain a firm footing at the intraday high. For now, I’m treating $61,670 as the breakout confirmation level, $60,000 as the dividing line for sentiment and structure, and around $58,770 as the downside risk level. If BTC quickly falls back below $60,000 after a breakout, or if fund outflows continue while spot volume fails to pick up, I’ll withdraw my short-term bullish view. Strategy’s latest official ledger disclosure is still the November 16 purchase of 485 BTC, bringing its total to 850,849. If social media images imply a new purchase, that should be treated as fact only after the company or the SEC formally updates its disclosures.
If I were trading this myself, I wouldn’t chase the rally right now; I’d only take a small spot position in the direction of the trend. I’d consider a long using 3% of total capital only if BTC firmly moves above $61,670 and then retests the $61,200–$61,670 range and holds. The first target would be $63,000, where I’d sell half; the second would be $64,500, with a trailing stop on the remainder. I’d stop out if the price fell below $60,400 after entry. If the entry condition isn’t met, I’d stay out of the market; a plan should not be presented as a completed trade. If $60,000 gives way first, I’d pause the bullish plan and watch whether $58,770 holds, without averaging down against the trend. If a custody or exchange security incident occurs after entry, or completed ETF data shows more severe capital pressure than expected, I’d actively reduce the position—even close it entirely—even if the price stop hasn’t been hit. The contract is a medium-term point to monitor; trade execution should still prioritize confirmation from capital flows and price action.
#BTCReboundsAbove$60KAmidWhaleDipBuying #BTC
The above is solely my personal market observation and does not constitute investment advice.

10

·
--
Strong rebound after plunge to $55K: Whales establish a defensive floor at $60K【Strong rebound after plunge to $55K: At what price did whales enter?】
Bitcoin formed a clear right shoulder of a head-and-shoulders pattern over the past week. It was still near $65,350 on November 16, then slid for three consecutive days, falling below $62,000 and touching $57,778 on November 20 before setting a new weekly low of $55,130 on November 21. The long lower wick below $55,000 marked the week’s largest single-day move: Bitcoin rebounded from a low of $55,130 to close at $60,215, gaining more than 9% in a single day.
【On-chain data confirms massive buying】
According to on-chain monitoring, more than 1,200 BTC traded in the $55,000–$57,000 range on November 21, accounting for approximately 30% or more of the day’s total trading volume. This concentrated buying at that price level doesn’t look like retail activity—there were more than 40 trades of over 50 BTC each, and several buys occurred while the price was still falling, suggesting that investors were actively buying the dip rather than waiting for confirmation of a bottom before entering.
Strong rebound after plunge to $55K: Whales establish a defensive floor at $60K
【Strong rebound after plunge to $55K: At what price did whales enter?】
Bitcoin formed a clear right shoulder of a head-and-shoulders pattern over the past week. It was still near $65,350 on November 16, then slid for three consecutive days, falling below $62,000 and touching $57,778 on November 20 before setting a new weekly low of $55,130 on November 21. The long lower wick below $55,000 marked the week’s largest single-day move: Bitcoin rebounded from a low of $55,130 to close at $60,215, gaining more than 9% in a single day.
【On-chain data confirms massive buying】
According to on-chain monitoring, more than 1,200 BTC traded in the $55,000–$57,000 range on November 21, accounting for approximately 30% or more of the day’s total trading volume. This concentrated buying at that price level doesn’t look like retail activity—there were more than 40 trades of over 50 BTC each, and several buys occurred while the price was still falling, suggesting that investors were actively buying the dip rather than waiting for confirmation of a bottom before entering.
Bitcoin formed a clear right shoulder of a head-and-shoulders pattern over the past week. It was still near $65,350 on November 16, then slid for three consecutive days, falling below $62,000 and touching $57,778 on November 20 before setting a new weekly low of $55,130 on November 21. The long lower wick below $55,000 marked the week’s largest single-day move: Bitcoin rebounded from a low of $55,130 to close at $60,215, gaining more than 9% in a single day.
【On-chain data confirms massive buying】
According to on-chain monitoring, more than 1,200 BTC traded in the $55,000–$57,000 range on November 21, accounting for approximately 30% or more of the day’s total trading volume. This concentrated buying at that price level doesn’t look like retail activity—there were more than 40 trades of over 50 BTC each, and several buys occurred while the price was still falling, suggesting that investors were actively buying the dip rather than waiting for confirmation of a bottom before entering.
310

·
--
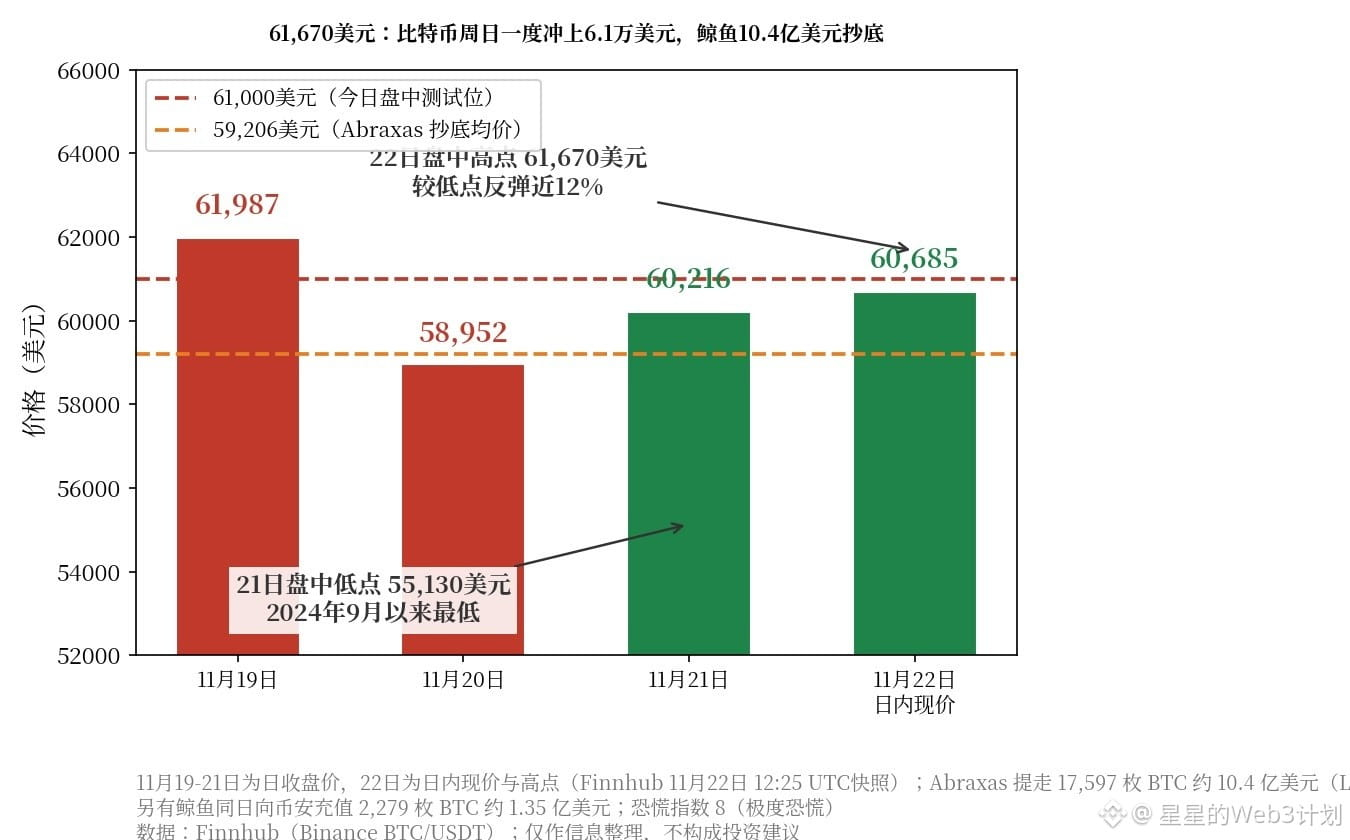
$61,670: Bitcoin briefly reached this price intraday on Sunday, its first time touching $61,000 since falling below $60,000. It has rebounded nearly 12% from its low of $55,130.
There was real money behind the move: On-chain data shows that Abraxas Capital withdrew 17,597 bitcoins from Binance and Kraken while the price was below $60,000—about $1.04 billion at an average price of roughly $59,206. Of those, 11,241 bitcoins were withdrawn as the price climbed back above $60,000. But some whales were also selling: 2,279 bitcoins, worth about $135 million, were deposited into Binance the same day.
I think whales buying the dip is a good sign, but not yet a reversal signal: Bitcoin is now at $60,685, just 2.5% above Abraxas’s cost basis. Monday’s U.S. stock market open and ETF flows will be the real test, while the Fear and Greed Index remains stuck at 8, in extreme fear.
Which side are you on: ETF flows turn positive on Monday and Bitcoin holds above $61,000, or outflows continue and the $59,206 whale cost basis gives way first?
$BTC
#BTCReboundsAbove$60KAmidWhaleDipBuying
$61,670: Bitcoin briefly reached this price intraday on Sunday, its first time touching $61,000 since falling below $60,000. It has rebounded nearly 12% from its low of $55,130.
There was real money behind the move: On-chain data shows that Abraxas Capital withdrew 17,597 bitcoins from Binance and Kraken while the price was below $60,000—about $1.04 billion at an average price of roughly $59,206. Of those, 11,241 bitcoins were withdrawn as the price climbed back above $60,000. But some whales were also selling: 2,279 bitcoins, worth about $135 million, were deposited into Binance the same day.
I think whales buying the dip is a good sign, but not yet a reversal signal: Bitcoin is now at $60,685, just 2.5% above Abraxas’s cost basis. Monday’s U.S. stock market open and ETF flows will be the real test, while the Fear and Greed Index remains stuck at 8, in extreme fear.
Which side are you on: ETF flows turn positive on Monday and Bitcoin holds above $61,000, or outflows continue and the $59,206 whale cost basis gives way first?
$BTC
#BTCReboundsAbove$60KAmidWhaleDipBuying
There was real money behind the move: On-chain data shows that Abraxas Capital withdrew 17,597 bitcoins from Binance and Kraken while the price was below $60,000—about $1.04 billion at an average price of roughly $59,206. Of those, 11,241 bitcoins were withdrawn as the price climbed back above $60,000. But some whales were also selling: 2,279 bitcoins, worth about $135 million, were deposited into Binance the same day.
I think whales buying the dip is a good sign, but not yet a reversal signal: Bitcoin is now at $60,685, just 2.5% above Abraxas’s cost basis. Monday’s U.S. stock market open and ETF flows will be the real test, while the Fear and Greed Index remains stuck at 8, in extreme fear.
Which side are you on: ETF flows turn positive on Monday and Bitcoin holds above $61,000, or outflows continue and the $59,206 whale cost basis gives way first?
$BTC
#BTCReboundsAbove$60KAmidWhaleDipBuying
·
--
BTC Reclaims $61,000|Whale Withdrawals Are Still Not Verified Buying|I’ll Wait for a Break Above 61670 Before Getting In
My view is to acknowledge the strength of the rebound, but not to add to my position just because of the phrase “whales buying the dip.” The top trending topic on Binance Square right now is #BTCReboundsAbove$60KAmidWhaleDipBuying, with around 141 participants in the discussion. Binance News cited on-chain tracker Lookonchain as saying that addresses attributed to Abraxas Capital withdrew a total of 17,597 BTC from exchanges; the article also cited analysts linking some of the withdrawals to the rebound. These are third-party address attributions and interpretations. On-chain transfers can prove that funds moved, but cannot on their own prove who bought at the current price, or that these coins will not flow back to exchanges. Ownership of another wallet that received a large stablecoin deposit has also not been verified, so it especially should not be described as confirmed institutional accumulation. My independent assessment is to first see whether the price can absorb selling pressure, and only then discuss whether the narrative is playing out.
First-hand fund data tells another side of the story. According to the Farside table, U.S. spot BTC funds saw total net outflows of $582.3 million on November 19, including $541.1 million in net outflows from IBIT. The IBIT column for November 20 is still blank. Although the page shows combined net outflows of around $124.5 million for other funds that have reported, this should not be treated as the complete final figure for the entire market. There are also no new regular U.S. stock ETF trading-day figures over the weekend, so a weekend rise in the BTC price does not mean funds have returned to net inflows. The latest reporting date listed in Strategy’s official ledger is November 16, when it purchased 485 BTC, bringing its total holdings to 850,849 BTC. If a Saylor holdings chart appears on social media again, I’ll treat it only as a hint or market expectation until the company or SEC formally updates its figures. These three sources use different reporting methodologies.
The market reaction has indeed been more positive: BTCUSDT on Binance was around $61,388 at the time of checking, up about 5.03% over 24 hours, with a range of $58,369.62 to $61,669.99. This shows that the price has reclaimed $60,000 and is nearing its intraday high, but it does not tell us which specific withdrawal drove the rise. My level to watch is 61670; if the price breaks above it and holds, I’ll look to 62000 and 63500. 60000 is the round-number level that has just been reclaimed; if the price falls back below it and cannot recover, the quality of the rebound will deteriorate significantly. If it drops below 58370, the structure of this 24-hour rebound will be invalidated. If complete fund data later continues to show net outflows while the price fails to hold above 62000, I’ll also lower my expectations for a sustained move.
If I were trading this myself, I wouldn’t chase the current price. I’d only consider a spot long, with a position size of 2% of total capital and no leverage. The entry trigger is two consecutive one-hour candles closing above 61670, followed by a retest of 61670 that finds support. I would buy only after these conditions are met. I’d first reduce the position by one-third at 62000, then sell half of what remains at 63500. I’d close the rest if a one-hour candle closes back below 61670. The initial stop-loss is 60600, and I’d exit the entire position if it is hit. If the price first falls below 60000, I’ll cancel this long setup and stay out of the market. I also wouldn’t force a trade after a breakout if volume fades and the price repeatedly forms long wicks. The planned loss on a single trade would be no more than about 0.04% of total capital. I’d rather miss the move than treat an unverified wallet attribution as a buy signal.
Sources: Binance Square trending topic, on-chain observations cited by Binance News, Farside BTC fund table, Strategy’s official ledger, Binance BTCUSDT market data. #BTCReboundsAbove$60KAmidWhaleDipBuying #BTC
The above is for personal market observation only and does not constitute investment advice.
BTC Reclaims $61,000|Whale Withdrawals Are Still Not Verified Buying|I’ll Wait for a Break Above 61670 Before Getting In
My view is to acknowledge the strength of the rebound, but not to add to my position just because of the phrase “whales buying the dip.” The top trending topic on Binance Square right now is #BTCReboundsAbove$60KAmidWhaleDipBuying, with around 141 participants in the discussion. Binance News cited on-chain tracker Lookonchain as saying that addresses attributed to Abraxas Capital withdrew a total of 17,597 BTC from exchanges; the article also cited analysts linking some of the withdrawals to the rebound. These are third-party address attributions and interpretations. On-chain transfers can prove that funds moved, but cannot on their own prove who bought at the current price, or that these coins will not flow back to exchanges. Ownership of another wallet that received a large stablecoin deposit has also not been verified, so it especially should not be described as confirmed institutional accumulation. My independent assessment is to first see whether the price can absorb selling pressure, and only then discuss whether the narrative is playing out.
First-hand fund data tells another side of the story. According to the Farside table, U.S. spot BTC funds saw total net outflows of $582.3 million on November 19, including $541.1 million in net outflows from IBIT. The IBIT column for November 20 is still blank. Although the page shows combined net outflows of around $124.5 million for other funds that have reported, this should not be treated as the complete final figure for the entire market. There are also no new regular U.S. stock ETF trading-day figures over the weekend, so a weekend rise in the BTC price does not mean funds have returned to net inflows. The latest reporting date listed in Strategy’s official ledger is November 16, when it purchased 485 BTC, bringing its total holdings to 850,849 BTC. If a Saylor holdings chart appears on social media again, I’ll treat it only as a hint or market expectation until the company or SEC formally updates its figures. These three sources use different reporting methodologies.
The market reaction has indeed been more positive: BTCUSDT on Binance was around $61,388 at the time of checking, up about 5.03% over 24 hours, with a range of $58,369.62 to $61,669.99. This shows that the price has reclaimed $60,000 and is nearing its intraday high, but it does not tell us which specific withdrawal drove the rise. My level to watch is 61670; if the price breaks above it and holds, I’ll look to 62000 and 63500. 60000 is the round-number level that has just been reclaimed; if the price falls back below it and cannot recover, the quality of the rebound will deteriorate significantly. If it drops below 58370, the structure of this 24-hour rebound will be invalidated. If complete fund data later continues to show net outflows while the price fails to hold above 62000, I’ll also lower my expectations for a sustained move.
If I were trading this myself, I wouldn’t chase the current price. I’d only consider a spot long, with a position size of 2% of total capital and no leverage. The entry trigger is two consecutive one-hour candles closing above 61670, followed by a retest of 61670 that finds support. I would buy only after these conditions are met. I’d first reduce the position by one-third at 62000, then sell half of what remains at 63500. I’d close the rest if a one-hour candle closes back below 61670. The initial stop-loss is 60600, and I’d exit the entire position if it is hit. If the price first falls below 60000, I’ll cancel this long setup and stay out of the market. I also wouldn’t force a trade after a breakout if volume fades and the price repeatedly forms long wicks. The planned loss on a single trade would be no more than about 0.04% of total capital. I’d rather miss the move than treat an unverified wallet attribution as a buy signal.
Sources: Binance Square trending topic, on-chain observations cited by Binance News, Farside BTC fund table, Strategy’s official ledger, Binance BTCUSDT market data. #BTCReboundsAbove$60KAmidWhaleDipBuying #BTC
The above is for personal market observation only and does not constitute investment advice.
My view is to acknowledge the strength of the rebound, but not to add to my position just because of the phrase “whales buying the dip.” The top trending topic on Binance Square right now is #BTCReboundsAbove$60KAmidWhaleDipBuying, with around 141 participants in the discussion. Binance News cited on-chain tracker Lookonchain as saying that addresses attributed to Abraxas Capital withdrew a total of 17,597 BTC from exchanges; the article also cited analysts linking some of the withdrawals to the rebound. These are third-party address attributions and interpretations. On-chain transfers can prove that funds moved, but cannot on their own prove who bought at the current price, or that these coins will not flow back to exchanges. Ownership of another wallet that received a large stablecoin deposit has also not been verified, so it especially should not be described as confirmed institutional accumulation. My independent assessment is to first see whether the price can absorb selling pressure, and only then discuss whether the narrative is playing out.
First-hand fund data tells another side of the story. According to the Farside table, U.S. spot BTC funds saw total net outflows of $582.3 million on November 19, including $541.1 million in net outflows from IBIT. The IBIT column for November 20 is still blank. Although the page shows combined net outflows of around $124.5 million for other funds that have reported, this should not be treated as the complete final figure for the entire market. There are also no new regular U.S. stock ETF trading-day figures over the weekend, so a weekend rise in the BTC price does not mean funds have returned to net inflows. The latest reporting date listed in Strategy’s official ledger is November 16, when it purchased 485 BTC, bringing its total holdings to 850,849 BTC. If a Saylor holdings chart appears on social media again, I’ll treat it only as a hint or market expectation until the company or SEC formally updates its figures. These three sources use different reporting methodologies.
The market reaction has indeed been more positive: BTCUSDT on Binance was around $61,388 at the time of checking, up about 5.03% over 24 hours, with a range of $58,369.62 to $61,669.99. This shows that the price has reclaimed $60,000 and is nearing its intraday high, but it does not tell us which specific withdrawal drove the rise. My level to watch is 61670; if the price breaks above it and holds, I’ll look to 62000 and 63500. 60000 is the round-number level that has just been reclaimed; if the price falls back below it and cannot recover, the quality of the rebound will deteriorate significantly. If it drops below 58370, the structure of this 24-hour rebound will be invalidated. If complete fund data later continues to show net outflows while the price fails to hold above 62000, I’ll also lower my expectations for a sustained move.
If I were trading this myself, I wouldn’t chase the current price. I’d only consider a spot long, with a position size of 2% of total capital and no leverage. The entry trigger is two consecutive one-hour candles closing above 61670, followed by a retest of 61670 that finds support. I would buy only after these conditions are met. I’d first reduce the position by one-third at 62000, then sell half of what remains at 63500. I’d close the rest if a one-hour candle closes back below 61670. The initial stop-loss is 60600, and I’d exit the entire position if it is hit. If the price first falls below 60000, I’ll cancel this long setup and stay out of the market. I also wouldn’t force a trade after a breakout if volume fades and the price repeatedly forms long wicks. The planned loss on a single trade would be no more than about 0.04% of total capital. I’d rather miss the move than treat an unverified wallet attribution as a buy signal.
Sources: Binance Square trending topic, on-chain observations cited by Binance News, Farside BTC fund table, Strategy’s official ledger, Binance BTCUSDT market data. #BTCReboundsAbove$60KAmidWhaleDipBuying #BTC
The above is for personal market observation only and does not constitute investment advice.
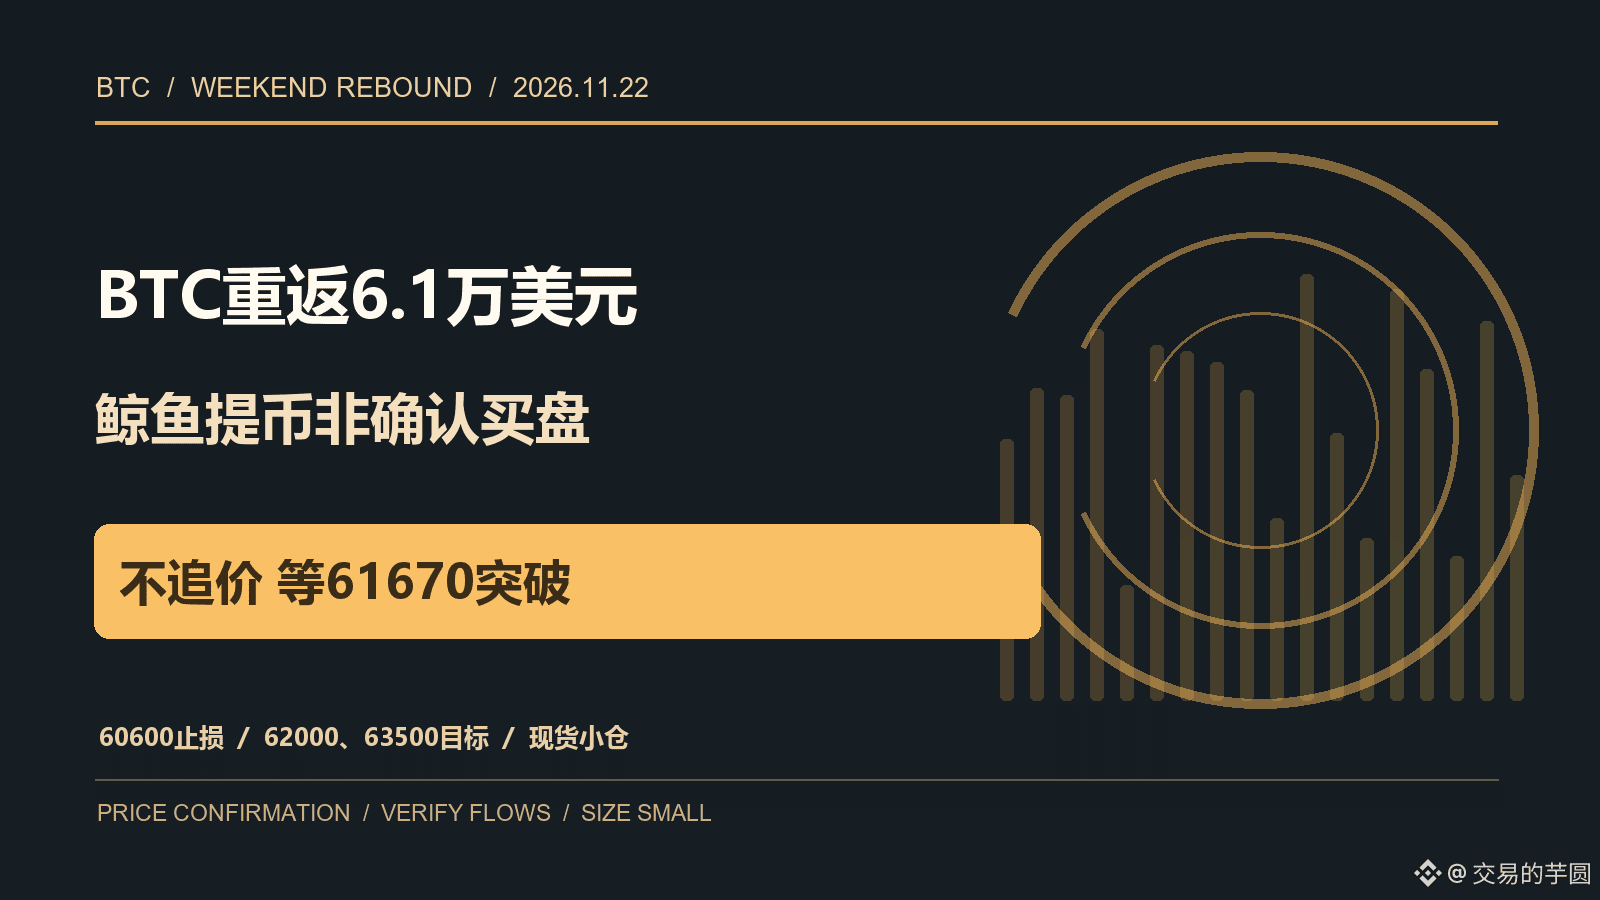
1

·
--
$2.7 billion evaporated in a single day.
The liquidation wave on November 21 was the 11th-largest in history, catching 330,000 traders off guard.
But the plot twist came faster than anyone expected—
Bitcoin surged from around $55,000 to reclaim $60,000, and within an hour, $68.82 million in short positions were liquidated, compared with just $1.64 million in longs.
A short squeeze, straight out of the textbook.
But don’t rush to call it a reversal:
Short-term holders moved 92,100 Bitcoin to exchanges at a loss, while open interest shrank by $2.54 billion over 30 days.
Trading volume, though, was undeniably real: $43.8 billion in 24 hours, the highest since February.
Volume is back, but people are still afraid—the Fear & Greed Index is at 11, signaling extreme fear.
On one side, shorts are getting squeezed; on the other, holders are selling at a loss.
Do you think this is a genuine reversal, or just a fake move after shorts covered?
Personal opinion, not investment advice.
$BTC #BTCReboundsAbove$60KAmidWhaleDipBuying #Bitcoin #Crypto
$2.7 billion evaporated in a single day.
The liquidation wave on November 21 was the 11th-largest in history, catching 330,000 traders off guard.
But the plot twist came faster than anyone expected—
Bitcoin surged from around $55,000 to reclaim $60,000, and within an hour, $68.82 million in short positions were liquidated, compared with just $1.64 million in longs.
A short squeeze, straight out of the textbook.
But don’t rush to call it a reversal:
Short-term holders moved 92,100 Bitcoin to exchanges at a loss, while open interest shrank by $2.54 billion over 30 days.
Trading volume, though, was undeniably real: $43.8 billion in 24 hours, the highest since February.
Volume is back, but people are still afraid—the Fear & Greed Index is at 11, signaling extreme fear.
On one side, shorts are getting squeezed; on the other, holders are selling at a loss.
Do you think this is a genuine reversal, or just a fake move after shorts covered?
Personal opinion, not investment advice.
$BTC #BTCReboundsAbove$60KAmidWhaleDipBuying #Bitcoin #Crypto
The liquidation wave on November 21 was the 11th-largest in history, catching 330,000 traders off guard.
But the plot twist came faster than anyone expected—
Bitcoin surged from around $55,000 to reclaim $60,000, and within an hour, $68.82 million in short positions were liquidated, compared with just $1.64 million in longs.
A short squeeze, straight out of the textbook.
But don’t rush to call it a reversal:
Short-term holders moved 92,100 Bitcoin to exchanges at a loss, while open interest shrank by $2.54 billion over 30 days.
Trading volume, though, was undeniably real: $43.8 billion in 24 hours, the highest since February.
Volume is back, but people are still afraid—the Fear & Greed Index is at 11, signaling extreme fear.
On one side, shorts are getting squeezed; on the other, holders are selling at a loss.
Do you think this is a genuine reversal, or just a fake move after shorts covered?
Personal opinion, not investment advice.
$BTC #BTCReboundsAbove$60KAmidWhaleDipBuying #Bitcoin #Crypto
·
--
BTC Reclaims $60,000 | Hot-Topic Discussion Heats Up, but ETF Data Has Gaps | I’m Waiting for a Confirmed Retest
My view is that the rebound is real, but reclaiming $60,000 is not an unconditional signal to chase long positions. The Binance Square topic gaining traction is #BTCReboundsAbove$60KAmidWhaleDipBuying, with discussion volume rising from 90 earlier in this cycle to 119. “Whale dip-buying” is the narrative of the topic; the hashtag alone cannot prove that any specific institution made a new purchase today. Binance spot BTC/USDT just traded at around 60,853, up about 4.94% over 24 hours, with a range of 57,860 to 61,365. Compared with earlier intraday action, when the price briefly reclaimed $60,000 before falling back below it, moving above this round-number level again is a market change that has already happened. But the intraday high near 61,365 still needs confirmation from fresh trading and a retest, and weekend liquidity could also amplify a false breakout.
It’s even more important to align the timing when looking at fund flows. The Farside table shows that on November 19, U.S. spot BTC funds saw combined net outflows of about $582.3 million, with IBIT recording a single-day outflow of about $541.1 million. The page lists data for some funds on November 20, but the IBIT column is still blank, so the total shown on the page should not be treated as the complete, final flow for all funds. There are also no regular ETF trading-day creation and redemption figures over the weekend that can be synchronized with intraday spot-market moves. As for corporate holdings, Twenty One Capital officially announced on November 20 that it had purchased 172.25 BTC. This is a disclosed fact, but it does not mean other companies also increased their holdings during the same period. If someone is speculating that Strategy bought more coins based solely on a Saylor post, that can only be described as a hint or market expectation until the company or the SEC makes an official disclosure.
For trading, large on-chain withdrawals, corporate purchases, and fund creations and redemptions each answer different questions. A withdrawal may reflect custody or address changes and does not directly mean an immediate exchange purchase. A corporate purchase has a clear size and timing, but its relative scale still needs to be considered against total BTC market trading. Fund net flows reflect a specific channel and cannot account for all weekend spot demand. So I’ll treat $60,000 as the dividing line for sentiment and structure, 61,365 as the immediate high, and 59,000 as a warning level for a pullback. If the 4-hour price falls back below $60,000 and remains unable to reclaim it, or if fund data shows another significant outflow on the next trading day while the price also breaks below $59,000, my short-term bullish view will be invalidated.
If I were trading this myself, I’d sit out for now and consider only a small spot long position. The entry trigger would be a 4-hour close holding above 61,365, followed by a retest in which the price holds between 60,000 and 61,365, with no unusual widening in the bid-ask spread. If those conditions are met, I’d use no more than 4% of my total capital to test the position, without using high leverage. The first target is 62,000; I’d sell half there and move the stop-loss on the remainder up to around breakeven. The second target is 63,500, where I’d sell most of what remains. I’d place the initial stop-loss below 59,000 and close the position if a 4-hour candle closes below 59,000 or if a major exchange security incident occurs. If the price spikes and then falls straight back below $60,000, I’d remain out of the market. If the conditions aren’t triggered, this is just a plan—not a trade that has already been executed or a profit that has already been made.
Sources: Binance Square trending topics and Binance spot market data; Farside fund flow table; official announcement from Twenty One Capital. #BTCReboundsAbove$60KAmidWhaleDipBuying #BTC
This is solely my personal market observation and does not constitute investment advice.
BTC Reclaims $60,000 | Hot-Topic Discussion Heats Up, but ETF Data Has Gaps | I’m Waiting for a Confirmed Retest
My view is that the rebound is real, but reclaiming $60,000 is not an unconditional signal to chase long positions. The Binance Square topic gaining traction is #BTCReboundsAbove$60KAmidWhaleDipBuying, with discussion volume rising from 90 earlier in this cycle to 119. “Whale dip-buying” is the narrative of the topic; the hashtag alone cannot prove that any specific institution made a new purchase today. Binance spot BTC/USDT just traded at around 60,853, up about 4.94% over 24 hours, with a range of 57,860 to 61,365. Compared with earlier intraday action, when the price briefly reclaimed $60,000 before falling back below it, moving above this round-number level again is a market change that has already happened. But the intraday high near 61,365 still needs confirmation from fresh trading and a retest, and weekend liquidity could also amplify a false breakout.
It’s even more important to align the timing when looking at fund flows. The Farside table shows that on November 19, U.S. spot BTC funds saw combined net outflows of about $582.3 million, with IBIT recording a single-day outflow of about $541.1 million. The page lists data for some funds on November 20, but the IBIT column is still blank, so the total shown on the page should not be treated as the complete, final flow for all funds. There are also no regular ETF trading-day creation and redemption figures over the weekend that can be synchronized with intraday spot-market moves. As for corporate holdings, Twenty One Capital officially announced on November 20 that it had purchased 172.25 BTC. This is a disclosed fact, but it does not mean other companies also increased their holdings during the same period. If someone is speculating that Strategy bought more coins based solely on a Saylor post, that can only be described as a hint or market expectation until the company or the SEC makes an official disclosure.
For trading, large on-chain withdrawals, corporate purchases, and fund creations and redemptions each answer different questions. A withdrawal may reflect custody or address changes and does not directly mean an immediate exchange purchase. A corporate purchase has a clear size and timing, but its relative scale still needs to be considered against total BTC market trading. Fund net flows reflect a specific channel and cannot account for all weekend spot demand. So I’ll treat $60,000 as the dividing line for sentiment and structure, 61,365 as the immediate high, and 59,000 as a warning level for a pullback. If the 4-hour price falls back below $60,000 and remains unable to reclaim it, or if fund data shows another significant outflow on the next trading day while the price also breaks below $59,000, my short-term bullish view will be invalidated.
If I were trading this myself, I’d sit out for now and consider only a small spot long position. The entry trigger would be a 4-hour close holding above 61,365, followed by a retest in which the price holds between 60,000 and 61,365, with no unusual widening in the bid-ask spread. If those conditions are met, I’d use no more than 4% of my total capital to test the position, without using high leverage. The first target is 62,000; I’d sell half there and move the stop-loss on the remainder up to around breakeven. The second target is 63,500, where I’d sell most of what remains. I’d place the initial stop-loss below 59,000 and close the position if a 4-hour candle closes below 59,000 or if a major exchange security incident occurs. If the price spikes and then falls straight back below $60,000, I’d remain out of the market. If the conditions aren’t triggered, this is just a plan—not a trade that has already been executed or a profit that has already been made.
Sources: Binance Square trending topics and Binance spot market data; Farside fund flow table; official announcement from Twenty One Capital. #BTCReboundsAbove$60KAmidWhaleDipBuying #BTC
This is solely my personal market observation and does not constitute investment advice.
My view is that the rebound is real, but reclaiming $60,000 is not an unconditional signal to chase long positions. The Binance Square topic gaining traction is #BTCReboundsAbove$60KAmidWhaleDipBuying, with discussion volume rising from 90 earlier in this cycle to 119. “Whale dip-buying” is the narrative of the topic; the hashtag alone cannot prove that any specific institution made a new purchase today. Binance spot BTC/USDT just traded at around 60,853, up about 4.94% over 24 hours, with a range of 57,860 to 61,365. Compared with earlier intraday action, when the price briefly reclaimed $60,000 before falling back below it, moving above this round-number level again is a market change that has already happened. But the intraday high near 61,365 still needs confirmation from fresh trading and a retest, and weekend liquidity could also amplify a false breakout.
It’s even more important to align the timing when looking at fund flows. The Farside table shows that on November 19, U.S. spot BTC funds saw combined net outflows of about $582.3 million, with IBIT recording a single-day outflow of about $541.1 million. The page lists data for some funds on November 20, but the IBIT column is still blank, so the total shown on the page should not be treated as the complete, final flow for all funds. There are also no regular ETF trading-day creation and redemption figures over the weekend that can be synchronized with intraday spot-market moves. As for corporate holdings, Twenty One Capital officially announced on November 20 that it had purchased 172.25 BTC. This is a disclosed fact, but it does not mean other companies also increased their holdings during the same period. If someone is speculating that Strategy bought more coins based solely on a Saylor post, that can only be described as a hint or market expectation until the company or the SEC makes an official disclosure.
For trading, large on-chain withdrawals, corporate purchases, and fund creations and redemptions each answer different questions. A withdrawal may reflect custody or address changes and does not directly mean an immediate exchange purchase. A corporate purchase has a clear size and timing, but its relative scale still needs to be considered against total BTC market trading. Fund net flows reflect a specific channel and cannot account for all weekend spot demand. So I’ll treat $60,000 as the dividing line for sentiment and structure, 61,365 as the immediate high, and 59,000 as a warning level for a pullback. If the 4-hour price falls back below $60,000 and remains unable to reclaim it, or if fund data shows another significant outflow on the next trading day while the price also breaks below $59,000, my short-term bullish view will be invalidated.
If I were trading this myself, I’d sit out for now and consider only a small spot long position. The entry trigger would be a 4-hour close holding above 61,365, followed by a retest in which the price holds between 60,000 and 61,365, with no unusual widening in the bid-ask spread. If those conditions are met, I’d use no more than 4% of my total capital to test the position, without using high leverage. The first target is 62,000; I’d sell half there and move the stop-loss on the remainder up to around breakeven. The second target is 63,500, where I’d sell most of what remains. I’d place the initial stop-loss below 59,000 and close the position if a 4-hour candle closes below 59,000 or if a major exchange security incident occurs. If the price spikes and then falls straight back below $60,000, I’d remain out of the market. If the conditions aren’t triggered, this is just a plan—not a trade that has already been executed or a profit that has already been made.
Sources: Binance Square trending topics and Binance spot market data; Farside fund flow table; official announcement from Twenty One Capital. #BTCReboundsAbove$60KAmidWhaleDipBuying #BTC
This is solely my personal market observation and does not constitute investment advice.
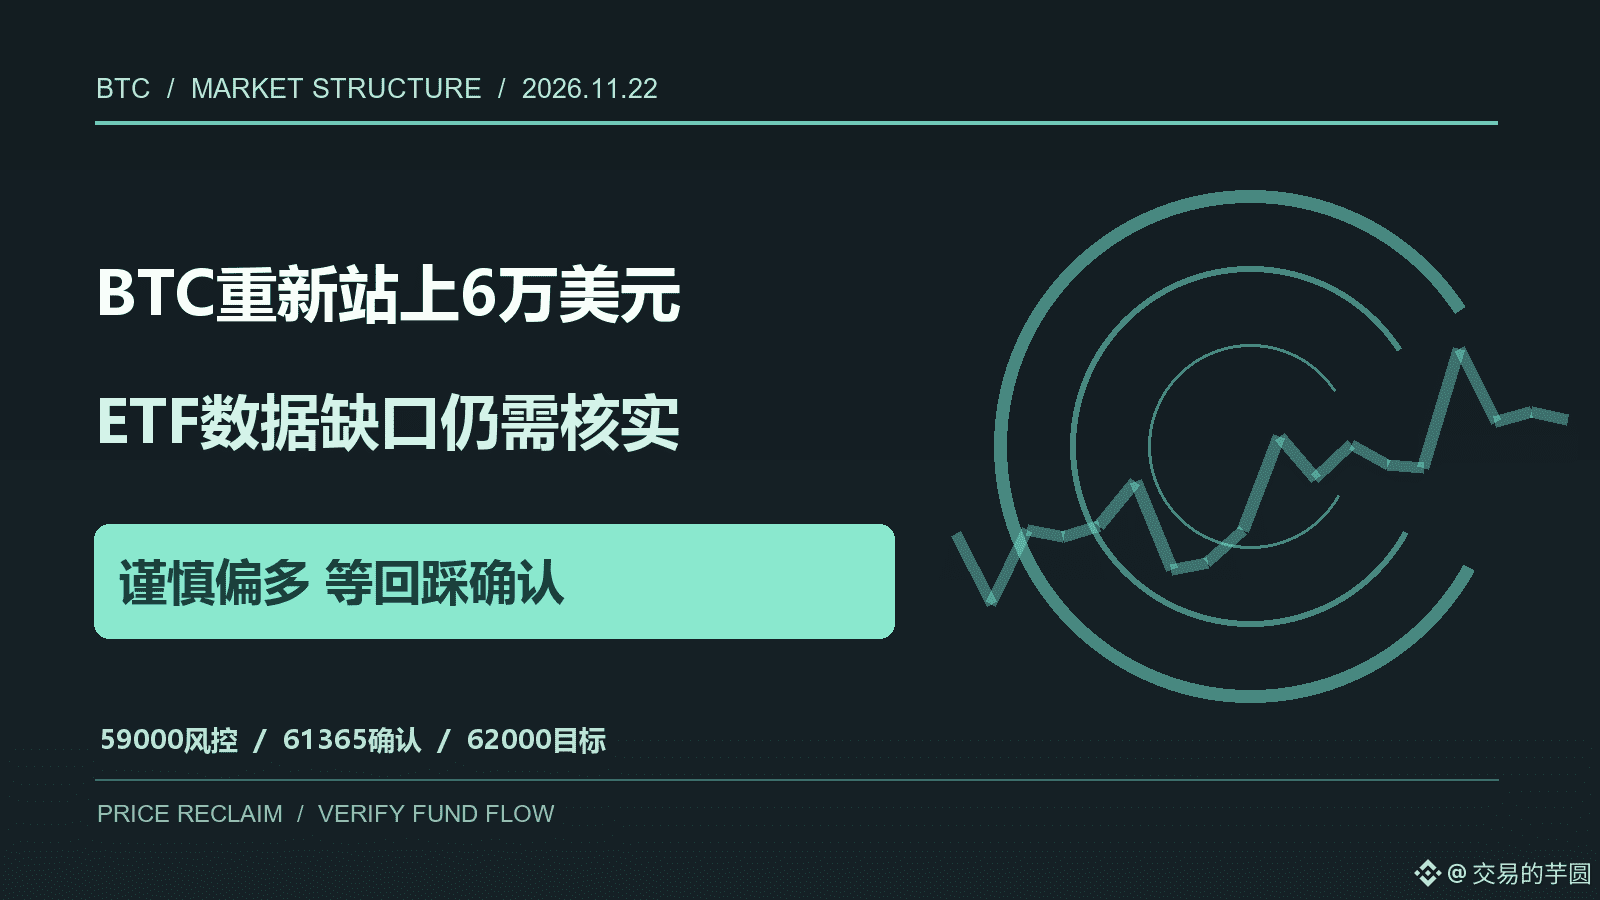
10
Log in to explore more content
Join global crypto users on Binance Square
⚡️ Get latest and useful information about crypto.
💬 Trusted by the world’s largest crypto exchange.
👍 Discover real insights from verified creators.
Email / Phone number
Trending Topics
1
#BTCReboundsAbove$60KAmidWhaleDipBuying
56,871 views
290 Discussing
2
#SolanaSets2027RoadmapToDoubleComputeCapacity
41,196 views
805 Discussing
3
#CaliforniaNvidiaProbeExaminesPotentialCriminalViolations
10,942 views
102 Discussing
4
#BlackRockLaunchesHKDollarDigitalLiquidityFund
34,346 views
631 Discussing
5
#NvidiaLoses$2.7TrillionInMonthAndAHalf
71,437 views
288 Discussing
6
#GlobalStocksFaceLongestLosingStreakSince2023
537,897 views
3,355 Discussing
7
#BlackRockIBITPostsRecord$541MSingleDayOutflow
88,232 views
177 Discussing
8
#AnthropicPlungesTowardIPOPriceonDay2
295,335 views
2,252 Discussing
9
#TwentyOneCapitalAdds172.25BTC
153,820 views
1,569 Discussing
10
#HKBillWouldExcludeTokenizedDepositsFromVirtualAssets
17,392 views
102 Discussing