
#analisistecn
analisistecn
407 views
5 Discussing
Hot
Latest

🚀 BTC DEFENDS KEY SUPPORTS! 📈 PREPARING FOR THE NEXT UPTICK?
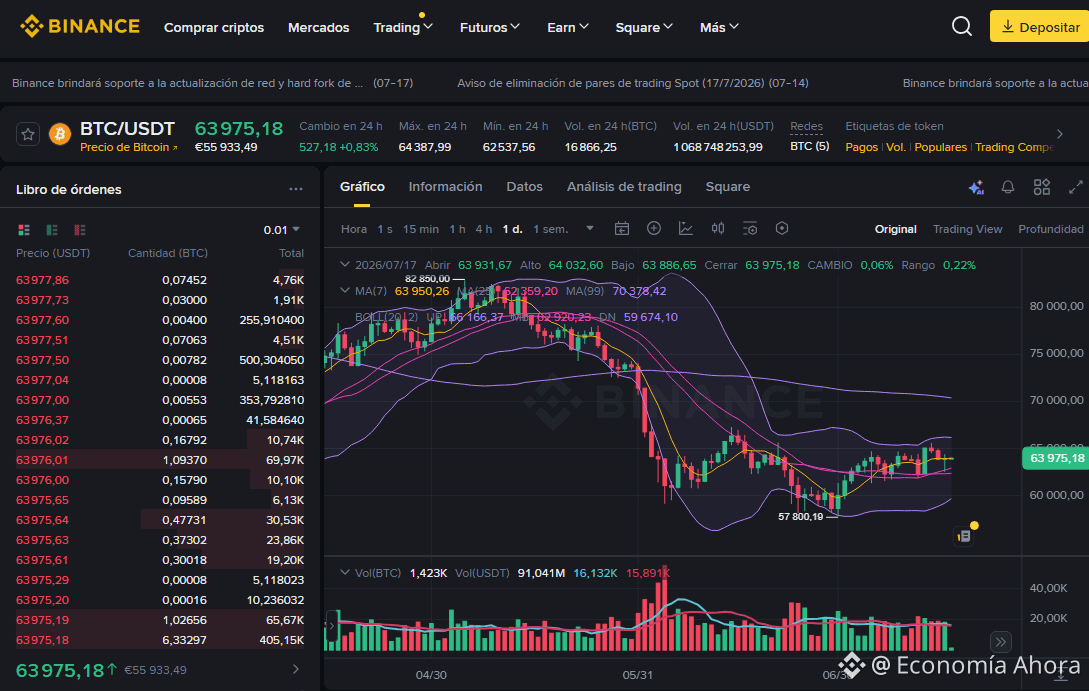
The daily chart of BTC/USDT shows the price trading at 63,975.18, recording a slight positive move of +0.83%. The market is in a vital technical consolidation phase, defending levels that could define the next major move.
🔍 Trend Analysis and Indicators
Trend: Consolidation with a bullish bias. The price has managed to recover and stay just above its fast moving average MA(7) (63,950.26) and with a comfortable margin over the MA(25) (62,359.20), showing that buyers are absorbing short-term selling pressure.
Bollinger Bands: Price action strongly respects the central line or base (MB: 62,920.23). This is the pivot level: as long as BTC remains trading above this base, the technical structure favors an attempt to attack the upper volatility band (UP: 66,166.37).
Structural Floor: The macro support that halted the previous declines remains intact at 57,800.19.
💡 Trading Strategy: Buy or Sell?
Buy (Long)?: Favorable scenario. The ideal strategy is to take advantage of small pullbacks toward the 62,900 - 63,500 area (between the Bollinger base and the MA(7)) as dynamic support levels. Management: It is strictly mandatory to use a Stop Loss below the MA(25) (62,300 zone) to protect capital if the market reverses.
Sell (Short)?: High-risk trade at this point. It would only be technically justified if the asset loses the 62,300 zone with strong selling and volume, confirming structural weakness and opening the way toward the lower band (DN: 59,674.10).
#BTC #AnalisisTecn #CryptoTrading
May the Lord bless and prosper whoever operates here, in the name of Jesus, because your word says: "Mine is the silver, and mine is the gold, says the LORD of hosts." Hageo 2:8 RV1960-T -$BTC
The daily chart of BTC/USDT shows the price trading at 63,975.18, recording a slight positive move of +0.83%. The market is in a vital technical consolidation phase, defending levels that could define the next major move.
🔍 Trend Analysis and Indicators
Trend: Consolidation with a bullish bias. The price has managed to recover and stay just above its fast moving average MA(7) (63,950.26) and with a comfortable margin over the MA(25) (62,359.20), showing that buyers are absorbing short-term selling pressure.
Bollinger Bands: Price action strongly respects the central line or base (MB: 62,920.23). This is the pivot level: as long as BTC remains trading above this base, the technical structure favors an attempt to attack the upper volatility band (UP: 66,166.37).
Structural Floor: The macro support that halted the previous declines remains intact at 57,800.19.
💡 Trading Strategy: Buy or Sell?
Buy (Long)?: Favorable scenario. The ideal strategy is to take advantage of small pullbacks toward the 62,900 - 63,500 area (between the Bollinger base and the MA(7)) as dynamic support levels. Management: It is strictly mandatory to use a Stop Loss below the MA(25) (62,300 zone) to protect capital if the market reverses.
Sell (Short)?: High-risk trade at this point. It would only be technically justified if the asset loses the 62,300 zone with strong selling and volume, confirming structural weakness and opening the way toward the lower band (DN: 59,674.10).
#BTC #AnalisisTecn #CryptoTrading
May the Lord bless and prosper whoever operates here, in the name of Jesus, because your word says: "Mine is the silver, and mine is the gold, says the LORD of hosts." Hageo 2:8 RV1960-T -$BTC
Log in to explore more content