
#asterzones
asterzones
0 views
2 Discussing
Hot
Latest

·
--
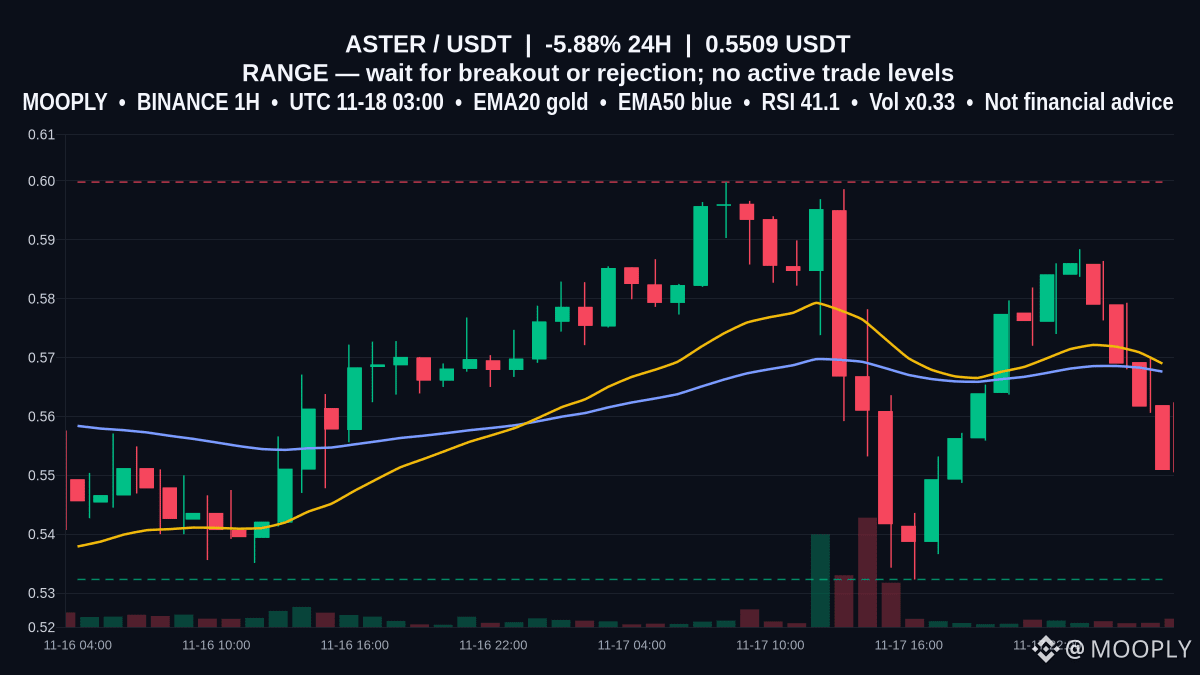
At $0.5509 (-5.88% 24h) $ASTER sits below EMA20 (0.56897) and EMA50 (0.56761), nearer to support than resistance — a range-bound setup rather than a clear trend.
RSI 41.1 and a negative MACD with volRatio 0.33 show low conviction. The chart plots EMA20/EMA50, hourly candles, volume, and horizontal support/resistance at 0.5323 / 0.5998. If price clears 0.5998 with rising volume and EMA alignment, upside becomes plausible; if 0.5323 breaks on volume, downside follows. Wait for confirmed breakout or rejection.
Would a breakout above 0.5998 need volume above the current volRatio 0.33 to be considered valid?
↔ RANGE watch
Support: 0.53230 | Resistance: 0.59980
Bull scenario: confirmation above resistance
Bear scenario: confirmation below support
Entry: N/A | TP1: N/A | TP2: N/A | TP3: N/A | SL: N/A
No confirmed trade until a breakout or rejection.
Not financial advice.
#ASTERZones #RiskFirstTrading #RangeTradingNotes
At $0.5509 (-5.88% 24h) $ASTER sits below EMA20 (0.56897) and EMA50 (0.56761), nearer to support than resistance — a range-bound setup rather than a clear trend.
RSI 41.1 and a negative MACD with volRatio 0.33 show low conviction. The chart plots EMA20/EMA50, hourly candles, volume, and horizontal support/resistance at 0.5323 / 0.5998. If price clears 0.5998 with rising volume and EMA alignment, upside becomes plausible; if 0.5323 breaks on volume, downside follows. Wait for confirmed breakout or rejection.
Would a breakout above 0.5998 need volume above the current volRatio 0.33 to be considered valid?
↔ RANGE watch
Support: 0.53230 | Resistance: 0.59980
Bull scenario: confirmation above resistance
Bear scenario: confirmation below support
Entry: N/A | TP1: N/A | TP2: N/A | TP3: N/A | SL: N/A
No confirmed trade until a breakout or rejection.
Not financial advice.
#ASTERZones #RiskFirstTrading #RangeTradingNotes
RSI 41.1 and a negative MACD with volRatio 0.33 show low conviction. The chart plots EMA20/EMA50, hourly candles, volume, and horizontal support/resistance at 0.5323 / 0.5998. If price clears 0.5998 with rising volume and EMA alignment, upside becomes plausible; if 0.5323 breaks on volume, downside follows. Wait for confirmed breakout or rejection.
Would a breakout above 0.5998 need volume above the current volRatio 0.33 to be considered valid?
↔ RANGE watch
Support: 0.53230 | Resistance: 0.59980
Bull scenario: confirmation above resistance
Bear scenario: confirmation below support
Entry: N/A | TP1: N/A | TP2: N/A | TP3: N/A | SL: N/A
No confirmed trade until a breakout or rejection.
Not financial advice.
#ASTERZones #RiskFirstTrading #RangeTradingNotes
28
Log in to explore more content
Join global crypto users on Binance Square
⚡️ Get latest and useful information about crypto.
💬 Trusted by the world’s largest crypto exchange.
👍 Discover real insights from verified creators.
Email / Phone number
Trending Topics
1
#NvidiaBeatsEstimatesWith$130BQ4Outlook
2,700 views
54 Discussing
2
#AnthropicIPOPriceCouldExceed$80
6,553 views
60 Discussing
3
#CanNvidia’sDataCenterGrowthContinue?
14,508 views
251 Discussing
4
#DBSAndCirclePartnerToExpandAsianInstitutionsUSDCAccess
590 views
11 Discussing
5
#LedgerHardwareImplantReportsExtendToDubai
1 views
3 Discussing
6
#NvidiaBoardNotConsideringHuang’sReturnasCEO
172,557 views
1,264 Discussing
7
#KOSPIFalls2.59%ToLowestCloseSinceFebruary
47,497 views
525 Discussing
8
#AnthropicClearedToListOnNasdaqAsANT
41,363 views
412 Discussing
9
#WhatInvestmentSignalsDo13FFilingsReveal?
92,444 views
817 Discussing
10
#TetherCapitalMakesStrategicInvestmentInStables
23,998 views
226 Discussing