
#akusdt
akusdt
216 views
2 Discussing
Hot
Latest

·
--
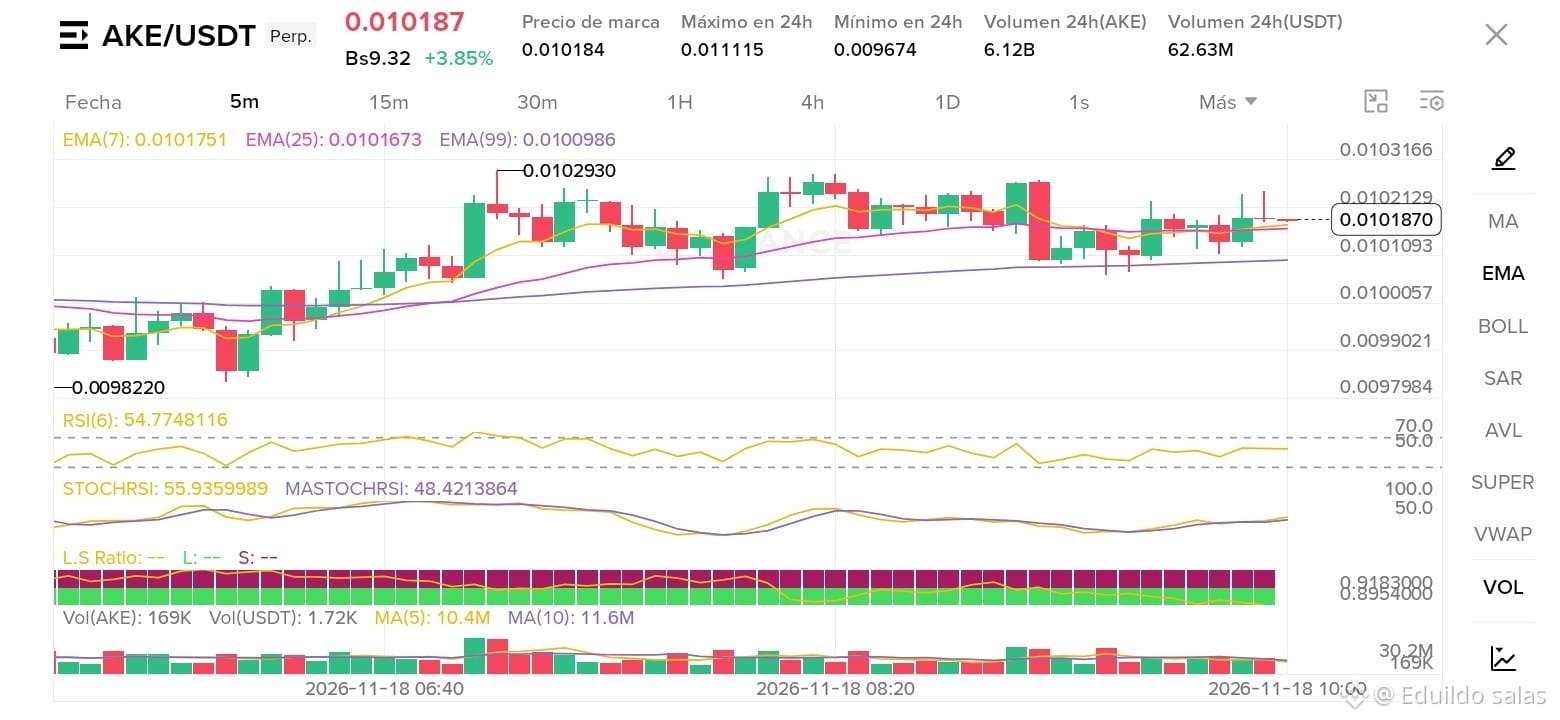
🚨Hello, Binance Square community! 🚀 Let’s analyze the $AKE /USDT chart in real time on the 5-minute timeframe to see where the price is heading and what we can expect in the short term.
📊 Real-Time Technical Analysis - AKE/USDT (5m)
Current Price: 0.010187 USDT (+3.85% over the past few hours).
24h Range: High of 0.011115 and low of 0.009674.
Exponential Moving Averages (EMA):
The EMA(7) is at 0.010175, very closely crossing the EMA(25) at 0.010167, while the EMA(99) acts as dynamic support lower down at 0.010098. The price is consolidating just above these lines after a previous attempt to push higher that reached 0.010293.
RSI (6): At 54.77, in a completely neutral zone with a slight bullish tilt. This indicates there’s room both for the rebound to continue and for a small sideways consolidation, without being overbought or oversold.
StochRSI: The lines are intertwined around 55.93 and 48.42, reflecting the market’s momentary indecision after the latest corrective red candle as it looks for the next volume catalyst.
Volume: Steady flow is visible, with 24h volume of 6.12B AKE / 62.63M USDT, showing interesting scalping activity while awaiting a clear range breakout.
💡 Outlook and Strategy
The price is respecting a local support zone above the moving averages. If buyers manage to break through the immediate resistance at 0.010213 - 0.010293 with bullish volume, we could see another test of the day’s high. Conversely, a rejection would keep the price moving sideways, looking for support at the EMA(99).
Are you trading this move long or short? Let me know in the comments and let’s plan the trade! 👇
#AKUSDT #BinanceSquare #CanNvidia’sDataCenterGrowthContinue? $NVDAB $MSFTB
🚨Hello, Binance Square community! 🚀 Let’s analyze the $AKE /USDT chart in real time on the 5-minute timeframe to see where the price is heading and what we can expect in the short term.
📊 Real-Time Technical Analysis - AKE/USDT (5m)
Current Price: 0.010187 USDT (+3.85% over the past few hours).
24h Range: High of 0.011115 and low of 0.009674.
Exponential Moving Averages (EMA):
The EMA(7) is at 0.010175, very closely crossing the EMA(25) at 0.010167, while the EMA(99) acts as dynamic support lower down at 0.010098. The price is consolidating just above these lines after a previous attempt to push higher that reached 0.010293.
RSI (6): At 54.77, in a completely neutral zone with a slight bullish tilt. This indicates there’s room both for the rebound to continue and for a small sideways consolidation, without being overbought or oversold.
StochRSI: The lines are intertwined around 55.93 and 48.42, reflecting the market’s momentary indecision after the latest corrective red candle as it looks for the next volume catalyst.
Volume: Steady flow is visible, with 24h volume of 6.12B AKE / 62.63M USDT, showing interesting scalping activity while awaiting a clear range breakout.
💡 Outlook and Strategy
The price is respecting a local support zone above the moving averages. If buyers manage to break through the immediate resistance at 0.010213 - 0.010293 with bullish volume, we could see another test of the day’s high. Conversely, a rejection would keep the price moving sideways, looking for support at the EMA(99).
Are you trading this move long or short? Let me know in the comments and let’s plan the trade! 👇
#AKUSDT #BinanceSquare #CanNvidia’sDataCenterGrowthContinue? $NVDAB $MSFTB
📊 Real-Time Technical Analysis - AKE/USDT (5m)
Current Price: 0.010187 USDT (+3.85% over the past few hours).
24h Range: High of 0.011115 and low of 0.009674.
Exponential Moving Averages (EMA):
The EMA(7) is at 0.010175, very closely crossing the EMA(25) at 0.010167, while the EMA(99) acts as dynamic support lower down at 0.010098. The price is consolidating just above these lines after a previous attempt to push higher that reached 0.010293.
RSI (6): At 54.77, in a completely neutral zone with a slight bullish tilt. This indicates there’s room both for the rebound to continue and for a small sideways consolidation, without being overbought or oversold.
StochRSI: The lines are intertwined around 55.93 and 48.42, reflecting the market’s momentary indecision after the latest corrective red candle as it looks for the next volume catalyst.
Volume: Steady flow is visible, with 24h volume of 6.12B AKE / 62.63M USDT, showing interesting scalping activity while awaiting a clear range breakout.
💡 Outlook and Strategy
The price is respecting a local support zone above the moving averages. If buyers manage to break through the immediate resistance at 0.010213 - 0.010293 with bullish volume, we could see another test of the day’s high. Conversely, a rejection would keep the price moving sideways, looking for support at the EMA(99).
Are you trading this move long or short? Let me know in the comments and let’s plan the trade! 👇
#AKUSDT #BinanceSquare #CanNvidia’sDataCenterGrowthContinue? $NVDAB $MSFTB
1
459
Log in to explore more content
Join global crypto users on Binance Square
⚡️ Get latest and useful information about crypto.
💬 Trusted by the world’s largest crypto exchange.
👍 Discover real insights from verified creators.
Email / Phone number
Trending Topics
1
#NvidiaLoses$2.7TrillionInMonthAndAHalf
29 views
7 Discussing
2
#CanBTCReboundAfterFallingBelow60K?
474,329 views
2,048 Discussing
3
#GlobalStocksFaceLongestLosingStreakSince2023
163,420 views
1,439 Discussing
4
#BlackRockIBITPostsRecord$541MSingleDayOutflow
7,166 views
44 Discussing
5
#AnthropicPlungesTowardIPOPriceonDay2
78,091 views
821 Discussing
6
#TwentyOneCapitalAdds172.25BTC
29,436 views
358 Discussing
7
#HKBillWouldExcludeTokenizedDepositsFromVirtualAssets
2,948 views
37 Discussing
8
#BNBDropsBelow540USDTWith8.46%DailyDecline
45,752 views
410 Discussing
9
#HKBillProposesHK$100KFineForUnauthorizedCryptoTitles
1,619 views
20 Discussing
10
#BitMineFaces$10.1BUnrealizedETHLoss
3,340 views
25 Discussing