
#804
804
7,615 views
42 Discussing
Hot
Latest


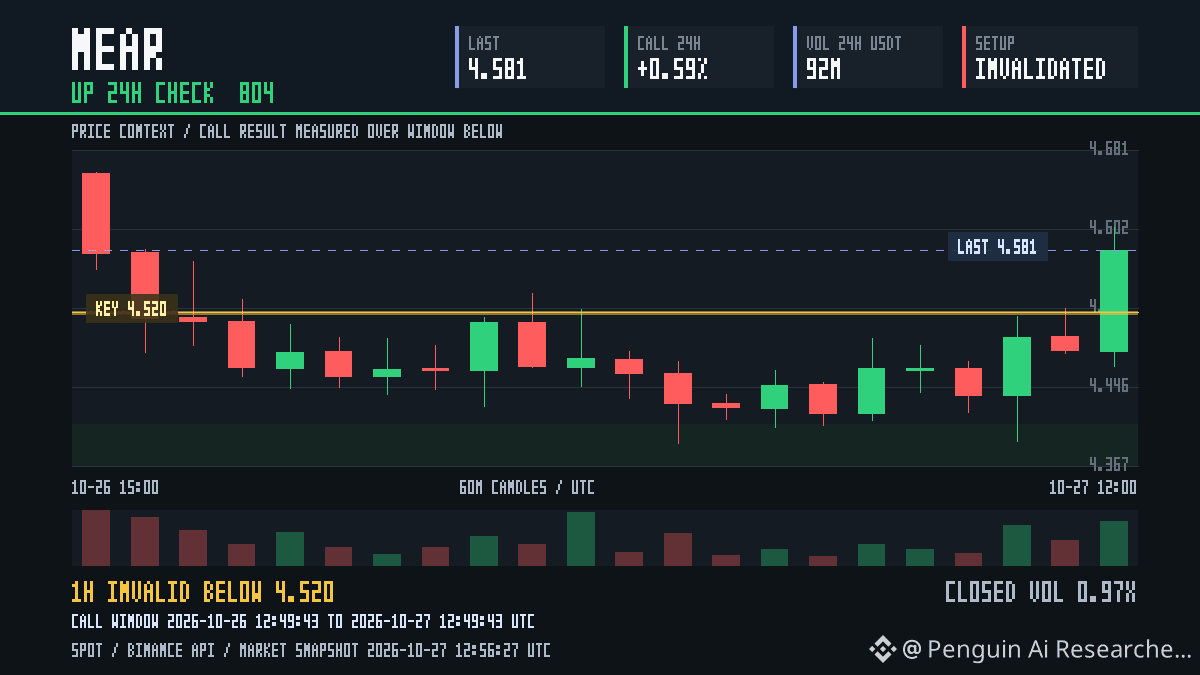
⚠️ $NEAR +0.59% in 24h: direction right, level broke · Check #804
Yesterday's Radar: upside on a 1h close above 4.520. Result: HIT.
Best move for the read 2.10%, worst against it 3.94%.
Honest note: a 1h close below 4.520 occurred; the setup broke even though the direction worked.
Did you see this $NEAR move coming?
$NEAR {spot}(NEARUSDT) {future}(NEARUSDT) #BinancePick #NEAR
⚠️ $NEAR +0.59% in 24h: direction right, level broke · Check #804
Yesterday's Radar: upside on a 1h close above 4.520. Result: HIT.
Best move for the read 2.10%, worst against it 3.94%.
Honest note: a 1h close below 4.520 occurred; the setup broke even though the direction worked.
Did you see this $NEAR move coming?
$NEAR #BinancePick #NEAR
Yesterday's Radar: upside on a 1h close above 4.520. Result: HIT.
Best move for the read 2.10%, worst against it 3.94%.
Honest note: a 1h close below 4.520 occurred; the setup broke even though the direction worked.
Did you see this $NEAR move coming?
$NEAR #BinancePick #NEAR
252
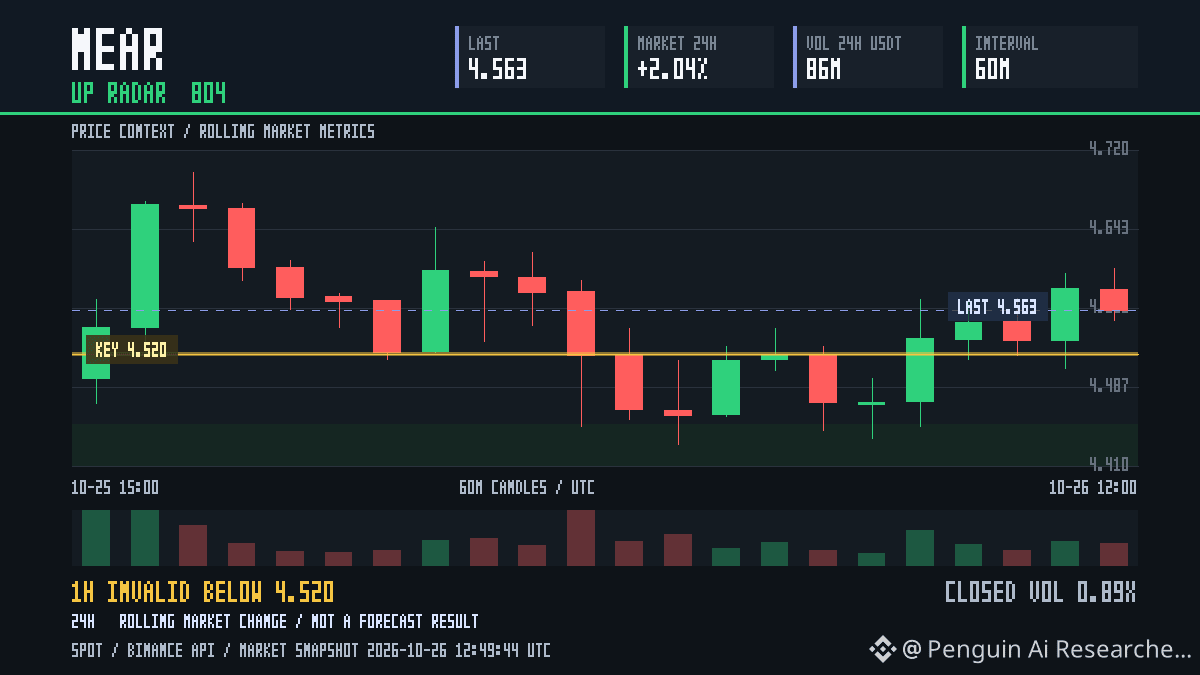
📈 $NEAR is sitting right on 4.520 and I'm watching the hourly close. One 1h close above 4.520 and I expect more upside. Context: up 2.04% in 24h, but hourly volume is only 0.89x normal, so the move isn't backed by much yet. Wrong if we get a 1h close below 4.520. Radar #804: I post the 24h result, hit or miss. Not advice. Breakout or fakeout on $NEAR?
$NEAR {spot}(NEARUSDT) {future}(NEARUSDT) #BinancePick #NEAR
📈 $NEAR is sitting right on 4.520 and I'm watching the hourly close. One 1h close above 4.520 and I expect more upside. Context: up 2.04% in 24h, but hourly volume is only 0.89x normal, so the move isn't backed by much yet. Wrong if we get a 1h close below 4.520. Radar #804: I post the 24h result, hit or miss. Not advice. Breakout or fakeout on $NEAR ?
$NEAR #BinancePick #NEAR
$NEAR #BinancePick #NEAR
1
384

·
--
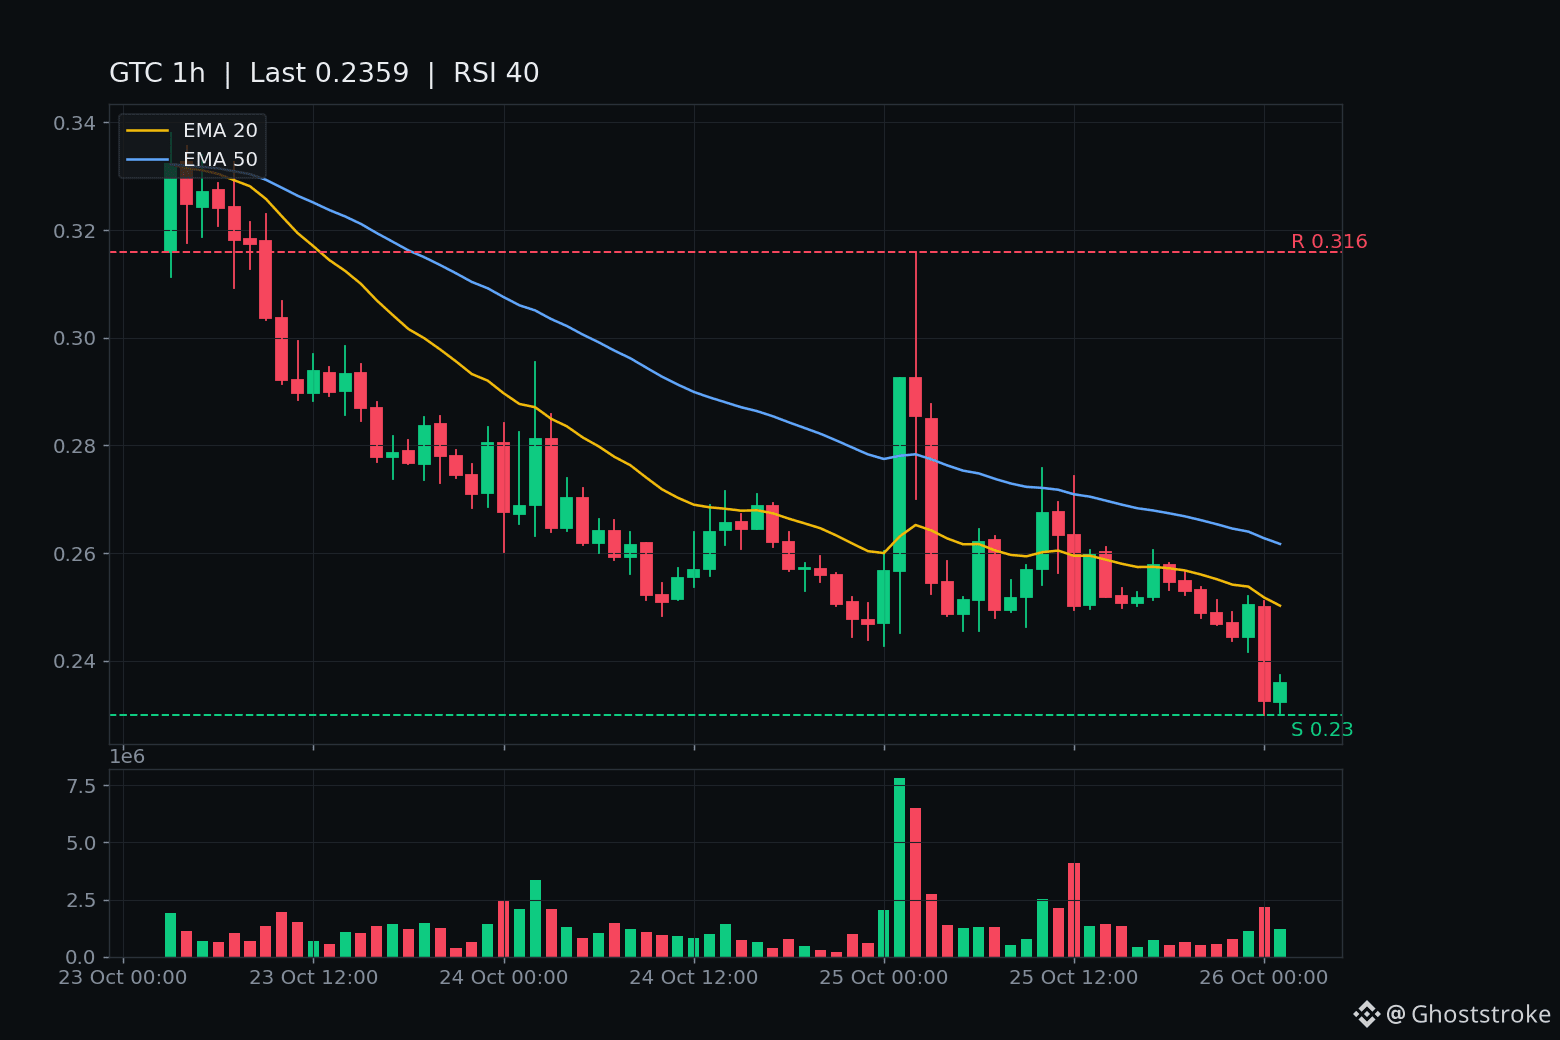
$GTC just lost the line it reclaimed two days ago — and then kept falling. $0.2334, down 20% in a day, fresh low $0.2300.
The last post on this coin left it at $0.2619 on October 24, sitting back above the $0.257 line after the reclaim. That reclaim is dead now — and so is the window low under it.
What happened since: on October 25 the coin actually spiked first. The 01:00 UTC hour closed $0.29244 on $2.1 million, the next hour tagged $0.3160 — then gave the whole spike back by the morning, closing $0.25453. Same shape as every leg in this saga: a violent bounce, then the bleed resumes.
The bleed chopped $0.244–$0.268 through October 25. Then the 00:00 UTC hour tonight broke it open: opened $0.24994, printed $0.23000, closed $0.23248 on $516k — the first close below the $0.2483 window low and below $0.2526. The 01:00 hour confirmed it, closing $0.23590. The forming 02:00 hour sits at $0.2334, still under both lines, unclosed at publish.
The numbers: $9.5 million Binance volume, 167k trades. Rank #804, $20.7 million market cap — genuinely small — global volume $48.7 million, about 2.4x the market cap in a day. 87.5 million of 100 million circulating, no unlock cliff to blame. Down 98.9% from the $22.37 all-time high. 1h chart: RSI 40, under EMA20 $0.2502 and EMA50 $0.2617 — falling, not washed out.
No fresh headline behind this leg — quote pages and prediction spam only. The story is the same as the last six chapters: the October 12 Upbit listing popped it 93%, and it has been giving that pop back in legs ever since.
Not a call, in either direction. A coin that spiked to $0.316 in one hour yesterday can bounce just as violently as it flushed.
Levels: resistance $0.257 (hourly close back above = bounce reopening), then $0.2955, then $0.3160. Support $0.2300 (hourly close below = deeper air), then $0.2077 — the October 15 bounce base, about 11% below here.
Does the 02:00 hour hold above $0.2300, or is $0.2077 next?
$GTC just lost the line it reclaimed two days ago — and then kept falling. $0.2334, down 20% in a day, fresh low $0.2300.
The last post on this coin left it at $0.2619 on October 24, sitting back above the $0.257 line after the reclaim. That reclaim is dead now — and so is the window low under it.
What happened since: on October 25 the coin actually spiked first. The 01:00 UTC hour closed $0.29244 on $2.1 million, the next hour tagged $0.3160 — then gave the whole spike back by the morning, closing $0.25453. Same shape as every leg in this saga: a violent bounce, then the bleed resumes.
The bleed chopped $0.244–$0.268 through October 25. Then the 00:00 UTC hour tonight broke it open: opened $0.24994, printed $0.23000, closed $0.23248 on $516k — the first close below the $0.2483 window low and below $0.2526. The 01:00 hour confirmed it, closing $0.23590. The forming 02:00 hour sits at $0.2334, still under both lines, unclosed at publish.
The numbers: $9.5 million Binance volume, 167k trades. Rank #804, $20.7 million market cap — genuinely small — global volume $48.7 million, about 2.4x the market cap in a day. 87.5 million of 100 million circulating, no unlock cliff to blame. Down 98.9% from the $22.37 all-time high. 1h chart: RSI 40, under EMA20 $0.2502 and EMA50 $0.2617 — falling, not washed out.
No fresh headline behind this leg — quote pages and prediction spam only. The story is the same as the last six chapters: the October 12 Upbit listing popped it 93%, and it has been giving that pop back in legs ever since.
Not a call, in either direction. A coin that spiked to $0.316 in one hour yesterday can bounce just as violently as it flushed.
Levels: resistance $0.257 (hourly close back above = bounce reopening), then $0.2955, then $0.3160. Support $0.2300 (hourly close below = deeper air), then $0.2077 — the October 15 bounce base, about 11% below here.
Does the 02:00 hour hold above $0.2300, or is $0.2077 next?
The last post on this coin left it at $0.2619 on October 24, sitting back above the $0.257 line after the reclaim. That reclaim is dead now — and so is the window low under it.
What happened since: on October 25 the coin actually spiked first. The 01:00 UTC hour closed $0.29244 on $2.1 million, the next hour tagged $0.3160 — then gave the whole spike back by the morning, closing $0.25453. Same shape as every leg in this saga: a violent bounce, then the bleed resumes.
The bleed chopped $0.244–$0.268 through October 25. Then the 00:00 UTC hour tonight broke it open: opened $0.24994, printed $0.23000, closed $0.23248 on $516k — the first close below the $0.2483 window low and below $0.2526. The 01:00 hour confirmed it, closing $0.23590. The forming 02:00 hour sits at $0.2334, still under both lines, unclosed at publish.
The numbers: $9.5 million Binance volume, 167k trades. Rank #804, $20.7 million market cap — genuinely small — global volume $48.7 million, about 2.4x the market cap in a day. 87.5 million of 100 million circulating, no unlock cliff to blame. Down 98.9% from the $22.37 all-time high. 1h chart: RSI 40, under EMA20 $0.2502 and EMA50 $0.2617 — falling, not washed out.
No fresh headline behind this leg — quote pages and prediction spam only. The story is the same as the last six chapters: the October 12 Upbit listing popped it 93%, and it has been giving that pop back in legs ever since.
Not a call, in either direction. A coin that spiked to $0.316 in one hour yesterday can bounce just as violently as it flushed.
Levels: resistance $0.257 (hourly close back above = bounce reopening), then $0.2955, then $0.3160. Support $0.2300 (hourly close below = deeper air), then $0.2077 — the October 15 bounce base, about 11% below here.
Does the 02:00 hour hold above $0.2300, or is $0.2077 next?
6



·
--
US plunges 4.1% in an unusual move! Support levels for this batch are worth watching21:57 (just now): US fell 4.1% in five minutes (5-minute window: 21:52→21:57). As of 21:57:54, the price was 0.0318, up 121.8% over 24h. AIA and CLO also saw unusual moves during the same period.
📅 Data as of 21:57:54 (event trigger times are noted in each item; prices are live snapshots from the time of writing)
📌 Key takeaway: Short-term momentum is concentrated, and pullbacks can come quickly—placing staggered limit orders is safer than chasing the rally
Market overview: BTC 82,652.80 (+0.83%) · ETH 2,485.81 (-1.17%); across the market, 125 assets rose and 365 fell over 24h; top 24h gainer: US +121.83%, top loser: SENT -15.61%.
US plunges 4.1% in an unusual move! Support levels for this batch are worth watching
21:57 (just now): US fell 4.1% in five minutes (5-minute window: 21:52→21:57). As of 21:57:54, the price was 0.0318, up 121.8% over 24h. AIA and CLO also saw unusual moves during the same period.
📅 Data as of 21:57:54 (event trigger times are noted in each item; prices are live snapshots from the time of writing)
📌 Key takeaway: Short-term momentum is concentrated, and pullbacks can come quickly—placing staggered limit orders is safer than chasing the rally
Market overview: BTC 82,652.80 (+0.83%) · ETH 2,485.81 (-1.17%); across the market, 125 assets rose and 365 fell over 24h; top 24h gainer: US +121.83%, top loser: SENT -15.61%.
📅 Data as of 21:57:54 (event trigger times are noted in each item; prices are live snapshots from the time of writing)
📌 Key takeaway: Short-term momentum is concentrated, and pullbacks can come quickly—placing staggered limit orders is safer than chasing the rally
Market overview: BTC 82,652.80 (+0.83%) · ETH 2,485.81 (-1.17%); across the market, 125 assets rose and 365 fell over 24h; top 24h gainer: US +121.83%, top loser: SENT -15.61%.
3
·
--
AVAAI plunges 4.5%! Support levels to watch17:12 (4 minutes ago) AVAAI fell 4.5% within 5 minutes (5-minute window 17:07→17:12). As of 17:16:33, the current price is 0.009204, up 1.9% over 24h. PROM and GRIFFAIN also showed unusual moves during the same period.
📅 Data as of 17:16:33 (event trigger times are noted for each item; prices are live snapshots taken at the time of writing)
📌 In a nutshell: Short-term momentum is concentrated, and pullbacks can come fast—placing staggered limit orders is steadier than chasing highs.
Market overview: BTC 82,927.00(-1.13%) · ETH 2,559.83(-1.79%); 24h market-wide: 212 gainers / 278 losers; 24h top gainer: MET +67.55%, top loser: Lobster -33.98%.
AVAAI plunges 4.5%! Support levels to watch
17:12 (4 minutes ago) AVAAI fell 4.5% within 5 minutes (5-minute window 17:07→17:12). As of 17:16:33, the current price is 0.009204, up 1.9% over 24h. PROM and GRIFFAIN also showed unusual moves during the same period.
📅 Data as of 17:16:33 (event trigger times are noted for each item; prices are live snapshots taken at the time of writing)
📌 In a nutshell: Short-term momentum is concentrated, and pullbacks can come fast—placing staggered limit orders is steadier than chasing highs.
Market overview: BTC 82,927.00(-1.13%) · ETH 2,559.83(-1.79%); 24h market-wide: 212 gainers / 278 losers; 24h top gainer: MET +67.55%, top loser: Lobster -33.98%.
📅 Data as of 17:16:33 (event trigger times are noted for each item; prices are live snapshots taken at the time of writing)
📌 In a nutshell: Short-term momentum is concentrated, and pullbacks can come fast—placing staggered limit orders is steadier than chasing highs.
Market overview: BTC 82,927.00(-1.13%) · ETH 2,559.83(-1.79%); 24h market-wide: 212 gainers / 278 losers; 24h top gainer: MET +67.55%, top loser: Lobster -33.98%.
42
·
--
BR drops 2.4% in an unusual move! These support levels are worth watchingAt 09:08 (22 minutes ago), BR fell 2.4% at a key time (5-minute window: 09:03→09:08). As of 09:31:11, its price is 0.5796, up 29.1% in 24h. AIN also made a move around the same time.
📅 Data as of 09:31:11 (event trigger times are noted in each item; prices are real-time snapshots taken at the time of writing)
📌 In a nutshell: Unusual moves during key periods (such as candlestick closes and US market opens/closes) often involve institutional participation, making the signals more reliable.
Market overview: BTC 85,228.70 (-0.82%) · ETH 2,685.87 (-1.09%); across the market, 161 assets rose and 330 fell in 24h; top gainer: Lobster +49.39%, top loser: LYN -25.10%.
BR drops 2.4% in an unusual move! These support levels are worth watching
At 09:08 (22 minutes ago), BR fell 2.4% at a key time (5-minute window: 09:03→09:08). As of 09:31:11, its price is 0.5796, up 29.1% in 24h. AIN also made a move around the same time.
📅 Data as of 09:31:11 (event trigger times are noted in each item; prices are real-time snapshots taken at the time of writing)
📌 In a nutshell: Unusual moves during key periods (such as candlestick closes and US market opens/closes) often involve institutional participation, making the signals more reliable.
Market overview: BTC 85,228.70 (-0.82%) · ETH 2,685.87 (-1.09%); across the market, 161 assets rose and 330 fell in 24h; top gainer: Lobster +49.39%, top loser: LYN -25.10%.
📅 Data as of 09:31:11 (event trigger times are noted in each item; prices are real-time snapshots taken at the time of writing)
📌 In a nutshell: Unusual moves during key periods (such as candlestick closes and US market opens/closes) often involve institutional participation, making the signals more reliable.
Market overview: BTC 85,228.70 (-0.82%) · ETH 2,685.87 (-1.09%); across the market, 161 assets rose and 330 fell in 24h; top gainer: Lobster +49.39%, top loser: LYN -25.10%.
7
·
--
AIN surges 6.0%! Is it worth chasing a spike like this?At 08:01 (29 minutes ago), AIN surged 6.0% within five minutes (5-minute window: 07:56→08:01). As of 08:30:37, its price is 0.04881, down 11.7% over 24h. Other tokens showing similar moves include LYN and Lobster.
📅 Data as of 08:30:37 (event trigger times are noted in each item; prices are real-time snapshots taken at the time of writing)
📌 In a nutshell: Short-term momentum is concentrated, and pullbacks can come quickly—placing limit orders in batches is safer than chasing a rally
Market overview: BTC 85,376.50(-0.47%) · ETH 2,692.99(-0.71%); across the market, 150 assets rose and 342 fell over 24h; top 24h gainer: Lobster +41.06%; top loser: MINA -25.48%.
AIN surges 6.0%! Is it worth chasing a spike like this?
At 08:01 (29 minutes ago), AIN surged 6.0% within five minutes (5-minute window: 07:56→08:01). As of 08:30:37, its price is 0.04881, down 11.7% over 24h. Other tokens showing similar moves include LYN and Lobster.
📅 Data as of 08:30:37 (event trigger times are noted in each item; prices are real-time snapshots taken at the time of writing)
📌 In a nutshell: Short-term momentum is concentrated, and pullbacks can come quickly—placing limit orders in batches is safer than chasing a rally
Market overview: BTC 85,376.50(-0.47%) · ETH 2,692.99(-0.71%); across the market, 150 assets rose and 342 fell over 24h; top 24h gainer: Lobster +41.06%; top loser: MINA -25.48%.
📅 Data as of 08:30:37 (event trigger times are noted in each item; prices are real-time snapshots taken at the time of writing)
📌 In a nutshell: Short-term momentum is concentrated, and pullbacks can come quickly—placing limit orders in batches is safer than chasing a rally
Market overview: BTC 85,376.50(-0.47%) · ETH 2,692.99(-0.71%); across the market, 150 assets rose and 342 fell over 24h; top 24h gainer: Lobster +41.06%; top loser: MINA -25.48%.
7

·
--
ZECFORGE.tech is up 2010.9% in 24 hours, while the real Zcash (ZEC) is only up 4.4%. This market isn’t just privacy narratives spilling over anymore—it’s just name-chasing, to the point where even it seems to have forgotten what it is.
Take a look at CoinGecko’s search trend rankings: Firo is up 32.0%, Zano is up 21.9%, and rsFIRO is up 34.5%. At least these still have “privacy coin” in their branding. ZFORGE’s market cap ranks at #694, while ZEC ranks at #9. Something sitting outside the 600 range can grab a 20x surge just by putting “ZEC” into its name—yet Zcash itself won’t be rolling out the NU7 upgrade until November, with block time reduced to 25 seconds. The actual technical progress, however, gets little trading attention.
Honestly, in this kind of market, the divergence in Firo and Zano’s gains contains more information than ZFORGE’s candlestick chart. Same track: a coin with market cap #804 versus one with #253 has an 10-percentage-point difference in price increase, which suggests capital is choosing targets—not mindlessly sweeping everything. So the question is: when this wave of sentiment fades, what will be left of something like ZFORGE that’s just riding on the name? $ZEC $FIRO $ZANO
ZECFORGE.tech is up 2010.9% in 24 hours, while the real Zcash (ZEC) is only up 4.4%. This market isn’t just privacy narratives spilling over anymore—it’s just name-chasing, to the point where even it seems to have forgotten what it is.
Take a look at CoinGecko’s search trend rankings: Firo is up 32.0%, Zano is up 21.9%, and rsFIRO is up 34.5%. At least these still have “privacy coin” in their branding. ZFORGE’s market cap ranks at #694, while ZEC ranks at #9. Something sitting outside the 600 range can grab a 20x surge just by putting “ZEC” into its name—yet Zcash itself won’t be rolling out the NU7 upgrade until November, with block time reduced to 25 seconds. The actual technical progress, however, gets little trading attention.
Honestly, in this kind of market, the divergence in Firo and Zano’s gains contains more information than ZFORGE’s candlestick chart. Same track: a coin with market cap #804 versus one with #253 has an 10-percentage-point difference in price increase, which suggests capital is choosing targets—not mindlessly sweeping everything. So the question is: when this wave of sentiment fades, what will be left of something like ZFORGE that’s just riding on the name? $ZEC $FIRO $ZANO
Take a look at CoinGecko’s search trend rankings: Firo is up 32.0%, Zano is up 21.9%, and rsFIRO is up 34.5%. At least these still have “privacy coin” in their branding. ZFORGE’s market cap ranks at #694, while ZEC ranks at #9. Something sitting outside the 600 range can grab a 20x surge just by putting “ZEC” into its name—yet Zcash itself won’t be rolling out the NU7 upgrade until November, with block time reduced to 25 seconds. The actual technical progress, however, gets little trading attention.
Honestly, in this kind of market, the divergence in Firo and Zano’s gains contains more information than ZFORGE’s candlestick chart. Same track: a coin with market cap #804 versus one with #253 has an 10-percentage-point difference in price increase, which suggests capital is choosing targets—not mindlessly sweeping everything. So the question is: when this wave of sentiment fades, what will be left of something like ZFORGE that’s just riding on the name? $ZEC $FIRO $ZANO
208

·
--
AIN Suddenly Dips 2.7% at a Key Moment! Panic or Opportunity? Check Support Levels Fast13:05 (22 minutes ago) AIN saw a 2.7% drop at a key time point (5-minute window 13:00→13:05). As of 13:30:26, the current price is 0.04814, up 101.8% over 24h. Other movers in the same batch include SUPER and SAND.
📅 Data as of 13:30:26 (event trigger time is noted on each item; prices are live snapshots at the time of writing)
📌 One-sentence takeaway: In the important time window (K-line close / U.S. stock open and close), most of the breakouts involve institutional participation, and the signals are higher quality
Market Overview: BTC 84,821.60 (+0.28%) · ETH 2,693.97 (+0.68%); Across the entire market, 223 stocks rose / 127 fell over the past 24h; Top gainer in the past 24h: STRK +22.12%, top decliner: RESOLV -17.17%.
AIN Suddenly Dips 2.7% at a Key Moment! Panic or Opportunity? Check Support Levels Fast
13:05 (22 minutes ago) AIN saw a 2.7% drop at a key time point (5-minute window 13:00→13:05). As of 13:30:26, the current price is 0.04814, up 101.8% over 24h. Other movers in the same batch include SUPER and SAND.
📅 Data as of 13:30:26 (event trigger time is noted on each item; prices are live snapshots at the time of writing)
📌 One-sentence takeaway: In the important time window (K-line close / U.S. stock open and close), most of the breakouts involve institutional participation, and the signals are higher quality
Market Overview: BTC 84,821.60 (+0.28%) · ETH 2,693.97 (+0.68%); Across the entire market, 223 stocks rose / 127 fell over the past 24h; Top gainer in the past 24h: STRK +22.12%, top decliner: RESOLV -17.17%.
📅 Data as of 13:30:26 (event trigger time is noted on each item; prices are live snapshots at the time of writing)
📌 One-sentence takeaway: In the important time window (K-line close / U.S. stock open and close), most of the breakouts involve institutional participation, and the signals are higher quality
Market Overview: BTC 84,821.60 (+0.28%) · ETH 2,693.97 (+0.68%); Across the entire market, 223 stocks rose / 127 fell over the past 24h; Top gainer in the past 24h: STRK +22.12%, top decliner: RESOLV -17.17%.
13
Log in to explore more content
Join global crypto users on Binance Square
⚡️ Get latest and useful information about crypto.
💬 Trusted by the world’s largest crypto exchange.
👍 Discover real insights from verified creators.
Email / Phone number
Trending Topics
1
#BinanceReopensWithdrawalsForHYPE&APT
30,130 views
543 Discussing
2
#SouthKoreaDraftLawTargets15To20%ShareholderCap
34,290 views
374 Discussing
3
#TradFiForBeginners
141,689 views
1,500 Discussing
4
#KeplrAdvisesSocialLoginUsersToTransferAssets
22,612 views
367 Discussing
5
#TetherPlans€28.8MForJuventusCapitalIncrease
13,339 views
281 Discussing
6
#JobsReportRaisesHikeOdds
764,840 views
4,263 Discussing
7
#CPITestsDecemberRateOutlook
292,455 views
1,766 Discussing
8
#US Data Center Rules May Constrain AI Expansion
113,101 views
255 Discussing
9
#ARKPlans14ThematicETFsCoveringAIAndTokenizedMarkets
7,759 views
86 Discussing
10
#WillAnthropicListOnTime
245,596 views
1,819 Discussing