
#618
618
89 views
15 Discussing
Hot
Latest

·
--
BNB Node Health Check Proposal | Slow RPCs May Be Added to Alerts | I’m Only Watching for Confirmation Around $691
My view is to put infrastructure improvements on the watchlist, not chase BNB higher because of a code PR. In BNB Chain’s official reth-bsc repository, PR #618 proposes adding optional RPC latency sampling to eth_health. The existing logic mainly checks whether a node can read the canonical chain head, so it may still report healthy even when API requests are taking several seconds. The proposal plans to monitor the latency of completed requests when metrics are enabled, and return unhealthy when the 75th percentile reaches 5 seconds. The developer demonstrated tests with concurrent slow requests locally, as well as recovery results. The page is still Open and awaiting code-owner review; this cannot be described as a new feature already deployed on BSC mainnet.
This detail has practical value for on-chain traders. Market data pages, wallets, liquidation bots, and exchange nodes rely on RPCs to read balances, gas, and transaction status. If a node is online but slow to respond, users may see stale data, submit duplicate transactions, or miss a time window. Detecting slow nodes earlier can help operators switch services and investigate load issues. However, the PR is also explicit that without metrics enabled, the old behavior remains; requests that have not completed and chain sync lag are outside the scope of this check, and no complete benchmark of the performance overhead after enabling it has been provided. This is a pending observability change under review, not a consensus upgrade, and certainly does not mean the mainnet is currently experiencing an outage.
The price impact on BNB should therefore be interpreted cautiously. More reliable node services can reduce friction for applications over the long term, but it is difficult to translate that directly into how much BNB to buy today. BNB is also influenced by confidence recovering after security incidents at the Binance exchange, overall risk appetite, and activity on BSC. Binance’s eighth withdrawal resumption announcement said that more withdrawals would be gradually reopened after checks on each “network–asset” combination; it did not say that all assets would resume at once. The restoration of platform services and the BSC node PR are also separate matters. When assessing ecosystem risks, I would verify exchange announcements, normal on-chain block production, RPC availability, and token prices separately, rather than dressing up one health-check proposal as evidence that the platform has fully recovered.
At the time of writing, the last Kraken BNB/USD trade was around $691.66. The session opened at $688.89, with an intraday low of $688.89 and a high of $695.05; over the past 24 hours, the low was $683 and the high was $719.70. The price has edged up from the daily open but remains below the previous day’s upper range, suggesting the technical proposal has not created a clear, independent pricing catalyst. For now, I’m watching the $688–$683 support zone, $700 as a recovery level, and $719–$720 as overhead resistance. If the price breaks below $683 and cannot close back above it on the hourly chart, the short-term stabilization thesis is invalidated. If the PR is merged and adopted by actual operators after release in an official version, and the price holds above $700, I’ll reassess how much weight to give the improvement.
If I were trading this myself: I would stay out for now. The only direction I’d consider is a small, unleveraged spot long, with 0% of total capital allocated. Only if an hourly candle closes above $700, a pullback holds at $695–$700, and there are no new irregularities with Binance-related deposits or withdrawals, would I use at most 1% of total capital to test the trade. The first target is $710; I’d take half off there. The second target is $720; I’d close the remaining position there. If, after entry, the hourly close falls back below $690, I’d reduce the position by half; below $683, I’d exit the entire position at a loss. If $683 breaks before entry, I’d cancel the plan. Until the PR is merged and the price confirms, I won’t turn observation into a position.
Sources: BNB Chain’s official reth-bsc PR #618, Binance’s eighth withdrawal resumption announcement, and Kraken BNB/USD market data.
#BNB
This is solely my personal market observation and does not constitute investment advice.
BNB Node Health Check Proposal | Slow RPCs May Be Added to Alerts | I’m Only Watching for Confirmation Around $691
My view is to put infrastructure improvements on the watchlist, not chase BNB higher because of a code PR. In BNB Chain’s official reth-bsc repository, PR #618 proposes adding optional RPC latency sampling to eth_health. The existing logic mainly checks whether a node can read the canonical chain head, so it may still report healthy even when API requests are taking several seconds. The proposal plans to monitor the latency of completed requests when metrics are enabled, and return unhealthy when the 75th percentile reaches 5 seconds. The developer demonstrated tests with concurrent slow requests locally, as well as recovery results. The page is still Open and awaiting code-owner review; this cannot be described as a new feature already deployed on BSC mainnet.
This detail has practical value for on-chain traders. Market data pages, wallets, liquidation bots, and exchange nodes rely on RPCs to read balances, gas, and transaction status. If a node is online but slow to respond, users may see stale data, submit duplicate transactions, or miss a time window. Detecting slow nodes earlier can help operators switch services and investigate load issues. However, the PR is also explicit that without metrics enabled, the old behavior remains; requests that have not completed and chain sync lag are outside the scope of this check, and no complete benchmark of the performance overhead after enabling it has been provided. This is a pending observability change under review, not a consensus upgrade, and certainly does not mean the mainnet is currently experiencing an outage.
The price impact on BNB should therefore be interpreted cautiously. More reliable node services can reduce friction for applications over the long term, but it is difficult to translate that directly into how much BNB to buy today. BNB is also influenced by confidence recovering after security incidents at the Binance exchange, overall risk appetite, and activity on BSC. Binance’s eighth withdrawal resumption announcement said that more withdrawals would be gradually reopened after checks on each “network–asset” combination; it did not say that all assets would resume at once. The restoration of platform services and the BSC node PR are also separate matters. When assessing ecosystem risks, I would verify exchange announcements, normal on-chain block production, RPC availability, and token prices separately, rather than dressing up one health-check proposal as evidence that the platform has fully recovered.
At the time of writing, the last Kraken BNB/USD trade was around $691.66. The session opened at $688.89, with an intraday low of $688.89 and a high of $695.05; over the past 24 hours, the low was $683 and the high was $719.70. The price has edged up from the daily open but remains below the previous day’s upper range, suggesting the technical proposal has not created a clear, independent pricing catalyst. For now, I’m watching the $688–$683 support zone, $700 as a recovery level, and $719–$720 as overhead resistance. If the price breaks below $683 and cannot close back above it on the hourly chart, the short-term stabilization thesis is invalidated. If the PR is merged and adopted by actual operators after release in an official version, and the price holds above $700, I’ll reassess how much weight to give the improvement.
If I were trading this myself: I would stay out for now. The only direction I’d consider is a small, unleveraged spot long, with 0% of total capital allocated. Only if an hourly candle closes above $700, a pullback holds at $695–$700, and there are no new irregularities with Binance-related deposits or withdrawals, would I use at most 1% of total capital to test the trade. The first target is $710; I’d take half off there. The second target is $720; I’d close the remaining position there. If, after entry, the hourly close falls back below $690, I’d reduce the position by half; below $683, I’d exit the entire position at a loss. If $683 breaks before entry, I’d cancel the plan. Until the PR is merged and the price confirms, I won’t turn observation into a position.
Sources: BNB Chain’s official reth-bsc PR #618, Binance’s eighth withdrawal resumption announcement, and Kraken BNB/USD market data.
#BNB
This is solely my personal market observation and does not constitute investment advice.
My view is to put infrastructure improvements on the watchlist, not chase BNB higher because of a code PR. In BNB Chain’s official reth-bsc repository, PR #618 proposes adding optional RPC latency sampling to eth_health. The existing logic mainly checks whether a node can read the canonical chain head, so it may still report healthy even when API requests are taking several seconds. The proposal plans to monitor the latency of completed requests when metrics are enabled, and return unhealthy when the 75th percentile reaches 5 seconds. The developer demonstrated tests with concurrent slow requests locally, as well as recovery results. The page is still Open and awaiting code-owner review; this cannot be described as a new feature already deployed on BSC mainnet.
This detail has practical value for on-chain traders. Market data pages, wallets, liquidation bots, and exchange nodes rely on RPCs to read balances, gas, and transaction status. If a node is online but slow to respond, users may see stale data, submit duplicate transactions, or miss a time window. Detecting slow nodes earlier can help operators switch services and investigate load issues. However, the PR is also explicit that without metrics enabled, the old behavior remains; requests that have not completed and chain sync lag are outside the scope of this check, and no complete benchmark of the performance overhead after enabling it has been provided. This is a pending observability change under review, not a consensus upgrade, and certainly does not mean the mainnet is currently experiencing an outage.
The price impact on BNB should therefore be interpreted cautiously. More reliable node services can reduce friction for applications over the long term, but it is difficult to translate that directly into how much BNB to buy today. BNB is also influenced by confidence recovering after security incidents at the Binance exchange, overall risk appetite, and activity on BSC. Binance’s eighth withdrawal resumption announcement said that more withdrawals would be gradually reopened after checks on each “network–asset” combination; it did not say that all assets would resume at once. The restoration of platform services and the BSC node PR are also separate matters. When assessing ecosystem risks, I would verify exchange announcements, normal on-chain block production, RPC availability, and token prices separately, rather than dressing up one health-check proposal as evidence that the platform has fully recovered.
At the time of writing, the last Kraken BNB/USD trade was around $691.66. The session opened at $688.89, with an intraday low of $688.89 and a high of $695.05; over the past 24 hours, the low was $683 and the high was $719.70. The price has edged up from the daily open but remains below the previous day’s upper range, suggesting the technical proposal has not created a clear, independent pricing catalyst. For now, I’m watching the $688–$683 support zone, $700 as a recovery level, and $719–$720 as overhead resistance. If the price breaks below $683 and cannot close back above it on the hourly chart, the short-term stabilization thesis is invalidated. If the PR is merged and adopted by actual operators after release in an official version, and the price holds above $700, I’ll reassess how much weight to give the improvement.
If I were trading this myself: I would stay out for now. The only direction I’d consider is a small, unleveraged spot long, with 0% of total capital allocated. Only if an hourly candle closes above $700, a pullback holds at $695–$700, and there are no new irregularities with Binance-related deposits or withdrawals, would I use at most 1% of total capital to test the trade. The first target is $710; I’d take half off there. The second target is $720; I’d close the remaining position there. If, after entry, the hourly close falls back below $690, I’d reduce the position by half; below $683, I’d exit the entire position at a loss. If $683 breaks before entry, I’d cancel the plan. Until the PR is merged and the price confirms, I won’t turn observation into a position.
Sources: BNB Chain’s official reth-bsc PR #618, Binance’s eighth withdrawal resumption announcement, and Kraken BNB/USD market data.
#BNB
This is solely my personal market observation and does not constitute investment advice.


·
--
The $0.0675 line had a funeral this morning. Then a resurrection. Then another funeral.
$POWR, closed candles only: 09:00 UTC printed $0.0685 on $349.8k — first close back above the $0.0675 first-crack line. 10:00 UTC confirmed it at $0.0693. The crack was healed.
Then 11:00 UTC closed $0.0670. Back under. And the afternoon just kept bleeding: $0.0646 → $0.0617 → $0.0603 → $0.0581 → $0.0579. Six straight lower closes, -16% from the morning's confirmation, -20% off the $0.0730 day high.
It's $0.0582 now, parked right on top of the $0.0566 leg base. One closed hour under that and the whole Nov-1 leg ($0.0566 → $0.0730) round-trips.
The honest other side: the bleed bars ran $143–161k, but the last two hours printed $26k and $17k. Selling is drying up at the lows. That's either exhaustion — or the quiet before the base breaks.
No fresh headline on this one. Pure flow, same as the ignition.
Levels: $0.0675 above (hourly close back there = heal re-attempted), $0.0566 the base (closed hour below = full give-back), $0.0555 the window low (below that = deeper air).
Rank #618, $33.6M. This is the microcap lane — legs hand back in hours, not days. Not a call. Just the tape.
Does $0.0566 hold on first touch, or does the ignition leg round-trip by morning?
The $0.0675 line had a funeral this morning. Then a resurrection. Then another funeral.
$POWR , closed candles only: 09:00 UTC printed $0.0685 on $349.8k — first close back above the $0.0675 first-crack line. 10:00 UTC confirmed it at $0.0693. The crack was healed.
Then 11:00 UTC closed $0.0670. Back under. And the afternoon just kept bleeding: $0.0646 → $0.0617 → $0.0603 → $0.0581 → $0.0579. Six straight lower closes, -16% from the morning's confirmation, -20% off the $0.0730 day high.
It's $0.0582 now, parked right on top of the $0.0566 leg base. One closed hour under that and the whole Nov-1 leg ($0.0566 → $0.0730) round-trips.
The honest other side: the bleed bars ran $143–161k, but the last two hours printed $26k and $17k. Selling is drying up at the lows. That's either exhaustion — or the quiet before the base breaks.
No fresh headline on this one. Pure flow, same as the ignition.
Levels: $0.0675 above (hourly close back there = heal re-attempted), $0.0566 the base (closed hour below = full give-back), $0.0555 the window low (below that = deeper air).
Rank #618, $33.6M. This is the microcap lane — legs hand back in hours, not days. Not a call. Just the tape.
Does $0.0566 hold on first touch, or does the ignition leg round-trip by morning?
$POWR , closed candles only: 09:00 UTC printed $0.0685 on $349.8k — first close back above the $0.0675 first-crack line. 10:00 UTC confirmed it at $0.0693. The crack was healed.
Then 11:00 UTC closed $0.0670. Back under. And the afternoon just kept bleeding: $0.0646 → $0.0617 → $0.0603 → $0.0581 → $0.0579. Six straight lower closes, -16% from the morning's confirmation, -20% off the $0.0730 day high.
It's $0.0582 now, parked right on top of the $0.0566 leg base. One closed hour under that and the whole Nov-1 leg ($0.0566 → $0.0730) round-trips.
The honest other side: the bleed bars ran $143–161k, but the last two hours printed $26k and $17k. Selling is drying up at the lows. That's either exhaustion — or the quiet before the base breaks.
No fresh headline on this one. Pure flow, same as the ignition.
Levels: $0.0675 above (hourly close back there = heal re-attempted), $0.0566 the base (closed hour below = full give-back), $0.0555 the window low (below that = deeper air).
Rank #618, $33.6M. This is the microcap lane — legs hand back in hours, not days. Not a call. Just the tape.
Does $0.0566 hold on first touch, or does the ignition leg round-trip by morning?
4
·
--
$INIT just gave the leg back — $0.15095 closed under $0.15544, and the reopen from the last post lasted less than a day.
The last post left the leg reopened: four straight closes above $0.15544, $0.15677 up to $0.15998. It never closed above the $0.1680 ceiling — 18:00 closed $0.16524, then the bleed: $0.16400, $0.16010, $0.15736. Then 22:00 closed $0.15414, the first hour back under the line, and 23:00 closed $0.15095, lower again. The forming hour is $0.1508, still below, unclosed — not claimed as a further break.
Live $0.1508, -5.5% in 24 hours, $3.09M Binance volume. CoinGecko: rank #618, $31.8M market cap — genuinely micro — global volume $12.7M, 210.8M of 1B circulating, -89% off the $1.42 all-time high. 1h chart on closed candles: RSI 45, under EMA20 $0.1558, sitting on EMA50 $0.1514. Cooling, not washed out.
No fresh catalyst for this leg — the backdrop is still the October 23 mint exploit, about $2.6M, and the halted chain. That is flow unwinding on a paused chain, not a new headline.
Levels: resistance $0.15544 — an hourly close back above it reopens the leg again — then $0.1608, then $0.1680. Support $0.1494 — a close below it deepens the give-back — then $0.1451, then the $0.1301 shelf.
Not a call, in either direction. A coin that reopened and failed its own leg twice in two days can rip back just as fast as it faded.
Close back above $0.15544, or $0.1494 next?
$INIT just gave the leg back — $0.15095 closed under $0.15544, and the reopen from the last post lasted less than a day.
The last post left the leg reopened: four straight closes above $0.15544, $0.15677 up to $0.15998. It never closed above the $0.1680 ceiling — 18:00 closed $0.16524, then the bleed: $0.16400, $0.16010, $0.15736. Then 22:00 closed $0.15414, the first hour back under the line, and 23:00 closed $0.15095, lower again. The forming hour is $0.1508, still below, unclosed — not claimed as a further break.
Live $0.1508, -5.5% in 24 hours, $3.09M Binance volume. CoinGecko: rank #618, $31.8M market cap — genuinely micro — global volume $12.7M, 210.8M of 1B circulating, -89% off the $1.42 all-time high. 1h chart on closed candles: RSI 45, under EMA20 $0.1558, sitting on EMA50 $0.1514. Cooling, not washed out.
No fresh catalyst for this leg — the backdrop is still the October 23 mint exploit, about $2.6M, and the halted chain. That is flow unwinding on a paused chain, not a new headline.
Levels: resistance $0.15544 — an hourly close back above it reopens the leg again — then $0.1608, then $0.1680. Support $0.1494 — a close below it deepens the give-back — then $0.1451, then the $0.1301 shelf.
Not a call, in either direction. A coin that reopened and failed its own leg twice in two days can rip back just as fast as it faded.
Close back above $0.15544, or $0.1494 next?
The last post left the leg reopened: four straight closes above $0.15544, $0.15677 up to $0.15998. It never closed above the $0.1680 ceiling — 18:00 closed $0.16524, then the bleed: $0.16400, $0.16010, $0.15736. Then 22:00 closed $0.15414, the first hour back under the line, and 23:00 closed $0.15095, lower again. The forming hour is $0.1508, still below, unclosed — not claimed as a further break.
Live $0.1508, -5.5% in 24 hours, $3.09M Binance volume. CoinGecko: rank #618, $31.8M market cap — genuinely micro — global volume $12.7M, 210.8M of 1B circulating, -89% off the $1.42 all-time high. 1h chart on closed candles: RSI 45, under EMA20 $0.1558, sitting on EMA50 $0.1514. Cooling, not washed out.
No fresh catalyst for this leg — the backdrop is still the October 23 mint exploit, about $2.6M, and the halted chain. That is flow unwinding on a paused chain, not a new headline.
Levels: resistance $0.15544 — an hourly close back above it reopens the leg again — then $0.1608, then $0.1680. Support $0.1494 — a close below it deepens the give-back — then $0.1451, then the $0.1301 shelf.
Not a call, in either direction. A coin that reopened and failed its own leg twice in two days can rip back just as fast as it faded.
Close back above $0.15544, or $0.1494 next?
82

·
--
SOLV surges 2.6%! Is it worth chasing this kind of spike?At 19:50 (3 minutes ago), SOLV surged 2.6% at a key time (5-minute window: 19:45→19:50). As of 19:53:07, the current price is 0.004337, down 2.8% over 24h. Other assets with unusual moves around the same time include ZEREBRO and TRUTH.
📅 Data as of 19:53:07 (event trigger times are noted in each item; prices are real-time snapshots taken when this was written)
📌 In a nutshell: Unusual moves during key periods (such as candle closes and U.S. market opens/closes) often involve institutional participation, making these signals more reliable.
Market overview: BTC 82,002.30 (+0.55%) · ETH 2,414.86 (-0.77%); across the market, 44 assets rose and 448 fell over 24h; top gainer: Q +54.36%, top loser: APR -45.23%.
SOLV surges 2.6%! Is it worth chasing this kind of spike?
At 19:50 (3 minutes ago), SOLV surged 2.6% at a key time (5-minute window: 19:45→19:50). As of 19:53:07, the current price is 0.004337, down 2.8% over 24h. Other assets with unusual moves around the same time include ZEREBRO and TRUTH.
📅 Data as of 19:53:07 (event trigger times are noted in each item; prices are real-time snapshots taken when this was written)
📌 In a nutshell: Unusual moves during key periods (such as candle closes and U.S. market opens/closes) often involve institutional participation, making these signals more reliable.
Market overview: BTC 82,002.30 (+0.55%) · ETH 2,414.86 (-0.77%); across the market, 44 assets rose and 448 fell over 24h; top gainer: Q +54.36%, top loser: APR -45.23%.
📅 Data as of 19:53:07 (event trigger times are noted in each item; prices are real-time snapshots taken when this was written)
📌 In a nutshell: Unusual moves during key periods (such as candle closes and U.S. market opens/closes) often involve institutional participation, making these signals more reliable.
Market overview: BTC 82,002.30 (+0.55%) · ETH 2,414.86 (-0.77%); across the market, 44 assets rose and 448 fell over 24h; top gainer: Q +54.36%, top loser: APR -45.23%.
5

·
--
$QTC rose from $17 to $170 before falling back to $113. The people feeling the most agonized are those who missed the ride: chase it, and you risk buying halfway up after distribution; sit it out, and you risk mistaking an ongoing trend for one that’s already over. Those who entered around $130 aren’t having an easy time either—a 7-day unrealized loss of 13.39% has made “should I get out?” a question they have to answer.
The 30-day gain of 597.95% is the most eye-catching part of the chart, but what determines where it goes next isn’t the size of the gain—it’s volume. On October 9, the day it surged to $170, 24-hour trading volume was $45.54M. A few days later, it had dwindled to today’s $2.06M. Is the price pullback and shrinking volume just normal consolidation after a rally, or have large investors already finished distributing? With a market cap of $32.61M and a rank of #618, moves in either direction could be amplified. Being 39.22% below its ATH may look cheap, but in a move of this magnitude, a 50% drop doesn’t change the structure—and it wouldn’t be unusual.
What I care more about is whether volume can pick up again. If volume expands as it reclaims $130, this pullback was just a shakeout; if it keeps drifting down on shrinking volume, $113 probably won’t hold.
So the choice is: A, wait for it to reclaim $130 on rising volume before entering, at the cost of missing some of the initial move; or B, open a half position around $113, betting that the low volume signals a shakeout, and cut losses if it falls below $100. Either choice has its merits, but be clear about which cost you’re willing to pay.
$QTC rose from $17 to $170 before falling back to $113. The people feeling the most agonized are those who missed the ride: chase it, and you risk buying halfway up after distribution; sit it out, and you risk mistaking an ongoing trend for one that’s already over. Those who entered around $130 aren’t having an easy time either—a 7-day unrealized loss of 13.39% has made “should I get out?” a question they have to answer.
The 30-day gain of 597.95% is the most eye-catching part of the chart, but what determines where it goes next isn’t the size of the gain—it’s volume. On October 9, the day it surged to $170, 24-hour trading volume was $45.54M. A few days later, it had dwindled to today’s $2.06M. Is the price pullback and shrinking volume just normal consolidation after a rally, or have large investors already finished distributing? With a market cap of $32.61M and a rank of #618, moves in either direction could be amplified. Being 39.22% below its ATH may look cheap, but in a move of this magnitude, a 50% drop doesn’t change the structure—and it wouldn’t be unusual.
What I care more about is whether volume can pick up again. If volume expands as it reclaims $130, this pullback was just a shakeout; if it keeps drifting down on shrinking volume, $113 probably won’t hold.
So the choice is: A, wait for it to reclaim $130 on rising volume before entering, at the cost of missing some of the initial move; or B, open a half position around $113, betting that the low volume signals a shakeout, and cut losses if it falls below $100. Either choice has its merits, but be clear about which cost you’re willing to pay.
The 30-day gain of 597.95% is the most eye-catching part of the chart, but what determines where it goes next isn’t the size of the gain—it’s volume. On October 9, the day it surged to $170, 24-hour trading volume was $45.54M. A few days later, it had dwindled to today’s $2.06M. Is the price pullback and shrinking volume just normal consolidation after a rally, or have large investors already finished distributing? With a market cap of $32.61M and a rank of #618, moves in either direction could be amplified. Being 39.22% below its ATH may look cheap, but in a move of this magnitude, a 50% drop doesn’t change the structure—and it wouldn’t be unusual.
What I care more about is whether volume can pick up again. If volume expands as it reclaims $130, this pullback was just a shakeout; if it keeps drifting down on shrinking volume, $113 probably won’t hold.
So the choice is: A, wait for it to reclaim $130 on rising volume before entering, at the cost of missing some of the initial move; or B, open a half position around $113, betting that the low volume signals a shakeout, and cut losses if it falls below $100. Either choice has its merits, but be clear about which cost you’re willing to pay.
1
·
--
STX suddenly plunges 2.2% at a key time! Panic or opportunity? A quick look at support levels01:02 (4 minutes ago) STX fell 2.2% at a key time (5-minute window 00:57→01:02). As of 01:06:29, its current price is 0.4032, up 5.3% over 24h. Other simultaneous moves included AIOT and YB.
📅 Data as of 01:06:29 (event trigger times are noted for each item; prices are real-time snapshots taken at the time of writing)
📌 In a nutshell: Unusual moves around key times (such as candlestick closes and the U.S. market open/close) often involve institutional players, making these signals more reliable
Market overview: BTC 83,029.30(+0.43%) · ETH 2,505.06(+0.66%); across the market, 396 assets rose and 96 fell over 24h; top 24h gainer: LUMIA +32.71%, top loser: US -40.01%.
STX suddenly plunges 2.2% at a key time! Panic or opportunity? A quick look at support levels
01:02 (4 minutes ago) STX fell 2.2% at a key time (5-minute window 00:57→01:02). As of 01:06:29, its current price is 0.4032, up 5.3% over 24h. Other simultaneous moves included AIOT and YB.
📅 Data as of 01:06:29 (event trigger times are noted for each item; prices are real-time snapshots taken at the time of writing)
📌 In a nutshell: Unusual moves around key times (such as candlestick closes and the U.S. market open/close) often involve institutional players, making these signals more reliable
Market overview: BTC 83,029.30(+0.43%) · ETH 2,505.06(+0.66%); across the market, 396 assets rose and 96 fell over 24h; top 24h gainer: LUMIA +32.71%, top loser: US -40.01%.
📅 Data as of 01:06:29 (event trigger times are noted for each item; prices are real-time snapshots taken at the time of writing)
📌 In a nutshell: Unusual moves around key times (such as candlestick closes and the U.S. market open/close) often involve institutional players, making these signals more reliable
Market overview: BTC 83,029.30(+0.43%) · ETH 2,505.06(+0.66%); across the market, 396 assets rose and 96 fell over 24h; top 24h gainer: LUMIA +32.71%, top loser: US -40.01%.
22
·
--
APR suddenly plunges 16% in 15 minutes! Panic or opportunity? Key support levels at a glanceAt 14:29 (7 minutes ago), APR dropped 16% within 15 minutes (15-minute window: 14:14→14:29). As of 14:37:19, the current price is 0.093, down 14.8% over 24h. PIXEL and Q also saw sharp moves around the same time.
📅 Data as of 14:37:19 (see each item for the event trigger time; prices are live snapshots taken when this was written)
📌 In a nutshell: The 15-minute trend has intensified. Before following it, decide where to place your stop-loss.
Market overview: BTC 82,745.20 (+0.31%) · ETH 2,494.99 (-0.16%); 343 assets up / 147 down over 24h; top 24h gainer: MAGIC +129.39%; top loser: RLC -21.72%.
APR suddenly plunges 16% in 15 minutes! Panic or opportunity? Key support levels at a glance
At 14:29 (7 minutes ago), APR dropped 16% within 15 minutes (15-minute window: 14:14→14:29). As of 14:37:19, the current price is 0.093, down 14.8% over 24h. PIXEL and Q also saw sharp moves around the same time.
📅 Data as of 14:37:19 (see each item for the event trigger time; prices are live snapshots taken when this was written)
📌 In a nutshell: The 15-minute trend has intensified. Before following it, decide where to place your stop-loss.
Market overview: BTC 82,745.20 (+0.31%) · ETH 2,494.99 (-0.16%); 343 assets up / 147 down over 24h; top 24h gainer: MAGIC +129.39%; top loser: RLC -21.72%.
📅 Data as of 14:37:19 (see each item for the event trigger time; prices are live snapshots taken when this was written)
📌 In a nutshell: The 15-minute trend has intensified. Before following it, decide where to place your stop-loss.
Market overview: BTC 82,745.20 (+0.31%) · ETH 2,494.99 (-0.16%); 343 assets up / 147 down over 24h; top 24h gainer: MAGIC +129.39%; top loser: RLC -21.72%.
9
·
--
Bullish
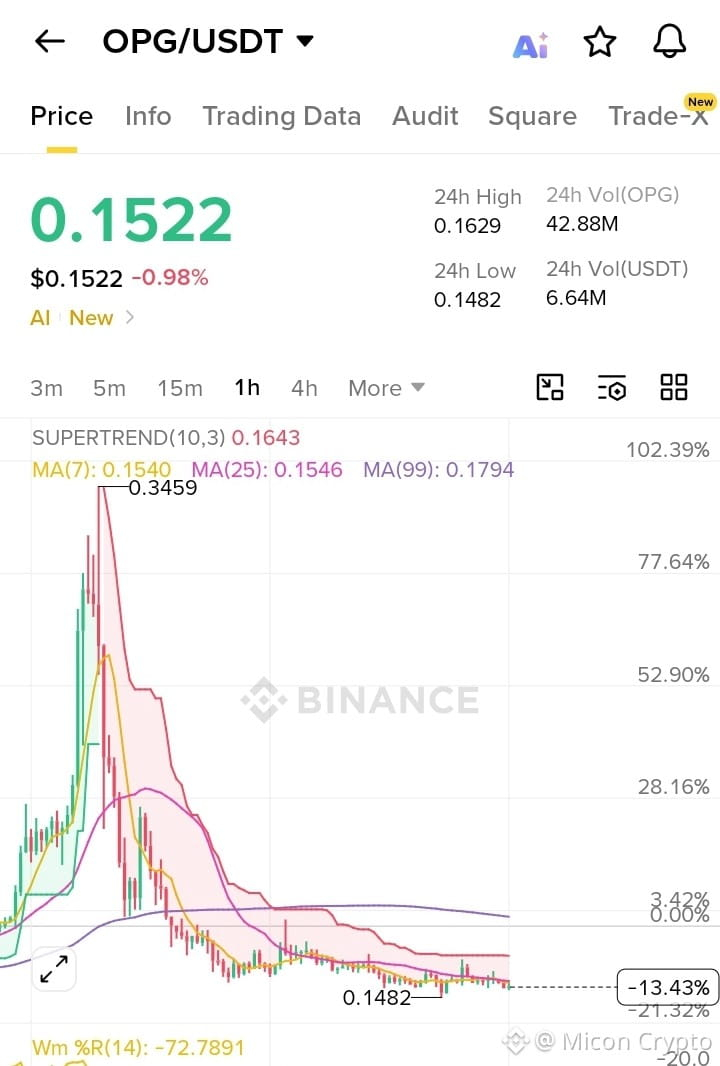
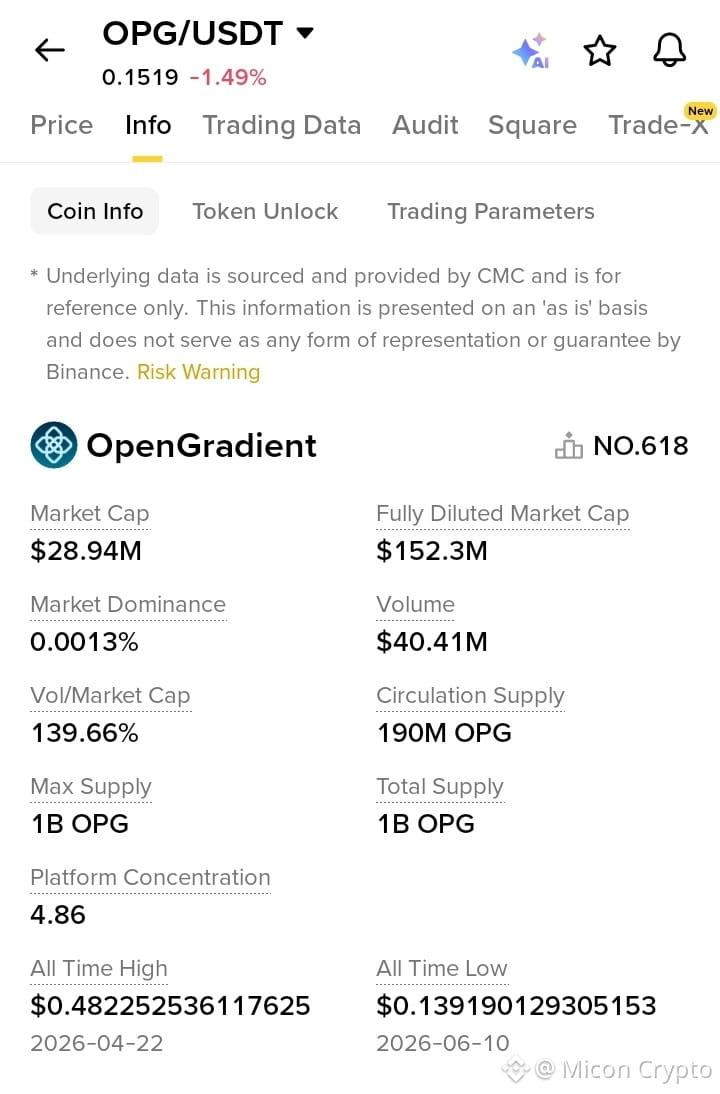
#opg $OPG 🚀 OpenGradient ($OPG) Showing Strong Activity!
-Current Price: $0.1519
-Market Cap: $28.94M
-24H Volume: $40.41M
- Fully Diluted Valuation (FDV): $152.3M
Despite recent market volatility, $OPG is maintaining significant trading volume with a 139.66% Volume/Market Cap ratio, indicating strong market participation and liquidity.
🔹 Circulating Supply: 190M OPG
🔹 Max Supply: 1B OPG
🔹 Current Rank: #618
The project is still in its early growth phase, with only 19% of the total supply currently in circulation, making future token unlocks an important factor to watch.
All-Time High: $0.4823 📍 Current price is around 68% below ATH, potentially attracting traders looking for recovery opportunities.
#opg $OPG 🚀 OpenGradient ($OPG ) Showing Strong Activity!
-Current Price: $0.1519
-Market Cap: $28.94M
-24H Volume: $40.41M
- Fully Diluted Valuation (FDV): $152.3M
Despite recent market volatility, $OPG is maintaining significant trading volume with a 139.66% Volume/Market Cap ratio, indicating strong market participation and liquidity.
🔹 Circulating Supply: 190M OPG
🔹 Max Supply: 1B OPG
🔹 Current Rank: #618
The project is still in its early growth phase, with only 19% of the total supply currently in circulation, making future token unlocks an important factor to watch.
All-Time High: $0.4823 📍 Current price is around 68% below ATH, potentially attracting traders looking for recovery opportunities.
-Current Price: $0.1519
-Market Cap: $28.94M
-24H Volume: $40.41M
- Fully Diluted Valuation (FDV): $152.3M
Despite recent market volatility, $OPG is maintaining significant trading volume with a 139.66% Volume/Market Cap ratio, indicating strong market participation and liquidity.
🔹 Circulating Supply: 190M OPG
🔹 Max Supply: 1B OPG
🔹 Current Rank: #618
The project is still in its early growth phase, with only 19% of the total supply currently in circulation, making future token unlocks an important factor to watch.
All-Time High: $0.4823 📍 Current price is around 68% below ATH, potentially attracting traders looking for recovery opportunities.
Rida Malik7:
One thing that stands out is the focus on making AI outputs verifiable rather than asking users to trust blindly.
3
1
123
Log in to explore more content
Join global crypto users on Binance Square
⚡️ Get latest and useful information about crypto.
💬 Trusted by the world’s largest crypto exchange.
👍 Discover real insights from verified creators.
Email / Phone number
Trending Topics
1
#BinanceReopensWithdrawalsForMoreAssets
967,507 views
4,964 Discussing
2
#AnthropicIPOValuationDoubts
93 views
16 Discussing
3
#USStocksSlipandCryptoMarketUnderBroadPressure
45,793 views
427 Discussing
4
#StrategySTRCResumesIssuanceAfterOver170Days
37,056 views
526 Discussing
5
#Nasdaq100Tumbles6%
731 views
44 Discussing
6
#GreekParliamentPasses10%CryptoCapitalGainsTaxBill
288 views
31 Discussing
7
#KospiSlideTriggersCircuitBreaker
467 views
31 Discussing
8
#ADPUSPrivateEmployersAdd86000JobsInOctober
55,046 views
652 Discussing
9
#KazakhstanReportedlyInvests$100MInCryptoFunds
4,004 views
65 Discussing
10
#SouthKoreaSeeksCryptoTaxDelayUntil2029
31,672 views
302 Discussing