
#521
521
756 views
9 Discussing
Hot
Latest

·
--
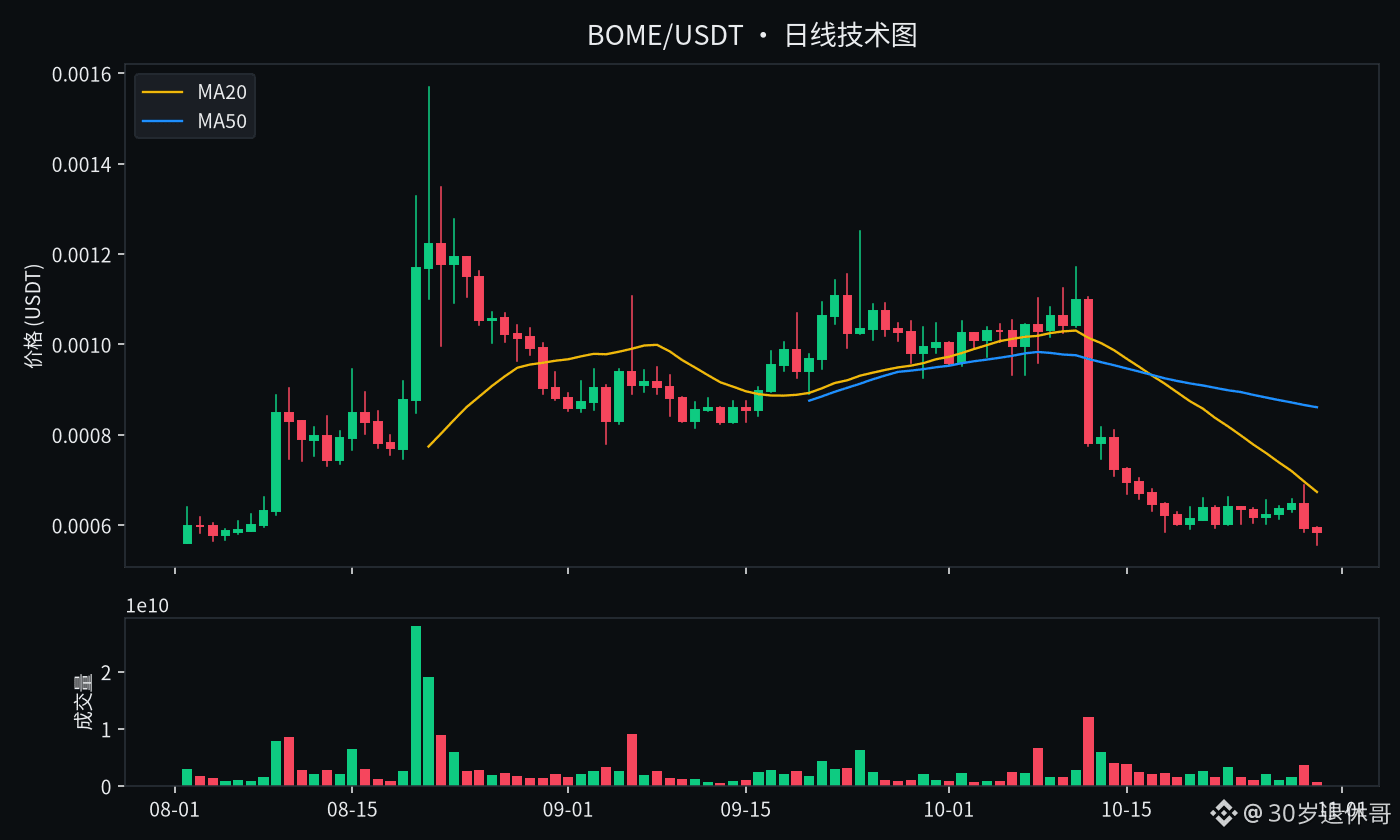
🩸 Calling out $BOME: Daily chart looks weak; my view is 【Bearish】
【View】$BOME (BOOK OF MEME) → Bearish
Ranked around #521 by market cap, currently around 0.00058420. MA20≈0.00067314 and MA50≈0.00086063; price is below both moving averages, making each rebound look more like an exit window for underwater holders. When the trend is bearish, “buying the dip” can easily turn into “catching a falling knife.” Key levels: resistance≈0.0011711, support≈0.00055660; invalidation at 0.00066722—I’ll admit I’m wrong and turn neutral if price reclaims it decisively. Volume is about 1.3 times the 20-day average; we’ll need to watch volume to tell a genuine breakout from a fake one.
📌 Reference levels (daily ATR≈0.00004884)
Direction: Short
Entry: 0.00058420–0.00060862
TP1: 0.00052560 TP2: 0.00045479 TP3: 0.00038397
SL: 0.00066722
Keep an eye on whether a rebound to 0.0011711 gets rejected, and whether 0.00055660 holds.
Are you still holding $BOME ? Can you hold on, or are you ready to admit you’re wrong? Let’s discuss in the comments.
⚠️ Disclaimer: This is only my personal opinion, not investment advice. Please be aware of the risks.
$BTC $ETH $BOME #看空 #WriteToEarn
🩸 Calling out $BOME : Daily chart looks weak; my view is 【Bearish】
【View】$BOME (BOOK OF MEME) → Bearish
Ranked around #521 by market cap, currently around 0.00058420. MA20≈0.00067314 and MA50≈0.00086063; price is below both moving averages, making each rebound look more like an exit window for underwater holders. When the trend is bearish, “buying the dip” can easily turn into “catching a falling knife.” Key levels: resistance≈0.0011711, support≈0.00055660; invalidation at 0.00066722—I’ll admit I’m wrong and turn neutral if price reclaims it decisively. Volume is about 1.3 times the 20-day average; we’ll need to watch volume to tell a genuine breakout from a fake one.
📌 Reference levels (daily ATR≈0.00004884)
Direction: Short
Entry: 0.00058420–0.00060862
TP1: 0.00052560 TP2: 0.00045479 TP3: 0.00038397
SL: 0.00066722
Keep an eye on whether a rebound to 0.0011711 gets rejected, and whether 0.00055660 holds.
Are you still holding $BOME ? Can you hold on, or are you ready to admit you’re wrong? Let’s discuss in the comments.
⚠️ Disclaimer: This is only my personal opinion, not investment advice. Please be aware of the risks.
$BTC $ETH $BOME #看空 #WriteToEarn
【View】$BOME (BOOK OF MEME) → Bearish
Ranked around #521 by market cap, currently around 0.00058420. MA20≈0.00067314 and MA50≈0.00086063; price is below both moving averages, making each rebound look more like an exit window for underwater holders. When the trend is bearish, “buying the dip” can easily turn into “catching a falling knife.” Key levels: resistance≈0.0011711, support≈0.00055660; invalidation at 0.00066722—I’ll admit I’m wrong and turn neutral if price reclaims it decisively. Volume is about 1.3 times the 20-day average; we’ll need to watch volume to tell a genuine breakout from a fake one.
📌 Reference levels (daily ATR≈0.00004884)
Direction: Short
Entry: 0.00058420–0.00060862
TP1: 0.00052560 TP2: 0.00045479 TP3: 0.00038397
SL: 0.00066722
Keep an eye on whether a rebound to 0.0011711 gets rejected, and whether 0.00055660 holds.
Are you still holding $BOME ? Can you hold on, or are you ready to admit you’re wrong? Let’s discuss in the comments.
⚠️ Disclaimer: This is only my personal opinion, not investment advice. Please be aware of the risks.
$BTC $ETH $BOME #看空 #WriteToEarn
ZeusCam:
Lol
1
575

·
--
Partly True
【Binance Spot 4h Gainers TOP 3】
1️⃣ $INIT / INITUSDT
Current price 0.14508 U|24h trading volume 10.03M U
Background: Initia bundles a main chain with a set of customizable application chains, enabling cross-chain interoperability and shared liquidity. This design is called “Interwoven Rollups,” and it is a modular public blockchain.
Latest status: On October 23, it suspended the L1 mainnet and all Rollups due to an infinite minting vulnerability. Around $2.6 million in assets were transferred to Ethereum. The team said it would publish a post-incident report and coordinate an emergency patch.
Total supply 1B|Market cap 30.41M U|Rank #643
4h 【+7.72%】|24h +8.04%|7d +15.33%
Momentum: 4h trading volume was 1.2M U, 0.56 times the average of the previous 5 candles; the close was at 58% of the candle’s range. The current price is 7.82% below the 24h high, and the previous 4h candle was −11.00%.
2️⃣ $ARK / ARKUSDT
Current price 0.2057 U|24h trading volume 11.07M U
Background: ARK is an established public blockchain launched in 2017. It built the modular framework ARK Core in TypeScript, letting others use it to create their own chains. It is often called the “WordPress of blockchain.” Its mainnet uses DPoS, with 51 nodes producing blocks.
Latest status: No new announcements on the official website or code repositories. The ecosystem’s main entry points remain the ARKVault wallet and ARKConnect plugin, with no major recent changes.
Total supply 200M|Market cap 41.37M U|Rank #521
4h 【+4.75%】|24h +9.36%|7d +16.08%
Momentum: 4h trading volume was 430K U, just 0.18 times the average of the previous 5 candles; the close was at 87% of the candle’s range. The current price is 15.04% below the 24h high, and the previous 4h candle was −3.93%.
3️⃣ $ERA / ERAUSDT
Current price 0.08700 U|24h trading volume 22.41M U
Background: Caldera offers “Rollups as a Service,” letting developers launch their own application chains in just a few clicks, then connect them with other chains and external networks via Metalayer for cross-chain transfers. It currently supports over 50 chains, with TVL exceeding $1 billion.
Latest status: In January this year, it partnered with BitcoinOS to bring Bitcoin-native security to Rollups; in February, it launched ERA Drops, an airdrop hub.
Total supply 1B|Market cap 15.36M U|Rank #960
4h 【+4.57%】|24h +19.34%|7d +30.43%
Momentum: 4h trading volume was 4.95M U, 1.43 times the average of the previous 5 candles; the close was at 26% of the candle’s range. The current price is 15.62% below the 24h high, and the previous 4h candle was +14.55%.
Summary: INIT has just turned positive after dropping 11% and has the biggest 4h gain; ARK has the strongest close, at 87% of its range; ERA is up 19% but closed at just 26% of its range, giving back the most.
Which matters more to you: 4h momentum or the 7-day trend?
Not investment advice. DYOR.
【Binance Spot 4h Gainers TOP 3】
1️⃣ $INIT / INITUSDT
Current price 0.14508 U|24h trading volume 10.03M U
Background: Initia bundles a main chain with a set of customizable application chains, enabling cross-chain interoperability and shared liquidity. This design is called “Interwoven Rollups,” and it is a modular public blockchain.
Latest status: On October 23, it suspended the L1 mainnet and all Rollups due to an infinite minting vulnerability. Around $2.6 million in assets were transferred to Ethereum. The team said it would publish a post-incident report and coordinate an emergency patch.
Total supply 1B|Market cap 30.41M U|Rank #643
4h 【+7.72%】|24h +8.04%|7d +15.33%
Momentum: 4h trading volume was 1.2M U, 0.56 times the average of the previous 5 candles; the close was at 58% of the candle’s range. The current price is 7.82% below the 24h high, and the previous 4h candle was −11.00%.
2️⃣ $ARK / ARKUSDT
Current price 0.2057 U|24h trading volume 11.07M U
Background: ARK is an established public blockchain launched in 2017. It built the modular framework ARK Core in TypeScript, letting others use it to create their own chains. It is often called the “WordPress of blockchain.” Its mainnet uses DPoS, with 51 nodes producing blocks.
Latest status: No new announcements on the official website or code repositories. The ecosystem’s main entry points remain the ARKVault wallet and ARKConnect plugin, with no major recent changes.
Total supply 200M|Market cap 41.37M U|Rank #521
4h 【+4.75%】|24h +9.36%|7d +16.08%
Momentum: 4h trading volume was 430K U, just 0.18 times the average of the previous 5 candles; the close was at 87% of the candle’s range. The current price is 15.04% below the 24h high, and the previous 4h candle was −3.93%.
3️⃣ $ERA / ERAUSDT
Current price 0.08700 U|24h trading volume 22.41M U
Background: Caldera offers “Rollups as a Service,” letting developers launch their own application chains in just a few clicks, then connect them with other chains and external networks via Metalayer for cross-chain transfers. It currently supports over 50 chains, with TVL exceeding $1 billion.
Latest status: In January this year, it partnered with BitcoinOS to bring Bitcoin-native security to Rollups; in February, it launched ERA Drops, an airdrop hub.
Total supply 1B|Market cap 15.36M U|Rank #960
4h 【+4.57%】|24h +19.34%|7d +30.43%
Momentum: 4h trading volume was 4.95M U, 1.43 times the average of the previous 5 candles; the close was at 26% of the candle’s range. The current price is 15.62% below the 24h high, and the previous 4h candle was +14.55%.
Summary: INIT has just turned positive after dropping 11% and has the biggest 4h gain; ARK has the strongest close, at 87% of its range; ERA is up 19% but closed at just 26% of its range, giving back the most.
Which matters more to you: 4h momentum or the 7-day trend?
Not investment advice. DYOR.
1️⃣ $INIT / INITUSDT
Current price 0.14508 U|24h trading volume 10.03M U
Background: Initia bundles a main chain with a set of customizable application chains, enabling cross-chain interoperability and shared liquidity. This design is called “Interwoven Rollups,” and it is a modular public blockchain.
Latest status: On October 23, it suspended the L1 mainnet and all Rollups due to an infinite minting vulnerability. Around $2.6 million in assets were transferred to Ethereum. The team said it would publish a post-incident report and coordinate an emergency patch.
Total supply 1B|Market cap 30.41M U|Rank #643
4h 【+7.72%】|24h +8.04%|7d +15.33%
Momentum: 4h trading volume was 1.2M U, 0.56 times the average of the previous 5 candles; the close was at 58% of the candle’s range. The current price is 7.82% below the 24h high, and the previous 4h candle was −11.00%.
2️⃣ $ARK / ARKUSDT
Current price 0.2057 U|24h trading volume 11.07M U
Background: ARK is an established public blockchain launched in 2017. It built the modular framework ARK Core in TypeScript, letting others use it to create their own chains. It is often called the “WordPress of blockchain.” Its mainnet uses DPoS, with 51 nodes producing blocks.
Latest status: No new announcements on the official website or code repositories. The ecosystem’s main entry points remain the ARKVault wallet and ARKConnect plugin, with no major recent changes.
Total supply 200M|Market cap 41.37M U|Rank #521
4h 【+4.75%】|24h +9.36%|7d +16.08%
Momentum: 4h trading volume was 430K U, just 0.18 times the average of the previous 5 candles; the close was at 87% of the candle’s range. The current price is 15.04% below the 24h high, and the previous 4h candle was −3.93%.
3️⃣ $ERA / ERAUSDT
Current price 0.08700 U|24h trading volume 22.41M U
Background: Caldera offers “Rollups as a Service,” letting developers launch their own application chains in just a few clicks, then connect them with other chains and external networks via Metalayer for cross-chain transfers. It currently supports over 50 chains, with TVL exceeding $1 billion.
Latest status: In January this year, it partnered with BitcoinOS to bring Bitcoin-native security to Rollups; in February, it launched ERA Drops, an airdrop hub.
Total supply 1B|Market cap 15.36M U|Rank #960
4h 【+4.57%】|24h +19.34%|7d +30.43%
Momentum: 4h trading volume was 4.95M U, 1.43 times the average of the previous 5 candles; the close was at 26% of the candle’s range. The current price is 15.62% below the 24h high, and the previous 4h candle was +14.55%.
Summary: INIT has just turned positive after dropping 11% and has the biggest 4h gain; ARK has the strongest close, at 87% of its range; ERA is up 19% but closed at just 26% of its range, giving back the most.
Which matters more to you: 4h momentum or the 7-day trend?
Not investment advice. DYOR.
1
2
705

·
--
KGEN spikes 12%! Is it worth chasing this kind of sharp rally?At 16:56 (6 minutes ago), KGEN surged 12% within 15 minutes (15-minute window 16:41→16:56). As of 17:02:46, its price is 0.1589, up 11.5% over 24h. Other assets showing unusual moves in the same batch include GWEI and ALT.
📅 Data as of 17:02:46 (event trigger times are noted for each item; prices are real-time snapshots at the time of writing)
📌 In a nutshell: The 15-minute trend has intensified. Before following it, decide where to place your stop-loss.
Market overview: BTC 83,522.00(+0.64%) · ETH 2,552.96(+2.13%); across the market, 264 assets rose and 222 fell over 24h; top gainer W +71.50%, top loser LUMIA -31.34%.
KGEN spikes 12%! Is it worth chasing this kind of sharp rally?
At 16:56 (6 minutes ago), KGEN surged 12% within 15 minutes (15-minute window 16:41→16:56). As of 17:02:46, its price is 0.1589, up 11.5% over 24h. Other assets showing unusual moves in the same batch include GWEI and ALT.
📅 Data as of 17:02:46 (event trigger times are noted for each item; prices are real-time snapshots at the time of writing)
📌 In a nutshell: The 15-minute trend has intensified. Before following it, decide where to place your stop-loss.
Market overview: BTC 83,522.00(+0.64%) · ETH 2,552.96(+2.13%); across the market, 264 assets rose and 222 fell over 24h; top gainer W +71.50%, top loser LUMIA -31.34%.
📅 Data as of 17:02:46 (event trigger times are noted for each item; prices are real-time snapshots at the time of writing)
📌 In a nutshell: The 15-minute trend has intensified. Before following it, decide where to place your stop-loss.
Market overview: BTC 83,522.00(+0.64%) · ETH 2,552.96(+2.13%); across the market, 264 assets rose and 222 fell over 24h; top gainer W +71.50%, top loser LUMIA -31.34%.
75
·
--
SKL surges 4.5%! Is a sharp rally like this worth chasing?19:46 (just now) SKL surged 4.5% within 5 minutes (5-minute window 19:41→19:46). As of 19:46:19, the current price is 0.005569, up 23.9% over 24h.
📅 Data as of 19:46:19 (event trigger times are noted in each item; prices are real-time snapshots taken when this was written)
📌 In a nutshell: Short-term momentum is concentrated, and pullbacks can come fast—placing orders in batches is steadier than chasing a rally
Market overview: BTC 83,031.70(+0.54%) · ETH 2,500.59(-1.57%); 24h market-wide: 134 gainers / 356 decliners; top 24h gainer US +105.83%, top decliner CT -14.18%.
—— Unusual Activity Details ——
SKL surges 4.5%! Is a sharp rally like this worth chasing?
19:46 (just now) SKL surged 4.5% within 5 minutes (5-minute window 19:41→19:46). As of 19:46:19, the current price is 0.005569, up 23.9% over 24h.
📅 Data as of 19:46:19 (event trigger times are noted in each item; prices are real-time snapshots taken when this was written)
📌 In a nutshell: Short-term momentum is concentrated, and pullbacks can come fast—placing orders in batches is steadier than chasing a rally
Market overview: BTC 83,031.70(+0.54%) · ETH 2,500.59(-1.57%); 24h market-wide: 134 gainers / 356 decliners; top 24h gainer US +105.83%, top decliner CT -14.18%.
—— Unusual Activity Details ——
📅 Data as of 19:46:19 (event trigger times are noted in each item; prices are real-time snapshots taken when this was written)
📌 In a nutshell: Short-term momentum is concentrated, and pullbacks can come fast—placing orders in batches is steadier than chasing a rally
Market overview: BTC 83,031.70(+0.54%) · ETH 2,500.59(-1.57%); 24h market-wide: 134 gainers / 356 decliners; top 24h gainer US +105.83%, top decliner CT -14.18%.
—— Unusual Activity Details ——
3
·
--
STAR surges up 4.6% in a spike! Can you chase moves like this?10:13 (8 minutes ago) STAR surged 4.6% within 5 minutes (5-minute window 10:08→10:13). As of 10:21:54, the current price is 0.04311, up 21.2% in 24h. Other simultaneous movers in the same batch include CARV and SCR.
📅 Data as of 10:21:54 (event trigger times are noted on each item; prices are real-time snapshots at the time of writing)
📌 One-sentence takeaway: short-term momentum is concentrated, and pullbacks often come and go quickly—staggered limit orders are more reliable than chasing the price
Market Overview: BTC 86,543.30 (+2.06%) · ETH 2,733.71 (+1.51%); across the whole market, 413 were up and 80 were down in the past 24h; top gainer in the past 24h: GTC +91.72%, top loser: US -31.61%.
STAR surges up 4.6% in a spike! Can you chase moves like this?
10:13 (8 minutes ago) STAR surged 4.6% within 5 minutes (5-minute window 10:08→10:13). As of 10:21:54, the current price is 0.04311, up 21.2% in 24h. Other simultaneous movers in the same batch include CARV and SCR.
📅 Data as of 10:21:54 (event trigger times are noted on each item; prices are real-time snapshots at the time of writing)
📌 One-sentence takeaway: short-term momentum is concentrated, and pullbacks often come and go quickly—staggered limit orders are more reliable than chasing the price
Market Overview: BTC 86,543.30 (+2.06%) · ETH 2,733.71 (+1.51%); across the whole market, 413 were up and 80 were down in the past 24h; top gainer in the past 24h: GTC +91.72%, top loser: US -31.61%.
📅 Data as of 10:21:54 (event trigger times are noted on each item; prices are real-time snapshots at the time of writing)
📌 One-sentence takeaway: short-term momentum is concentrated, and pullbacks often come and go quickly—staggered limit orders are more reliable than chasing the price
Market Overview: BTC 86,543.30 (+2.06%) · ETH 2,733.71 (+1.51%); across the whole market, 413 were up and 80 were down in the past 24h; top gainer in the past 24h: GTC +91.72%, top loser: US -31.61%.
6

·
--
$PONS This bullish candle looks strong, but the story length isn’t enough to fill a full month—its 30-day rise/fall shows +0.00%, suggesting that either this token just started from an extremely low price, or the data sample is too new. Two things need to be verified: first, within the 7-day +187% surge, today’s 24-hour contribution accounts for 33%, which indicates that an acceleration phase is underway; second, the ATH has just been refreshed at $0.055, only -10.83% from now, while the 24h high is actually the ATH itself.
What’s really happening on the chart: On July 15 it was still at $0.011, on July 17 it briefly got dumped to $0.0044, and then over the following seven days it rallied +10x from the bottom. Trading volume expanded from 620K to today’s $7M, but the peak volume occurred on July 22 at $24M. The flow timing is: first concentrated buying to accumulate, then gradually pushing higher while volume tapers off. This isn’t a healthy rotation structure—it’s more like holders are rationing supply (low willingness to sell) and new capital’s willingness to enter is decreasing.
What I care about more is the market cap rank #521, with a market cap of $38.65M. For coins of this size, once liquidity breaks down, intraday drawdowns can wipe out a week’s gains. And missing 30-day data means you can’t determine where the support level was in the prior cycle—the whole price “foundation” is basically hanging in the air.
My view becomes invalidation is simple: if over the next 2–3 days the trading volume climbs back above $10M, and the price finds support in the $0.04–$0.045 range (the low on July 26), then this bullish candle could be a launch signal rather than a peak driven by emotions. Try testing it with this framework—you don’t need to take a side immediately; just watch these two metrics.
$PONS This bullish candle looks strong, but the story length isn’t enough to fill a full month—its 30-day rise/fall shows +0.00%, suggesting that either this token just started from an extremely low price, or the data sample is too new. Two things need to be verified: first, within the 7-day +187% surge, today’s 24-hour contribution accounts for 33%, which indicates that an acceleration phase is underway; second, the ATH has just been refreshed at $0.055, only -10.83% from now, while the 24h high is actually the ATH itself.
What’s really happening on the chart: On July 15 it was still at $0.011, on July 17 it briefly got dumped to $0.0044, and then over the following seven days it rallied +10x from the bottom. Trading volume expanded from 620K to today’s $7M, but the peak volume occurred on July 22 at $24M. The flow timing is: first concentrated buying to accumulate, then gradually pushing higher while volume tapers off. This isn’t a healthy rotation structure—it’s more like holders are rationing supply (low willingness to sell) and new capital’s willingness to enter is decreasing.
What I care about more is the market cap rank #521, with a market cap of $38.65M. For coins of this size, once liquidity breaks down, intraday drawdowns can wipe out a week’s gains. And missing 30-day data means you can’t determine where the support level was in the prior cycle—the whole price “foundation” is basically hanging in the air.
My view becomes invalidation is simple: if over the next 2–3 days the trading volume climbs back above $10M, and the price finds support in the $0.04–$0.045 range (the low on July 26), then this bullish candle could be a launch signal rather than a peak driven by emotions. Try testing it with this framework—you don’t need to take a side immediately; just watch these two metrics.
What’s really happening on the chart: On July 15 it was still at $0.011, on July 17 it briefly got dumped to $0.0044, and then over the following seven days it rallied +10x from the bottom. Trading volume expanded from 620K to today’s $7M, but the peak volume occurred on July 22 at $24M. The flow timing is: first concentrated buying to accumulate, then gradually pushing higher while volume tapers off. This isn’t a healthy rotation structure—it’s more like holders are rationing supply (low willingness to sell) and new capital’s willingness to enter is decreasing.
What I care about more is the market cap rank #521, with a market cap of $38.65M. For coins of this size, once liquidity breaks down, intraday drawdowns can wipe out a week’s gains. And missing 30-day data means you can’t determine where the support level was in the prior cycle—the whole price “foundation” is basically hanging in the air.
My view becomes invalidation is simple: if over the next 2–3 days the trading volume climbs back above $10M, and the price finds support in the $0.04–$0.045 range (the low on July 26), then this bullish candle could be a launch signal rather than a peak driven by emotions. Try testing it with this framework—you don’t need to take a side immediately; just watch these two metrics.
Log in to explore more content
Join global crypto users on Binance Square
⚡️ Get latest and useful information about crypto.
💬 Trusted by the world’s largest crypto exchange.
👍 Discover real insights from verified creators.
Email / Phone number
Trending Topics
1
#BinanceIncidentReport
84,394 views
798 Discussing
2
#BinanceReopensWithdrawalsForMoreAssets
218,909 views
1,944 Discussing
3
#BinanceHourlyDepositsExceedWithdrawals
98,886 views
928 Discussing
4
#USMidtermElections
979,916 views
4,808 Discussing
5
#AnthropicIPOPricedDownasInvestorsEye$1.5T
5,748 views
66 Discussing
6
#USOctoberNFP-AreRateCutsStillPossible
184,342 views
1,385 Discussing
7
#AppleReportsMixedResults
85,192 views
1,026 Discussing
8
#PalantirSlides3PercentOn$2BRevenue
7,517 views
51 Discussing
9
#FrenchAssemblyRejectsTwoCryptoExitTaxProposals
18,581 views
216 Discussing
10
#Nasdaq100EntersCorrection
20,872 views
223 Discussing