

#42usdt
42usdt
62,738 views
222 Discussing
Hot
Latest


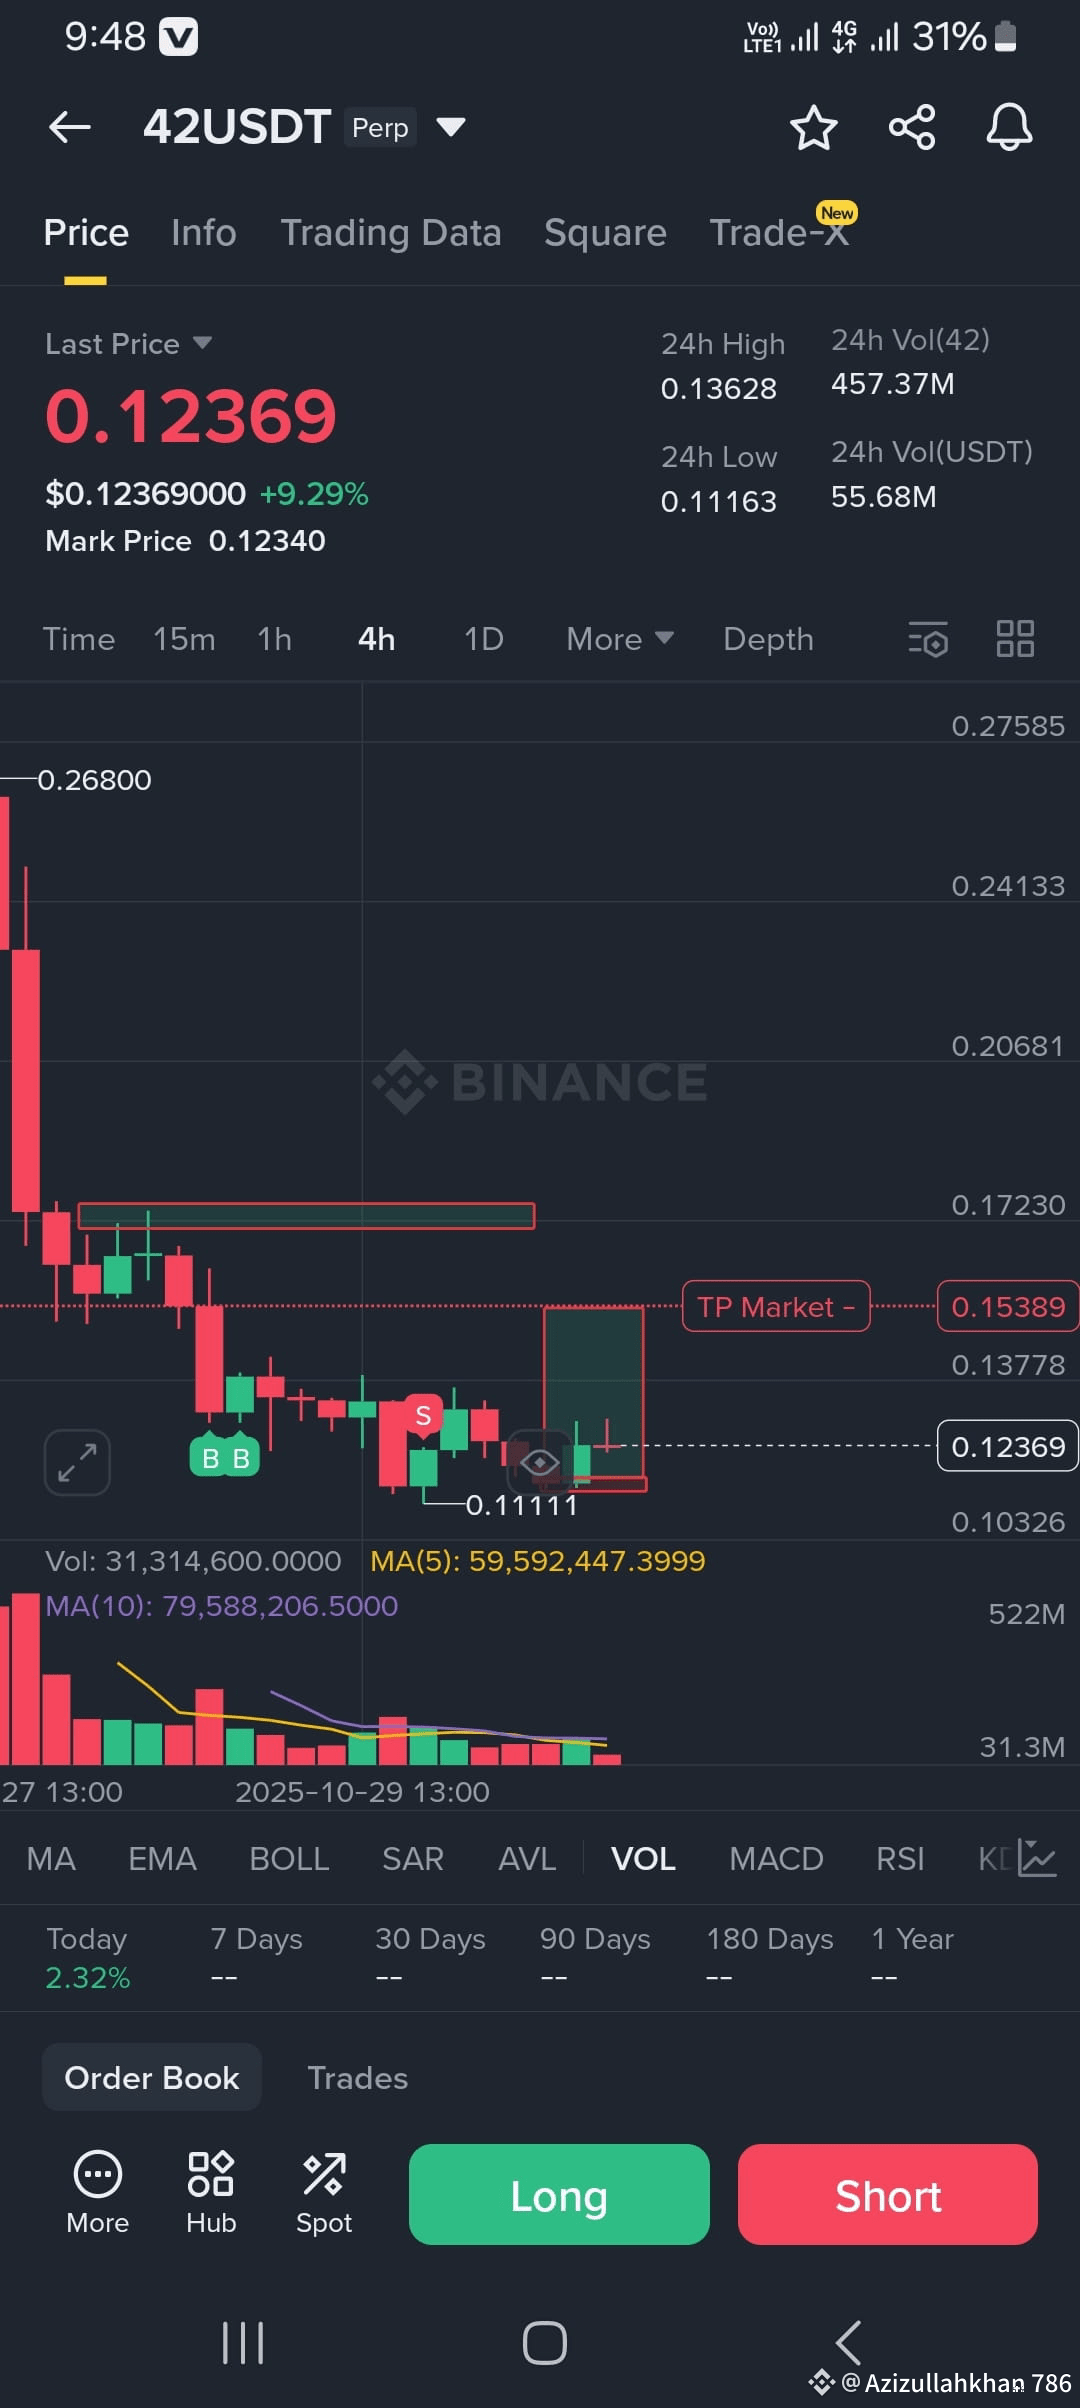
# #42USDT take profit take profit 0.15 brother do it brother do it quickly brother do it quickly brother do it quickly brother do it quickly go up brother do it quickly go up brother do it quickly go up 15 brother do it quickly go up 15 until
# #42USDT take profit take profit 0.15 brother do it brother do it quickly brother do it quickly brother do it quickly brother do it quickly go up brother do it quickly go up brother do it quickly go up 15 brother do it quickly go up 15 until
21

·
--
Once it exceeds em a 2 0 0, it can rise and fall more, embrace the profits, brothers #42USDT
Once it exceeds em a 2 0 0, it can rise and fall more, embrace the profits, brothers #42USDT
22

·
--
Bearish
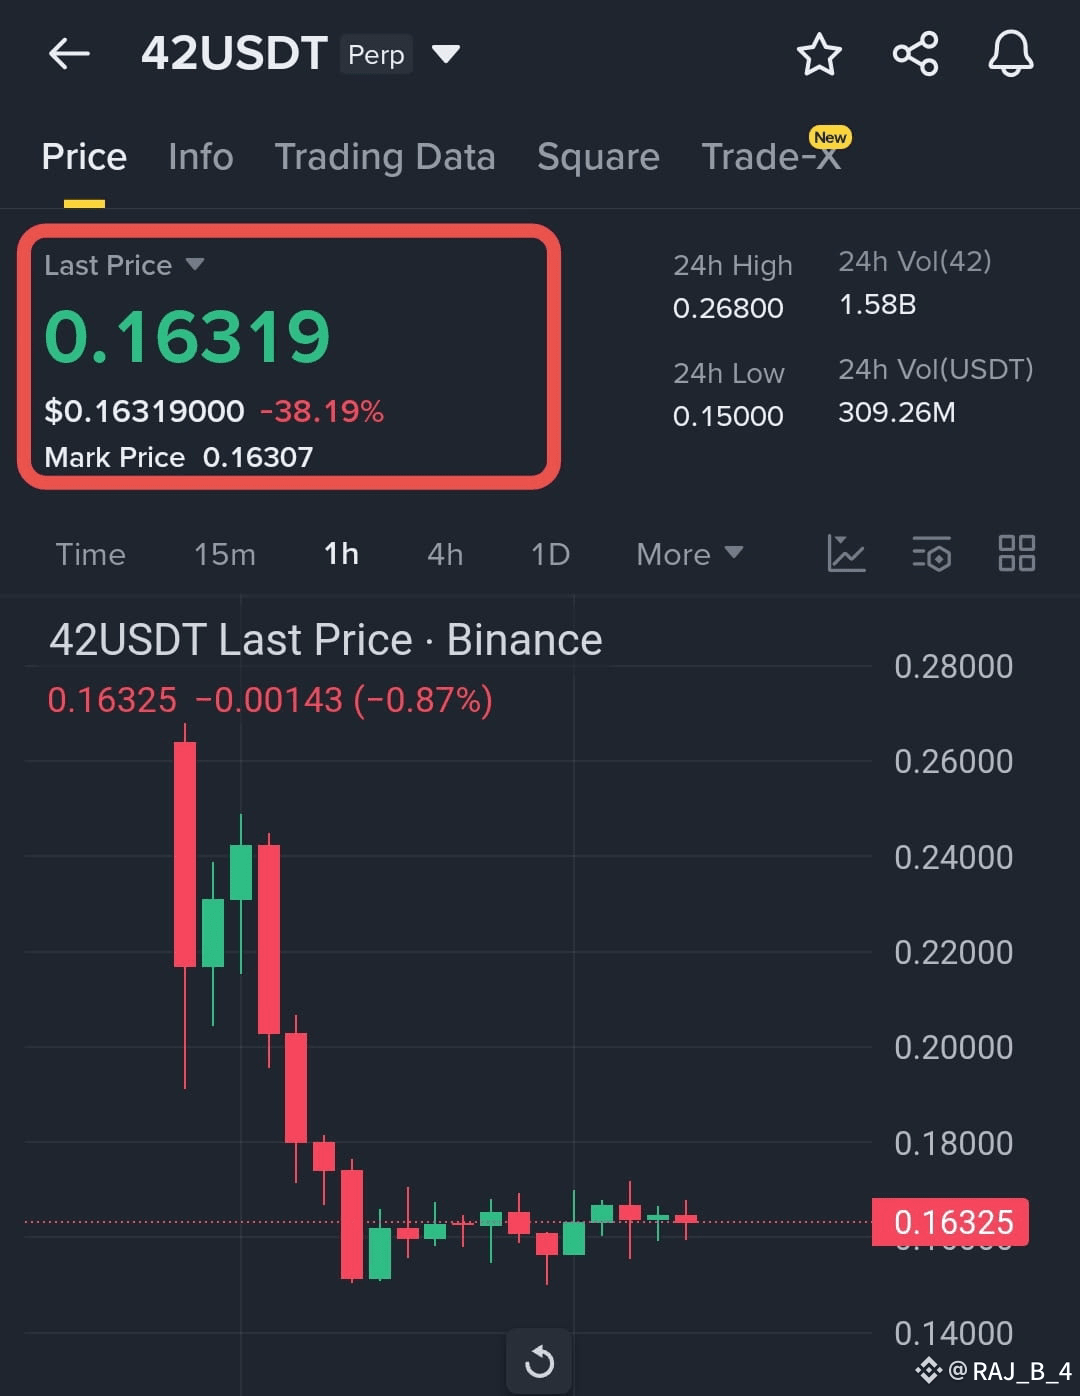
🚨 $42 / USDT — BEARS STILL IN COMMAND! ⚠️
Current Price: $0.1631 (-38.19%)
After a massive selloff from the $0.26 zone, 42USDT remains under heavy bearish pressure, struggling to recover above key resistance levels. Momentum is weak, and sellers are maintaining dominance with consistent lower highs.
📉 Short Trade Setup (Bearish Signal):
🔻 Entry Zone: $0.1650 – $0.1680
🎯 Target 1: $0.1550
🎯 Target 2: $0.1480
🛡️ Stop Loss: $0.1765
📊 Market Outlook:
The chart shows clear distribution and exhaustion from buyers. Until the price reclaims $0.175 with volume confirmation, the downtrend remains intact. A break below $0.1600 could trigger another sharp leg down.
#42USDT #CryptoTrading #ShortSetup #BearishTrend #BinanceFutures
461


·
--
#BinanceFutures Will Delist Multiple USDⓈ-M Perpetual Contracts (2026-01-30) 09:00 (UTC)
#CUDISUSDT
#42USDT
#COMMONUSDT
#EPTUSDT
The contracts will be delisted after the settlement is complete.
$42 $COMMON $EPT
#BinanceFutures Will Delist Multiple USDⓈ-M Perpetual Contracts (2026-01-30) 09:00 (UTC)
#CUDISUSDT
#42USDT
#COMMONUSDT
#EPTUSDT
The contracts will be delisted after the settlement is complete.
$42 $COMMON $EPT
#CUDISUSDT
#42USDT
#COMMONUSDT
#EPTUSDT
The contracts will be delisted after the settlement is complete.
$42 $COMMON $EPT
2
912

·
--
When the market is fearful, it's time to act. This time I want to get the last #42USDT .
When the market is fearful, it's time to act. This time I want to get the last #42USDT .
35

·
--
Bullish

1
549


·
--
Bearish
🖕🏻🖕🏻🚨🚨
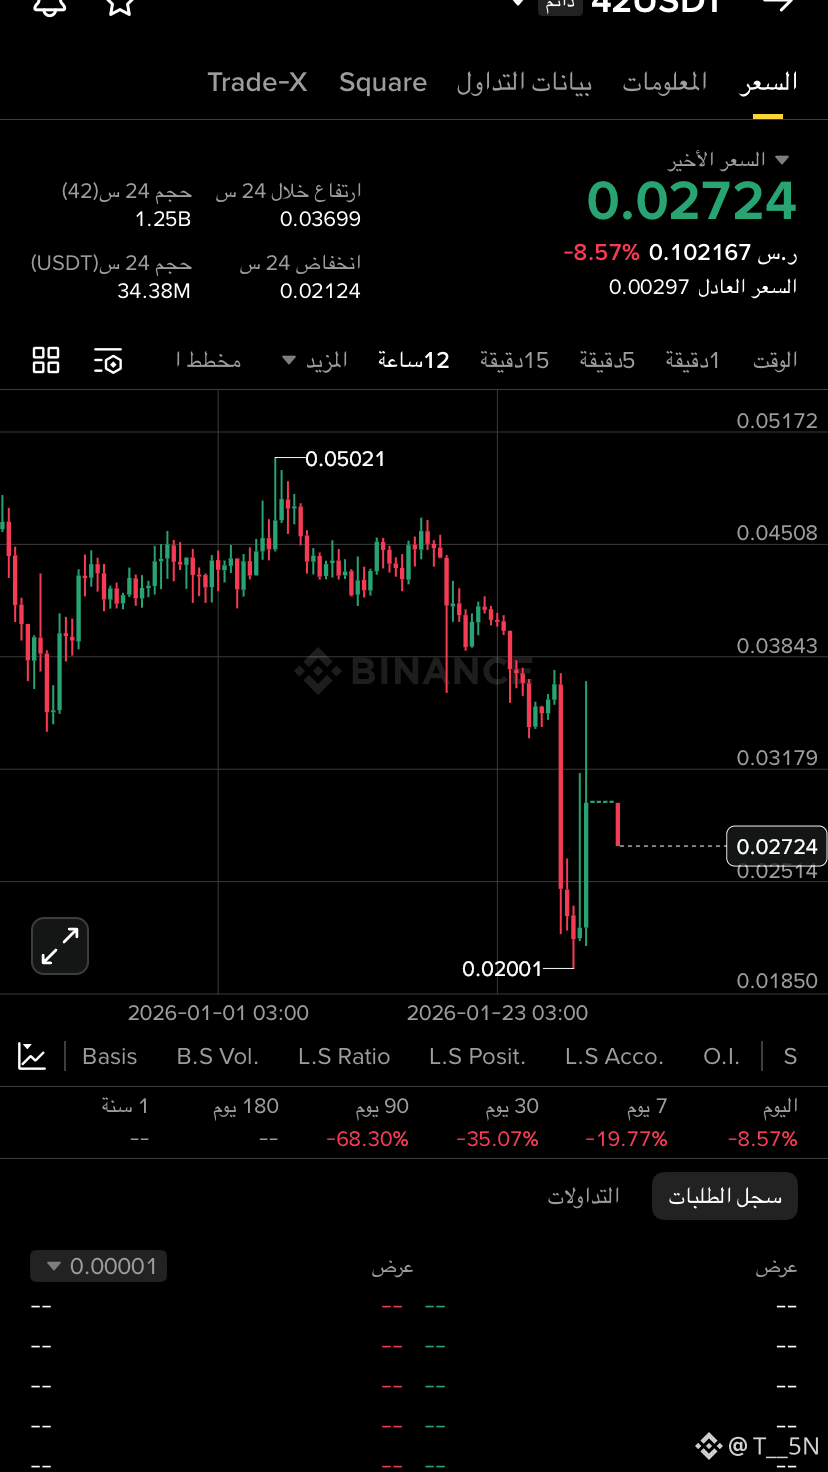
The loser who put in his trade, and its source is loss and loss, and it is said: I lost his trade, that is, he lost in it, and I won any profit in it. And a losing deal: not winning, and a losing ball: useless.
#42USDT #bad #D #WhenWillBTCRebound #PreciousMetalsTurbulence
🖕🏻🖕🏻🚨🚨
The loser who put in his trade, and its source is loss and loss, and it is said: I lost his trade, that is, he lost in it, and I won any profit in it. And a losing deal: not winning, and a losing ball: useless.
#42USDT #bad #D #WhenWillBTCRebound #PreciousMetalsTurbulence
The loser who put in his trade, and its source is loss and loss, and it is said: I lost his trade, that is, he lost in it, and I won any profit in it. And a losing deal: not winning, and a losing ball: useless.
#42USDT #bad #D #WhenWillBTCRebound #PreciousMetalsTurbulence
512

$42 USDT 4H Market Update
The 4-hour chart is still showing a clear bearish trend — EMA7, EMA25, and EMA99 are all stacked downward, and the price continues to trade below the short-term EMA.
RSI remains weak and the recent bounce has low momentum, meaning sellers are still in control. As long as the price doesn’t break above the 0.0618 resistance, the downtrend bias stays valid.
Key Levels
• TP1: 0.05650
• TP2: 0.05530
• SL: 0.06180
Trading safely with clear targets. 📊✨
#FuturesTrading #BearishTrend #42USDT #BinanceSquare
1
549
·
--
Ended hitting sl in this trade don't worry I'll post recovery trade soon!
#42USDT
Ended hitting sl in this trade don't worry I'll post recovery trade soon!
#42USDT
#42USDT

1.1k


·
--
Bullish
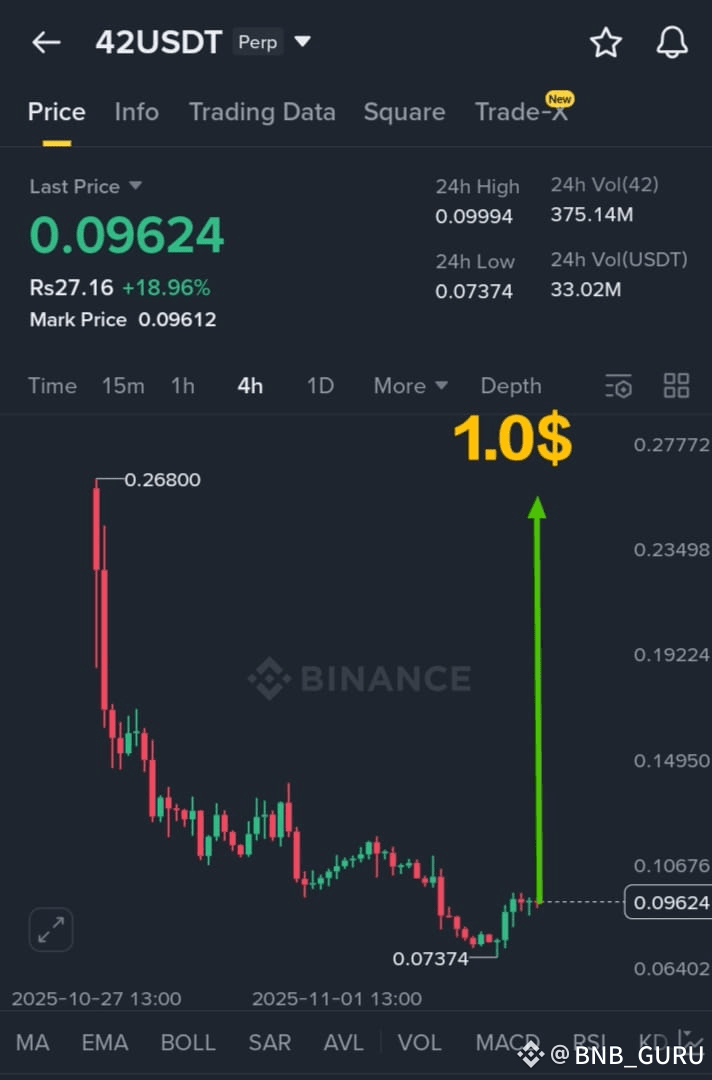
$42 USDT LONG 🚀
Chart looks absolutely beautiful — strong reversal setup forming! 📈
Don’t miss this opportunity, a massive move is coming soon 🔥
Target 🎯:0.15_0.25_0.40_0.60_ $1.0
This could be the next big runner! 🚀
#42USDT #Binance #CryptoTrading #AlphaScalps
$42 USDT LONG 🚀
Chart looks absolutely beautiful — strong reversal setup forming! 📈
Don’t miss this opportunity, a massive move is coming soon 🔥
Target 🎯:0.15_0.25_0.40_0.60_ $1.0
This could be the next big runner! 🚀
#42USDT #Binance #CryptoTrading #AlphaScalps
Chart looks absolutely beautiful — strong reversal setup forming! 📈
Don’t miss this opportunity, a massive move is coming soon 🔥
Target 🎯:0.15_0.25_0.40_0.60_ $1.0
This could be the next big runner! 🚀
#42USDT #Binance #CryptoTrading #AlphaScalps
8
4.4k

·
--
Bullish
#42USDT guys make it long earn goof profit.
#42USDT guys make it long earn goof profit.
13


Sourced by user sharing on Binance
1
4
1.6k

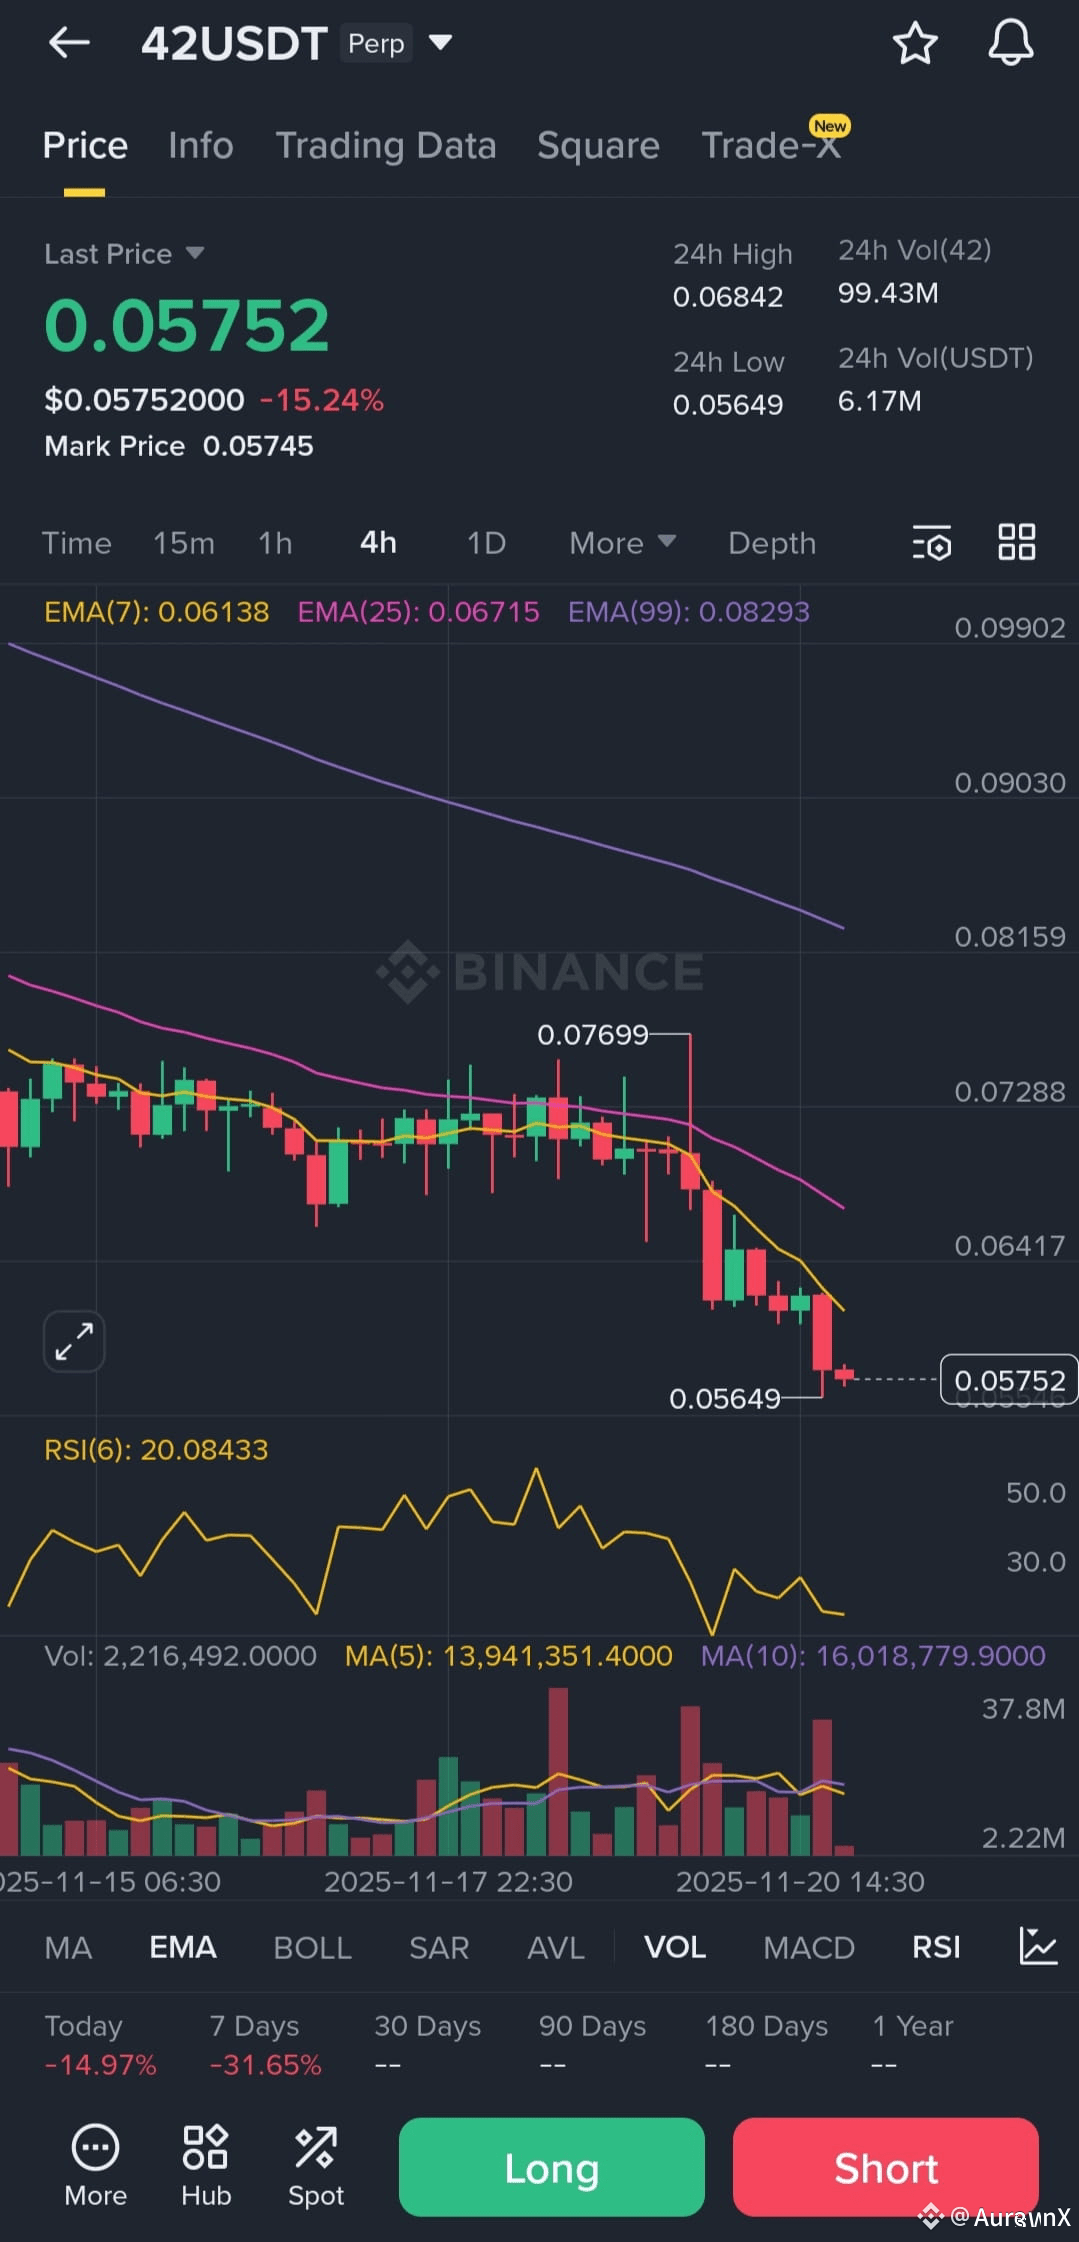
$42 – 4H Chart Analysis
Price is trading below EMA(7), EMA(25), and EMA(99).
All EMAs are sloping downward → strong bearish trend.
Price can’t even reclaim EMA(7), which means momentum is heavily bearish.
RSI (6)
RSI ≈ 20
Deep in the oversold zone, meaning the market is extremely weak.
Oversold can cause a small bounce, but the trend is still bearish.
Clear lower highs + lower lows.
Price broke the support around 0.05649, showing bearish continuation.
Volume
Most of the recent spikes are sell volume, not buy volume.
That supports downtrend continuation.
🔴 Short Position — Higher Probability
Entry : 0.058 - 0.059
SL : 0.061 - 0.062
TP1: 0.055
TP2: 0.052
TP3: 0.048
Based on trend + EMA rejections + structure, short is the safer and stronger setup.
A long position right now is only a counter-trend bounce (not safe).
Only consider long IF:
Price forms a double-bottom near 0.05650
RSI shows bullish divergence
🟢Long Setup = High Risk
SL: 0.05530
TP: 0.059 – 0.063
#42USDT #FutureTarding #BinanceSquareFamily
2
485
Log in to explore more content
Join global crypto users on Binance Square
⚡️ Get latest and useful information about crypto.
💬 Trusted by the world’s largest crypto exchange.
👍 Discover real insights from verified creators.
Email / Phone number
Trending Topics
1
#CanMicrosoftDeliverOnAI
630,153 views
4,164 Discussing
2
#CanGoogleDefindItsCore
387,555 views
2,940 Discussing
3
#FedWatch
16.1M views
37,263 Discussing
4
#BitcoinCore32.1RaisesPeerConnectionLimit
3,282 views
119 Discussing
5
#RussiaPlansStandardizedTestForCryptoInvestors
3 views
8 Discussing
6
#EarningsSeason
6.1M views
30,358 Discussing
7
#BitcoinCoreIdentifiesThreeVulnerabilities
13,695 views
291 Discussing
8
#RippleExpects$900MAnnualizedProductRevenueRunRate
1,566 views
10 Discussing
9
#GoogleToPreviewCryptoCustodySecuritySystem
4,155 views
108 Discussing
10
#FedToBeginShrinkingRateSettingCalendarIn2027
4,959 views
63 Discussing