
#2026rally
2026rally
1,893 views
13 Discussing
Hot
Latest

#solana #sol #2026Rally
☀️ SOLANA LEADS THE MARKET WITH +7.79% DAILY: Breaks $109 with over $509M in volume 🚀🔥
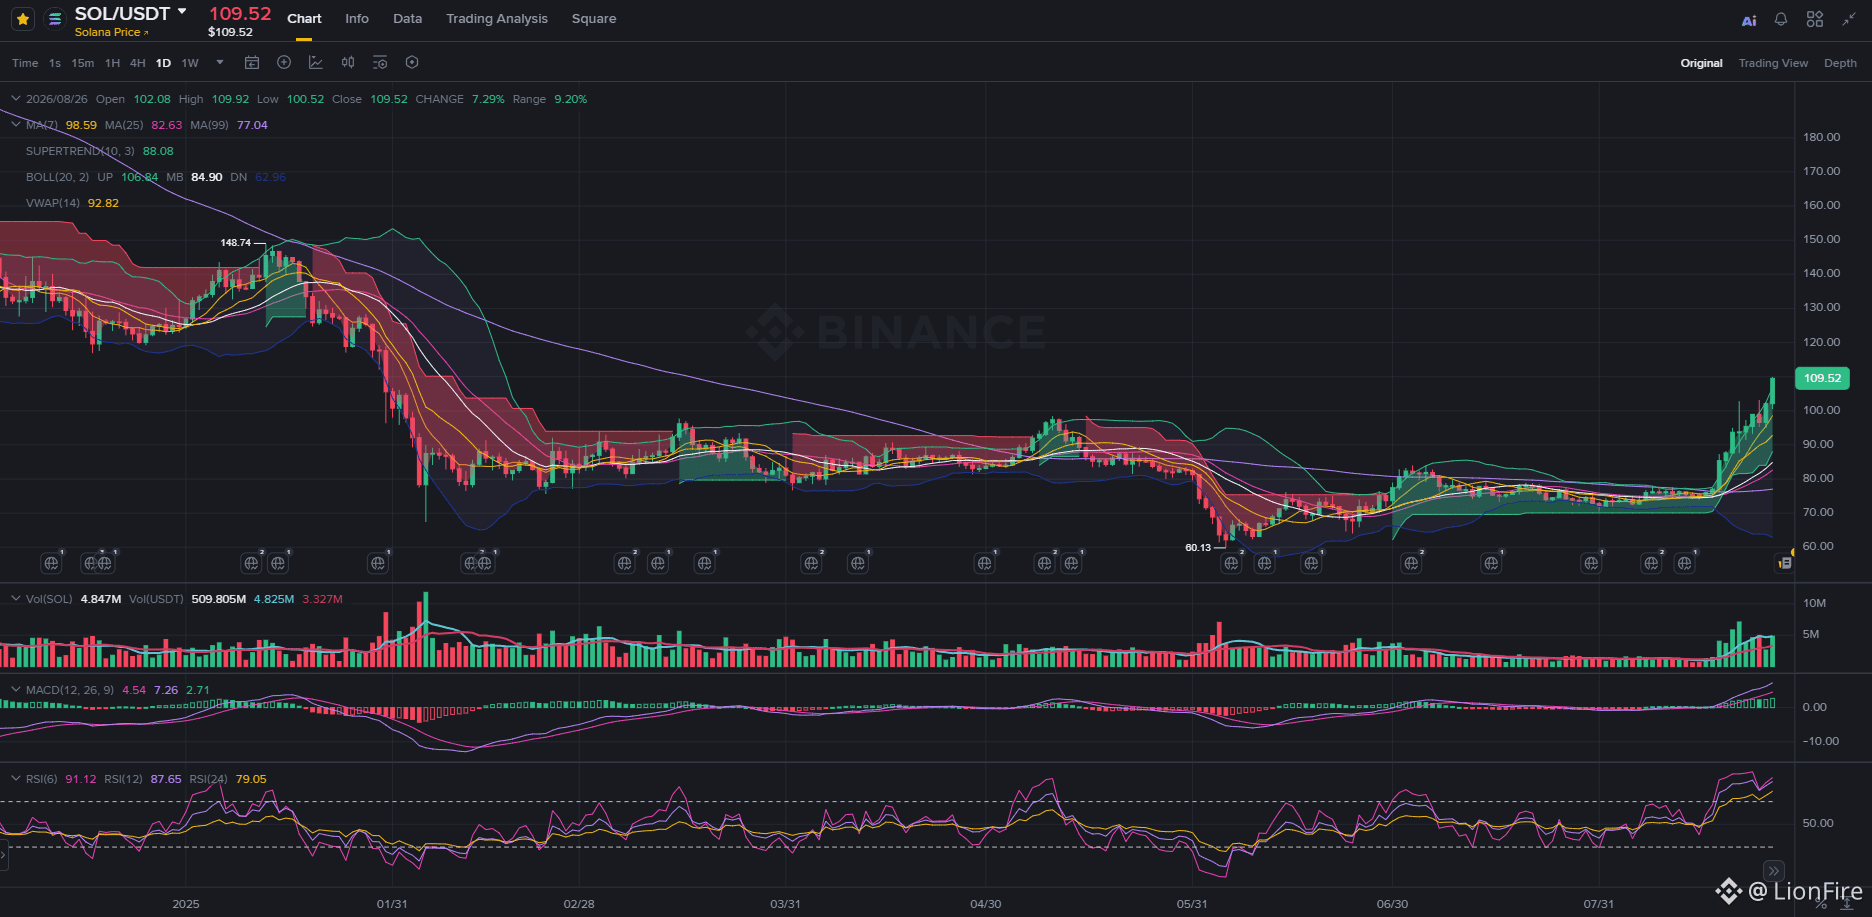
Today’s session consolidates $SOL as the asset with the strongest relative performance in the market. In a flawless trading day, the price surged from the $100.52 base to hit a high of $109.92, supported by a massive inflow of liquidity exceeding $509.8M USDT traded in 24 hours.
📊 1. Technical rundown on the Daily chart:
🚀 Breakout of the Upper Band: The daily candle decisively pierced the upper Bollinger Band ($108.24), confirming a shift in regime toward a vertically expanding phase and leaving behind the long-term accumulation range.
🧱 Moving average alignment: The price strongly distances itself from the MA7 ($98.59), the VWAP ($92.82), the MA25 ($82.63), and the MA99 ($77.04). The entire dynamic structure now acts as a structural support cushion.
🟢 Hardened Supertrend: The daily indicator remains in a buy zone at $88.08, validating that the medium-term trend shows no signs of structural exhaustion.
⚡ 2. Momentum and Oscillators:
📈 MACD in expansion: The bullish histogram extends its positive run (+2.71), confirming the strength of buying momentum.
🔥 High-intensity overbought: RSI(6) reads 91.12, RSI(12) is at 87.65, and RSI(24) at 79.05, reflecting aggressive buying by institutional hands.
🎯 Key levels to monitor:
🛡️ The psychological level of $104.00 - $105.00 and the MA7 zone ($98.59).
🚀 Projection: Consolidating the daily close above $110.00 will clear the way to seek the next larger target in the historical resistance area of $130.00 - $148.00.
💡Solana reaffirms its starring role in this cycle. With oscillators at extreme overbought levels, the smart strategy is not to chase green candles for momentum, but to secure profits with Trailing Stops and monitor absorption on pullbacks.
☀️ SOLANA LEADS THE MARKET WITH +7.79% DAILY: Breaks $109 with over $509M in volume 🚀🔥
Today’s session consolidates $SOL as the asset with the strongest relative performance in the market. In a flawless trading day, the price surged from the $100.52 base to hit a high of $109.92, supported by a massive inflow of liquidity exceeding $509.8M USDT traded in 24 hours.
📊 1. Technical rundown on the Daily chart:
🚀 Breakout of the Upper Band: The daily candle decisively pierced the upper Bollinger Band ($108.24), confirming a shift in regime toward a vertically expanding phase and leaving behind the long-term accumulation range.
🧱 Moving average alignment: The price strongly distances itself from the MA7 ($98.59), the VWAP ($92.82), the MA25 ($82.63), and the MA99 ($77.04). The entire dynamic structure now acts as a structural support cushion.
🟢 Hardened Supertrend: The daily indicator remains in a buy zone at $88.08, validating that the medium-term trend shows no signs of structural exhaustion.
⚡ 2. Momentum and Oscillators:
📈 MACD in expansion: The bullish histogram extends its positive run (+2.71), confirming the strength of buying momentum.
🔥 High-intensity overbought: RSI(6) reads 91.12, RSI(12) is at 87.65, and RSI(24) at 79.05, reflecting aggressive buying by institutional hands.
🎯 Key levels to monitor:
🛡️ The psychological level of $104.00 - $105.00 and the MA7 zone ($98.59).
🚀 Projection: Consolidating the daily close above $110.00 will clear the way to seek the next larger target in the historical resistance area of $130.00 - $148.00.
💡Solana reaffirms its starring role in this cycle. With oscillators at extreme overbought levels, the smart strategy is not to chase green candles for momentum, but to secure profits with Trailing Stops and monitor absorption on pullbacks.
Log in to explore more content