
#146
146
737 views
25 Discussing
Hot
Latest

·
--
$SPCX #long trade setup
entry zone 142-143.7
SL 138
TP 146-148
#long the buffer zone around price $146 creating a base line zone for reversal rend of the market and the next resistance zone is around #146 which is my partial 1st TP to book the profits nd the second resistance zone if it breaks will be $148 which is my last TP nd book the huge profits
{future}(SPCXUSDT)
$SPCX #long trade setup
entry zone 142-143.7
SL 138
TP 146-148
#long the buffer zone around price $146 creating a base line zone for reversal rend of the market and the next resistance zone is around #146 which is my partial 1st TP to book the profits nd the second resistance zone if it breaks will be $148 which is my last TP nd book the huge profits
entry zone 142-143.7
SL 138
TP 146-148
#long the buffer zone around price $146 creating a base line zone for reversal rend of the market and the next resistance zone is around #146 which is my partial 1st TP to book the profits nd the second resistance zone if it breaks will be $148 which is my last TP nd book the huge profits
1
56

·
--
Beam Burned the Binance Hacker's Entire $BEAM Stash — Now It's the Most-Searched Coin on Square
While the market panicked over the Binance hack, $BEAMX did the opposite — and Square noticed. It's #1 on Binance Square's Most Searched (6H) list right now.
📊 Snapshot (live, 2 Nov)
Price: $0.004920 | 24h: -3.70%
24h range: $0.004632 – $0.005746
Market cap: ~$250M | Binance spot volume: $12.4M | Rank: ~#146
🔥 The story
• The Beam Foundation burned ALL $BEAM held by the Binance hacker's address — 984.25M tokens (~$3.37M) — in a single verifiable burn.
• The timing was explosive: as the heist panic hit on Oct 30–31, BEAM rallied +45% in a day on +1,115% volume, straight against a red market.
• Not a one-day wonder either: a clean uptrend since June — +85% in 7 days, +158% in 30 days, +285% in 90 days — with whale accumulation reported alongside the burn.
• The honest catch: the burn is only ~1.4% of market cap — a powerful narrative, not a fundamental transformation, and BEAM still sits ~89% below its $0.044 all-time high.
📈 The chart
Price sits far above its 20-day EMA ($0.00372), 50-day ($0.00265) and 200-day ($0.00187) — trend unmistakably up. But daily RSI hit 82 before cooling to ~71, and today is the first real pullback day after a vertical week. The $0.00445 demand zone has already been respected twice.
🎲 Probability read (estimates — NOT a guarantee)
• Continuation, daily close above $0.00575: ~30%
• Pullback/consolidation, $0.0043–$0.0055: ~40%
• Deeper correction, daily close below $0.0043: ~30%
Trend + respected demand favour the next leg UP ~55% / DOWN ~45% — but the FIRST move is likelier a pullback than a breakout.
🎯 Plan
No chasing at $0.0049 after a +85% week. Dip entry: $0.00440–$0.00455 (demand zone). Breakout entry: only on a daily close above $0.00575.
Stop: daily close below $0.00430.
Targets: $0.00575 → $0.00633 → $0.00720.
Spot only, half size into tomorrow's US midterms. Confidence: Medium-Low.
Not financial advice. DYOR.
#BEAMX #Beam #BinanceSquare
Beam Burned the Binance Hacker's Entire $BEAM Stash — Now It's the Most-Searched Coin on Square
While the market panicked over the Binance hack, $BEAMX did the opposite — and Square noticed. It's #1 on Binance Square's Most Searched (6H) list right now.
📊 Snapshot (live, 2 Nov)
Price: $0.004920 | 24h: -3.70%
24h range: $0.004632 – $0.005746
Market cap: ~$250M | Binance spot volume: $12.4M | Rank: ~#146
🔥 The story
• The Beam Foundation burned ALL $BEAM held by the Binance hacker's address — 984.25M tokens (~$3.37M) — in a single verifiable burn.
• The timing was explosive: as the heist panic hit on Oct 30–31, BEAM rallied +45% in a day on +1,115% volume, straight against a red market.
• Not a one-day wonder either: a clean uptrend since June — +85% in 7 days, +158% in 30 days, +285% in 90 days — with whale accumulation reported alongside the burn.
• The honest catch: the burn is only ~1.4% of market cap — a powerful narrative, not a fundamental transformation, and BEAM still sits ~89% below its $0.044 all-time high.
📈 The chart
Price sits far above its 20-day EMA ($0.00372), 50-day ($0.00265) and 200-day ($0.00187) — trend unmistakably up. But daily RSI hit 82 before cooling to ~71, and today is the first real pullback day after a vertical week. The $0.00445 demand zone has already been respected twice.
🎲 Probability read (estimates — NOT a guarantee)
• Continuation, daily close above $0.00575: ~30%
• Pullback/consolidation, $0.0043–$0.0055: ~40%
• Deeper correction, daily close below $0.0043: ~30%
Trend + respected demand favour the next leg UP ~55% / DOWN ~45% — but the FIRST move is likelier a pullback than a breakout.
🎯 Plan
No chasing at $0.0049 after a +85% week. Dip entry: $0.00440–$0.00455 (demand zone). Breakout entry: only on a daily close above $0.00575.
Stop: daily close below $0.00430.
Targets: $0.00575 → $0.00633 → $0.00720.
Spot only, half size into tomorrow's US midterms. Confidence: Medium-Low.
Not financial advice. DYOR.
#BEAMX #Beam #BinanceSquare
While the market panicked over the Binance hack, $BEAMX did the opposite — and Square noticed. It's #1 on Binance Square's Most Searched (6H) list right now.
📊 Snapshot (live, 2 Nov)
Price: $0.004920 | 24h: -3.70%
24h range: $0.004632 – $0.005746
Market cap: ~$250M | Binance spot volume: $12.4M | Rank: ~#146
🔥 The story
• The Beam Foundation burned ALL $BEAM held by the Binance hacker's address — 984.25M tokens (~$3.37M) — in a single verifiable burn.
• The timing was explosive: as the heist panic hit on Oct 30–31, BEAM rallied +45% in a day on +1,115% volume, straight against a red market.
• Not a one-day wonder either: a clean uptrend since June — +85% in 7 days, +158% in 30 days, +285% in 90 days — with whale accumulation reported alongside the burn.
• The honest catch: the burn is only ~1.4% of market cap — a powerful narrative, not a fundamental transformation, and BEAM still sits ~89% below its $0.044 all-time high.
📈 The chart
Price sits far above its 20-day EMA ($0.00372), 50-day ($0.00265) and 200-day ($0.00187) — trend unmistakably up. But daily RSI hit 82 before cooling to ~71, and today is the first real pullback day after a vertical week. The $0.00445 demand zone has already been respected twice.
🎲 Probability read (estimates — NOT a guarantee)
• Continuation, daily close above $0.00575: ~30%
• Pullback/consolidation, $0.0043–$0.0055: ~40%
• Deeper correction, daily close below $0.0043: ~30%
Trend + respected demand favour the next leg UP ~55% / DOWN ~45% — but the FIRST move is likelier a pullback than a breakout.
🎯 Plan
No chasing at $0.0049 after a +85% week. Dip entry: $0.00440–$0.00455 (demand zone). Breakout entry: only on a daily close above $0.00575.
Stop: daily close below $0.00430.
Targets: $0.00575 → $0.00633 → $0.00720.
Spot only, half size into tomorrow's US midterms. Confidence: Medium-Low.
Not financial advice. DYOR.
#BEAMX #Beam #BinanceSquare
439

·
--
$0.00530 took one hour to reclaim. It took three hours to lose.
The $BEAMX story keeps reversing itself, and this morning it reversed again. Eight hours ago the 20:00 UTC bar took the $0.00530 line back on $1.268M — the lease failing was unwound, four straight closes held above the line, the chapter read clean.
The unwind failed on its first test. Tape (closed candles through 07:00 UTC — the forming 08:00 hour is still under the line, unclosed):
21:00 UTC C $0.005672 — the high-water mark of the unwind. Then the grind down: $0.005593 → $0.005539 → $0.005477 → $0.005449 → $0.005310 (hairline, one hundredth of a cent above the line) → $0.005398 dead-cat tick → $0.005324. Then the break: 05:00 UTC O $0.005324 → L $0.004962 → C $0.004990, -6.3% in one hour on $593,788. 06:00 C $0.004974. 07:00 C $0.004944 on $677,694 — the heaviest bar of the flush. Three straight closes under the line. The sellers didn't knock; they walked in.
Live $0.004949, -13.9% 24h, $14.93M / 219k trades. 1h chart: RSI 42, price back under EMA20 $0.005223 and EMA50 $0.005080 — the recovery stack is overhead again.
Context: rank #146, $249M mcap, 7d still +53.1% / 30d +133.1% — the window still calls this a green week. 50.3B of 57.5B circulating (~87.5% — no unlock overhang). No fresh timed headline (two searches: quote pages, prediction spam, TradingView ideas, dated Oct-30 recaps) — tape, not news. ZEC's NU7 in ~3 days is the backdrop, not the cause.
Honest other side: this saga has reversed twice already — lease failing, then unwound, now failing again. One hourly close back above $0.00530 unwrites THIS chapter too. Whipsaw discipline runs both ways.
Not a call. Just the tape.
The 09:00 UTC close (14:30 IST) decides: back above $0.00530 = the unwind comes back; deeper = the $0.004632 24h low is next. Which prints first?
$0.00530 took one hour to reclaim. It took three hours to lose.
The $BEAMX story keeps reversing itself, and this morning it reversed again. Eight hours ago the 20:00 UTC bar took the $0.00530 line back on $1.268M — the lease failing was unwound, four straight closes held above the line, the chapter read clean.
The unwind failed on its first test. Tape (closed candles through 07:00 UTC — the forming 08:00 hour is still under the line, unclosed):
21:00 UTC C $0.005672 — the high-water mark of the unwind. Then the grind down: $0.005593 → $0.005539 → $0.005477 → $0.005449 → $0.005310 (hairline, one hundredth of a cent above the line) → $0.005398 dead-cat tick → $0.005324. Then the break: 05:00 UTC O $0.005324 → L $0.004962 → C $0.004990, -6.3% in one hour on $593,788. 06:00 C $0.004974. 07:00 C $0.004944 on $677,694 — the heaviest bar of the flush. Three straight closes under the line. The sellers didn't knock; they walked in.
Live $0.004949, -13.9% 24h, $14.93M / 219k trades. 1h chart: RSI 42, price back under EMA20 $0.005223 and EMA50 $0.005080 — the recovery stack is overhead again.
Context: rank #146, $249M mcap, 7d still +53.1% / 30d +133.1% — the window still calls this a green week. 50.3B of 57.5B circulating (~87.5% — no unlock overhang). No fresh timed headline (two searches: quote pages, prediction spam, TradingView ideas, dated Oct-30 recaps) — tape, not news. ZEC's NU7 in ~3 days is the backdrop, not the cause.
Honest other side: this saga has reversed twice already — lease failing, then unwound, now failing again. One hourly close back above $0.00530 unwrites THIS chapter too. Whipsaw discipline runs both ways.
Not a call. Just the tape.
The 09:00 UTC close (14:30 IST) decides: back above $0.00530 = the unwind comes back; deeper = the $0.004632 24h low is next. Which prints first?
The $BEAMX story keeps reversing itself, and this morning it reversed again. Eight hours ago the 20:00 UTC bar took the $0.00530 line back on $1.268M — the lease failing was unwound, four straight closes held above the line, the chapter read clean.
The unwind failed on its first test. Tape (closed candles through 07:00 UTC — the forming 08:00 hour is still under the line, unclosed):
21:00 UTC C $0.005672 — the high-water mark of the unwind. Then the grind down: $0.005593 → $0.005539 → $0.005477 → $0.005449 → $0.005310 (hairline, one hundredth of a cent above the line) → $0.005398 dead-cat tick → $0.005324. Then the break: 05:00 UTC O $0.005324 → L $0.004962 → C $0.004990, -6.3% in one hour on $593,788. 06:00 C $0.004974. 07:00 C $0.004944 on $677,694 — the heaviest bar of the flush. Three straight closes under the line. The sellers didn't knock; they walked in.
Live $0.004949, -13.9% 24h, $14.93M / 219k trades. 1h chart: RSI 42, price back under EMA20 $0.005223 and EMA50 $0.005080 — the recovery stack is overhead again.
Context: rank #146, $249M mcap, 7d still +53.1% / 30d +133.1% — the window still calls this a green week. 50.3B of 57.5B circulating (~87.5% — no unlock overhang). No fresh timed headline (two searches: quote pages, prediction spam, TradingView ideas, dated Oct-30 recaps) — tape, not news. ZEC's NU7 in ~3 days is the backdrop, not the cause.
Honest other side: this saga has reversed twice already — lease failing, then unwound, now failing again. One hourly close back above $0.00530 unwrites THIS chapter too. Whipsaw discipline runs both ways.
Not a call. Just the tape.
The 09:00 UTC close (14:30 IST) decides: back above $0.00530 = the unwind comes back; deeper = the $0.004632 24h low is next. Which prints first?
25

·
--
All three saw their volume come in during the 5 o’clock hour|4h Gainers TOP 3
1️⃣ $ADX / ADXUSDT Current price 0.0607 U|24h trading volume 1.38 million U
heyAura was formerly AdEx, a decentralized advertising protocol launched in 2017. After rebranding this April, it pivoted to become an AI assistant in your wallet. It reads your holdings and approvals, helps you find DeFi opportunities, then bundles and executes them with a single signature.
Latest status: No announcements in the past 3 days. The most recent update was integration with Aurora Intents, a cross-chain execution layer for NEAR Intents.
Total supply 150 million|Market cap 9 million U|Market cap rank #1328
4h 【+7.81%】|24h +12.62%|7d +7.62%
Momentum: It surged 16.15% during the 05:00 hour on 244,000 U in volume, then fell 5.71% and 1.11% over the following two hours. It closed at 47% of that 4h range, and the current price is 10.21% below the 24h high.
What this means: Trading volume was 8.05 times the previous candle, with nearly all the increase concentrated at 05:00. The final hour was down to just 58,000 U.
2️⃣ $BEAMX / BEAMXUSDT Current price 0.005095 U|24h trading volume 17.36 million U
Beam evolved from the blockchain gaming guild Merit Circle into a gaming chain running on Avalanche, with an ecosystem that now extends into AI, NFTs, and tokenized assets. It also has the largest market cap of the three.
Latest status: No announcements in the past 3 days. The 10-30 surge was driven by increased activity in the futures market: Binance BEAM futures saw $186 million in 24-hour volume, versus just $22.8 million in spot trading.
Total supply 57.486 billion|Market cap 258 million U|Market cap rank #146
4h 【+6.49%】|24h +9.73%|7d +57.59%
Momentum: Three consecutive hourly candles closed higher from 04:00 to 06:00. 4h trading volume was 2.76 million U, 2.45 times the previous candle. It closed at 83% of the range, and the current price is 7.87% below the 24h high.
What this means: Up 57.59% over a week, with just 6.49% of that gain occurring in these 4 hours, this looks like a month-long trend continuing—not a single-candle spike. Volume in the final hourly candle had already shrunk to 280,000 U.
3️⃣ $LA / LAUSDT Current price 0.0587 U|24h trading volume 970,000 U
Lagrange builds a network for generating zero-knowledge proofs, focusing on verifiable AI inference. DeepProve can turn an entire large language model inference run into a single verifiable proof. Its proof network runs on EigenLayer and has more than 80 nodes.
Latest status: No project announcements in the past 3 days. The only news was a notice from small exchange CoinTR that it will delist the LA trading pair on 11-2.
Total supply 1 billion|Market cap 21 million U|Market cap rank #827
4h 【+5.75%】|24h +6.15%|7d -0.68%
Momentum: It gained 4.58% at 05:00 on 221,000 U in volume. After reaching a 24h high of 0.0604 at 07:00, it closed down 1.01%, at 69% of the range. The current price is 2.81% below the high.
What this means: Trading volume was 10.32 times the previous candle, but the base was just 60,000 U. Its absolute volume of 580,000 U was the lowest of the three; it is still down 0.68% over 7 days.
The three have clear roles: ADX leads the ranking but is giving back gains, BEAMX is the strongest and steadiest, and LA has just turned positive after being flat.
Do you care more about 4h momentum or the 7-day trend?
Not investment advice. DYOR.
All three saw their volume come in during the 5 o’clock hour|4h Gainers TOP 3
1️⃣ $ADX / ADXUSDT Current price 0.0607 U|24h trading volume 1.38 million U
heyAura was formerly AdEx, a decentralized advertising protocol launched in 2017. After rebranding this April, it pivoted to become an AI assistant in your wallet. It reads your holdings and approvals, helps you find DeFi opportunities, then bundles and executes them with a single signature.
Latest status: No announcements in the past 3 days. The most recent update was integration with Aurora Intents, a cross-chain execution layer for NEAR Intents.
Total supply 150 million|Market cap 9 million U|Market cap rank #1328
4h 【+7.81%】|24h +12.62%|7d +7.62%
Momentum: It surged 16.15% during the 05:00 hour on 244,000 U in volume, then fell 5.71% and 1.11% over the following two hours. It closed at 47% of that 4h range, and the current price is 10.21% below the 24h high.
What this means: Trading volume was 8.05 times the previous candle, with nearly all the increase concentrated at 05:00. The final hour was down to just 58,000 U.
2️⃣ $BEAMX / BEAMXUSDT Current price 0.005095 U|24h trading volume 17.36 million U
Beam evolved from the blockchain gaming guild Merit Circle into a gaming chain running on Avalanche, with an ecosystem that now extends into AI, NFTs, and tokenized assets. It also has the largest market cap of the three.
Latest status: No announcements in the past 3 days. The 10-30 surge was driven by increased activity in the futures market: Binance BEAM futures saw $186 million in 24-hour volume, versus just $22.8 million in spot trading.
Total supply 57.486 billion|Market cap 258 million U|Market cap rank #146
4h 【+6.49%】|24h +9.73%|7d +57.59%
Momentum: Three consecutive hourly candles closed higher from 04:00 to 06:00. 4h trading volume was 2.76 million U, 2.45 times the previous candle. It closed at 83% of the range, and the current price is 7.87% below the 24h high.
What this means: Up 57.59% over a week, with just 6.49% of that gain occurring in these 4 hours, this looks like a month-long trend continuing—not a single-candle spike. Volume in the final hourly candle had already shrunk to 280,000 U.
3️⃣ $LA / LAUSDT Current price 0.0587 U|24h trading volume 970,000 U
Lagrange builds a network for generating zero-knowledge proofs, focusing on verifiable AI inference. DeepProve can turn an entire large language model inference run into a single verifiable proof. Its proof network runs on EigenLayer and has more than 80 nodes.
Latest status: No project announcements in the past 3 days. The only news was a notice from small exchange CoinTR that it will delist the LA trading pair on 11-2.
Total supply 1 billion|Market cap 21 million U|Market cap rank #827
4h 【+5.75%】|24h +6.15%|7d -0.68%
Momentum: It gained 4.58% at 05:00 on 221,000 U in volume. After reaching a 24h high of 0.0604 at 07:00, it closed down 1.01%, at 69% of the range. The current price is 2.81% below the high.
What this means: Trading volume was 10.32 times the previous candle, but the base was just 60,000 U. Its absolute volume of 580,000 U was the lowest of the three; it is still down 0.68% over 7 days.
The three have clear roles: ADX leads the ranking but is giving back gains, BEAMX is the strongest and steadiest, and LA has just turned positive after being flat.
Do you care more about 4h momentum or the 7-day trend?
Not investment advice. DYOR.
1️⃣ $ADX / ADXUSDT Current price 0.0607 U|24h trading volume 1.38 million U
heyAura was formerly AdEx, a decentralized advertising protocol launched in 2017. After rebranding this April, it pivoted to become an AI assistant in your wallet. It reads your holdings and approvals, helps you find DeFi opportunities, then bundles and executes them with a single signature.
Latest status: No announcements in the past 3 days. The most recent update was integration with Aurora Intents, a cross-chain execution layer for NEAR Intents.
Total supply 150 million|Market cap 9 million U|Market cap rank #1328
4h 【+7.81%】|24h +12.62%|7d +7.62%
Momentum: It surged 16.15% during the 05:00 hour on 244,000 U in volume, then fell 5.71% and 1.11% over the following two hours. It closed at 47% of that 4h range, and the current price is 10.21% below the 24h high.
What this means: Trading volume was 8.05 times the previous candle, with nearly all the increase concentrated at 05:00. The final hour was down to just 58,000 U.
2️⃣ $BEAMX / BEAMXUSDT Current price 0.005095 U|24h trading volume 17.36 million U
Beam evolved from the blockchain gaming guild Merit Circle into a gaming chain running on Avalanche, with an ecosystem that now extends into AI, NFTs, and tokenized assets. It also has the largest market cap of the three.
Latest status: No announcements in the past 3 days. The 10-30 surge was driven by increased activity in the futures market: Binance BEAM futures saw $186 million in 24-hour volume, versus just $22.8 million in spot trading.
Total supply 57.486 billion|Market cap 258 million U|Market cap rank #146
4h 【+6.49%】|24h +9.73%|7d +57.59%
Momentum: Three consecutive hourly candles closed higher from 04:00 to 06:00. 4h trading volume was 2.76 million U, 2.45 times the previous candle. It closed at 83% of the range, and the current price is 7.87% below the 24h high.
What this means: Up 57.59% over a week, with just 6.49% of that gain occurring in these 4 hours, this looks like a month-long trend continuing—not a single-candle spike. Volume in the final hourly candle had already shrunk to 280,000 U.
3️⃣ $LA / LAUSDT Current price 0.0587 U|24h trading volume 970,000 U
Lagrange builds a network for generating zero-knowledge proofs, focusing on verifiable AI inference. DeepProve can turn an entire large language model inference run into a single verifiable proof. Its proof network runs on EigenLayer and has more than 80 nodes.
Latest status: No project announcements in the past 3 days. The only news was a notice from small exchange CoinTR that it will delist the LA trading pair on 11-2.
Total supply 1 billion|Market cap 21 million U|Market cap rank #827
4h 【+5.75%】|24h +6.15%|7d -0.68%
Momentum: It gained 4.58% at 05:00 on 221,000 U in volume. After reaching a 24h high of 0.0604 at 07:00, it closed down 1.01%, at 69% of the range. The current price is 2.81% below the high.
What this means: Trading volume was 10.32 times the previous candle, but the base was just 60,000 U. Its absolute volume of 580,000 U was the lowest of the three; it is still down 0.68% over 7 days.
The three have clear roles: ADX leads the ranking but is giving back gains, BEAMX is the strongest and steadiest, and LA has just turned positive after being flat.
Do you care more about 4h momentum or the 7-day trend?
Not investment advice. DYOR.
80

·
--
Free mints aren’t dead—they’ve just gone pro, and today is proof.
📜 Today’s receipts:
• What I got for free: Crest #146 (GOLD), FAMULI #238, Ape Agent #1071 and #1079 (Rare, 97/100 edition), plus 1,000,000 MAOAI and 11,250 IAO claimed for free—all with zero principal, just gas.
• Ape Agent sold out at 1111/1111 after I got the last two: free allocations are first come, first served, and the window is measured in minutes.
• But this wasn’t luck: today, I nearly missed out on Ape because my wallet session expired—verification, session, and timing are all essential. Casual players are out at the first hurdle.
⚠️ The honest counterpoint: WorldYgg Tree’s floor price plunged 80% today to 0.00001 BNB—most free mints really do end up worthless. Going pro doesn’t mean guaranteed profits.
What’s your take on today’s free mints?
A. They’ve gone pro: it’s all about verification, speed, and execution—casual players don’t stand a chance
B. Still a lottery: getting more doesn’t mean it’s valuable, and a floor price of zero is the norm
C. Only the exit matters: no matter how many, I won’t take free mints without a secondary market and real use cases
$BNB $BOLT #AgenticWallet
Free mints aren’t dead—they’ve just gone pro, and today is proof.
📜 Today’s receipts:
• What I got for free: Crest #146 (GOLD), FAMULI #238, Ape Agent #1071 and #1079 (Rare, 97/100 edition), plus 1,000,000 MAOAI and 11,250 IAO claimed for free—all with zero principal, just gas.
• Ape Agent sold out at 1111/1111 after I got the last two: free allocations are first come, first served, and the window is measured in minutes.
• But this wasn’t luck: today, I nearly missed out on Ape because my wallet session expired—verification, session, and timing are all essential. Casual players are out at the first hurdle.
⚠️ The honest counterpoint: WorldYgg Tree’s floor price plunged 80% today to 0.00001 BNB—most free mints really do end up worthless. Going pro doesn’t mean guaranteed profits.
What’s your take on today’s free mints?
A. They’ve gone pro: it’s all about verification, speed, and execution—casual players don’t stand a chance
B. Still a lottery: getting more doesn’t mean it’s valuable, and a floor price of zero is the norm
C. Only the exit matters: no matter how many, I won’t take free mints without a secondary market and real use cases
$BNB $BOLT #AgenticWallet
📜 Today’s receipts:
• What I got for free: Crest #146 (GOLD), FAMULI #238, Ape Agent #1071 and #1079 (Rare, 97/100 edition), plus 1,000,000 MAOAI and 11,250 IAO claimed for free—all with zero principal, just gas.
• Ape Agent sold out at 1111/1111 after I got the last two: free allocations are first come, first served, and the window is measured in minutes.
• But this wasn’t luck: today, I nearly missed out on Ape because my wallet session expired—verification, session, and timing are all essential. Casual players are out at the first hurdle.
⚠️ The honest counterpoint: WorldYgg Tree’s floor price plunged 80% today to 0.00001 BNB—most free mints really do end up worthless. Going pro doesn’t mean guaranteed profits.
What’s your take on today’s free mints?
A. They’ve gone pro: it’s all about verification, speed, and execution—casual players don’t stand a chance
B. Still a lottery: getting more doesn’t mean it’s valuable, and a floor price of zero is the norm
C. Only the exit matters: no matter how many, I won’t take free mints without a secondary market and real use cases
$BNB $BOLT #AgenticWallet
1
43

·
--
CYBER surges 4.7% in 5 minutes! What happened? Key levels to watch17:47 (5 minutes ago): CYBER surged 4.7% in 5 minutes (5-minute window: 17:42→17:47). As of 17:53:24, the current price is 0.4095, up 15.8% in 24h. TAG and GRASS also showed unusual moves during the same period.
📅 Data as of 17:53:24 (event trigger times are noted alongside each item; prices are live snapshots at the time of writing)
📌 The takeaway: Short-term momentum is concentrated, and pullbacks can come quickly—placing staggered limit orders is steadier than chasing a rally
Market overview: BTC 83,432.00 (+0.56%) · ETH 2,555.21 (+2.24%); across the market, 259 assets rose / 227 fell in 24h; top 24h gainer: W +75.90%, top loser: LUMIA -31.80%.
CYBER surges 4.7% in 5 minutes! What happened? Key levels to watch
17:47 (5 minutes ago): CYBER surged 4.7% in 5 minutes (5-minute window: 17:42→17:47). As of 17:53:24, the current price is 0.4095, up 15.8% in 24h. TAG and GRASS also showed unusual moves during the same period.
📅 Data as of 17:53:24 (event trigger times are noted alongside each item; prices are live snapshots at the time of writing)
📌 The takeaway: Short-term momentum is concentrated, and pullbacks can come quickly—placing staggered limit orders is steadier than chasing a rally
Market overview: BTC 83,432.00 (+0.56%) · ETH 2,555.21 (+2.24%); across the market, 259 assets rose / 227 fell in 24h; top 24h gainer: W +75.90%, top loser: LUMIA -31.80%.
📅 Data as of 17:53:24 (event trigger times are noted alongside each item; prices are live snapshots at the time of writing)
📌 The takeaway: Short-term momentum is concentrated, and pullbacks can come quickly—placing staggered limit orders is steadier than chasing a rally
Market overview: BTC 83,432.00 (+0.56%) · ETH 2,555.21 (+2.24%); across the market, 259 assets rose / 227 fell in 24h; top 24h gainer: W +75.90%, top loser: LUMIA -31.80%.
4
·
--
US surges 5.3% in 5 minutes! What happened? Key levels here17:15 (7 minutes ago) US surged 5.3% within 5 minutes (5-minute window 17:10→17:15). As of 17:22:55, the current price is 0.0118, down 27.5% over 24h. Other assets moving in the same batch include AIOT and W.
📅 Data as of 17:22:55 (event trigger times are noted for each item; prices are real-time snapshots taken when this was written)
📌 One-line takeaway: Short-term momentum is concentrated, and pullbacks can come fast—staggered limit orders are steadier than chasing highs
Market overview: BTC 83,473.00 (+0.56%) · ETH 2,552.61 (+2.11%); across the market, 254 assets rose / 235 fell in 24h; top 24h gainer W +73.62%, top loser LUMIA -35.09%.
US surges 5.3% in 5 minutes! What happened? Key levels here
17:15 (7 minutes ago) US surged 5.3% within 5 minutes (5-minute window 17:10→17:15). As of 17:22:55, the current price is 0.0118, down 27.5% over 24h. Other assets moving in the same batch include AIOT and W.
📅 Data as of 17:22:55 (event trigger times are noted for each item; prices are real-time snapshots taken when this was written)
📌 One-line takeaway: Short-term momentum is concentrated, and pullbacks can come fast—staggered limit orders are steadier than chasing highs
Market overview: BTC 83,473.00 (+0.56%) · ETH 2,552.61 (+2.11%); across the market, 254 assets rose / 235 fell in 24h; top 24h gainer W +73.62%, top loser LUMIA -35.09%.
📅 Data as of 17:22:55 (event trigger times are noted for each item; prices are real-time snapshots taken when this was written)
📌 One-line takeaway: Short-term momentum is concentrated, and pullbacks can come fast—staggered limit orders are steadier than chasing highs
Market overview: BTC 83,473.00 (+0.56%) · ETH 2,552.61 (+2.11%); across the market, 254 assets rose / 235 fell in 24h; top 24h gainer W +73.62%, top loser LUMIA -35.09%.

·
--
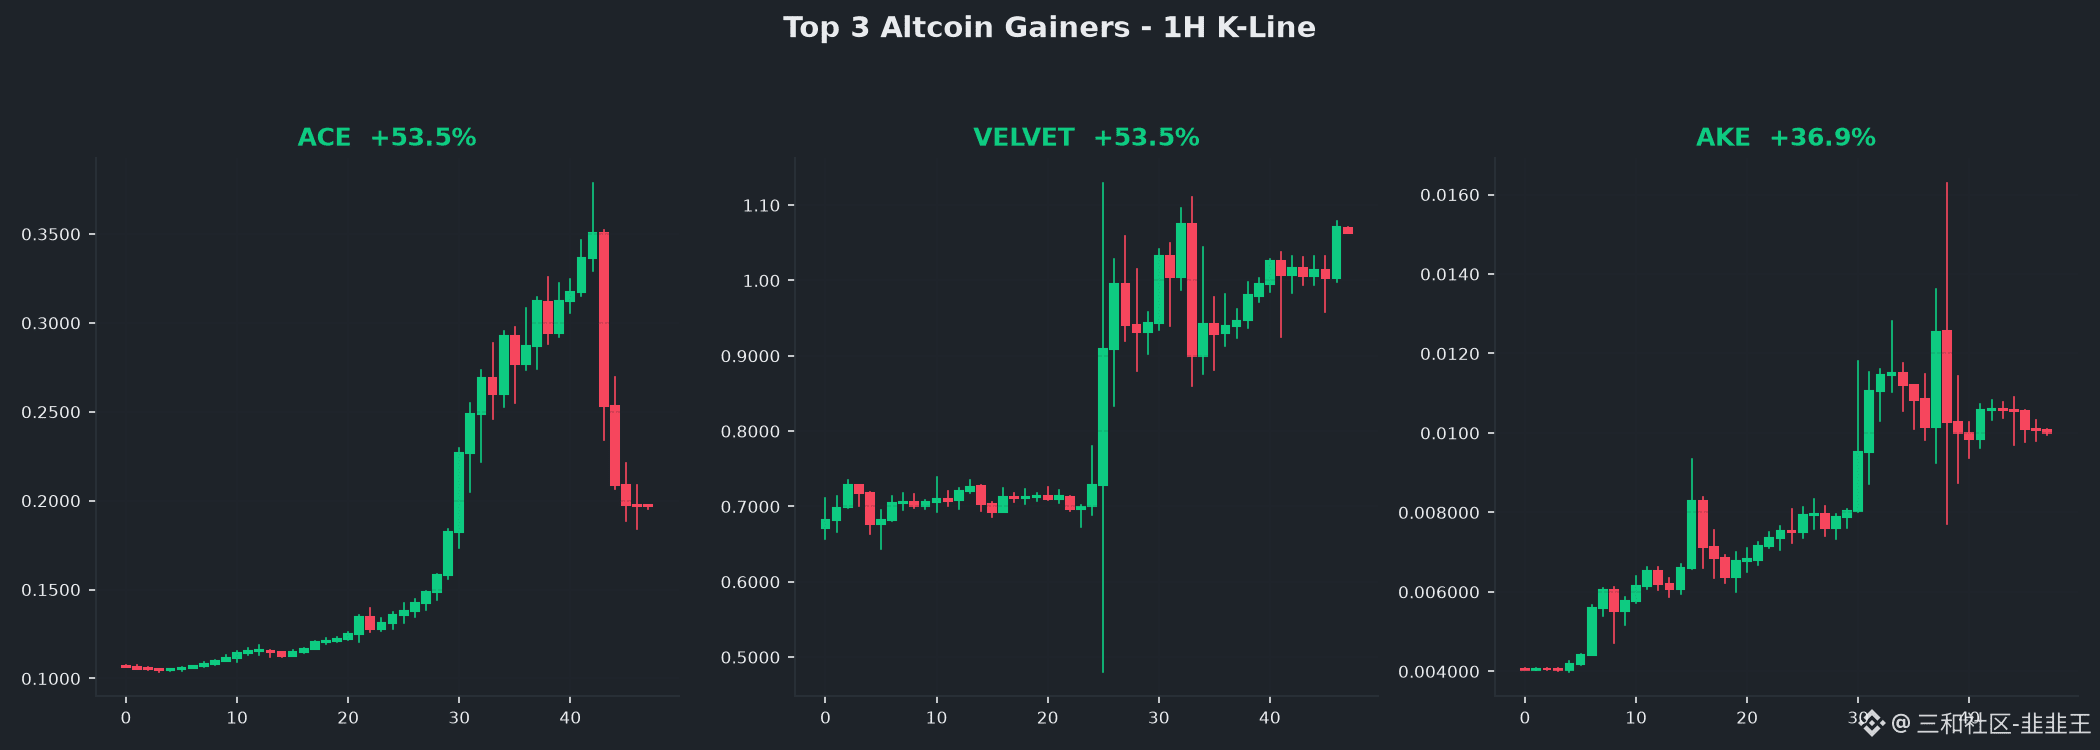
The star of today is ACE. +53.5%, trading volume $1.11B—no small-fry stuff.
🥇 Champion: ACE
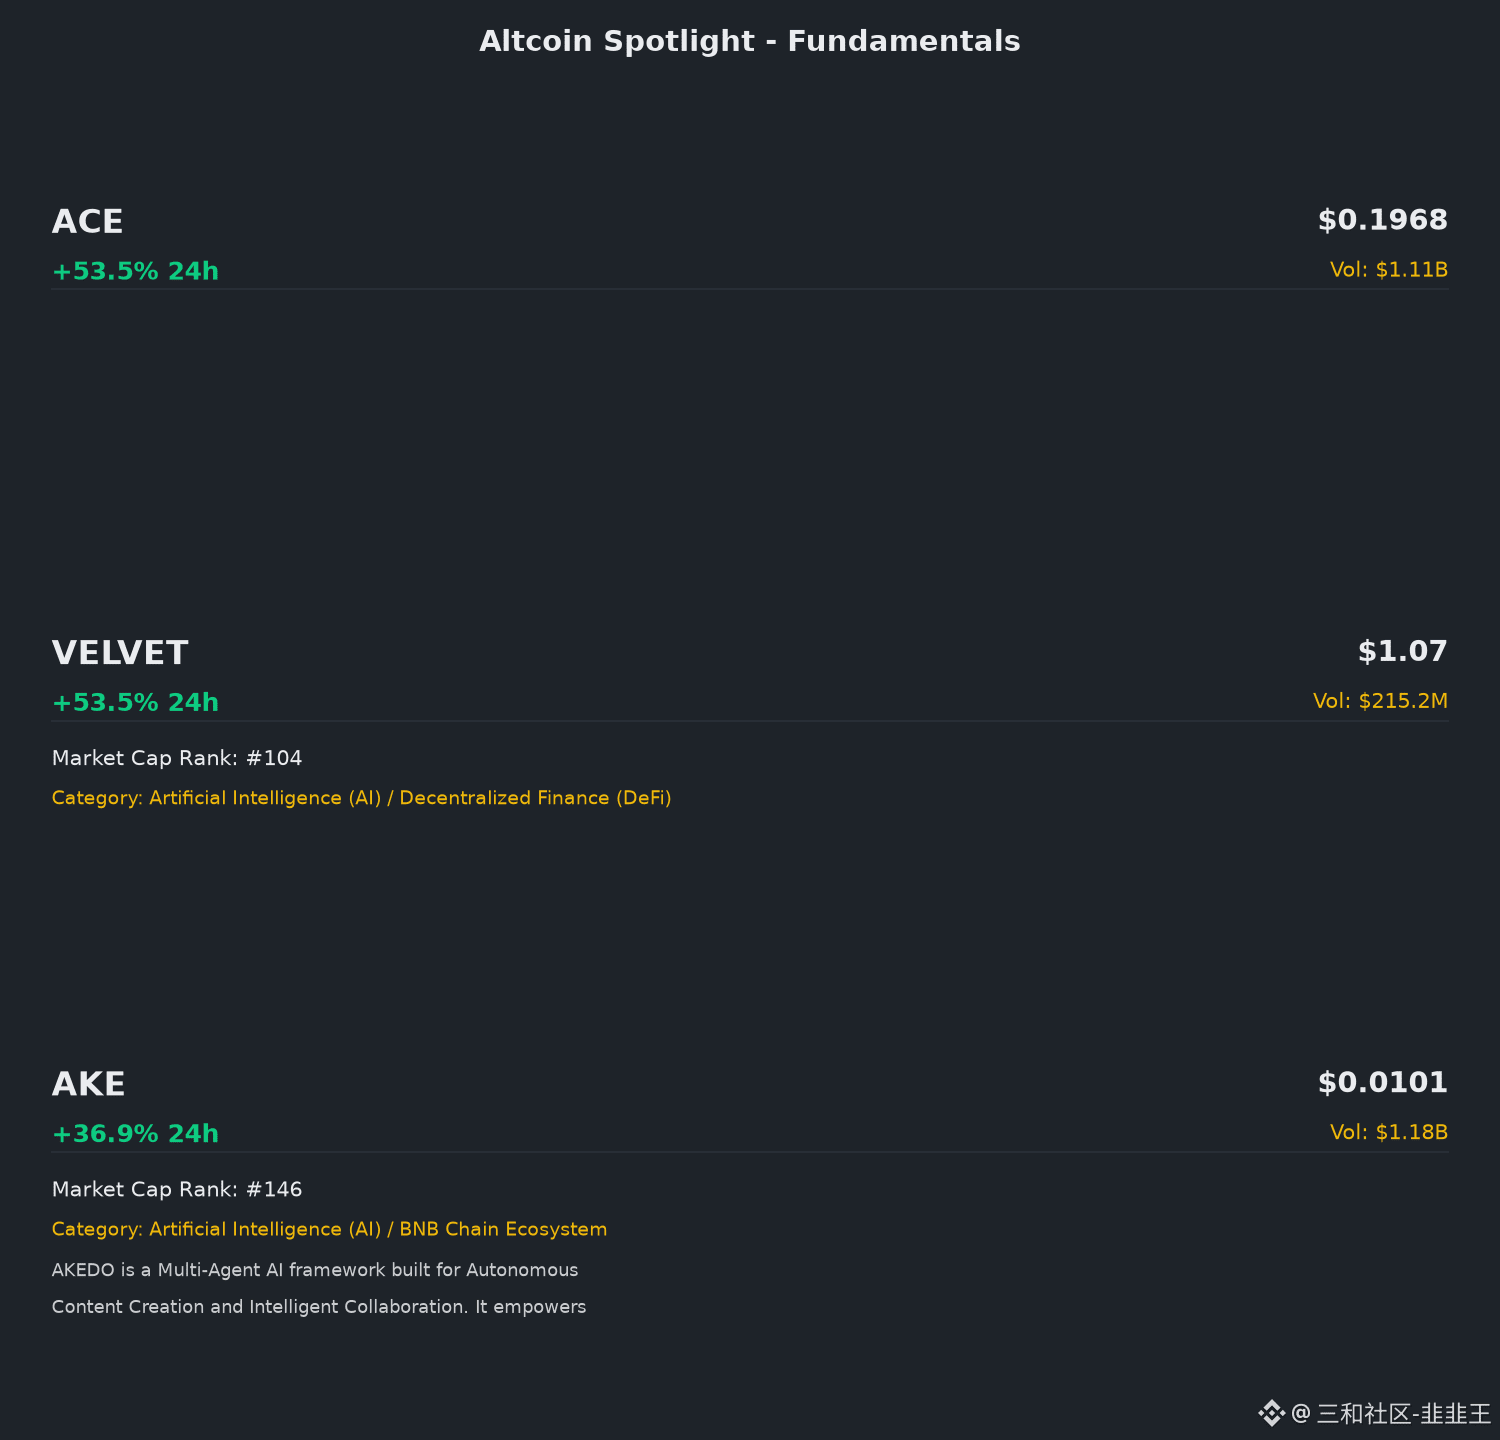
ACE led the pack among altcoins today with a +53.5% gain, with trading volume of $1.11B USDT.
Current price: $0.1968 | 24H volume: $1.11B
📊 Technical Analysis:
- Trend: Strong upward momentum; MA7 is above MA25, with a bullish alignment
- RSI(14): 39.8 (slightly weak range)
- Support levels: $0.1840 / $0.1277
- Resistance levels: $0.3789 / $0.3789
💡 Trading Suggestions:
- Entry range: $0.1910 - $0.2028 (current price is below MA7; consider scaling in)
- Stop-loss: $0.1811 (about -8.0%)
- Take-profit 1 (conservative): $0.2205 (+12.0%, risk-reward ratio 1.5:1)
- Take-profit 2 (aggressive): $0.3978 (+102.1%, risk-reward ratio 3:1)
⚠️ The above is for technical analysis reference only and does not constitute investment advice. Coins that have already surged carry higher pullback risk—control your position size strictly.
🥈 Runner-up: VELVET
VELVET follows closely with a +53.5% gain, which is also quite impressive.
Current price: $1.07 | 24H volume: 215.2M
Market cap rank: #104 | Track: Artificial Intelligence (AI), Decentralized Finance (DeFi)
📊 Technical Analysis:
- Trend: Strong upward momentum; MA7 is above MA25, with a bullish alignment
- RSI(14): 78.6 (overbought zone; watch for pullback risk)
- Support levels: $0.9133 / $0.4805
- Resistance levels: $1.08 / $1.13
💡 Trading Suggestions:
- Entry range: $0.9950 - $1.06 (suggest waiting for a pullback near MA7 before entering)
- Stop-loss: $0.9437 (about -8.0%)
- Take-profit 1 (conservative): $1.15 (+12.0%, risk-reward ratio 1.5:1)
- Take-profit 2 (aggressive): $1.49 (+45.6%, risk-reward ratio 3:1)
⚠️ The above is for technical analysis reference only and does not constitute investment advice. Coins that have already surged carry higher pullback risk—control your position size strictly.
🥉 Third place: AKE
Third pick: AKE, +36.9%, trading volume $1.18B.
Current price: $0.0101 | 24H volume: $1.18B
Market cap rank: #146 | Track: Artificial Intelligence (AI), BNB Chain Ecosystem
📊 Technical Analysis:
- Trend: Strong upward momentum; MA7 is above MA25, with a bullish alignment
- RSI(14): 40.2 (neutral range)
- Support levels: $0.007700 / $0.007229
- Resistance levels: $0.0163 / $0.0163
💡 Trading Suggestions:
- Entry range: $0.009690 - $0.0103 (current price is below MA7; consider scaling in)
- Stop-loss: $0.009191 (about -8.0%)
- Take-profit 1 (conservative): $0.0112 (+12.0%, risk-reward ratio 1.5:1)
- Take-profit 2 (aggressive): $0.0171 (+71.3%, risk-reward ratio 3:1)
⚠️ The above is for technical analysis reference only and does not constitute investment advice. Coins that have already surged carry higher pullback risk—control your position size strictly.
📝 Project Intro: AKEDO is a Multi-Agent AI framework built for Autonomous Content Creation and Intelligent Collaboration. It empowers cre...
📂 Today’s Hot Sectors: BNB Chain Ecosystem, Artificial Intelligence (AI), Decentralized Finance (DeFi), AI Applications
For the few coins leading the gains today—if the fundamentals have support, you can keep an eye on them for the medium to long term; if it’s driven purely by capital flows, take profit when appropriate.
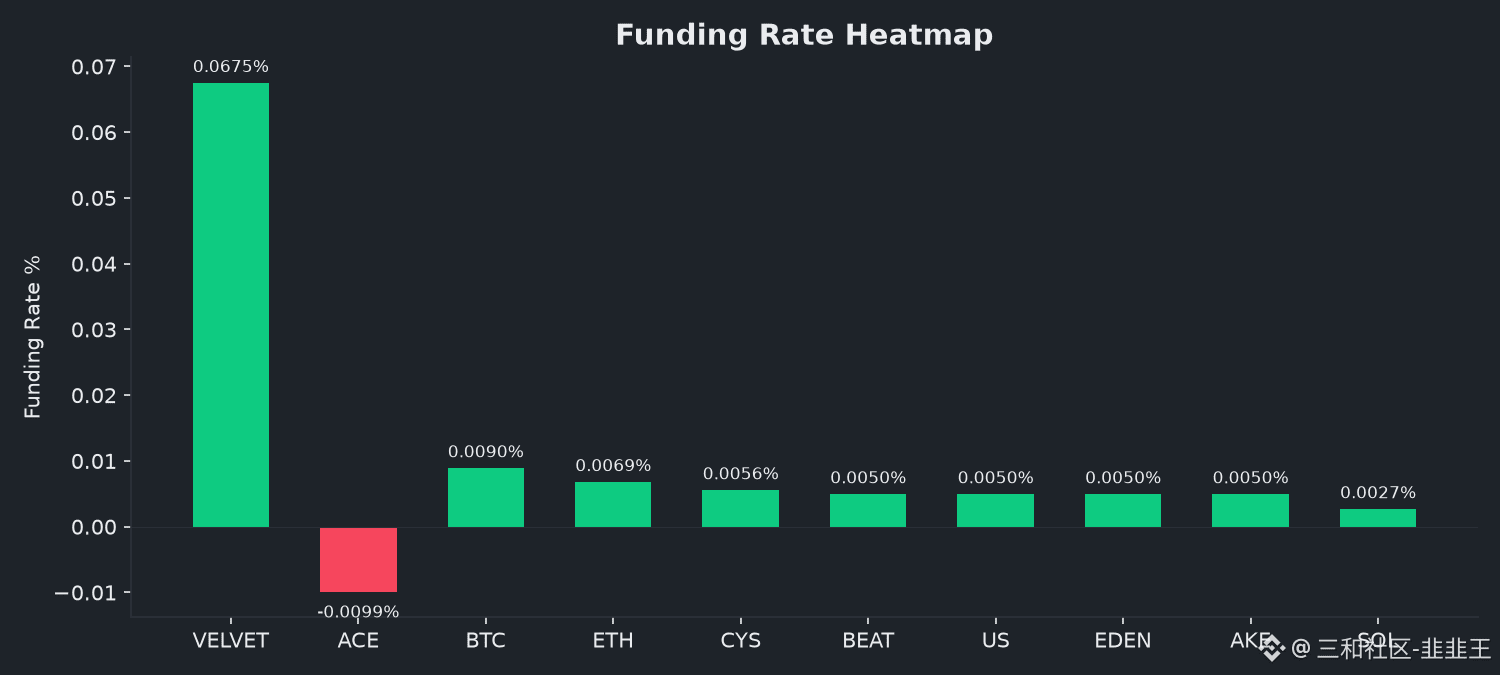
💰 Funding Rate Snapshot:
Average funding rate +0.0091%, long/short are basically balanced.
VELVET: +0.0675% (severely overheated)
ACE: -0.0099% (slightly bearish/normal)
AKE: +0.0050% (normal bullish)
BEAT: +0.0050% (normal bullish)
ETH: +0.0069% (normal bullish)
SOL: +0.0027% (normal bullish)
📊 Watchlist:
ACE: https://www.binance.com/futures/ACEUSDT
VELVET: https://www.binance.com/futures/VELVETUSDT
AKE: https://www.binance.com/futures/AKEUSDT
#ACE #VELVET #AKE
The star of today is ACE. +53.5%, trading volume $1.11B—no small-fry stuff.
🥇 Champion: ACE
ACE led the pack among altcoins today with a +53.5% gain, with trading volume of $1.11B USDT.
Current price: $0.1968 | 24H volume: $1.11B
📊 Technical Analysis:
- Trend: Strong upward momentum; MA7 is above MA25, with a bullish alignment
- RSI(14): 39.8 (slightly weak range)
- Support levels: $0.1840 / $0.1277
- Resistance levels: $0.3789 / $0.3789
💡 Trading Suggestions:
- Entry range: $0.1910 - $0.2028 (current price is below MA7; consider scaling in)
- Stop-loss: $0.1811 (about -8.0%)
- Take-profit 1 (conservative): $0.2205 (+12.0%, risk-reward ratio 1.5:1)
- Take-profit 2 (aggressive): $0.3978 (+102.1%, risk-reward ratio 3:1)
⚠️ The above is for technical analysis reference only and does not constitute investment advice. Coins that have already surged carry higher pullback risk—control your position size strictly.
🥈 Runner-up: VELVET
VELVET follows closely with a +53.5% gain, which is also quite impressive.
Current price: $1.07 | 24H volume: 215.2M
Market cap rank: #104 | Track: Artificial Intelligence (AI), Decentralized Finance (DeFi)
📊 Technical Analysis:
- Trend: Strong upward momentum; MA7 is above MA25, with a bullish alignment
- RSI(14): 78.6 (overbought zone; watch for pullback risk)
- Support levels: $0.9133 / $0.4805
- Resistance levels: $1.08 / $1.13
💡 Trading Suggestions:
- Entry range: $0.9950 - $1.06 (suggest waiting for a pullback near MA7 before entering)
- Stop-loss: $0.9437 (about -8.0%)
- Take-profit 1 (conservative): $1.15 (+12.0%, risk-reward ratio 1.5:1)
- Take-profit 2 (aggressive): $1.49 (+45.6%, risk-reward ratio 3:1)
⚠️ The above is for technical analysis reference only and does not constitute investment advice. Coins that have already surged carry higher pullback risk—control your position size strictly.
🥉 Third place: AKE
Third pick: AKE, +36.9%, trading volume $1.18B.
Current price: $0.0101 | 24H volume: $1.18B
Market cap rank: #146 | Track: Artificial Intelligence (AI), BNB Chain Ecosystem
📊 Technical Analysis:
- Trend: Strong upward momentum; MA7 is above MA25, with a bullish alignment
- RSI(14): 40.2 (neutral range)
- Support levels: $0.007700 / $0.007229
- Resistance levels: $0.0163 / $0.0163
💡 Trading Suggestions:
- Entry range: $0.009690 - $0.0103 (current price is below MA7; consider scaling in)
- Stop-loss: $0.009191 (about -8.0%)
- Take-profit 1 (conservative): $0.0112 (+12.0%, risk-reward ratio 1.5:1)
- Take-profit 2 (aggressive): $0.0171 (+71.3%, risk-reward ratio 3:1)
⚠️ The above is for technical analysis reference only and does not constitute investment advice. Coins that have already surged carry higher pullback risk—control your position size strictly.
📝 Project Intro: AKEDO is a Multi-Agent AI framework built for Autonomous Content Creation and Intelligent Collaboration. It empowers cre...
📂 Today’s Hot Sectors: BNB Chain Ecosystem, Artificial Intelligence (AI), Decentralized Finance (DeFi), AI Applications
For the few coins leading the gains today—if the fundamentals have support, you can keep an eye on them for the medium to long term; if it’s driven purely by capital flows, take profit when appropriate.
💰 Funding Rate Snapshot:
Average funding rate +0.0091%, long/short are basically balanced.
VELVET: +0.0675% (severely overheated)
ACE: -0.0099% (slightly bearish/normal)
AKE: +0.0050% (normal bullish)
BEAT: +0.0050% (normal bullish)
ETH: +0.0069% (normal bullish)
SOL: +0.0027% (normal bullish)
📊 Watchlist:
ACE: https://www.binance.com/futures/ACEUSDT
VELVET: https://www.binance.com/futures/VELVETUSDT
AKE: https://www.binance.com/futures/AKEUSDT
#ACE #VELVET #AKE
🥇 Champion: ACE
ACE led the pack among altcoins today with a +53.5% gain, with trading volume of $1.11B USDT.
Current price: $0.1968 | 24H volume: $1.11B
📊 Technical Analysis:
- Trend: Strong upward momentum; MA7 is above MA25, with a bullish alignment
- RSI(14): 39.8 (slightly weak range)
- Support levels: $0.1840 / $0.1277
- Resistance levels: $0.3789 / $0.3789
💡 Trading Suggestions:
- Entry range: $0.1910 - $0.2028 (current price is below MA7; consider scaling in)
- Stop-loss: $0.1811 (about -8.0%)
- Take-profit 1 (conservative): $0.2205 (+12.0%, risk-reward ratio 1.5:1)
- Take-profit 2 (aggressive): $0.3978 (+102.1%, risk-reward ratio 3:1)
⚠️ The above is for technical analysis reference only and does not constitute investment advice. Coins that have already surged carry higher pullback risk—control your position size strictly.
🥈 Runner-up: VELVET
VELVET follows closely with a +53.5% gain, which is also quite impressive.
Current price: $1.07 | 24H volume: 215.2M
Market cap rank: #104 | Track: Artificial Intelligence (AI), Decentralized Finance (DeFi)
📊 Technical Analysis:
- Trend: Strong upward momentum; MA7 is above MA25, with a bullish alignment
- RSI(14): 78.6 (overbought zone; watch for pullback risk)
- Support levels: $0.9133 / $0.4805
- Resistance levels: $1.08 / $1.13
💡 Trading Suggestions:
- Entry range: $0.9950 - $1.06 (suggest waiting for a pullback near MA7 before entering)
- Stop-loss: $0.9437 (about -8.0%)
- Take-profit 1 (conservative): $1.15 (+12.0%, risk-reward ratio 1.5:1)
- Take-profit 2 (aggressive): $1.49 (+45.6%, risk-reward ratio 3:1)
⚠️ The above is for technical analysis reference only and does not constitute investment advice. Coins that have already surged carry higher pullback risk—control your position size strictly.
🥉 Third place: AKE
Third pick: AKE, +36.9%, trading volume $1.18B.
Current price: $0.0101 | 24H volume: $1.18B
Market cap rank: #146 | Track: Artificial Intelligence (AI), BNB Chain Ecosystem
📊 Technical Analysis:
- Trend: Strong upward momentum; MA7 is above MA25, with a bullish alignment
- RSI(14): 40.2 (neutral range)
- Support levels: $0.007700 / $0.007229
- Resistance levels: $0.0163 / $0.0163
💡 Trading Suggestions:
- Entry range: $0.009690 - $0.0103 (current price is below MA7; consider scaling in)
- Stop-loss: $0.009191 (about -8.0%)
- Take-profit 1 (conservative): $0.0112 (+12.0%, risk-reward ratio 1.5:1)
- Take-profit 2 (aggressive): $0.0171 (+71.3%, risk-reward ratio 3:1)
⚠️ The above is for technical analysis reference only and does not constitute investment advice. Coins that have already surged carry higher pullback risk—control your position size strictly.
📝 Project Intro: AKEDO is a Multi-Agent AI framework built for Autonomous Content Creation and Intelligent Collaboration. It empowers cre...
📂 Today’s Hot Sectors: BNB Chain Ecosystem, Artificial Intelligence (AI), Decentralized Finance (DeFi), AI Applications
For the few coins leading the gains today—if the fundamentals have support, you can keep an eye on them for the medium to long term; if it’s driven purely by capital flows, take profit when appropriate.
💰 Funding Rate Snapshot:
Average funding rate +0.0091%, long/short are basically balanced.
VELVET: +0.0675% (severely overheated)
ACE: -0.0099% (slightly bearish/normal)
AKE: +0.0050% (normal bullish)
BEAT: +0.0050% (normal bullish)
ETH: +0.0069% (normal bullish)
SOL: +0.0027% (normal bullish)
📊 Watchlist:
ACE: https://www.binance.com/futures/ACEUSDT
VELVET: https://www.binance.com/futures/VELVETUSDT
AKE: https://www.binance.com/futures/AKEUSDT
#ACE #VELVET #AKE
100

·
--
** How Can You Reduce Your Risk by 10% and Maximize Your Profit? – For Binance Square (Practical Trading)Hunter Biden's Laptop (LAPTOPUSDT) is trending right now!
Rank: #146
** ### 🎯 1. **Quickly Read Market Conditions – “Daily Target Table”** | Symbol | 24h Change | Price (USDT) | Trading Volume | |--------|------------|--------------|--------------| | | **‑11.72 %** | **5.90** | 65 M | | | **‑7.88 %** | **0.08405** | 83 M | | | **‑7.27 %** | **1.798** | 4.7 M | | | **‑7.25 %** | **2.417** | 89 M | | | **‑6.23 %** | **1.099** | 13.5 M | **Why is it important?** This table shows the assets that are “top losers” (top movers). At a glance, you can see where there is *selling pressure* and where there may be a *potential rebound* opportunity. --- ### 📊 2. **Recognize the Chart Pattern: “Hammer (Çekiç) + Support”** - **How do you find it?** Look at Binance Square’s or ’s 4-hour (4h) candlestick chart. - **What you’re looking for:** At the bottom of a downtrend, a candle with a very small body and a long lower wick (hammer). - **Visual clue:** - The hammer candle shows a quick reversal from the price’s **low** to the **open/close** level → a sign that buyers have stepped in. - Support line: Connect the lows of the last 5–10 candles. **Why is it important?** A hammer often indicates the moment when “sellers are getting tired” and “buyers are stepping in.” At this point, opening a *small position* provides a lower-risk entry in case the decline is nearing its end. --- ### 💡 3. **Risk Management: “1% Rule + Stop-Loss”** 1. **Calculate Position Size** - Daily capital: **0 000** (example) - Risk
** How Can You Reduce Your Risk by 10% and Maximize Your Profit? – For Binance Square (Practical Trading)
Hunter Biden's Laptop (LAPTOPUSDT) is trending right now!
Rank: #146
** ### 🎯 1. **Quickly Read Market Conditions – “Daily Target Table”** | Symbol | 24h Change | Price (USDT) | Trading Volume | |--------|------------|--------------|--------------| | | **‑11.72 %** | **5.90** | 65 M | | | **‑7.88 %** | **0.08405** | 83 M | | | **‑7.27 %** | **1.798** | 4.7 M | | | **‑7.25 %** | **2.417** | 89 M | | | **‑6.23 %** | **1.099** | 13.5 M | **Why is it important?** This table shows the assets that are “top losers” (top movers). At a glance, you can see where there is *selling pressure* and where there may be a *potential rebound* opportunity. --- ### 📊 2. **Recognize the Chart Pattern: “Hammer (Çekiç) + Support”** - **How do you find it?** Look at Binance Square’s or ’s 4-hour (4h) candlestick chart. - **What you’re looking for:** At the bottom of a downtrend, a candle with a very small body and a long lower wick (hammer). - **Visual clue:** - The hammer candle shows a quick reversal from the price’s **low** to the **open/close** level → a sign that buyers have stepped in. - Support line: Connect the lows of the last 5–10 candles. **Why is it important?** A hammer often indicates the moment when “sellers are getting tired” and “buyers are stepping in.” At this point, opening a *small position* provides a lower-risk entry in case the decline is nearing its end. --- ### 💡 3. **Risk Management: “1% Rule + Stop-Loss”** 1. **Calculate Position Size** - Daily capital: **0 000** (example) - Risk
Rank: #146
** ### 🎯 1. **Quickly Read Market Conditions – “Daily Target Table”** | Symbol | 24h Change | Price (USDT) | Trading Volume | |--------|------------|--------------|--------------| | | **‑11.72 %** | **5.90** | 65 M | | | **‑7.88 %** | **0.08405** | 83 M | | | **‑7.27 %** | **1.798** | 4.7 M | | | **‑7.25 %** | **2.417** | 89 M | | | **‑6.23 %** | **1.099** | 13.5 M | **Why is it important?** This table shows the assets that are “top losers” (top movers). At a glance, you can see where there is *selling pressure* and where there may be a *potential rebound* opportunity. --- ### 📊 2. **Recognize the Chart Pattern: “Hammer (Çekiç) + Support”** - **How do you find it?** Look at Binance Square’s or ’s 4-hour (4h) candlestick chart. - **What you’re looking for:** At the bottom of a downtrend, a candle with a very small body and a long lower wick (hammer). - **Visual clue:** - The hammer candle shows a quick reversal from the price’s **low** to the **open/close** level → a sign that buyers have stepped in. - Support line: Connect the lows of the last 5–10 candles. **Why is it important?** A hammer often indicates the moment when “sellers are getting tired” and “buyers are stepping in.” At this point, opening a *small position* provides a lower-risk entry in case the decline is nearing its end. --- ### 💡 3. **Risk Management: “1% Rule + Stop-Loss”** 1. **Calculate Position Size** - Daily capital: **0 000** (example) - Risk

·
--
$SKYAI In the last 24 hours, up +19.69%, currently trading at 0.30205 USDT, about 1.65% away from the 24h high.
📈 Price Action: 24h range 0.24141 / 0.30704, with a volatility of about 27.19%; lower bound at 0.24141 (20.08% below current price) / midline at 0.274225 (9.21% below current price) / upper bound at 0.30704 (1.65% above current price), currently closer to the upper bound; about 1.65% from the 24h high.
📊 Data Insights: Trading volume approximately 66.45M USDT; current open interest (OI) around 106.33M SKYAI; large holders' positions are about 72.00% long / 28.00% short, with a long-to-short ratio of 2.57; nominal size at the latest price approximately 32.12M USDT; current funding rate +0.0050% (lower cost for longs), next settlement around 08:00 UTC.
🔎 Contract Details: Contract underlying $SKYAI; trading pair SKYAI/USDT; public market name SkyAI; exchange classification: AI; listed for about 375 days; market cap rank #146; market cap approximately 299.76M USD; spot 24h trading volume about 60.59M USD.
⚠️ Technical Analysis: The upper bound at 0.30704 is the nearest point, about 1.65% from the 24h high; currently only connected to public market data, no fundamental or news analysis has been conducted.
Data source: Binance Futures public market + CoinGecko.
Do you think SKYAI can break through the upper bound at 0.30704? Feel free to discuss in the comments. #SKYAI #Perpetual Contract
$SKYAI In the last 24 hours, up +19.69%, currently trading at 0.30205 USDT, about 1.65% away from the 24h high.
📈 Price Action: 24h range 0.24141 / 0.30704, with a volatility of about 27.19%; lower bound at 0.24141 (20.08% below current price) / midline at 0.274225 (9.21% below current price) / upper bound at 0.30704 (1.65% above current price), currently closer to the upper bound; about 1.65% from the 24h high.
📊 Data Insights: Trading volume approximately 66.45M USDT; current open interest (OI) around 106.33M SKYAI; large holders' positions are about 72.00% long / 28.00% short, with a long-to-short ratio of 2.57; nominal size at the latest price approximately 32.12M USDT; current funding rate +0.0050% (lower cost for longs), next settlement around 08:00 UTC.
🔎 Contract Details: Contract underlying $SKYAI ; trading pair SKYAI/USDT; public market name SkyAI; exchange classification: AI; listed for about 375 days; market cap rank #146; market cap approximately 299.76M USD; spot 24h trading volume about 60.59M USD.
⚠️ Technical Analysis: The upper bound at 0.30704 is the nearest point, about 1.65% from the 24h high; currently only connected to public market data, no fundamental or news analysis has been conducted.
Data source: Binance Futures public market + CoinGecko.
Do you think SKYAI can break through the upper bound at 0.30704? Feel free to discuss in the comments. #SKYAI #Perpetual Contract
📈 Price Action: 24h range 0.24141 / 0.30704, with a volatility of about 27.19%; lower bound at 0.24141 (20.08% below current price) / midline at 0.274225 (9.21% below current price) / upper bound at 0.30704 (1.65% above current price), currently closer to the upper bound; about 1.65% from the 24h high.
📊 Data Insights: Trading volume approximately 66.45M USDT; current open interest (OI) around 106.33M SKYAI; large holders' positions are about 72.00% long / 28.00% short, with a long-to-short ratio of 2.57; nominal size at the latest price approximately 32.12M USDT; current funding rate +0.0050% (lower cost for longs), next settlement around 08:00 UTC.
🔎 Contract Details: Contract underlying $SKYAI ; trading pair SKYAI/USDT; public market name SkyAI; exchange classification: AI; listed for about 375 days; market cap rank #146; market cap approximately 299.76M USD; spot 24h trading volume about 60.59M USD.
⚠️ Technical Analysis: The upper bound at 0.30704 is the nearest point, about 1.65% from the 24h high; currently only connected to public market data, no fundamental or news analysis has been conducted.
Data source: Binance Futures public market + CoinGecko.
Do you think SKYAI can break through the upper bound at 0.30704? Feel free to discuss in the comments. #SKYAI #Perpetual Contract
118
·
--
Attention! SOON jumped straight up by 6.2% within 5 minutes—where could you catch the dip?08:33 (just now) SOON saw a surge of 6.2% within 5 minutes. As of 08:33:20, the current price is 0.3552, with +56.2% over the past 24h.
📅 Data as of 08:33:20 (event trigger time is noted on each entry; prices are live snapshots at the time of writing)
📌 One-sentence takeaway: Short-term momentum is concentrated, and pullbacks often come and go quickly—placing staggered limit orders is steadier than chasing the price
Market Overview: BTC 84,418.70 (+0.20%) · ETH 2,678.22 (-0.52%); Across the whole market, 271 stocks rose / 220 fell over the past 24h; Top gainer over the past 24h: QNT +89.61%, worst performer: SAGA -17.82%.
—— Volatility Details ——
I. 5-minute sharp move
- $SOONUSDT 5-minute sharp move +6.23% 🕐Triggered at 08:33 (just now)
Attention! SOON jumped straight up by 6.2% within 5 minutes—where could you catch the dip?
08:33 (just now) SOON saw a surge of 6.2% within 5 minutes. As of 08:33:20, the current price is 0.3552, with +56.2% over the past 24h.
📅 Data as of 08:33:20 (event trigger time is noted on each entry; prices are live snapshots at the time of writing)
📌 One-sentence takeaway: Short-term momentum is concentrated, and pullbacks often come and go quickly—placing staggered limit orders is steadier than chasing the price
Market Overview: BTC 84,418.70 (+0.20%) · ETH 2,678.22 (-0.52%); Across the whole market, 271 stocks rose / 220 fell over the past 24h; Top gainer over the past 24h: QNT +89.61%, worst performer: SAGA -17.82%.
—— Volatility Details ——
I. 5-minute sharp move
- $SOONUSDT 5-minute sharp move +6.23% 🕐Triggered at 08:33 (just now)
📅 Data as of 08:33:20 (event trigger time is noted on each entry; prices are live snapshots at the time of writing)
📌 One-sentence takeaway: Short-term momentum is concentrated, and pullbacks often come and go quickly—placing staggered limit orders is steadier than chasing the price
Market Overview: BTC 84,418.70 (+0.20%) · ETH 2,678.22 (-0.52%); Across the whole market, 271 stocks rose / 220 fell over the past 24h; Top gainer over the past 24h: QNT +89.61%, worst performer: SAGA -17.82%.
—— Volatility Details ——
I. 5-minute sharp move
- $SOONUSDT 5-minute sharp move +6.23% 🕐Triggered at 08:33 (just now)
4
·
--
** How to Track the Daily Trend and Maximize Your Profit? 📈🎯Artificial Inu (AIUSDT) is trending right now!
Rank: #146
** ### Step 1️⃣ – Measure the “Market Pulse” 🚦 **What will you do?** On Binance Square, check the **‘Top Movers’** and **‘Gainers/Losers’** sections from the **‘Spot Market’** tab. **Example:** - **** +2.54 % (price = 101.87 USDT) → strong upward momentum. - **** –8.20 % (price = 1.646 USDT) → there’s selling pressure. **Why is it important?** These sections show the market’s **momentum** and **heat** within seconds. By instantly spotting the trend direction, volatility, and liquidity, you can decide **where to enter**. --- ### Step 2️⃣ – Draw the Lines (Chart Pattern) 📊 **What will you do?** Open Binance Square’s “Advanced Chart” and examine the price chart in the **1-day (1D)** and **4-hour (4H)** timeframes. | Pattern | How to spot it? | What does it mean? | |---------|----------------|------------| | **Bullish Flag** | A short pullback (falling dips) followed by a sideways channel | A brief pause in an ongoing uptrend. | | **Descending Triangle** | A horizontal resistance at the top, falling lows at the bottom | Selling pressure; the breakout is usually downward. | **Application:** - If you find a **bullish flag** on the chart, wait for a **breakout** from the 101.86 USDT level (bid). - If you see a **descending triangle**, consider a **short** (sell) position from the 1.64 USDT level. **Why is it important?** Patterns visualize the psychology behind price movement. “Think like this: When a car stops on a hill, the next step must be either to accelerate or to brake.”
** How to Track the Daily Trend and Maximize Your Profit? 📈🎯
Artificial Inu (AIUSDT) is trending right now!
Rank: #146
** ### Step 1️⃣ – Measure the “Market Pulse” 🚦 **What will you do?** On Binance Square, check the **‘Top Movers’** and **‘Gainers/Losers’** sections from the **‘Spot Market’** tab. **Example:** - **** +2.54 % (price = 101.87 USDT) → strong upward momentum. - **** –8.20 % (price = 1.646 USDT) → there’s selling pressure. **Why is it important?** These sections show the market’s **momentum** and **heat** within seconds. By instantly spotting the trend direction, volatility, and liquidity, you can decide **where to enter**. --- ### Step 2️⃣ – Draw the Lines (Chart Pattern) 📊 **What will you do?** Open Binance Square’s “Advanced Chart” and examine the price chart in the **1-day (1D)** and **4-hour (4H)** timeframes. | Pattern | How to spot it? | What does it mean? | |---------|----------------|------------| | **Bullish Flag** | A short pullback (falling dips) followed by a sideways channel | A brief pause in an ongoing uptrend. | | **Descending Triangle** | A horizontal resistance at the top, falling lows at the bottom | Selling pressure; the breakout is usually downward. | **Application:** - If you find a **bullish flag** on the chart, wait for a **breakout** from the 101.86 USDT level (bid). - If you see a **descending triangle**, consider a **short** (sell) position from the 1.64 USDT level. **Why is it important?** Patterns visualize the psychology behind price movement. “Think like this: When a car stops on a hill, the next step must be either to accelerate or to brake.”
Rank: #146
** ### Step 1️⃣ – Measure the “Market Pulse” 🚦 **What will you do?** On Binance Square, check the **‘Top Movers’** and **‘Gainers/Losers’** sections from the **‘Spot Market’** tab. **Example:** - **** +2.54 % (price = 101.87 USDT) → strong upward momentum. - **** –8.20 % (price = 1.646 USDT) → there’s selling pressure. **Why is it important?** These sections show the market’s **momentum** and **heat** within seconds. By instantly spotting the trend direction, volatility, and liquidity, you can decide **where to enter**. --- ### Step 2️⃣ – Draw the Lines (Chart Pattern) 📊 **What will you do?** Open Binance Square’s “Advanced Chart” and examine the price chart in the **1-day (1D)** and **4-hour (4H)** timeframes. | Pattern | How to spot it? | What does it mean? | |---------|----------------|------------| | **Bullish Flag** | A short pullback (falling dips) followed by a sideways channel | A brief pause in an ongoing uptrend. | | **Descending Triangle** | A horizontal resistance at the top, falling lows at the bottom | Selling pressure; the breakout is usually downward. | **Application:** - If you find a **bullish flag** on the chart, wait for a **breakout** from the 101.86 USDT level (bid). - If you see a **descending triangle**, consider a **short** (sell) position from the 1.64 USDT level. **Why is it important?** Patterns visualize the psychology behind price movement. “Think like this: When a car stops on a hill, the next step must be either to accelerate or to brake.”
2
·
--
NEO Surges 4.7% in 5 Minutes! What Happened? Key Levels to WatchAt 22:42 (7 minutes ago), NEO surged 4.7% within 5 minutes (5-minute window: 22:37→22:42). As of 22:50:47, its current price is 2.653, up 12.1% over 24h. STRK and CKB also made notable moves around the same time.
📅 Data as of 22:50:47 (event trigger times are noted for each item; prices are real-time snapshots taken at the time of writing)
📌 In a nutshell: Short-term momentum is concentrated, and pullbacks can come quickly—placing orders in batches is safer than chasing prices higher.
Market overview: BTC 82,939.90 (+0.03%) · ETH 2,507.00 (+0.76%); across the market, 410 gainers / 80 losers over 24h; top gainer over 24h: LUMIA +40.79%, top loser: US -34.67%.
NEO Surges 4.7% in 5 Minutes! What Happened? Key Levels to Watch
At 22:42 (7 minutes ago), NEO surged 4.7% within 5 minutes (5-minute window: 22:37→22:42). As of 22:50:47, its current price is 2.653, up 12.1% over 24h. STRK and CKB also made notable moves around the same time.
📅 Data as of 22:50:47 (event trigger times are noted for each item; prices are real-time snapshots taken at the time of writing)
📌 In a nutshell: Short-term momentum is concentrated, and pullbacks can come quickly—placing orders in batches is safer than chasing prices higher.
Market overview: BTC 82,939.90 (+0.03%) · ETH 2,507.00 (+0.76%); across the market, 410 gainers / 80 losers over 24h; top gainer over 24h: LUMIA +40.79%, top loser: US -34.67%.
📅 Data as of 22:50:47 (event trigger times are noted for each item; prices are real-time snapshots taken at the time of writing)
📌 In a nutshell: Short-term momentum is concentrated, and pullbacks can come quickly—placing orders in batches is safer than chasing prices higher.
Market overview: BTC 82,939.90 (+0.03%) · ETH 2,507.00 (+0.76%); across the market, 410 gainers / 80 losers over 24h; top gainer over 24h: LUMIA +40.79%, top loser: US -34.67%.
185
·
--
ORCA surges 4.7%! Is this kind of sharp rally worth chasing?At 07:37 (22 minutes ago), ORCA surged 4.7% within 5 minutes (5-minute window 07:32→07:37). As of 08:00:07, the current price is 3.185, up 32.3% in 24h. Other tokens moving at the same time include KGEN and LYN.
📅 Data as of 08:00:07 (event trigger times are noted for each item; prices are real-time snapshots taken at the time of writing)
📌 In a nutshell: Short-term momentum is concentrated, and pullbacks can come quickly—placing orders in batches is steadier than chasing prices higher.
Market overview: BTC 85,517.00(-0.28%) · ETH 2,696.44(-0.51%); across the market, 153 gainers / 337 decliners in 24h; top gainer: Lobster +46.64%, top loser: MINA -23.92%.
ORCA surges 4.7%! Is this kind of sharp rally worth chasing?
At 07:37 (22 minutes ago), ORCA surged 4.7% within 5 minutes (5-minute window 07:32→07:37). As of 08:00:07, the current price is 3.185, up 32.3% in 24h. Other tokens moving at the same time include KGEN and LYN.
📅 Data as of 08:00:07 (event trigger times are noted for each item; prices are real-time snapshots taken at the time of writing)
📌 In a nutshell: Short-term momentum is concentrated, and pullbacks can come quickly—placing orders in batches is steadier than chasing prices higher.
Market overview: BTC 85,517.00(-0.28%) · ETH 2,696.44(-0.51%); across the market, 153 gainers / 337 decliners in 24h; top gainer: Lobster +46.64%, top loser: MINA -23.92%.
📅 Data as of 08:00:07 (event trigger times are noted for each item; prices are real-time snapshots taken at the time of writing)
📌 In a nutshell: Short-term momentum is concentrated, and pullbacks can come quickly—placing orders in batches is steadier than chasing prices higher.
Market overview: BTC 85,517.00(-0.28%) · ETH 2,696.44(-0.51%); across the market, 153 gainers / 337 decliners in 24h; top gainer: Lobster +46.64%, top loser: MINA -23.92%.
72


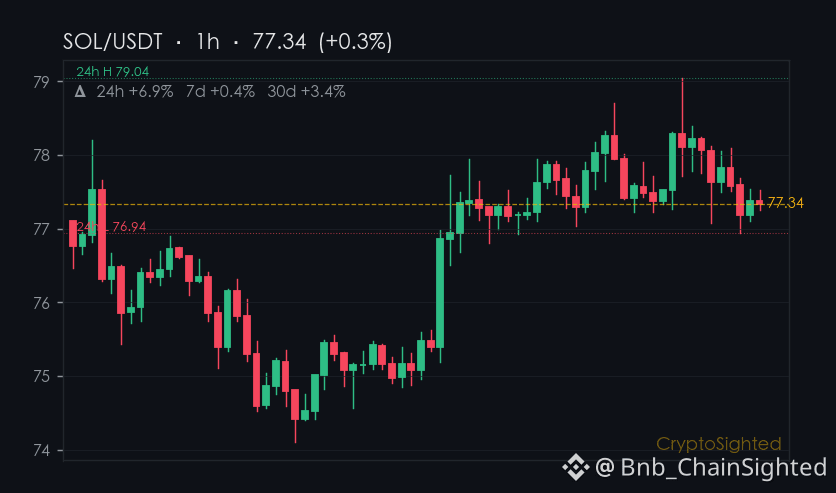
$SOL’s 24-hour move is a flat 0.4% - barely a blip on the radar, even as some tokens are surging.
That quietness matters.
Look at the broader picture: the market is up 0.7% on the day, and most coins are following suit.
But SOL is holding steady, not breaking out, not retreating.
It’s the kind of performance that invites scrutiny - why is it so unremarkable in a sea of volatility?
—
Not financial advice. DYOR.
📌 Hotspot Watch · #146 · #CryptoTrends #CryptoSighted $SOL
$SOL ’s 24-hour move is a flat 0.4% - barely a blip on the radar, even as some tokens are surging.
That quietness matters.
Look at the broader picture: the market is up 0.7% on the day, and most coins are following suit.
But SOL is holding steady, not breaking out, not retreating.
It’s the kind of performance that invites scrutiny - why is it so unremarkable in a sea of volatility?
—
Not financial advice. DYOR.
📌 Hotspot Watch · #146 · #CryptoTrends #CryptoSighted $SOL
That quietness matters.
Look at the broader picture: the market is up 0.7% on the day, and most coins are following suit.
But SOL is holding steady, not breaking out, not retreating.
It’s the kind of performance that invites scrutiny - why is it so unremarkable in a sea of volatility?
—
Not financial advice. DYOR.
📌 Hotspot Watch · #146 · #CryptoTrends #CryptoSighted $SOL
397
·
--
Jumped 4% Today – Why I’m Still Sitting on the SidelinesCash Cat (CASHCATUSDT) is trending right now!
Rank: #146
Bitcoin just flashed a 4.10% gain in the last 24 hours, pushing to 1,159.45 with a staggering 4.1 B volume. At first glance, the chart looks like a classic breakout – momentum building, buyers stepping in, and the usual FOMO buzz flooding Twitter. But here’s the counter‑intuitive take that’s keeping my wallet closed: the rally feels *too* clean, and that’s a red flag for me. When moves up sharply on relatively low‑volume news‑free days, it often signals a short‑squeeze rather than genuine demand. The 24‑hour volume, while huge in absolute terms, is actually down ~12% from the 7‑day average, suggesting fewer participants are driving the price. Meanwhile, is showing a similar pattern – up 4.72% to ,520.05 with 1 B volume, but its on‑chain activity (active addresses, transaction count) has barely moved. In other words, the price is being lifted by futures leverage and a few large spot orders, not by a broad base of new buyers. I’m watching three key signals before I consider an entry: 1. **Volume confirmation** – I need to see ’s 24‑hour volume stay above 0 B for at least two consecutive sessions, indicating sustained buying pressure. 2. **ETH/BTC ratio stability** – A rising ratio often signals alt‑season strength; right now it’s flat, which tells me money isn’t rotating into riskier assets yet. 3. **On‑chain metrics** – A spike in new addresses or a rise in the MVRV Z‑score above 0.7 would
Jumped 4% Today – Why I’m Still Sitting on the Sidelines
Cash Cat (CASHCATUSDT) is trending right now!
Rank: #146
Bitcoin just flashed a 4.10% gain in the last 24 hours, pushing to 1,159.45 with a staggering 4.1 B volume. At first glance, the chart looks like a classic breakout – momentum building, buyers stepping in, and the usual FOMO buzz flooding Twitter. But here’s the counter‑intuitive take that’s keeping my wallet closed: the rally feels *too* clean, and that’s a red flag for me. When moves up sharply on relatively low‑volume news‑free days, it often signals a short‑squeeze rather than genuine demand. The 24‑hour volume, while huge in absolute terms, is actually down ~12% from the 7‑day average, suggesting fewer participants are driving the price. Meanwhile, is showing a similar pattern – up 4.72% to ,520.05 with 1 B volume, but its on‑chain activity (active addresses, transaction count) has barely moved. In other words, the price is being lifted by futures leverage and a few large spot orders, not by a broad base of new buyers. I’m watching three key signals before I consider an entry: 1. **Volume confirmation** – I need to see ’s 24‑hour volume stay above 0 B for at least two consecutive sessions, indicating sustained buying pressure. 2. **ETH/BTC ratio stability** – A rising ratio often signals alt‑season strength; right now it’s flat, which tells me money isn’t rotating into riskier assets yet. 3. **On‑chain metrics** – A spike in new addresses or a rise in the MVRV Z‑score above 0.7 would
Rank: #146
Bitcoin just flashed a 4.10% gain in the last 24 hours, pushing to 1,159.45 with a staggering 4.1 B volume. At first glance, the chart looks like a classic breakout – momentum building, buyers stepping in, and the usual FOMO buzz flooding Twitter. But here’s the counter‑intuitive take that’s keeping my wallet closed: the rally feels *too* clean, and that’s a red flag for me. When moves up sharply on relatively low‑volume news‑free days, it often signals a short‑squeeze rather than genuine demand. The 24‑hour volume, while huge in absolute terms, is actually down ~12% from the 7‑day average, suggesting fewer participants are driving the price. Meanwhile, is showing a similar pattern – up 4.72% to ,520.05 with 1 B volume, but its on‑chain activity (active addresses, transaction count) has barely moved. In other words, the price is being lifted by futures leverage and a few large spot orders, not by a broad base of new buyers. I’m watching three key signals before I consider an entry: 1. **Volume confirmation** – I need to see ’s 24‑hour volume stay above 0 B for at least two consecutive sessions, indicating sustained buying pressure. 2. **ETH/BTC ratio stability** – A rising ratio often signals alt‑season strength; right now it’s flat, which tells me money isn’t rotating into riskier assets yet. 3. **On‑chain metrics** – A spike in new addresses or a rise in the MVRV Z‑score above 0.7 would
10
Log in to explore more content
Join global crypto users on Binance Square
⚡️ Get latest and useful information about crypto.
💬 Trusted by the world’s largest crypto exchange.
👍 Discover real insights from verified creators.
Email / Phone number
Trending Topics
1
#HuangExitNvidiaStrategyInFocus
84,196 views
942 Discussing
2
#AnthropicRejectsIPODelayValuationinQuestion
684,188 views
5,217 Discussing
3
#BitMineReports$6.3BNetLossForFiscal2026
10,604 views
115 Discussing
4
#ChipStocksExtendLossesAfterNvidiaCEOChange
32,944 views
418 Discussing
5
#ThailandProposes$148KDailyStablecoinDepositWithdrawalCaps
3,035 views
45 Discussing
6
#CoreWeaveJumps10%On168%RevenueGrowth
186,547 views
1,652 Discussing
7
#ZcashFallsBelow$1000ForFirstTimeSinceSeptember
87,637 views
260 Discussing
8
#MSCIRemovalMayCurbStrategy’sBitcoinBuying
53,666 views
588 Discussing
9
#TradFiForBeginners
531,552 views
3,687 Discussing
10
#USJoblessClaimsRise
19.1M views
7,797 Discussing