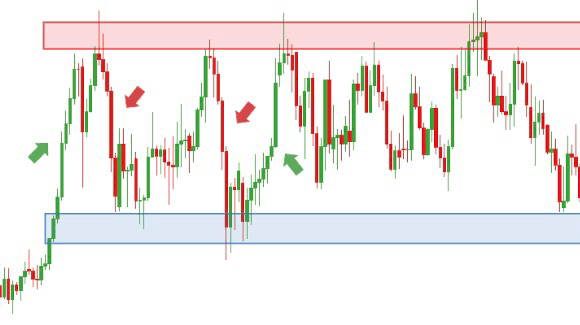
Look at the old chart and now the new chart I’m posting with this post. The old one I posted on Binance feed on 2 Aug and after 7 days, you can see in new chart how $BTC respected those areas. You can see clearly how supply and demand work. #BTC 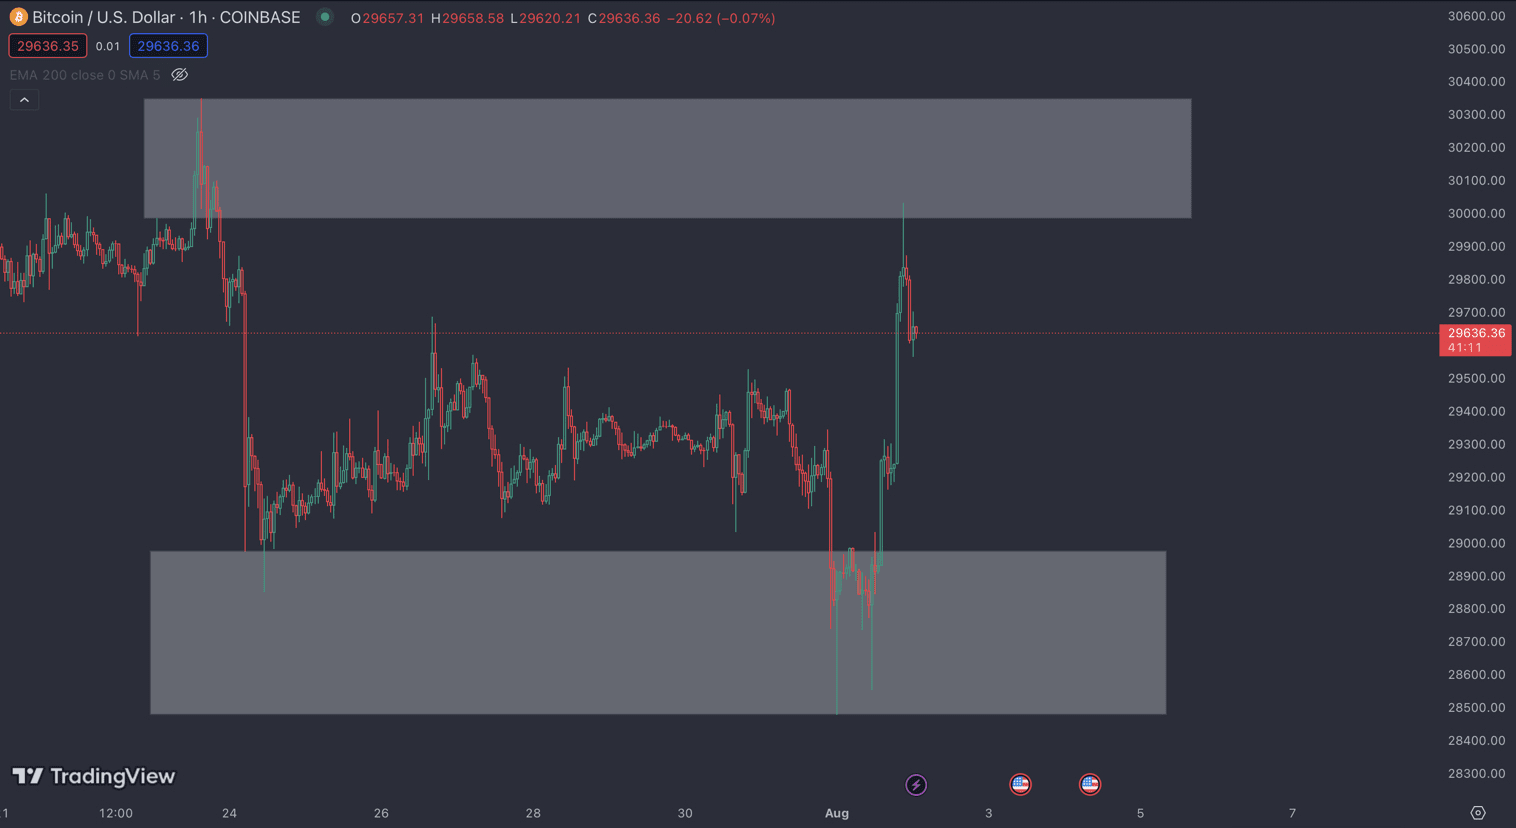
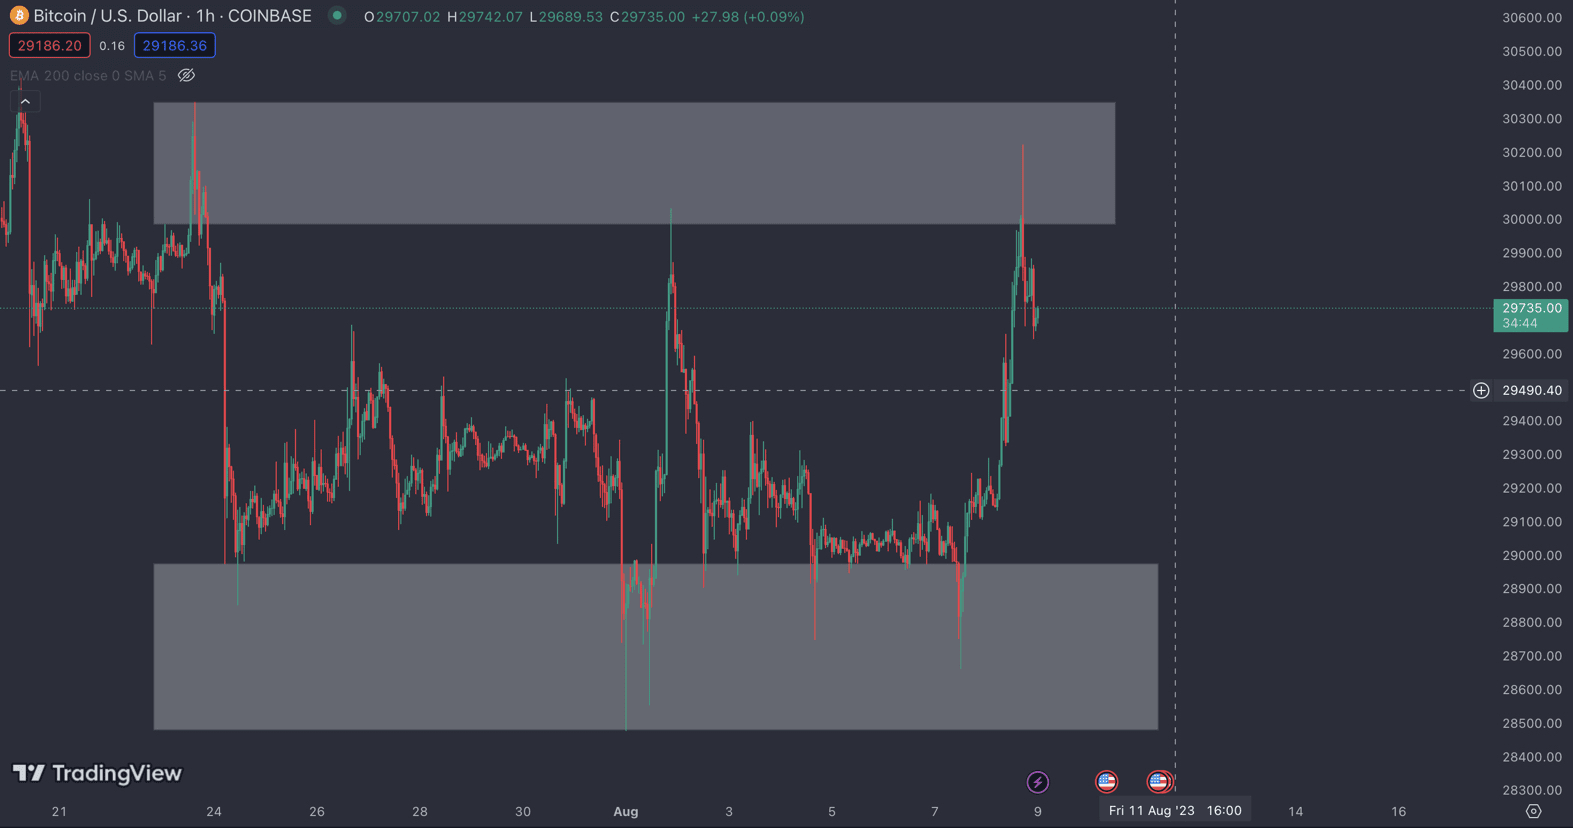 went down and grabbed the liquidity from supply zone (around 28,900) and then pumped to demand zone and grabbed liquidity from there (around 30100). Supply and demand is usually work as support and resistance but instead of lines, supply and demand are zones and ranges. So when you try to draw Supply and demand zone, try to draw range instead of lines.
Things to keep in mind for Supply and demand zone-
1. Supply and demand zones don’t work every time like Support and resistance. Price usually respect these zones for only 2,3 times. It’s not like price will respect these zones each times when price reaches near them. Because once the liquidity is taken from these zones, they are vanished.
2. Always use freshly formed Supply and demand areas or the areas those are recently respected by the price. If price doesn’t respect the areas, it invalidates these zones and they are not valid anymore.
3. If price moves after accumulating in certain zone, it could be the next Supply and Demand zone.
*If you like the content, please share it with your friends.
This stuff is just for educational purpose. It’s not any financial advice.