Sakonnawat

1 හඹා යමින්
106 හඹා යන්නන්
90 කැමති විය
පෝස්ටු
·
--
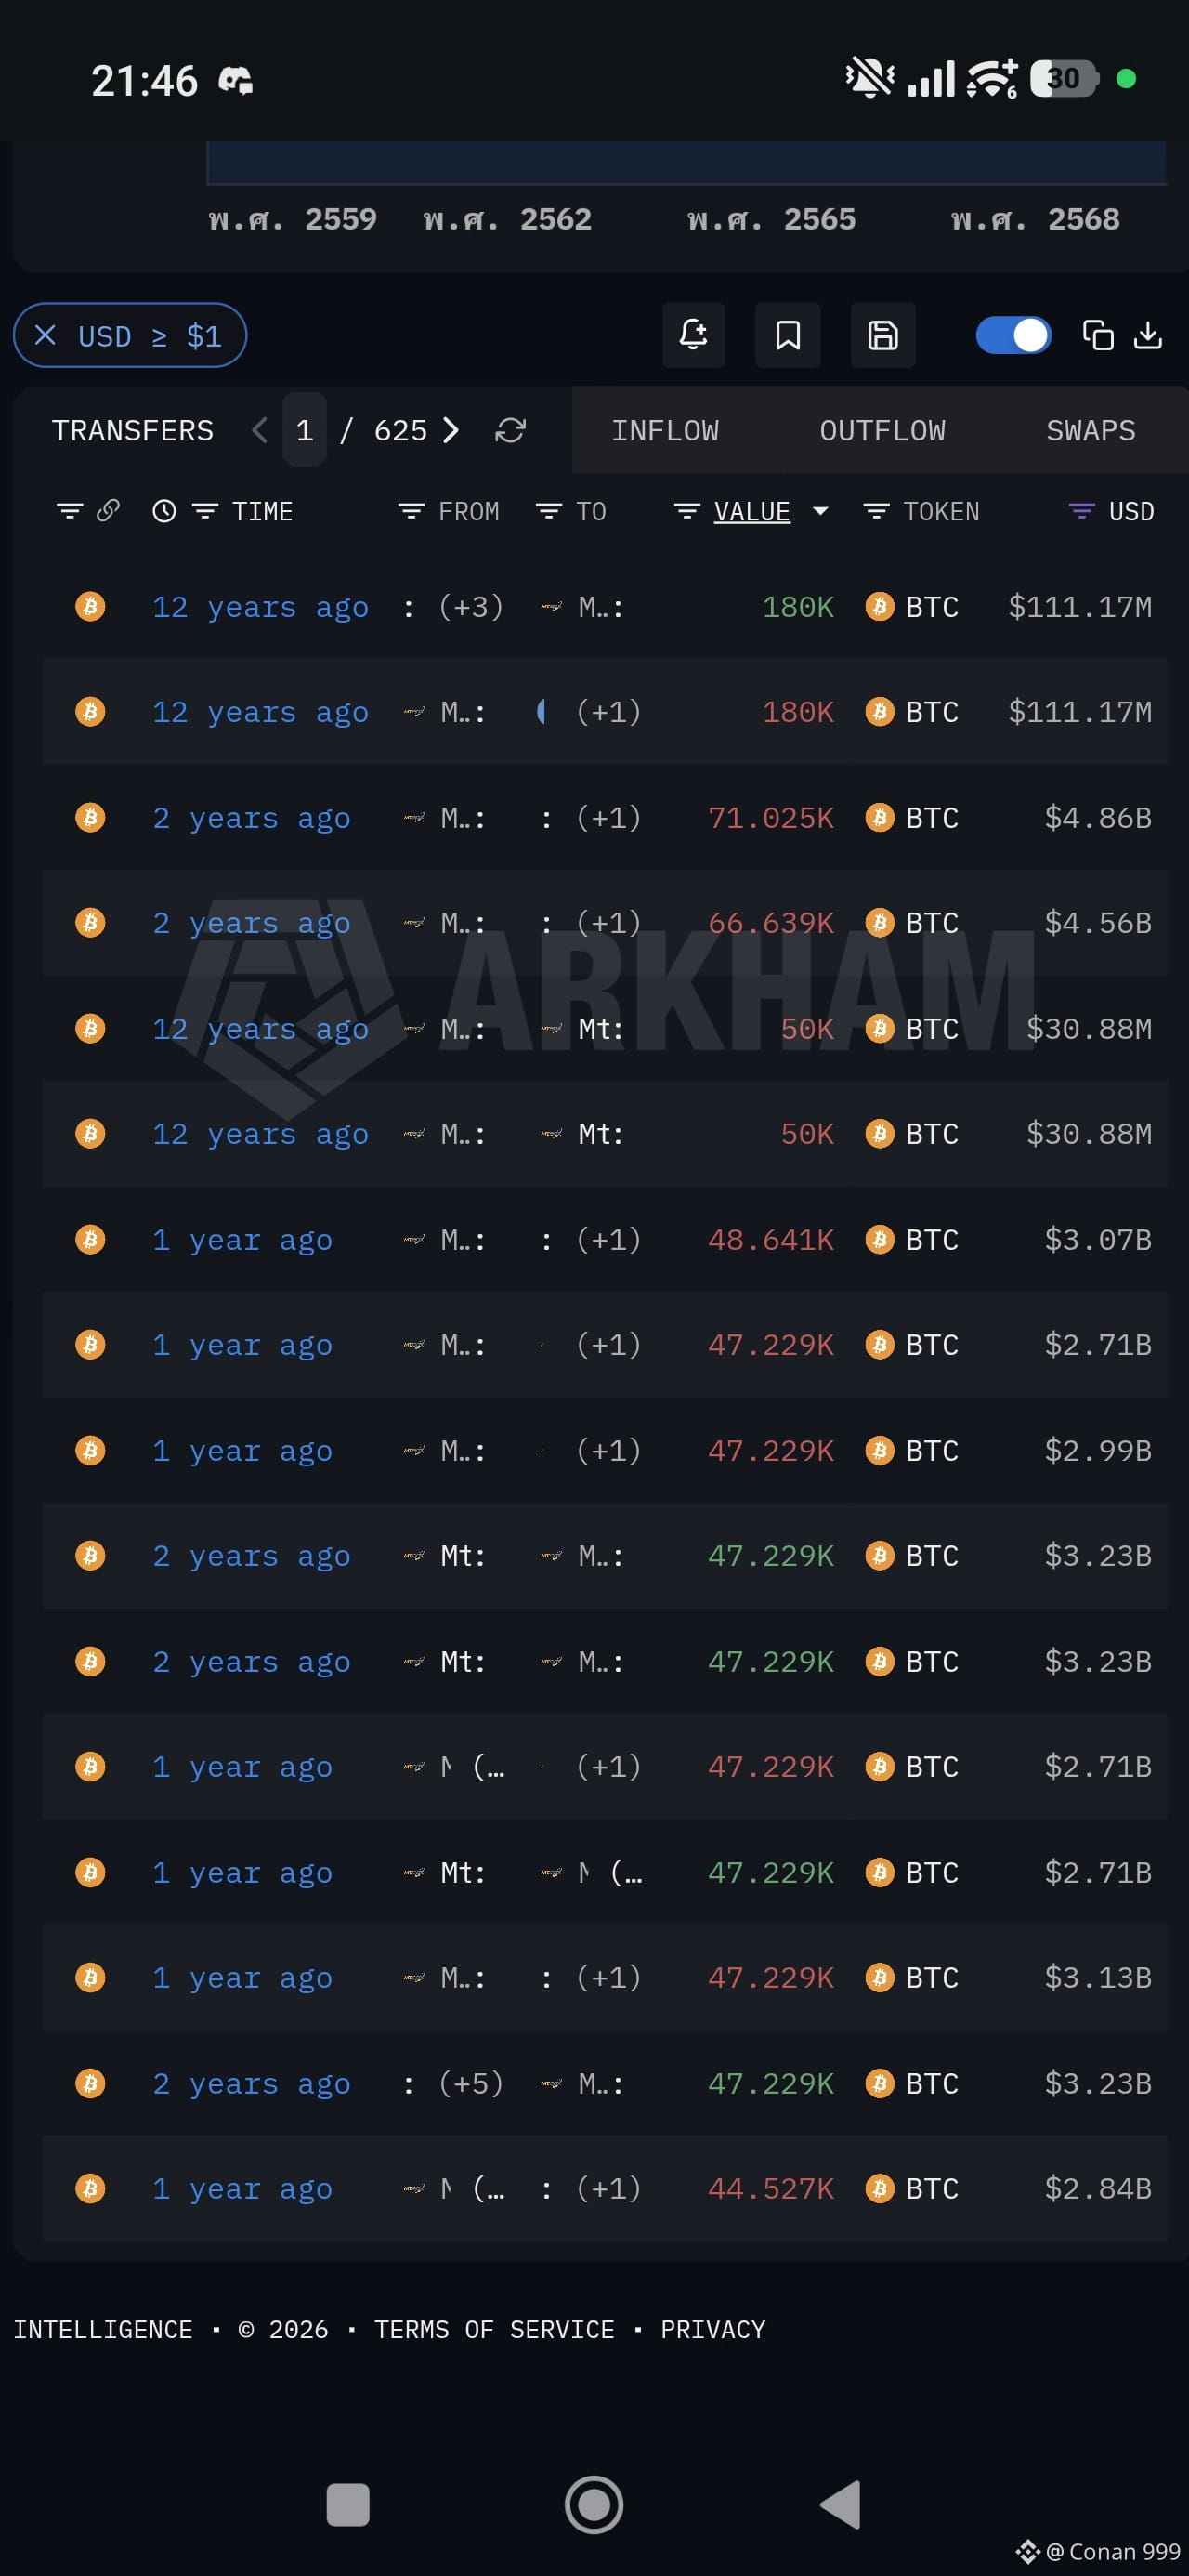
How did we even survive last year with Mt. Gox dumping that hard? This year is nothing like that, yet everyone is complaining about how brutal the market is #BTC . 🫵🤣​
·
--
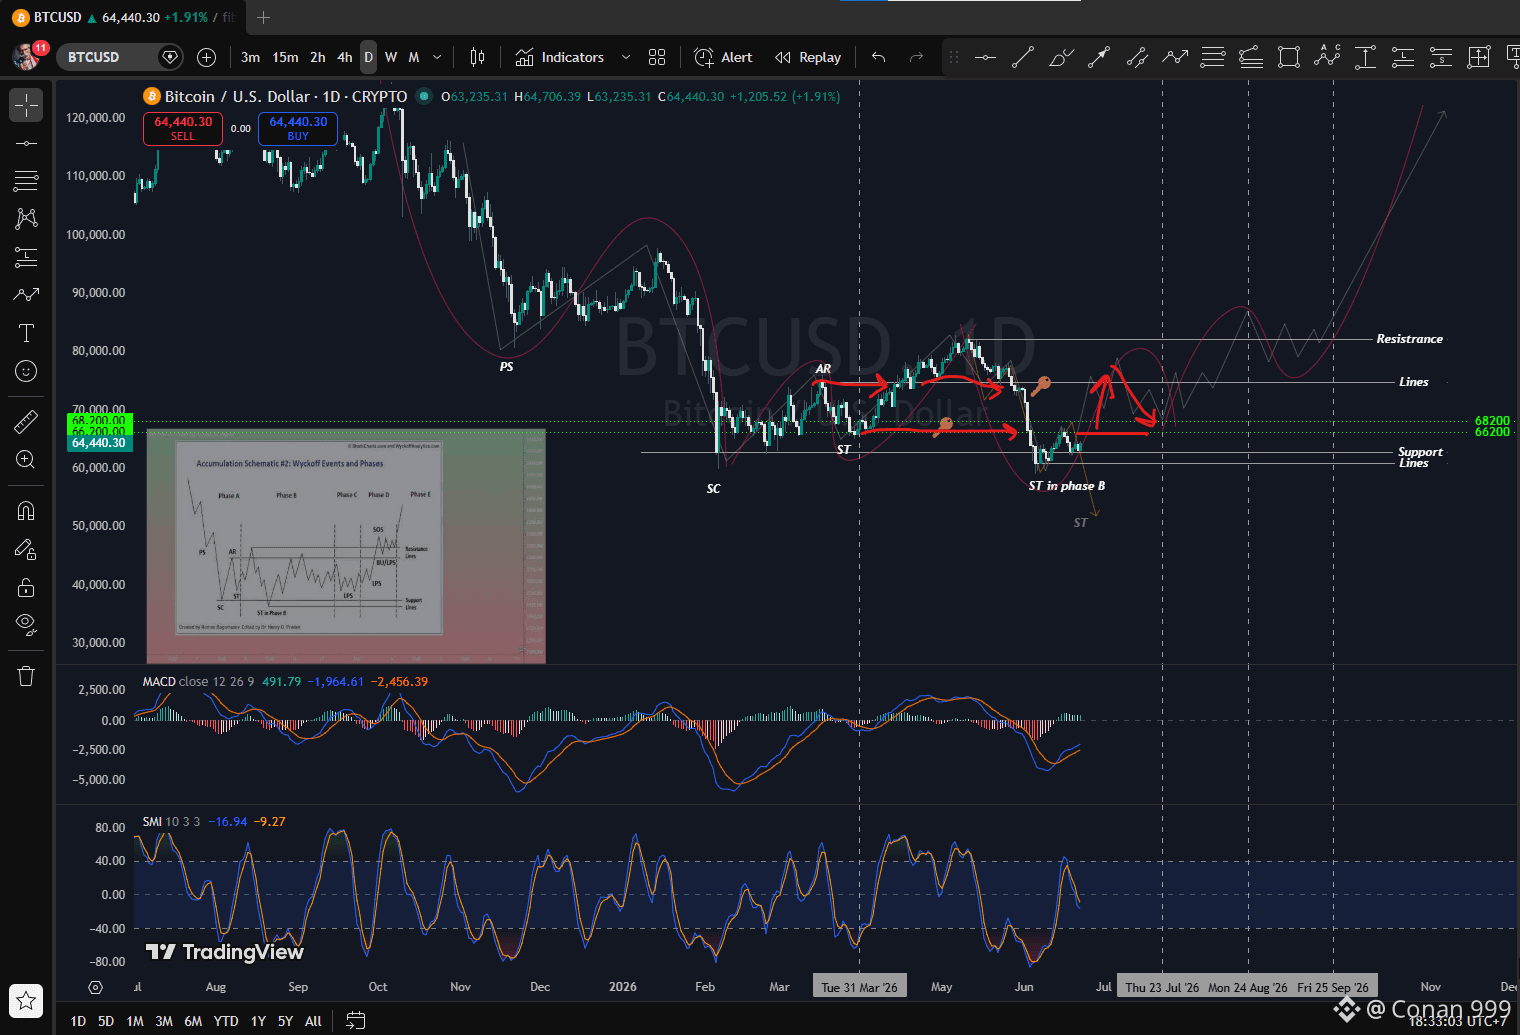
The player is day trade & the marker is wyckoff​ time. #bitcoin
·
--
උසබ තත්ත්වය
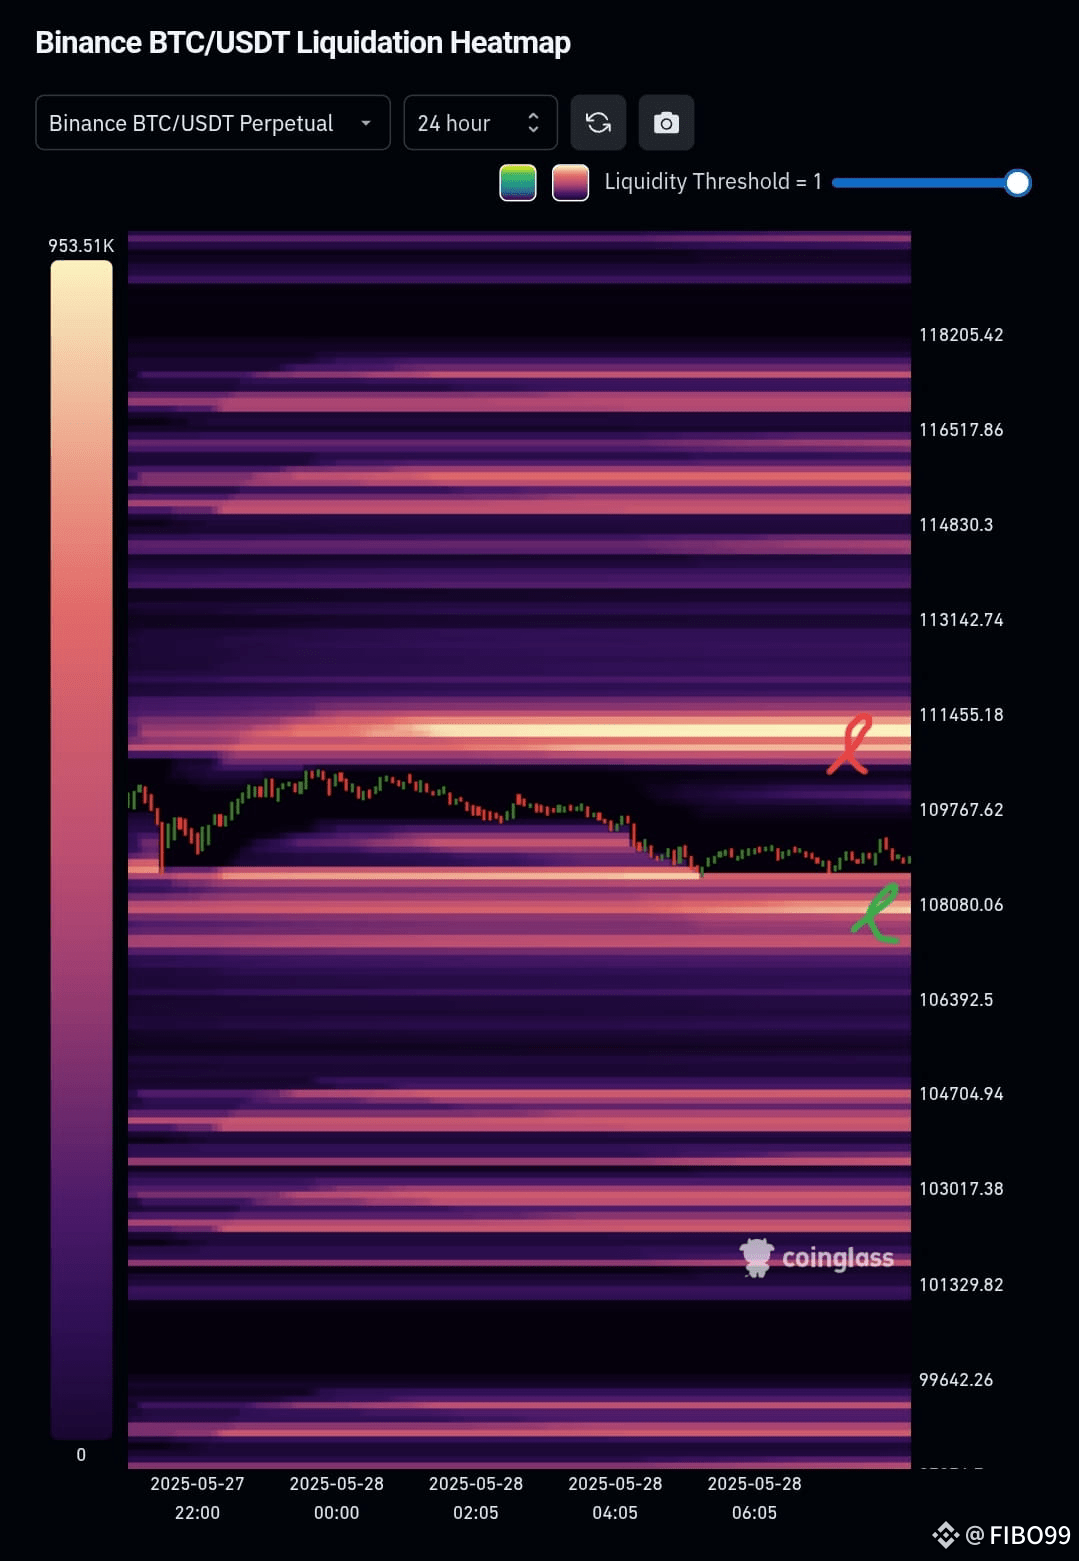
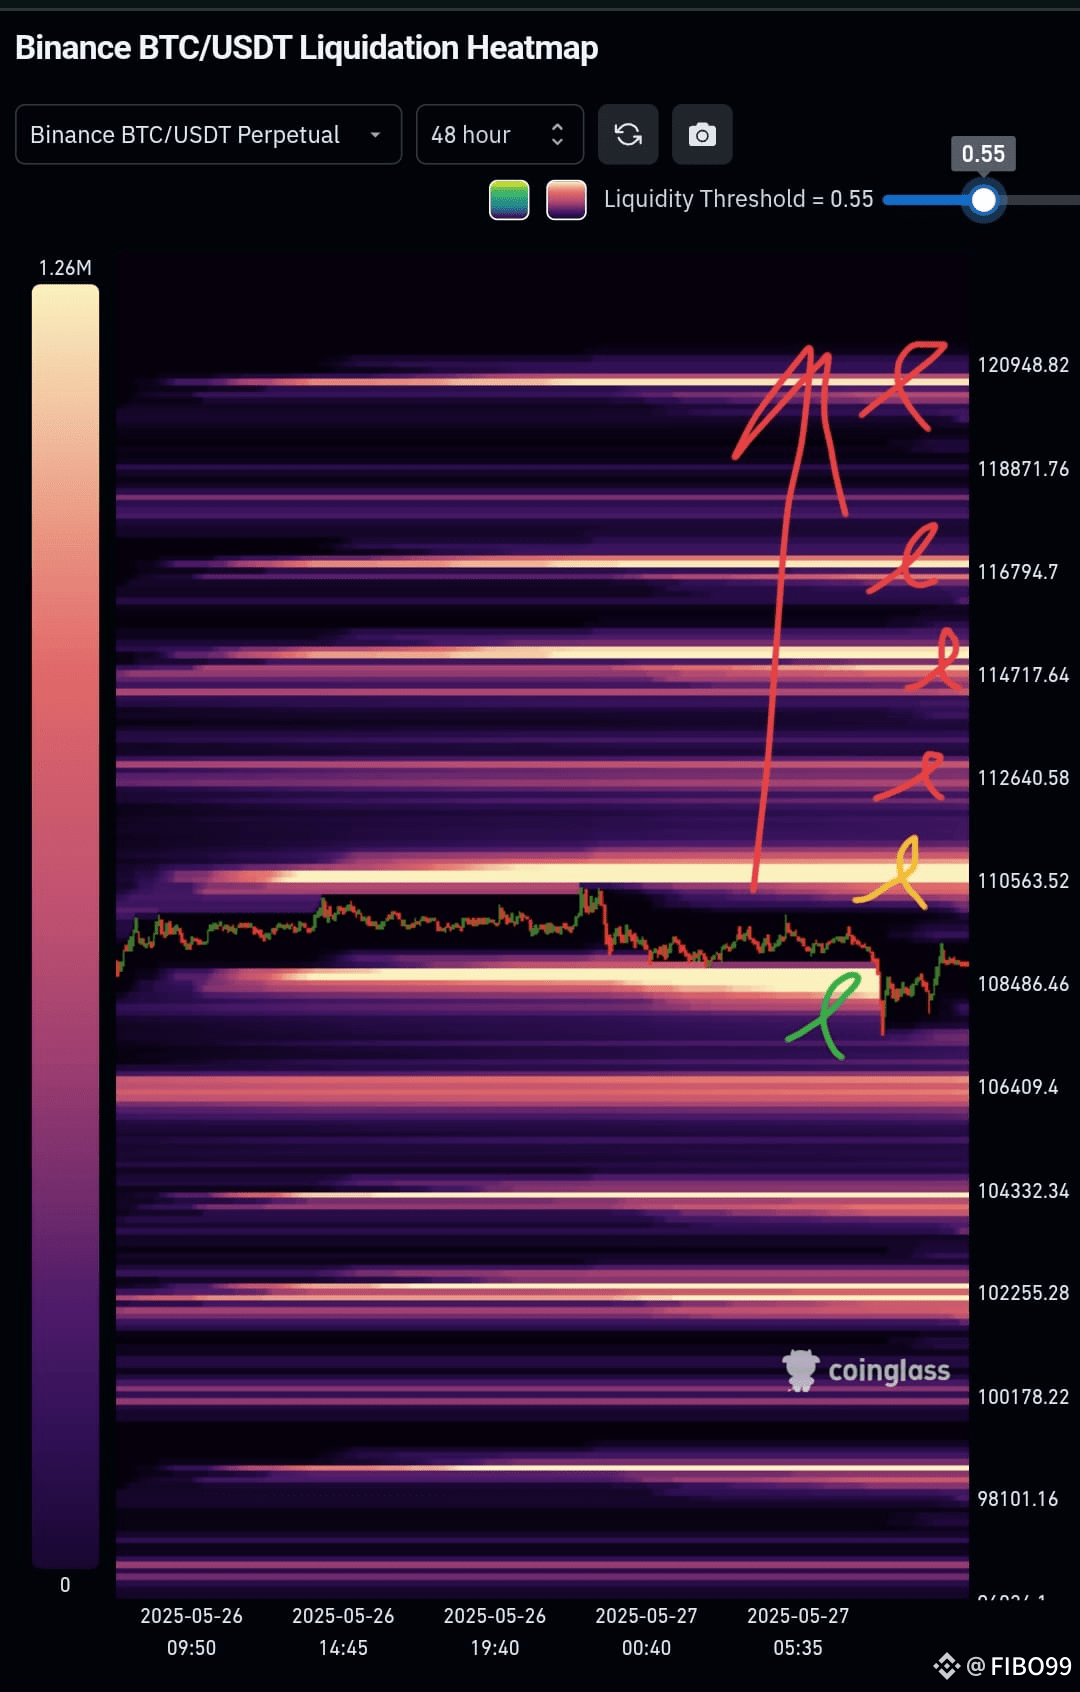
The market is facing Whale hunting. #bitcoin Liquidation​ short sell next $110,500
The market is facing Whale hunting.
#bitcoin Liquidation​ short sell next $110,500
I need some time. Go to the all time high
Sakonnawat
·
--
උසබ තත්ත්වය
Heatmap Color #BTC

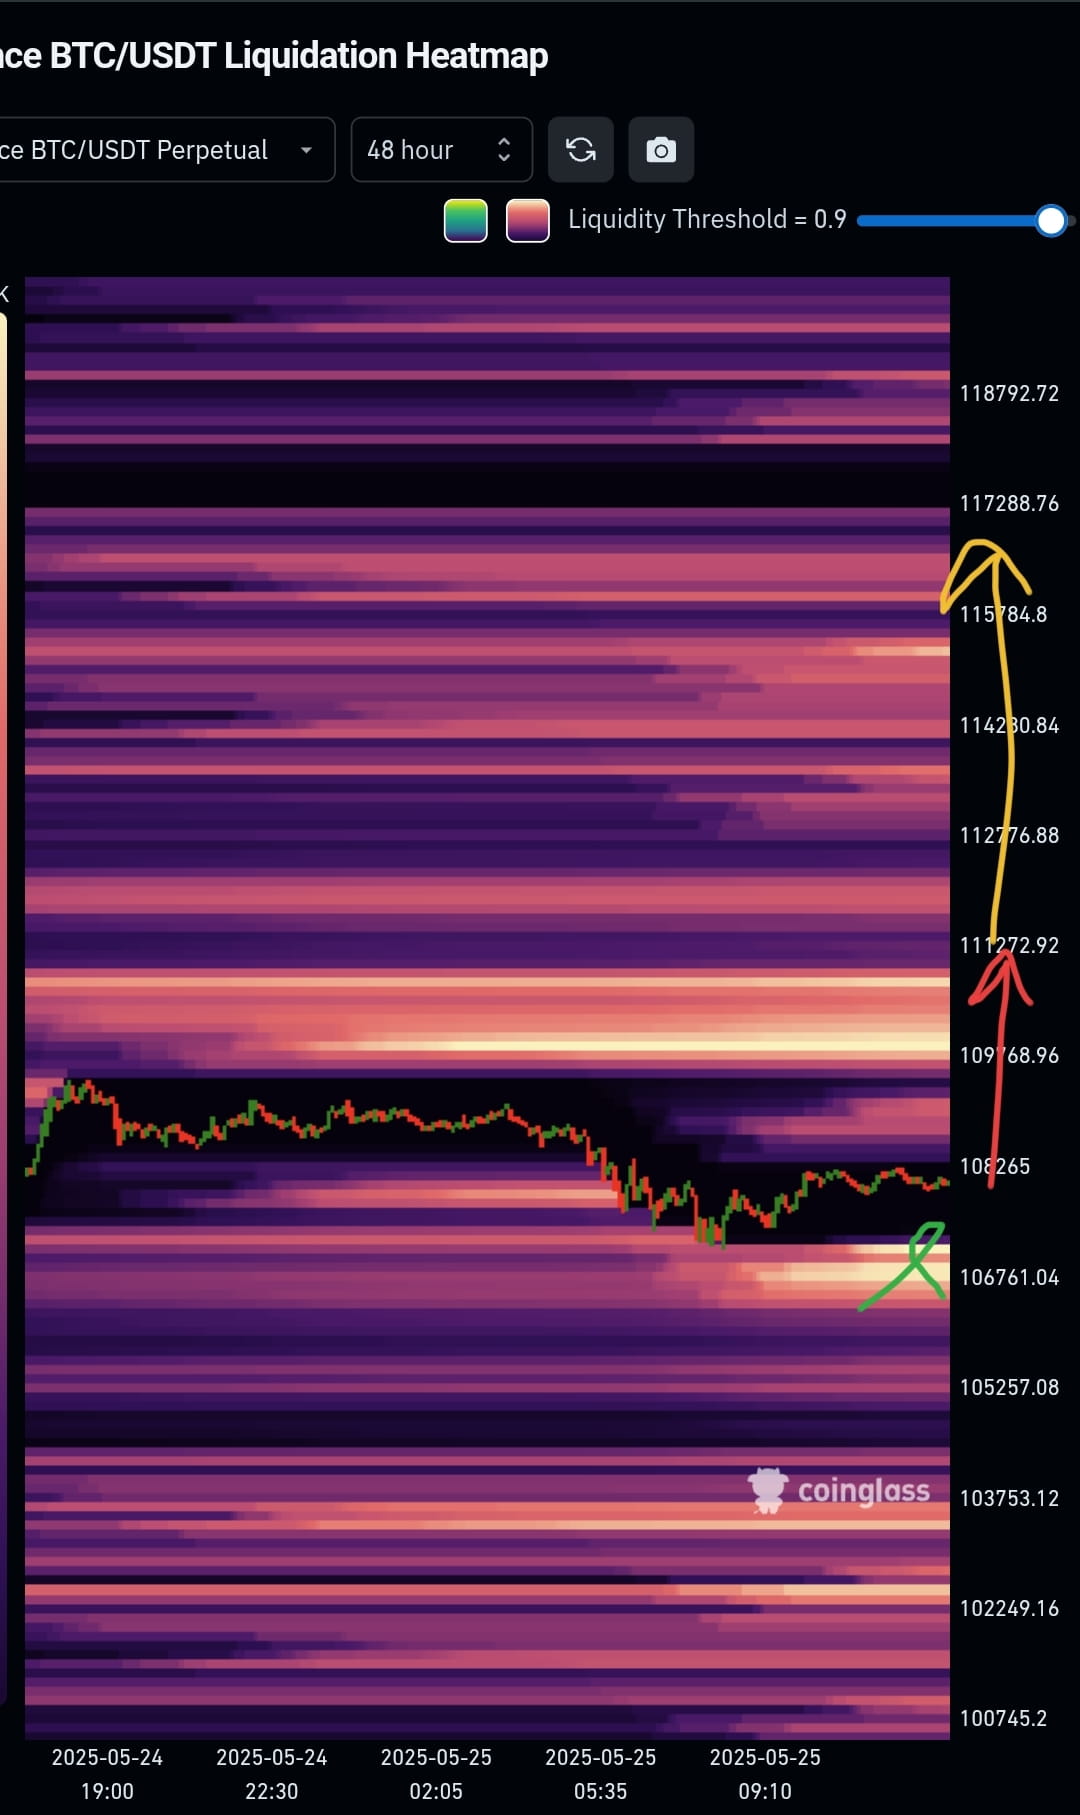
Bright yellow/white areas indicate high liquidity zones — zones where a lot of stop orders/liquidations may be triggered.

Darker areas indicate lower interest or liquidity.
Annotations:
Green Checkmark near $106,761: Likely indicates a strong support or accumulation area, where BTC has reacted or bounced.

Red Arrow at $111,272: Points to a key resistance or liquidation cluster — many short positions may get liquidated here if price moves up.

Yellow Arrow at $117,288: Indicates an even higher liquidity target, possibly another major resistance zone or whale target if momentum continues.

Interpretation:

If BTC continues up, it could:

Hit $111,272 and trigger liquidations, possibly gaining momentum.

Push toward $117,288 if that momentum is strong.

If BTC drops, the $106,761 level might be tested as support.
·
--
උසබ තත්ත්වය
Heatmap Color #BTC Bright yellow/white areas indicate high liquidity zones — zones where a lot of stop orders/liquidations may be triggered. Darker areas indicate lower interest or liquidity. Annotations: Green Checkmark near $106,761: Likely indicates a strong support or accumulation area, where BTC has reacted or bounced. Red Arrow at $111,272: Points to a key resistance or liquidation cluster — many short positions may get liquidated here if price moves up. Yellow Arrow at $117,288: Indicates an even higher liquidity target, possibly another major resistance zone or whale target if momentum continues. Interpretation: If BTC continues up, it could: Hit $111,272 and trigger liquidations, possibly gaining momentum. Push toward $117,288 if that momentum is strong. If BTC drops, the $106,761 level might be tested as support.
Heatmap Color #BTC

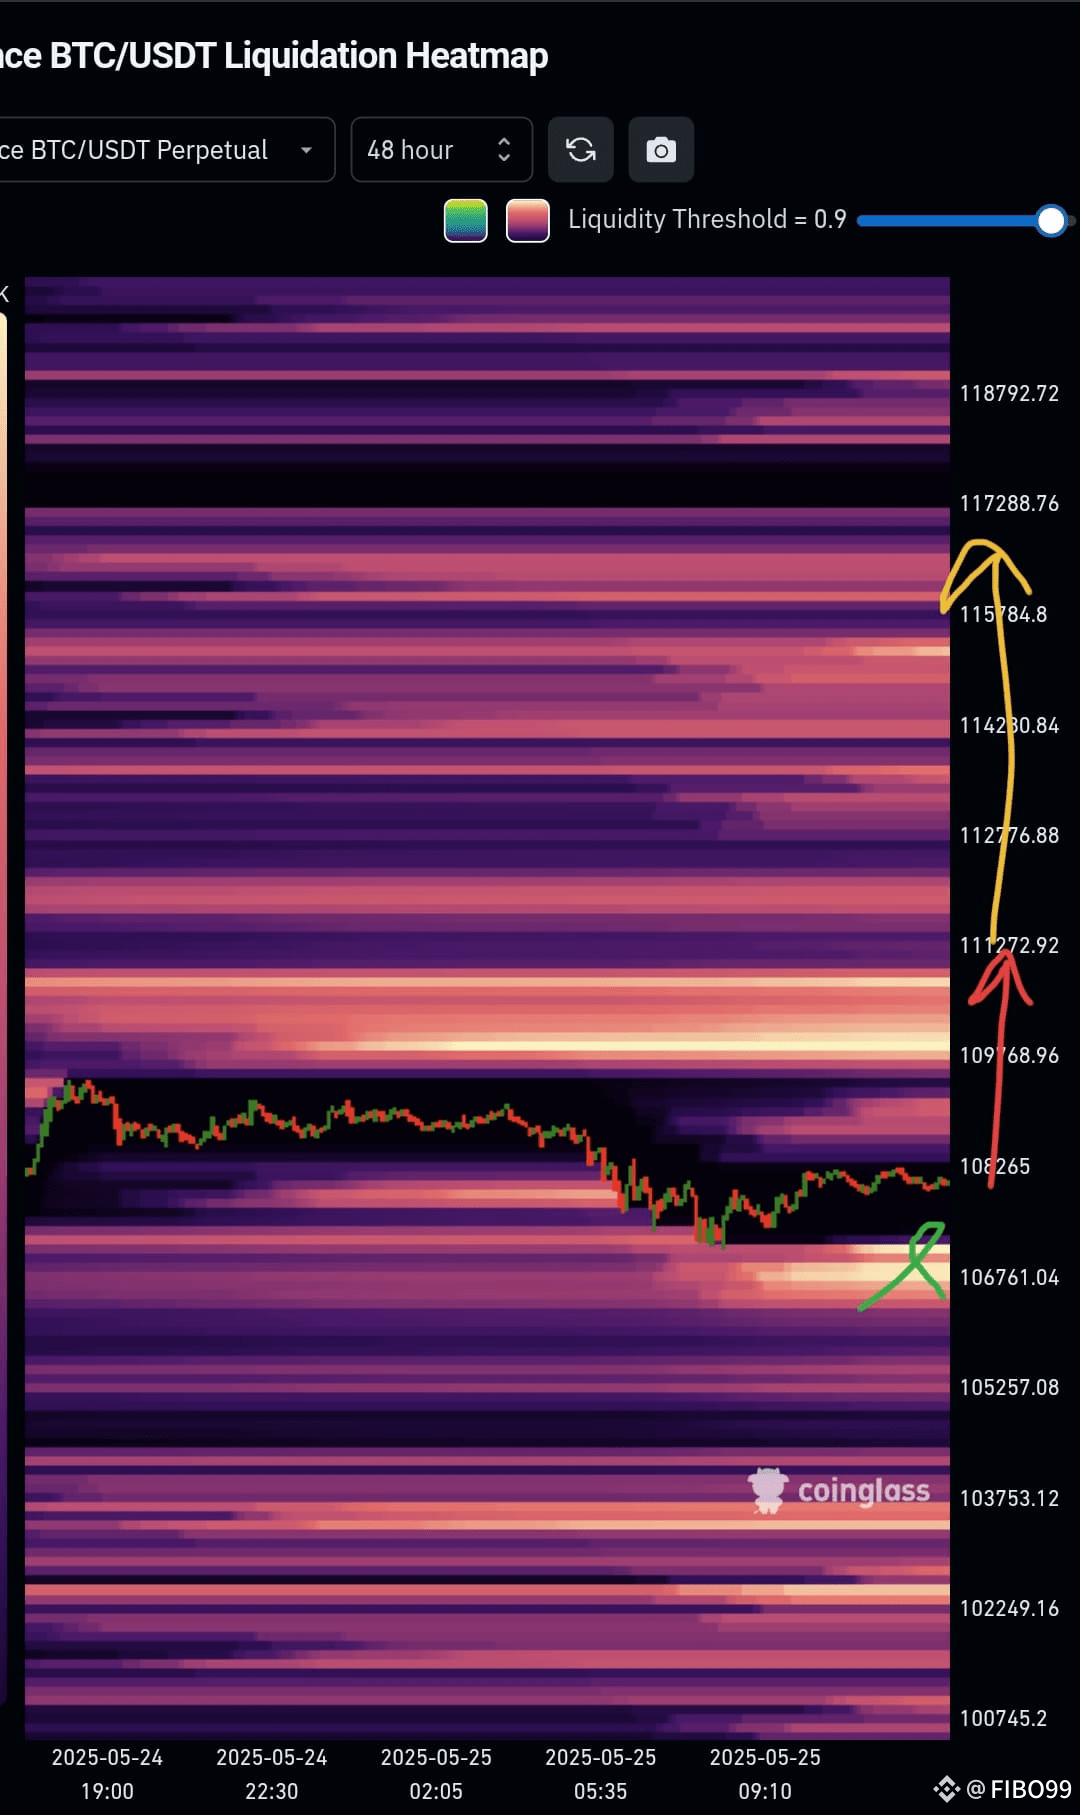
Bright yellow/white areas indicate high liquidity zones — zones where a lot of stop orders/liquidations may be triggered.

Darker areas indicate lower interest or liquidity.
Annotations:
Green Checkmark near $106,761: Likely indicates a strong support or accumulation area, where BTC has reacted or bounced.

Red Arrow at $111,272: Points to a key resistance or liquidation cluster — many short positions may get liquidated here if price moves up.

Yellow Arrow at $117,288: Indicates an even higher liquidity target, possibly another major resistance zone or whale target if momentum continues.

Interpretation:

If BTC continues up, it could:

Hit $111,272 and trigger liquidations, possibly gaining momentum.

Push toward $117,288 if that momentum is strong.

If BTC drops, the $106,761 level might be tested as support.
තවත් අන්තර්ගතයන් ගවේෂණය කිරීමට ඇතුල් වන්න
Binance චතුරශ්‍රය හි ගෝලීය ක්‍රිප්ටෝ පරිශීලකයින් හා එක්වන්න
⚡️ ක්‍රිප්ටෝ පිළිබඳ නවතම සහ ප්‍රයෝජනවත් තොරතුරු ලබා ගන්න.
💬 ලොව විශාලතම ක්‍රිප්ටෝ හුවමාරුව මගින් විශ්වාස කෙරේ.
👍 සත්‍යායනය කරන ලද නිර්මාණකරුවන්ගෙන් සැබෑ විදසුන් සොයා ගන්න.
විද්‍යුත් තැපෑල / දුරකථන අංකය
අඩවි සිතියම
කුකී මනාපයන්
වේදිකා කොන්දේසි සහ නියමයන්