
SnEmroz
1.8k පෝස්ටු

SnEmroz
වාර්තා කරන්න
පරිශීලක අවහිර කරන්න
Crypto Trader | Scalper | Challenge Master Sharing smart setups & Trade Psychology | Quality - Quantity I DYOR I (X- Marks_BTC )
31 හඹා යමින්
8.7K+ හඹා යන්නන්
9.4K+ කැමති විය
පෝස්ටු
සියල්ල
උපුටා දැක්වීම්
·
--
බෙයාරිෂ්
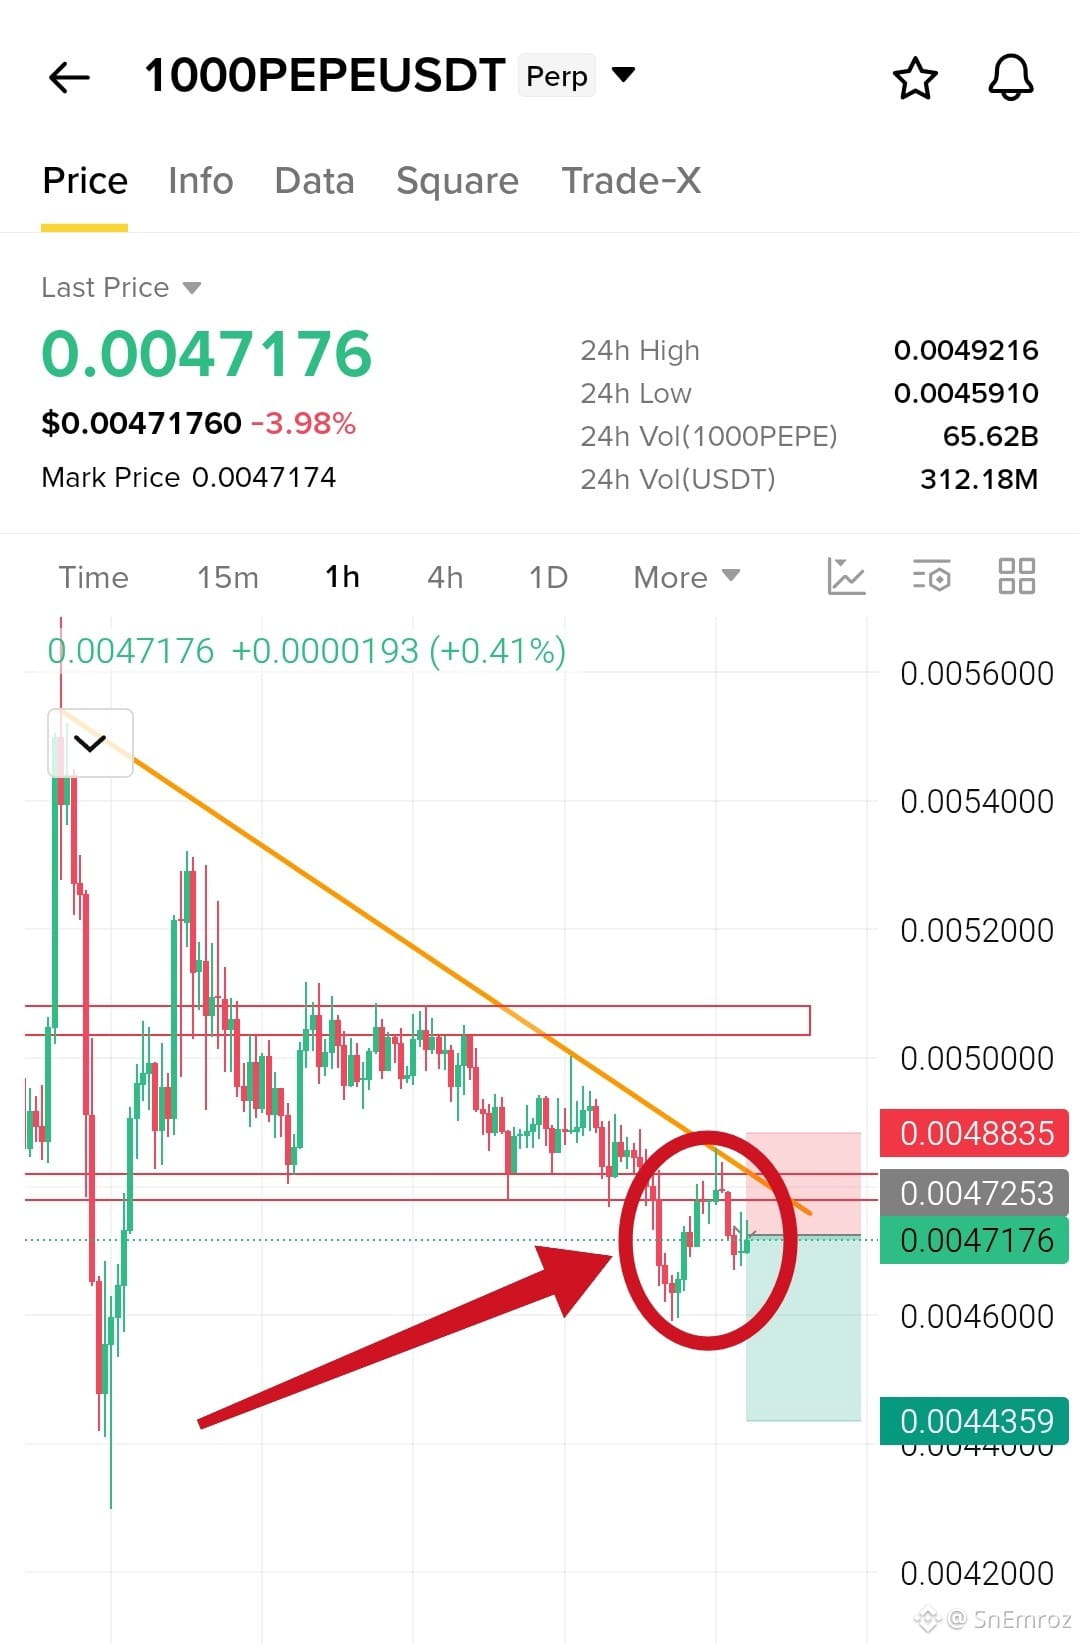
$1000PEPE Short Setup 1h Chart🔴
🔶 Descending Triangle breakdown and retest
Price made lower highs along the falling trendline and lost the flat support near 0.004725. It dipped to 0.004591 and bounced back to retest the broken level from below. The bounce got rejected near the trendline around 0.00487 and the candles are weak. Sellers are still in control. If price stays under 0.004725 a drop toward 0.004600 and then 0.004500 is likely. The full target sits at 0.004436.
🔴Short Entry 0.0047176
{future}(1000PEPEUSDT)
✅ Take Profits
TP1 0.0046000
TP2 0.0045000
TP3 0.0044359
❌ Stop Loss 0.0048835
#pepe
$1000PEPE Short Setup 1h Chart🔴
🔶 Descending Triangle breakdown and retest
Price made lower highs along the falling trendline and lost the flat support near 0.004725. It dipped to 0.004591 and bounced back to retest the broken level from below. The bounce got rejected near the trendline around 0.00487 and the candles are weak. Sellers are still in control. If price stays under 0.004725 a drop toward 0.004600 and then 0.004500 is likely. The full target sits at 0.004436.
🔴Short Entry 0.0047176
✅ Take Profits
TP1 0.0046000
TP2 0.0045000
TP3 0.0044359
❌ Stop Loss 0.0048835
#pepe
🔶 Descending Triangle breakdown and retest
Price made lower highs along the falling trendline and lost the flat support near 0.004725. It dipped to 0.004591 and bounced back to retest the broken level from below. The bounce got rejected near the trendline around 0.00487 and the candles are weak. Sellers are still in control. If price stays under 0.004725 a drop toward 0.004600 and then 0.004500 is likely. The full target sits at 0.004436.
🔴Short Entry 0.0047176
✅ Take Profits
TP1 0.0046000
TP2 0.0045000
TP3 0.0044359
❌ Stop Loss 0.0048835
#pepe
155
·
--
බෙයාරිෂ්
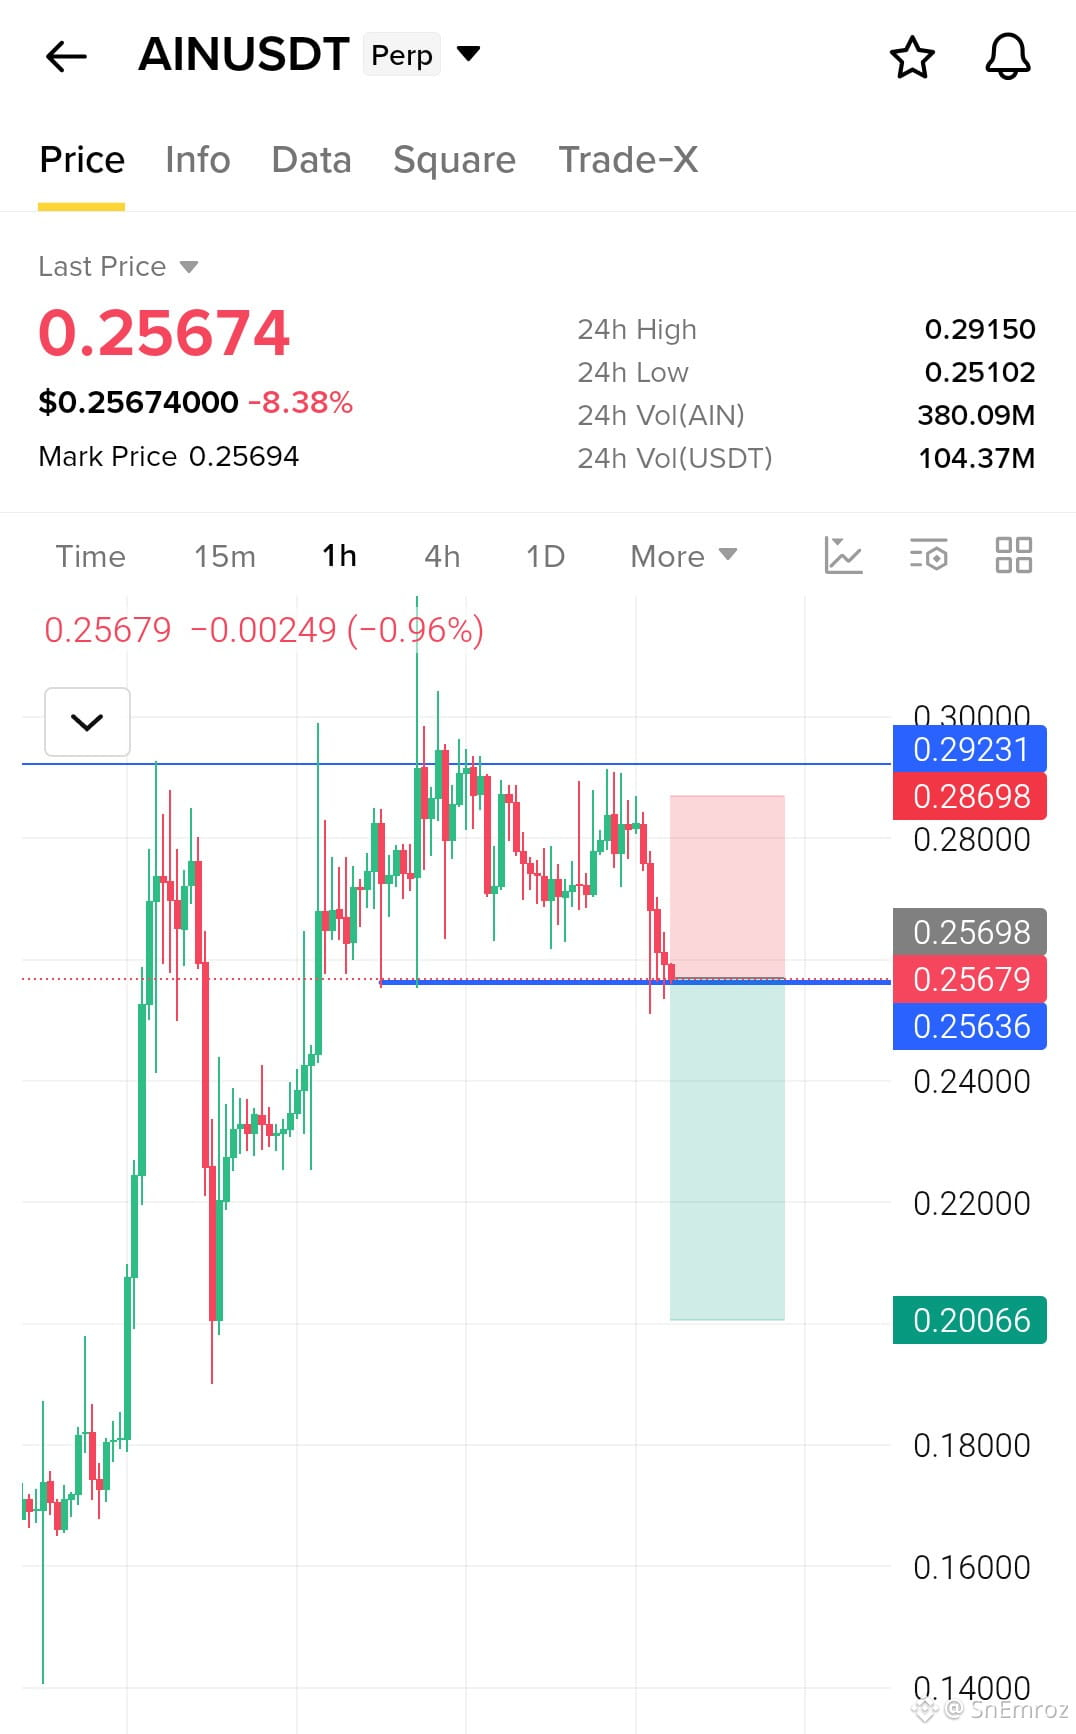
$AIN Short Setup 1h Chart🔴
🔶 Double Top M pattern
Price made two tops near 0.2923 and failed to break above them. The second top left a long wick and sellers took control after that. Price then moved sideways under the top and is now losing the 0.2564 range support with red candles. Price is down 8% today and the bounces are weak. If price stays under 0.2564 a drop toward 0.2400 and then 0.2200 is likely. The full target sits at 0.2007 near the earlier pullback low.
🔴Short Entry 0.25679
{future}(AINUSDT)
✅ Take Profits
TP1 0.24000
TP2 0.22000
TP3 0.20066
❌ Stop Loss 0.28698
#ain
$AIN Short Setup 1h Chart🔴
🔶 Double Top M pattern
Price made two tops near 0.2923 and failed to break above them. The second top left a long wick and sellers took control after that. Price then moved sideways under the top and is now losing the 0.2564 range support with red candles. Price is down 8% today and the bounces are weak. If price stays under 0.2564 a drop toward 0.2400 and then 0.2200 is likely. The full target sits at 0.2007 near the earlier pullback low.
🔴Short Entry 0.25679
✅ Take Profits
TP1 0.24000
TP2 0.22000
TP3 0.20066
❌ Stop Loss 0.28698
#ain
🔶 Double Top M pattern
Price made two tops near 0.2923 and failed to break above them. The second top left a long wick and sellers took control after that. Price then moved sideways under the top and is now losing the 0.2564 range support with red candles. Price is down 8% today and the bounces are weak. If price stays under 0.2564 a drop toward 0.2400 and then 0.2200 is likely. The full target sits at 0.2007 near the earlier pullback low.
🔴Short Entry 0.25679
✅ Take Profits
TP1 0.24000
TP2 0.22000
TP3 0.20066
❌ Stop Loss 0.28698
#ain
708
·
--
උසබ තත්ත්වය
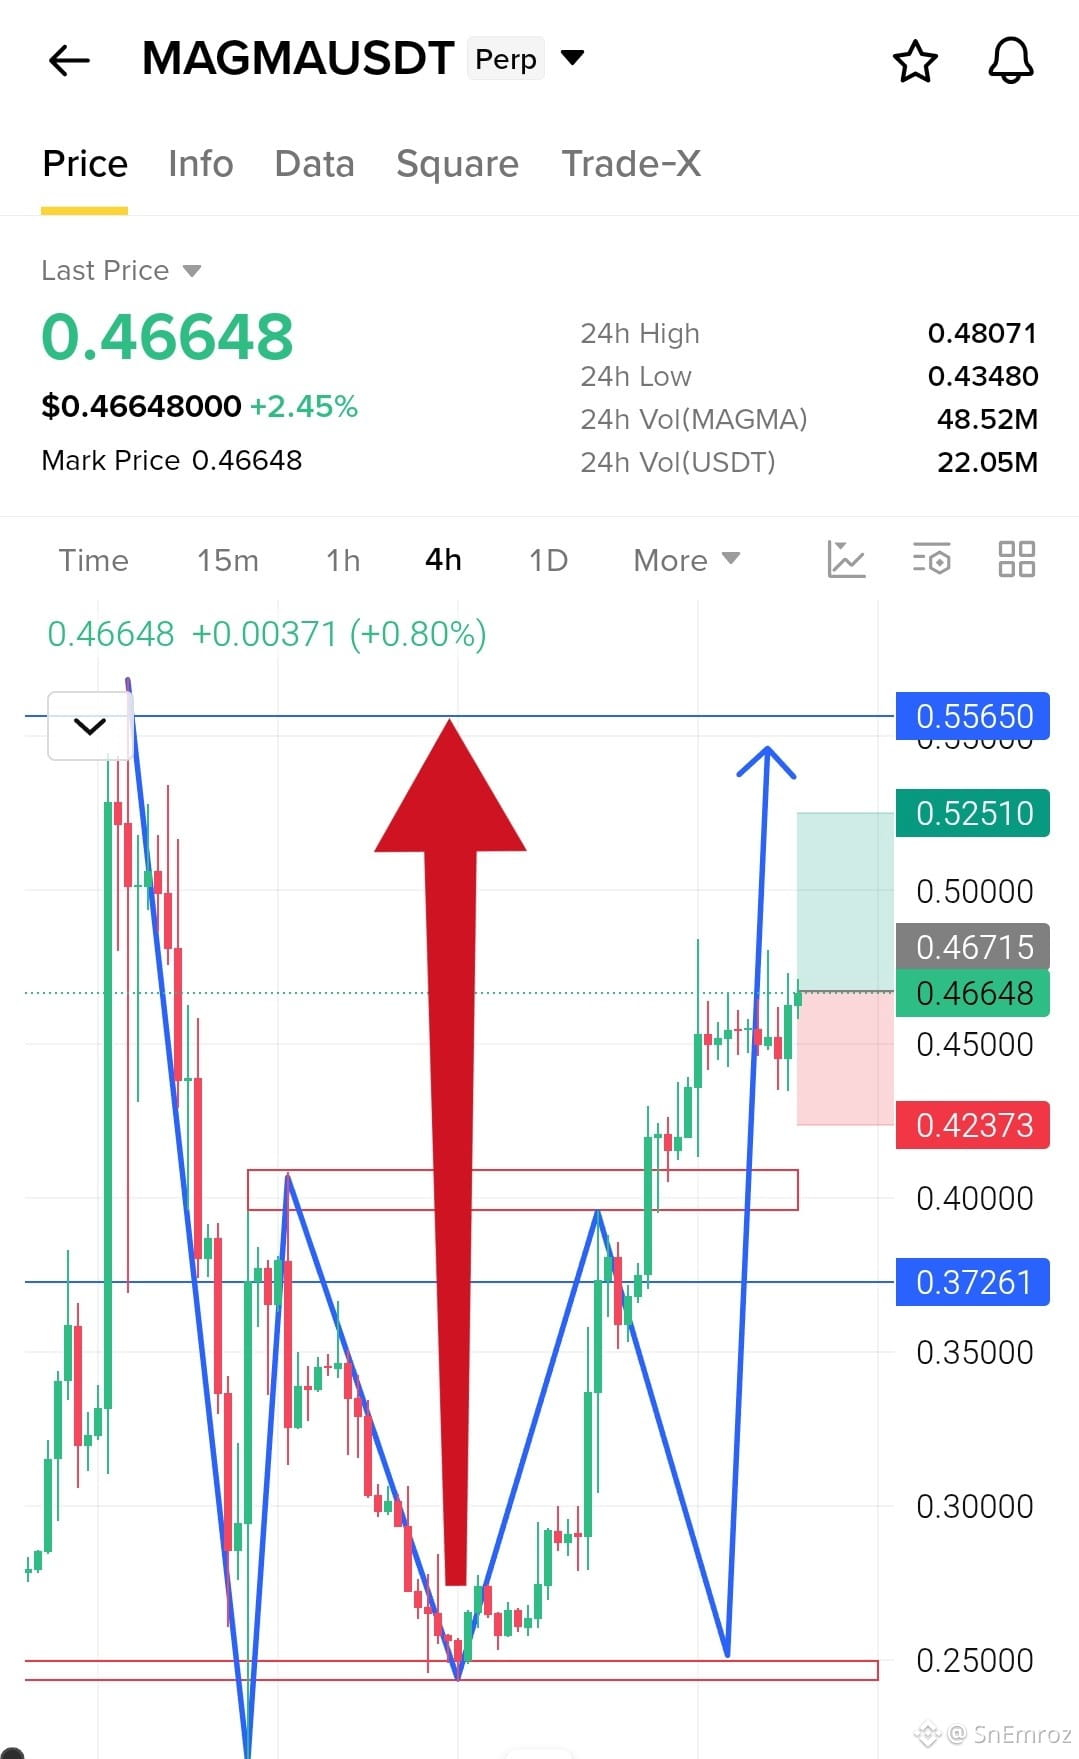
$MAGMA Long Setup 4h Chart🟢
🔶 Double bottom breakout above resistance
✏️Price dropped hard from 0.55650 and found a floor near 0.25000. It tested that floor twice and held both times. Buyers then pushed through the 0.40000 resistance zone and price is now holding above it. This looks like a double bottom with a clean breakout. If price stays above 0.42373 a move toward 0.52510 is likely.
🟢$MAGMA Entry 0.46648
{future}(MAGMAUSDT)
✅ Take Profits
TP1 0.47500
TP2 0.50000
TP3 0.52510
❌ Stop Loss 0.42373
#magma
$MAGMA Long Setup 4h Chart🟢
🔶 Double bottom breakout above resistance
✏️Price dropped hard from 0.55650 and found a floor near 0.25000. It tested that floor twice and held both times. Buyers then pushed through the 0.40000 resistance zone and price is now holding above it. This looks like a double bottom with a clean breakout. If price stays above 0.42373 a move toward 0.52510 is likely.
🟢$MAGMA Entry 0.46648
✅ Take Profits
TP1 0.47500
TP2 0.50000
TP3 0.52510
❌ Stop Loss 0.42373
#magma
🔶 Double bottom breakout above resistance
✏️Price dropped hard from 0.55650 and found a floor near 0.25000. It tested that floor twice and held both times. Buyers then pushed through the 0.40000 resistance zone and price is now holding above it. This looks like a double bottom with a clean breakout. If price stays above 0.42373 a move toward 0.52510 is likely.
🟢$MAGMA Entry 0.46648
✅ Take Profits
TP1 0.47500
TP2 0.50000
TP3 0.52510
❌ Stop Loss 0.42373
#magma
905
·
--
බෙයාරිෂ්
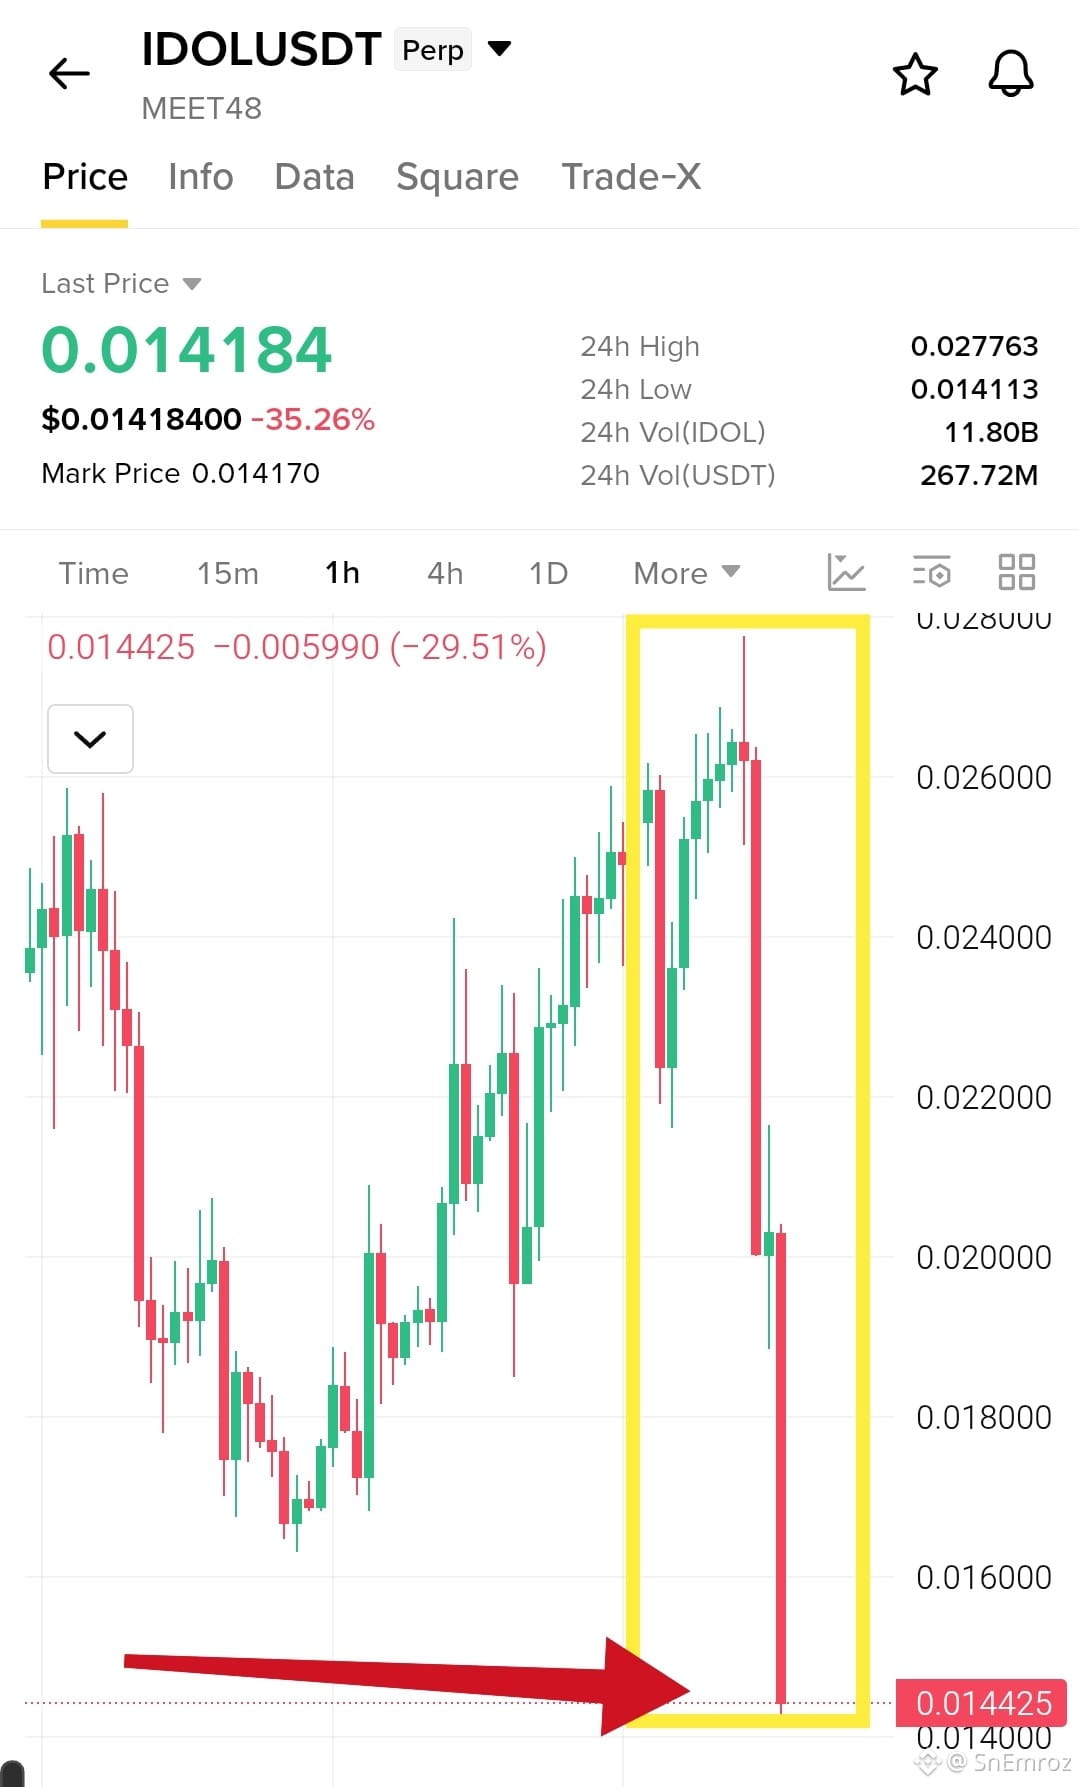
What's Going On With $IDOL ?
A massive sell-off has hit IDOL. After climbing toward $0.0270, the price suddenly reversed and dropped to around $0.0144.
That's more than a 35% decline in 24 hours.
The size of the red candles raises serious questions. Is this a major holder selling, a liquidation cascade, or a sudden loss of market confidence?
For now, the $0.0140 area is an important level to watch. A recovery could bring relief, but further weakness may expose the price to more downside.
What do you think caused this sudden crash?
#idol
{future}(IDOLUSDT)
What's Going On With $IDOL ?
A massive sell-off has hit IDOL. After climbing toward $0.0270, the price suddenly reversed and dropped to around $0.0144.
That's more than a 35% decline in 24 hours.
The size of the red candles raises serious questions. Is this a major holder selling, a liquidation cascade, or a sudden loss of market confidence?
For now, the $0.0140 area is an important level to watch. A recovery could bring relief, but further weakness may expose the price to more downside.
What do you think caused this sudden crash?
#idol
A massive sell-off has hit IDOL. After climbing toward $0.0270, the price suddenly reversed and dropped to around $0.0144.
That's more than a 35% decline in 24 hours.
The size of the red candles raises serious questions. Is this a major holder selling, a liquidation cascade, or a sudden loss of market confidence?
For now, the $0.0140 area is an important level to watch. A recovery could bring relief, but further weakness may expose the price to more downside.
What do you think caused this sudden crash?
#idol
5
3
4.4k
·
--
උසබ තත්ත්වය
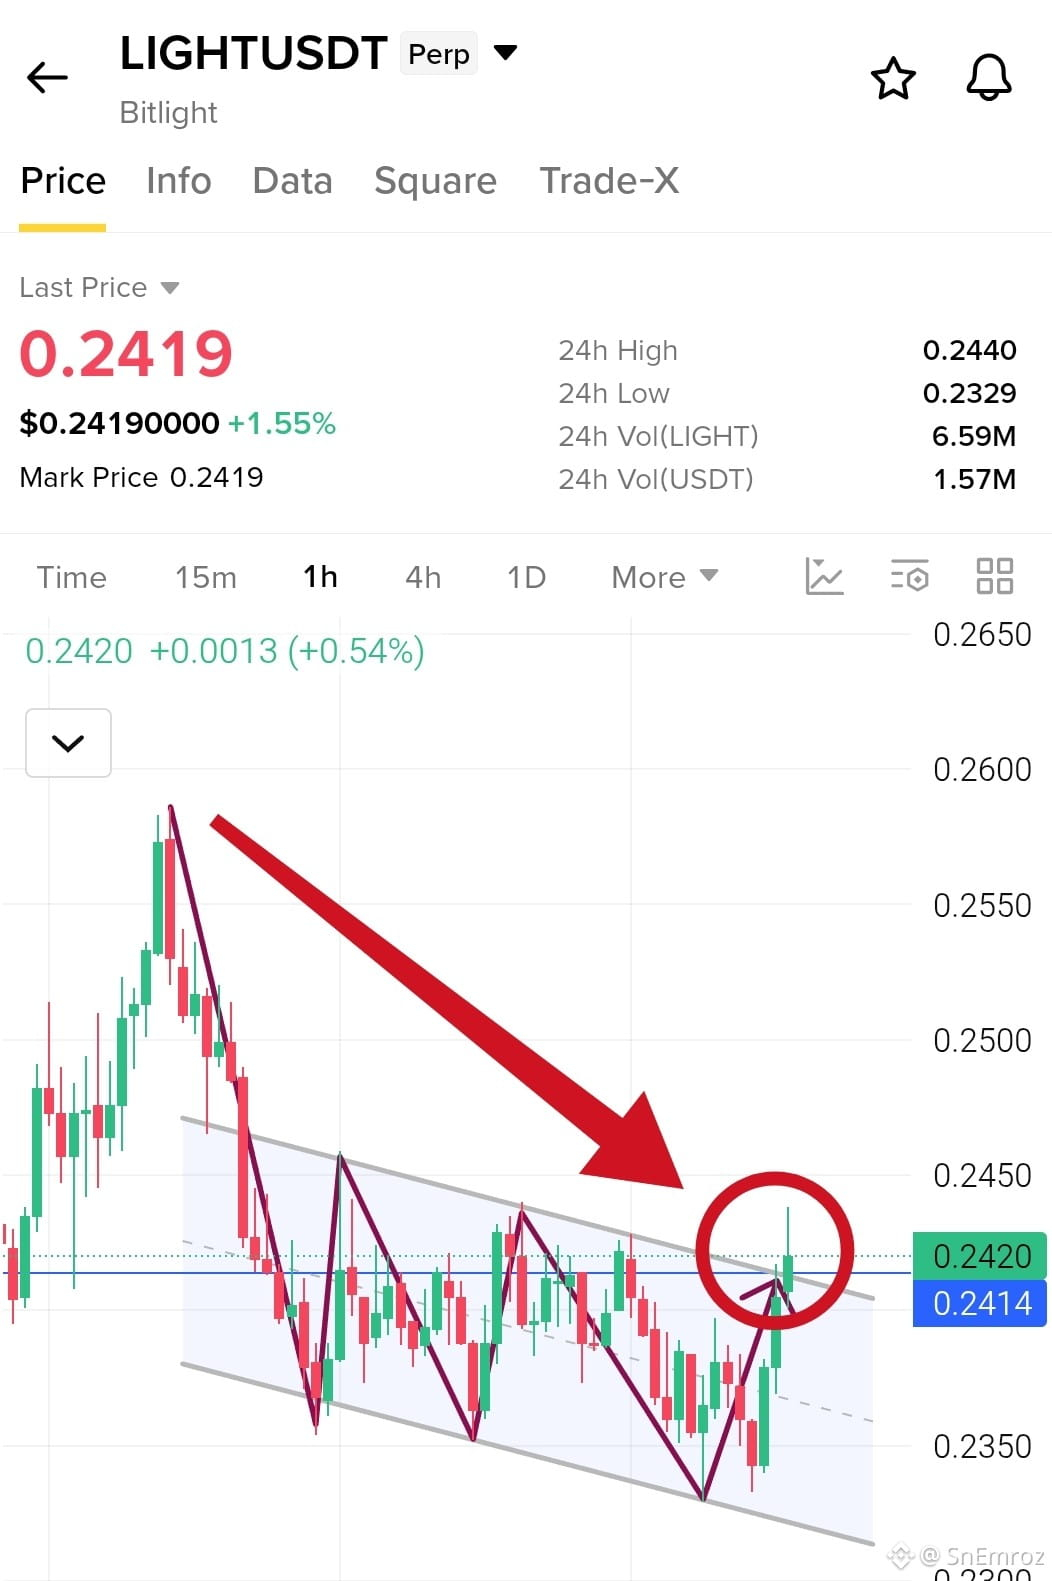
$LIGHT is forming a Descending Channel, and price is now approaching the upper resistance.
A confirmed breakout above the $0.2420–$0.2440 zone could signal a bullish reversal and open the way toward $0.2500.
{future}(LIGHTUSDT)
If buying momentum continues, $0.2580 is the potential extended target.
I’m watching for a strong 1H candle close above the channel, supported by rising volume. A successful retest of the breakout zone would add further confirmation.
Key level to watch: $0.2440.
#light
$LIGHT is forming a Descending Channel, and price is now approaching the upper resistance.
A confirmed breakout above the $0.2420–$0.2440 zone could signal a bullish reversal and open the way toward $0.2500.
If buying momentum continues, $0.2580 is the potential extended target.
I’m watching for a strong 1H candle close above the channel, supported by rising volume. A successful retest of the breakout zone would add further confirmation.
Key level to watch: $0.2440.
#light
A confirmed breakout above the $0.2420–$0.2440 zone could signal a bullish reversal and open the way toward $0.2500.
If buying momentum continues, $0.2580 is the potential extended target.
I’m watching for a strong 1H candle close above the channel, supported by rising volume. A successful retest of the breakout zone would add further confirmation.
Key level to watch: $0.2440.
#light
1.4k
·
--
බෙයාරිෂ්
$JUP Update 1H Chart
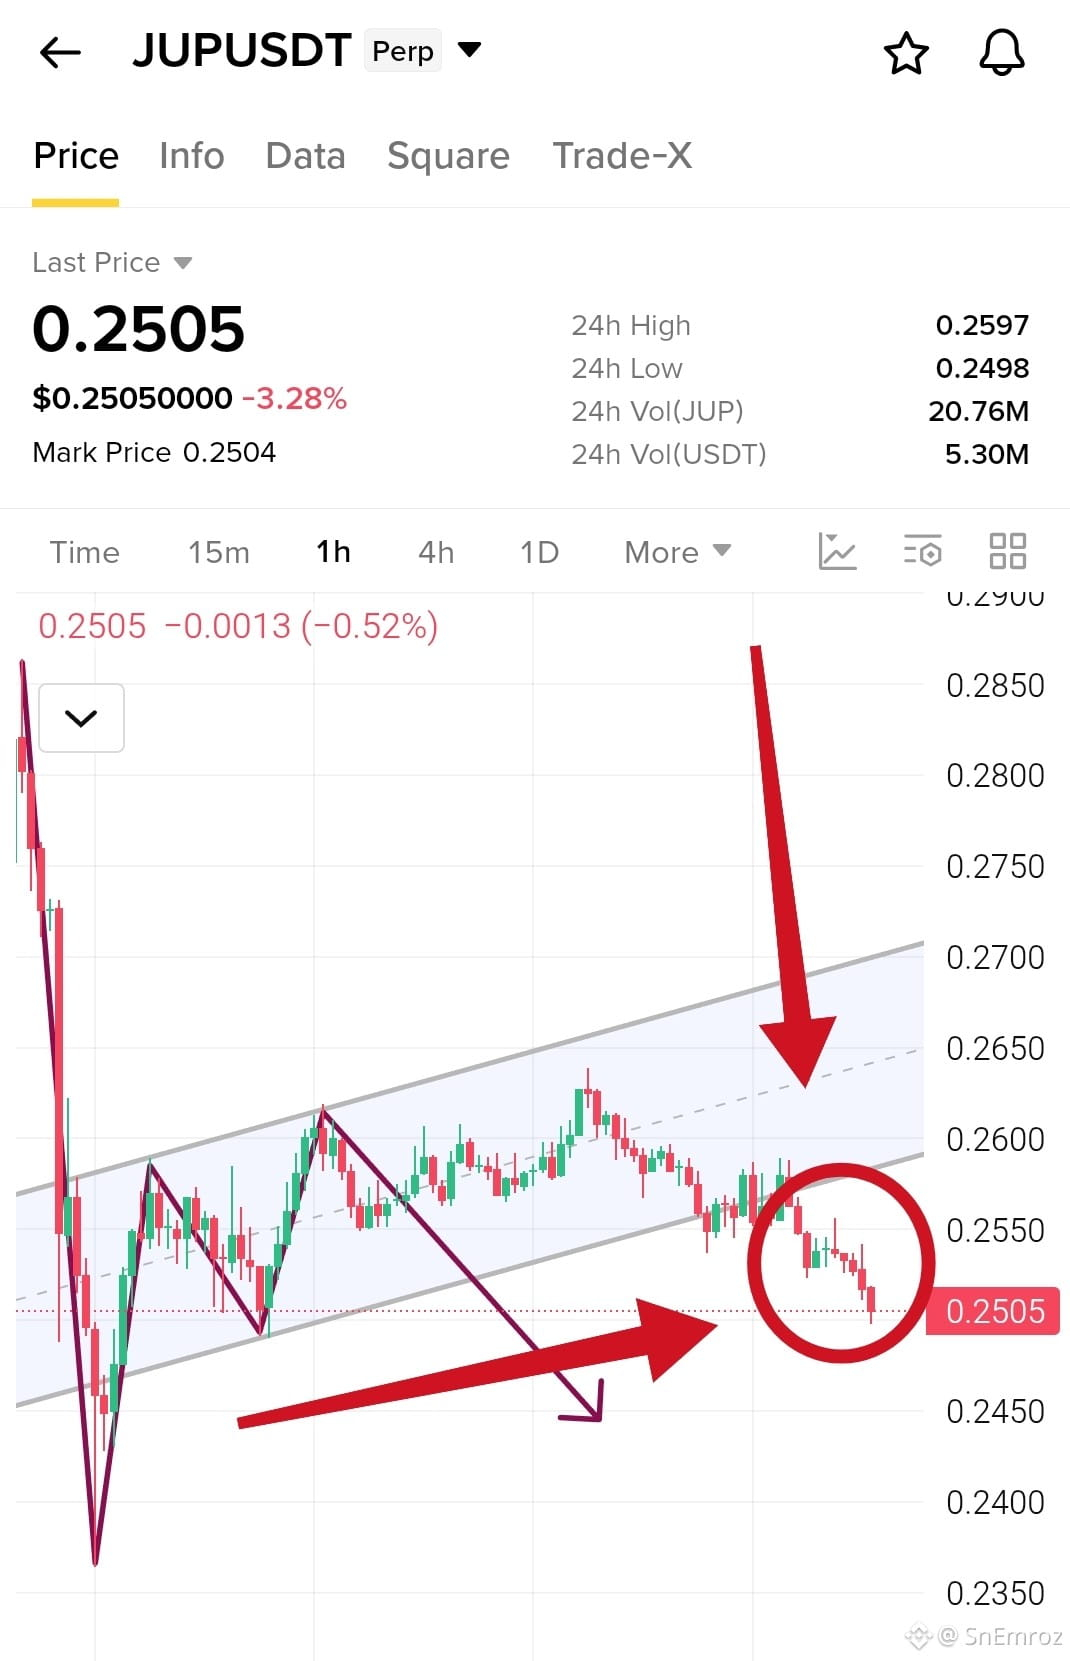
Our bearish scenario played out as expected.
JUP broke below the rising channel support and selling pressure pushed the price down to $0.2505. The breakdown confirms the weakness we were watching in the previous analysis.
Now the $0.2500 area is an important level to watch. If sellers maintain control, the next downside area could be around $0.2450.
{future}(JUPUSDT)
A recovery back above the broken channel could weaken the bearish setup. For now, the price action is moving in the direction we anticipated.
#JUP
$JUP Update 1H Chart
Our bearish scenario played out as expected.
JUP broke below the rising channel support and selling pressure pushed the price down to $0.2505. The breakdown confirms the weakness we were watching in the previous analysis.
Now the $0.2500 area is an important level to watch. If sellers maintain control, the next downside area could be around $0.2450.
A recovery back above the broken channel could weaken the bearish setup. For now, the price action is moving in the direction we anticipated.
#JUP
Our bearish scenario played out as expected.
JUP broke below the rising channel support and selling pressure pushed the price down to $0.2505. The breakdown confirms the weakness we were watching in the previous analysis.
Now the $0.2500 area is an important level to watch. If sellers maintain control, the next downside area could be around $0.2450.
A recovery back above the broken channel could weaken the bearish setup. For now, the price action is moving in the direction we anticipated.
#JUP
1
466
·
--
බෙයාරිෂ්
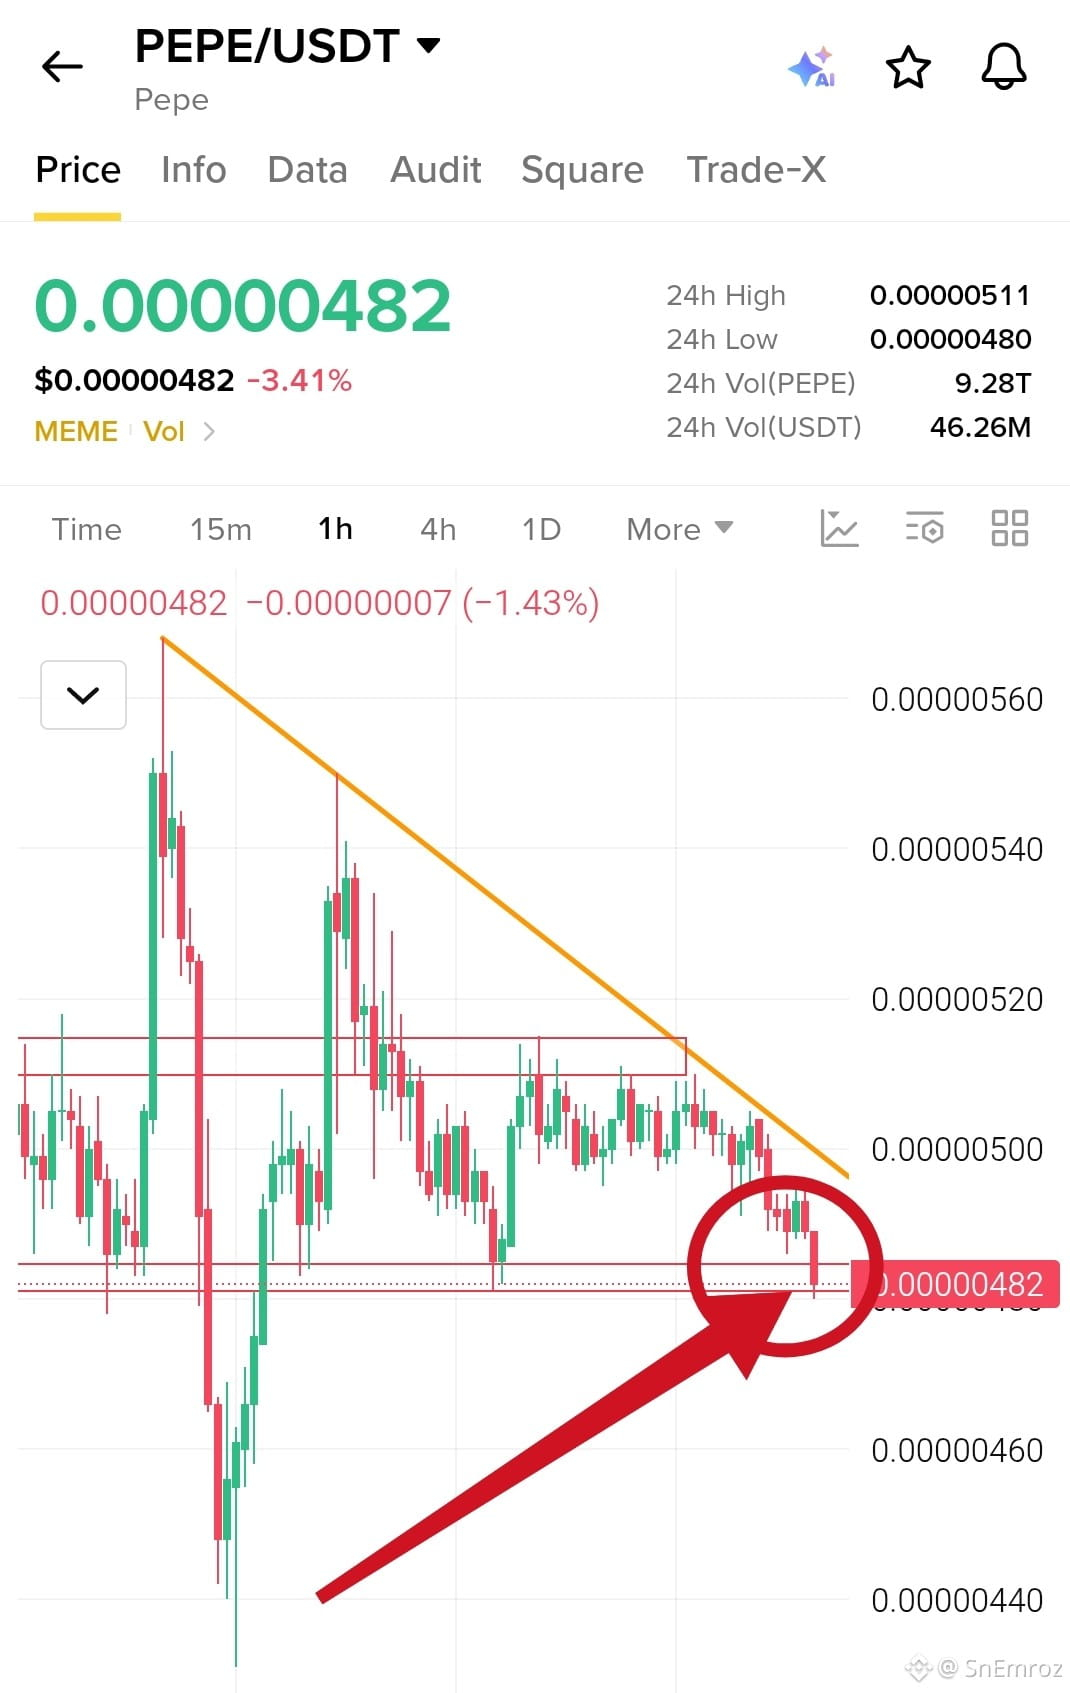
$PEPE chart shows a Descending Triangle.
Lower highs keep pressing down along the falling trendline while the flat support sits near 0.00000481 to 0.00000485.
Price is right on that support after another red candle. Sellers are in control and every bounce got rejected under the trendline.
This support was tested a few times so it is getting weaker. Each touch makes a breakdown more likely.
A clean 1h close below 0.00000480 confirms the breakdown. Then the next levels are 0.00000460 and the old wick low near 0.00000431.
If buyers defend this zone a bounce can reach 0.00000500 where the trendline waits. Above that the 0.00000510 to 0.00000515 zone is the big wall.
{future}(1000PEPEUSDT)
Bias stays bearish until price closes above the trendline.
#pepe #1000pepe
$PEPE chart shows a Descending Triangle.
Lower highs keep pressing down along the falling trendline while the flat support sits near 0.00000481 to 0.00000485.
Price is right on that support after another red candle. Sellers are in control and every bounce got rejected under the trendline.
This support was tested a few times so it is getting weaker. Each touch makes a breakdown more likely.
A clean 1h close below 0.00000480 confirms the breakdown. Then the next levels are 0.00000460 and the old wick low near 0.00000431.
If buyers defend this zone a bounce can reach 0.00000500 where the trendline waits. Above that the 0.00000510 to 0.00000515 zone is the big wall.
Bias stays bearish until price closes above the trendline.
#pepe #1000pepe
Lower highs keep pressing down along the falling trendline while the flat support sits near 0.00000481 to 0.00000485.
Price is right on that support after another red candle. Sellers are in control and every bounce got rejected under the trendline.
This support was tested a few times so it is getting weaker. Each touch makes a breakdown more likely.
A clean 1h close below 0.00000480 confirms the breakdown. Then the next levels are 0.00000460 and the old wick low near 0.00000431.
If buyers defend this zone a bounce can reach 0.00000500 where the trendline waits. Above that the 0.00000510 to 0.00000515 zone is the big wall.
Bias stays bearish until price closes above the trendline.
#pepe #1000pepe
6
2.6k
·
--
බෙයාරිෂ්
$CROSS Short Setup 1h Chart🔴
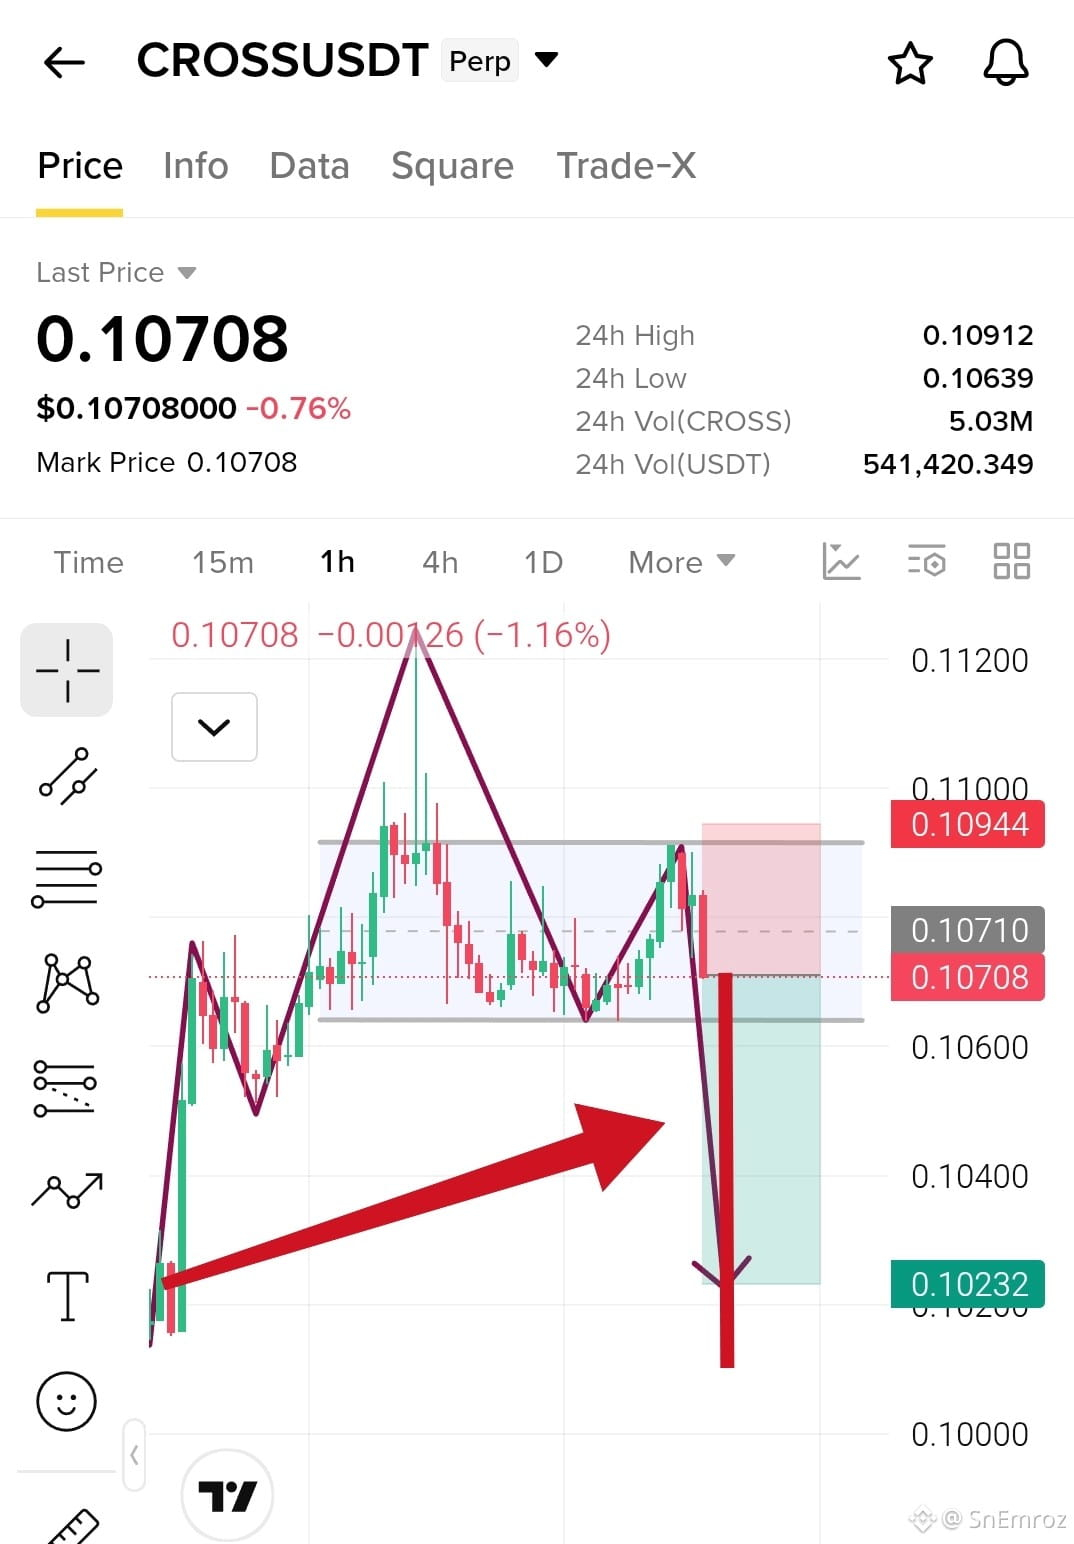
🔶 Head and Shoulders pattern
Price made a left shoulder near 0.1077 and a head at 0.1125 with a long spike. The right shoulder came back near 0.1091 and got rejected at the top of the range. The last candle is red and sellers are pressing price toward the neckline near 0.1064. A close under the neckline confirms the pattern and opens the way to 0.1023. If price breaks above 0.1094 the setup is gone.
🔴Short Entry 0.10708
{future}(CROSSUSDT)
✅ Take Profits
TP1 0.10600
TP2 0.10400
TP3 0.10232
❌ Stop Loss 0.10944
#cross
$CROSS Short Setup 1h Chart🔴
🔶 Head and Shoulders pattern
Price made a left shoulder near 0.1077 and a head at 0.1125 with a long spike. The right shoulder came back near 0.1091 and got rejected at the top of the range. The last candle is red and sellers are pressing price toward the neckline near 0.1064. A close under the neckline confirms the pattern and opens the way to 0.1023. If price breaks above 0.1094 the setup is gone.
🔴Short Entry 0.10708
✅ Take Profits
TP1 0.10600
TP2 0.10400
TP3 0.10232
❌ Stop Loss 0.10944
#cross
🔶 Head and Shoulders pattern
Price made a left shoulder near 0.1077 and a head at 0.1125 with a long spike. The right shoulder came back near 0.1091 and got rejected at the top of the range. The last candle is red and sellers are pressing price toward the neckline near 0.1064. A close under the neckline confirms the pattern and opens the way to 0.1023. If price breaks above 0.1094 the setup is gone.
🔴Short Entry 0.10708
✅ Take Profits
TP1 0.10600
TP2 0.10400
TP3 0.10232
❌ Stop Loss 0.10944
#cross
1
332
·
--
බෙයාරිෂ්
$EDEN Short Setup 1h Chart🔴
Failed breakout at the falling trendline
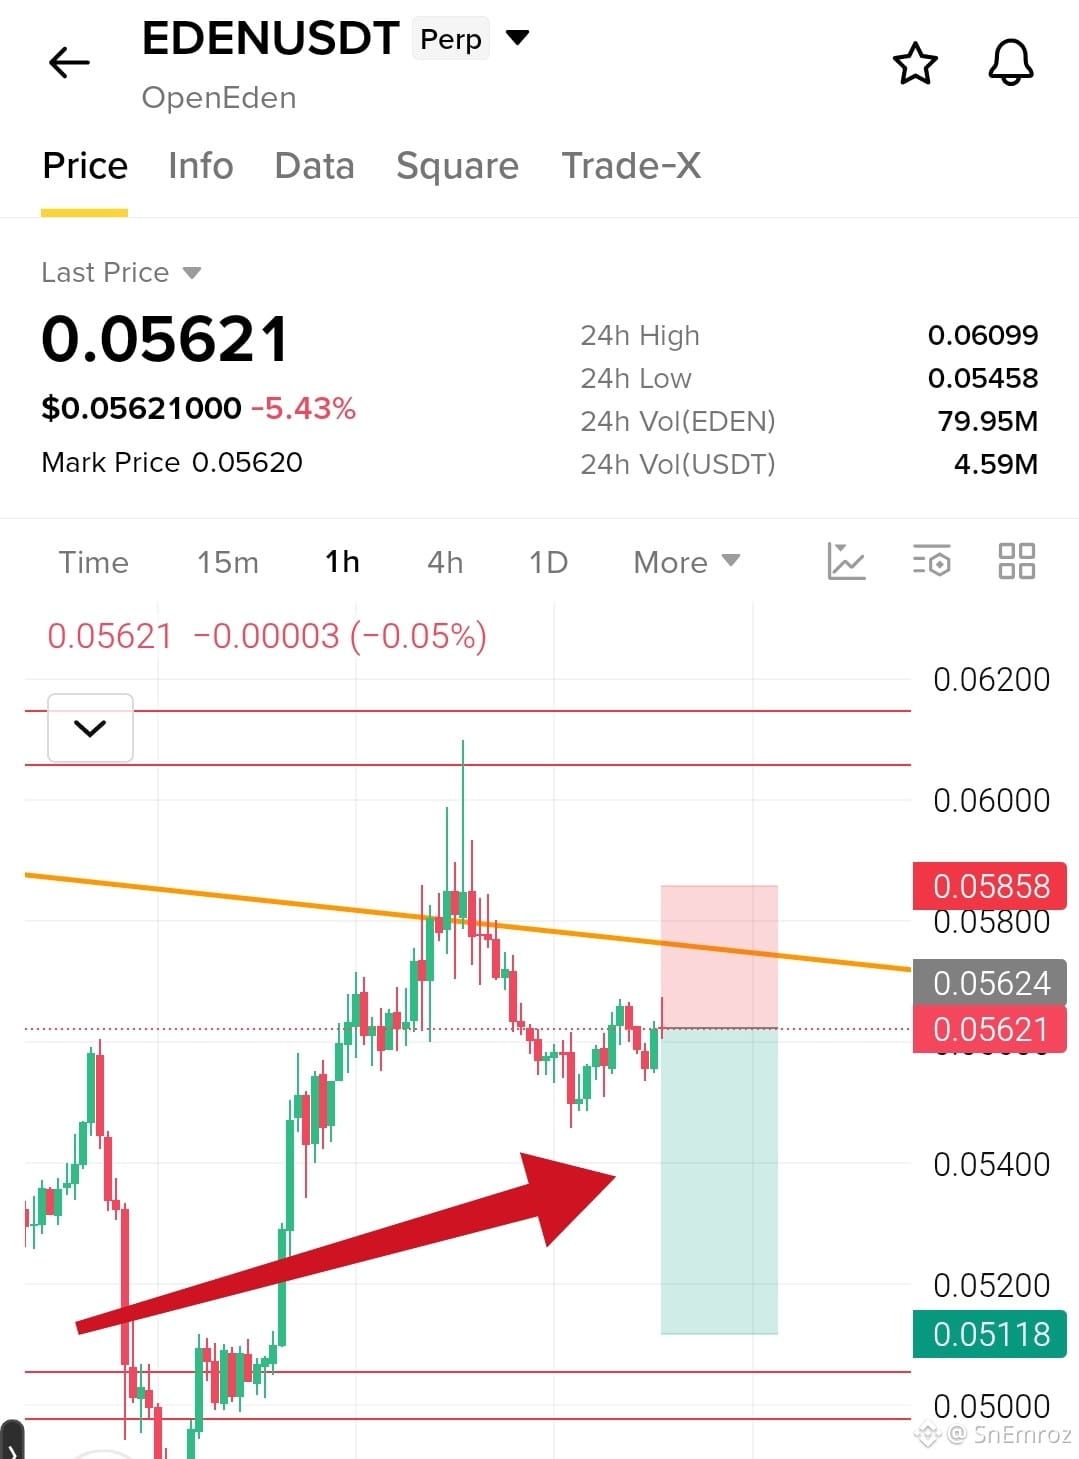
Price spiked above the falling trendline to 0.0610 but buyers could not hold it. It fell back under the line and sellers pushed it down to 0.0546. The bounce now is weak and stuck under the trendline near 0.0575. This looks like a fake breakout with a lower high. If price stays under the line a drop toward 0.0512 is likely.
🔴$EDEN Entry 0.05621
{future}(EDENUSDT)
Take Profits
TP1 0.05400
TP2 0.05250
TP3 0.05118
Stop Loss 0.05858
$EDEN Short Setup 1h Chart🔴
Failed breakout at the falling trendline
Price spiked above the falling trendline to 0.0610 but buyers could not hold it. It fell back under the line and sellers pushed it down to 0.0546. The bounce now is weak and stuck under the trendline near 0.0575. This looks like a fake breakout with a lower high. If price stays under the line a drop toward 0.0512 is likely.
🔴$EDEN Entry 0.05621
Take Profits
TP1 0.05400
TP2 0.05250
TP3 0.05118
Stop Loss 0.05858
Failed breakout at the falling trendline
Price spiked above the falling trendline to 0.0610 but buyers could not hold it. It fell back under the line and sellers pushed it down to 0.0546. The bounce now is weak and stuck under the trendline near 0.0575. This looks like a fake breakout with a lower high. If price stays under the line a drop toward 0.0512 is likely.
🔴$EDEN Entry 0.05621
Take Profits
TP1 0.05400
TP2 0.05250
TP3 0.05118
Stop Loss 0.05858
1
473
·
--
බෙයාරිෂ්
$JUP Analysis 1H Chart
Rising Channel Facing Potential Bearish Pressure.🔴
{future}(JUPUSDT)
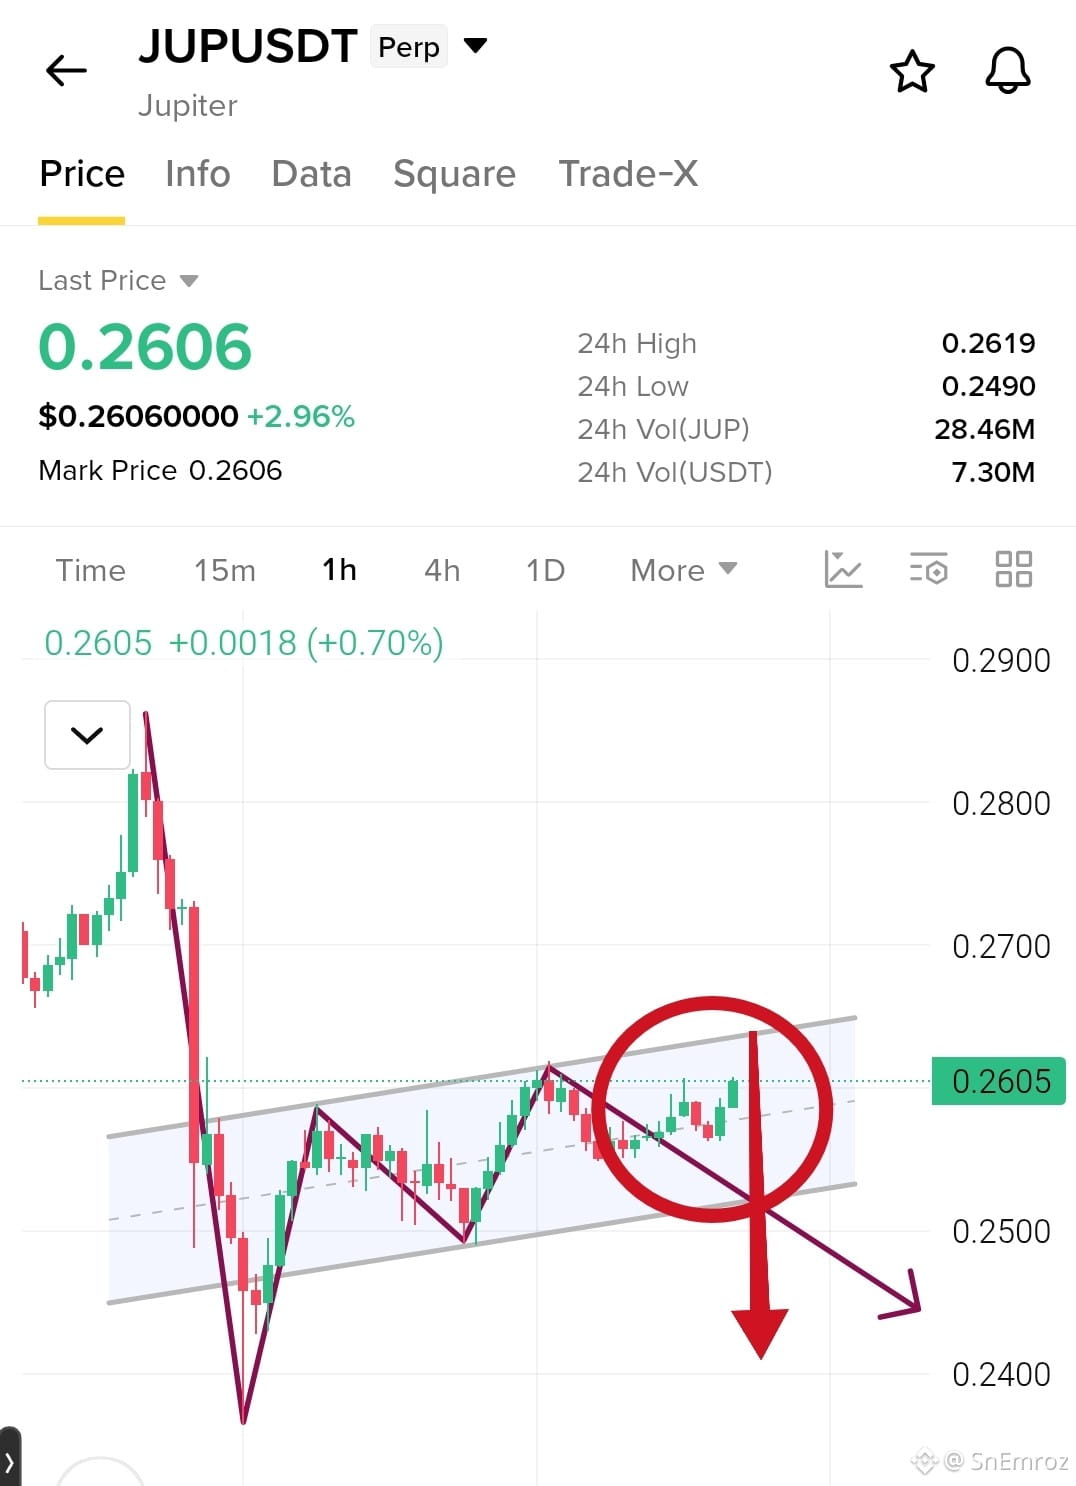
JUP is trading around $0.2606 after recovering from the recent drop toward $0.238. Price is moving inside a rising channel. However buyers are now approaching resistance around $0.262 to $0.264.
The current structure shows that bullish momentum could be losing strength. The marked area is important because a rejection followed by a breakdown below channel support could bring more selling pressure.
The immediate support zone is around $0.255 to $0.253. If sellers push price below the channel this could open the way toward $0.250 and potentially $0.245 to $0.242.
On the other hand a strong move above $0.264 could weaken the bearish setup and give buyers another opportunity to extend the recovery.
For now JUP remains inside the rising channel. A confirmed breakdown has not happened yet. The next 1H candle closes around channel support could be important for the next move.
$JUP Analysis 1H Chart
Rising Channel Facing Potential Bearish Pressure.🔴
JUP is trading around $0.2606 after recovering from the recent drop toward $0.238. Price is moving inside a rising channel. However buyers are now approaching resistance around $0.262 to $0.264.
The current structure shows that bullish momentum could be losing strength. The marked area is important because a rejection followed by a breakdown below channel support could bring more selling pressure.
The immediate support zone is around $0.255 to $0.253. If sellers push price below the channel this could open the way toward $0.250 and potentially $0.245 to $0.242.
On the other hand a strong move above $0.264 could weaken the bearish setup and give buyers another opportunity to extend the recovery.
For now JUP remains inside the rising channel. A confirmed breakdown has not happened yet. The next 1H candle closes around channel support could be important for the next move.
Rising Channel Facing Potential Bearish Pressure.🔴
JUP is trading around $0.2606 after recovering from the recent drop toward $0.238. Price is moving inside a rising channel. However buyers are now approaching resistance around $0.262 to $0.264.
The current structure shows that bullish momentum could be losing strength. The marked area is important because a rejection followed by a breakdown below channel support could bring more selling pressure.
The immediate support zone is around $0.255 to $0.253. If sellers push price below the channel this could open the way toward $0.250 and potentially $0.245 to $0.242.
On the other hand a strong move above $0.264 could weaken the bearish setup and give buyers another opportunity to extend the recovery.
For now JUP remains inside the rising channel. A confirmed breakdown has not happened yet. The next 1H candle closes around channel support could be important for the next move.
1
386
·
--
බෙයාරිෂ්
$AIN
{future}(AINUSDT)
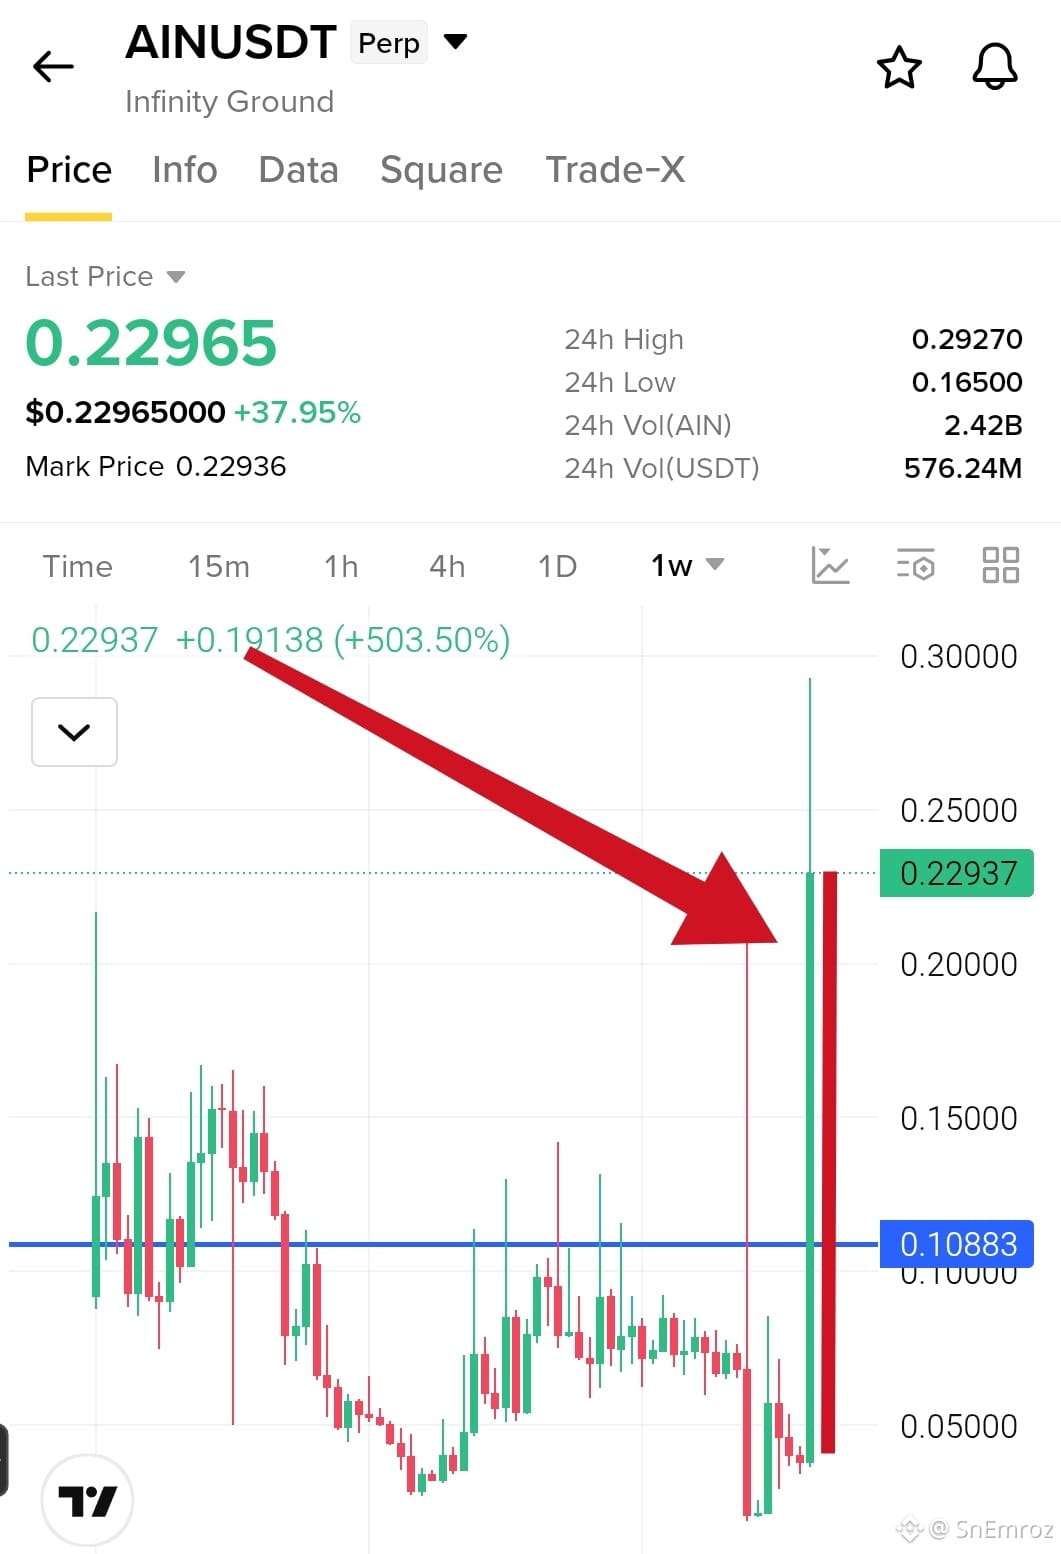
There are 69 weekly candles on this chart. 39 are red and 30 are green. Red leads by 9.
How it went down.
The first 13 candles moved sideways between 0.09 and 0.15. Then came 18 candles of selling with 14 red and only 4 green. Six red candles came in a row at the end. Price fell from 0.153 to 0.029. That is a drop of 81%.
How it came back.
12 candles of recovery with 7 green and 5 red. Price went from 0.029 to 0.098. After that it moved sideways for 19 candles with 10 red and 9 green.
How it pumped.
One red candle crashed price from 0.0685 to 0.0211 and shook out late buyers. Price then made a higher low at 0.0383. After that one giant green candle ran from 0.0383 to 0.2299. That is about 500% in one week.
How it can go down.
This last candle is still open and has a long upper wick near 0.2927. Earlier drops on this chart came in steps and also in one fast crash of 69% in a single week. If buyers lose control the same can happen again.
#ain
$AIN
There are 69 weekly candles on this chart. 39 are red and 30 are green. Red leads by 9.
How it went down.
The first 13 candles moved sideways between 0.09 and 0.15. Then came 18 candles of selling with 14 red and only 4 green. Six red candles came in a row at the end. Price fell from 0.153 to 0.029. That is a drop of 81%.
How it came back.
12 candles of recovery with 7 green and 5 red. Price went from 0.029 to 0.098. After that it moved sideways for 19 candles with 10 red and 9 green.
How it pumped.
One red candle crashed price from 0.0685 to 0.0211 and shook out late buyers. Price then made a higher low at 0.0383. After that one giant green candle ran from 0.0383 to 0.2299. That is about 500% in one week.
How it can go down.
This last candle is still open and has a long upper wick near 0.2927. Earlier drops on this chart came in steps and also in one fast crash of 69% in a single week. If buyers lose control the same can happen again.
#ain
There are 69 weekly candles on this chart. 39 are red and 30 are green. Red leads by 9.
How it went down.
The first 13 candles moved sideways between 0.09 and 0.15. Then came 18 candles of selling with 14 red and only 4 green. Six red candles came in a row at the end. Price fell from 0.153 to 0.029. That is a drop of 81%.
How it came back.
12 candles of recovery with 7 green and 5 red. Price went from 0.029 to 0.098. After that it moved sideways for 19 candles with 10 red and 9 green.
How it pumped.
One red candle crashed price from 0.0685 to 0.0211 and shook out late buyers. Price then made a higher low at 0.0383. After that one giant green candle ran from 0.0383 to 0.2299. That is about 500% in one week.
How it can go down.
This last candle is still open and has a long upper wick near 0.2927. Earlier drops on this chart came in steps and also in one fast crash of 69% in a single week. If buyers lose control the same can happen again.
#ain
1
5
3.8k
·
--
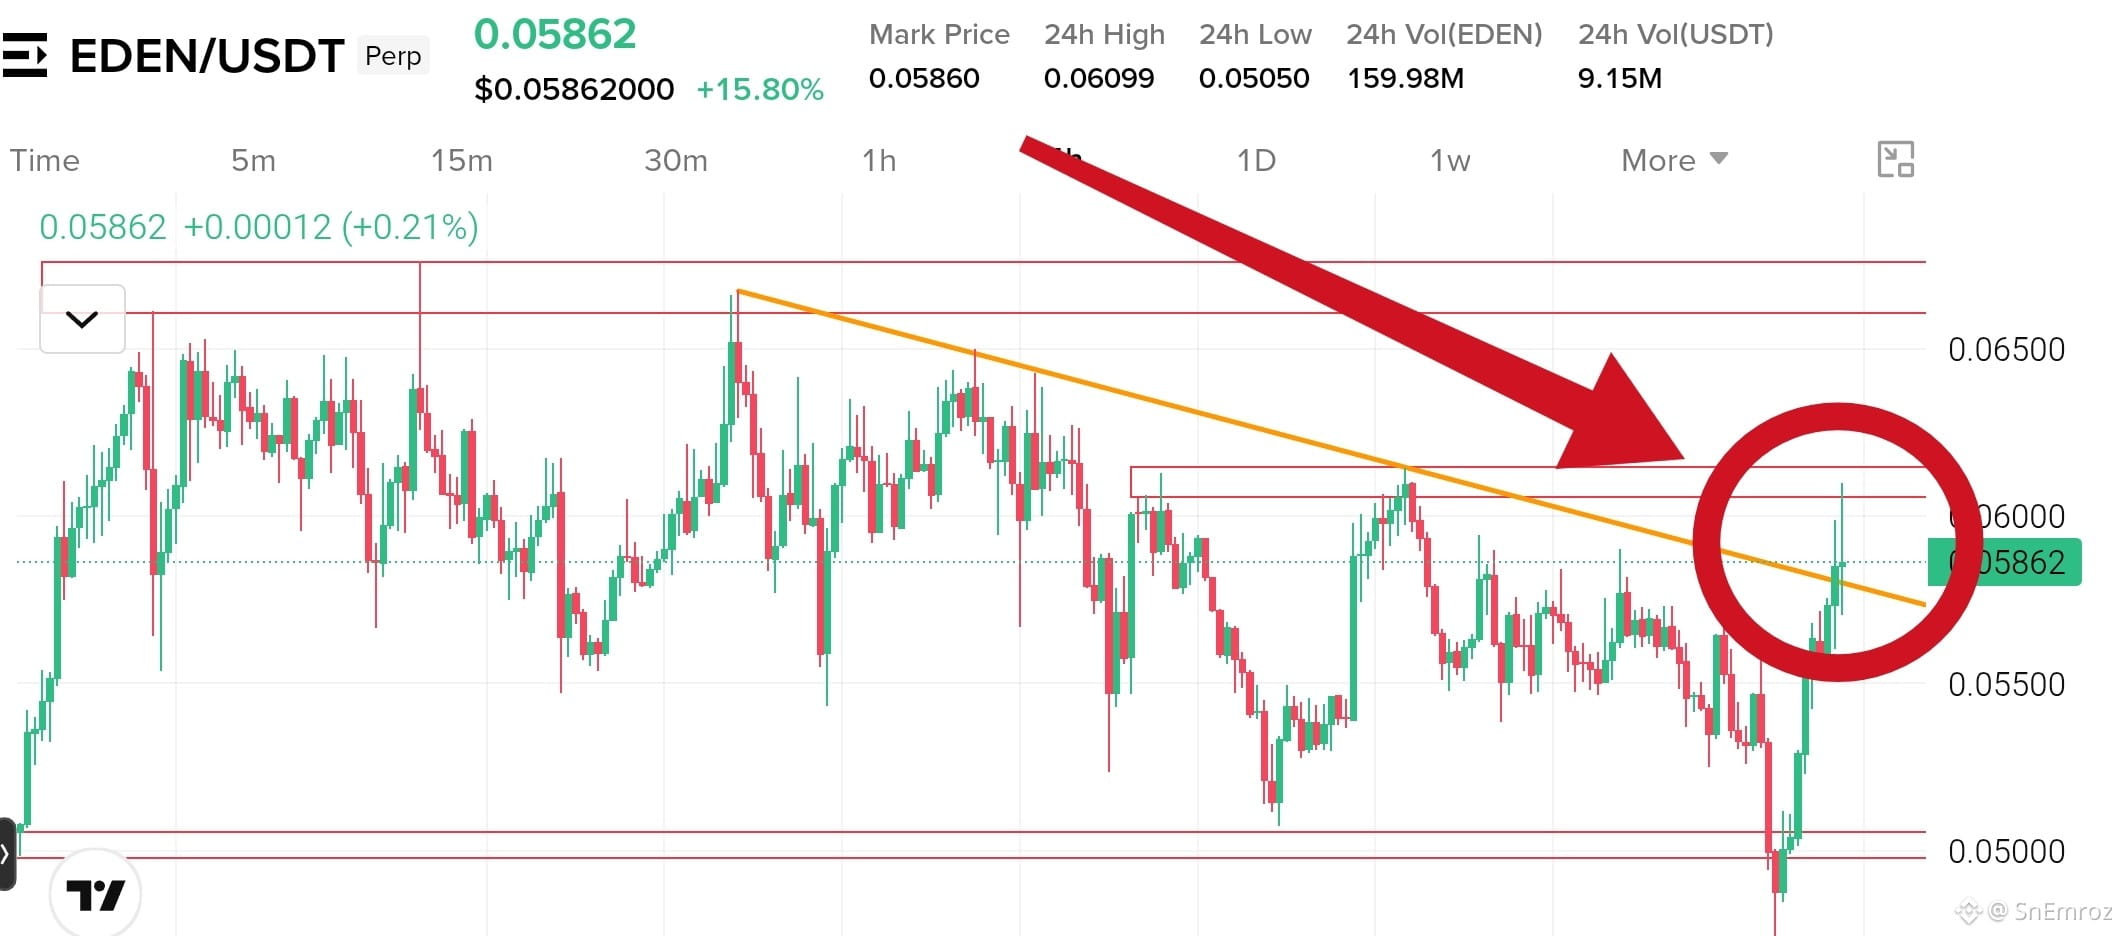
$EDEN is now at 0.05862 and up 15% today.
Price just broke above the falling trendline that held it down for a long time.
Before that it swept below the 0.0500 support and buyers took it back fast. That is a liquidity sweep.
The chart is forming a Double Bottom W pattern. The neckline sits at 0.0606 to 0.0615 and price already touched it and got a rejection wick.
{future}(EDENUSDT)
Momentum is bullish with strong green candles. Volume is 160M EDEN but only 9M USDT so the move is still thin.
A clean close above 0.0615 confirms the breakout and opens the way to 0.0661 and then 0.0676.
If price falls back under the trendline near 0.0583 the breakout fails and 0.0500 comes back into play.
#eden
$EDEN is now at 0.05862 and up 15% today.
Price just broke above the falling trendline that held it down for a long time.
Before that it swept below the 0.0500 support and buyers took it back fast. That is a liquidity sweep.
The chart is forming a Double Bottom W pattern. The neckline sits at 0.0606 to 0.0615 and price already touched it and got a rejection wick.
Momentum is bullish with strong green candles. Volume is 160M EDEN but only 9M USDT so the move is still thin.
A clean close above 0.0615 confirms the breakout and opens the way to 0.0661 and then 0.0676.
If price falls back under the trendline near 0.0583 the breakout fails and 0.0500 comes back into play.
#eden
Price just broke above the falling trendline that held it down for a long time.
Before that it swept below the 0.0500 support and buyers took it back fast. That is a liquidity sweep.
The chart is forming a Double Bottom W pattern. The neckline sits at 0.0606 to 0.0615 and price already touched it and got a rejection wick.
Momentum is bullish with strong green candles. Volume is 160M EDEN but only 9M USDT so the move is still thin.
A clean close above 0.0615 confirms the breakout and opens the way to 0.0661 and then 0.0676.
If price falls back under the trendline near 0.0583 the breakout fails and 0.0500 comes back into play.
#eden
384
·
--
බෙයාරිෂ්
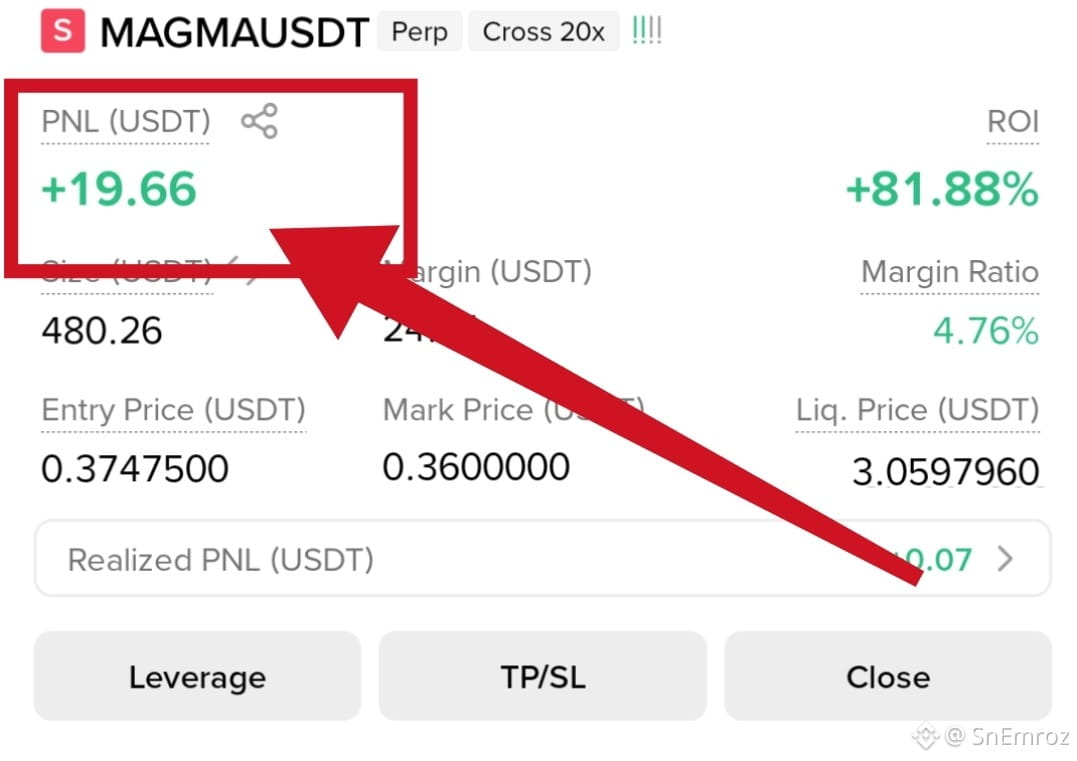
SnEmroz
·
--
බෙයාරිෂ්$MAGMA Short Setup 4h Chart🔴
Double Top M pattern at resistance
Price made a first top near 0.4088 and then dropped to the 0.2430 to 0.2490 support. It has now bounced back and made a second top near 0.3969 under the same resistance zone. The second top is slightly lower than the first so buyers are losing strength. That support is the neckline of the M pattern. If price fails to break above 0.4088 a drop toward 0.3726 and then 0.2829 is likely. A close below the neckline would confirm the full breakdown.
🔴Short Entry 0.38315
Take Profits
TP1 0.37261
TP2 0.32000
TP3 0.28290
Stop Loss 0.42908
#magma
Double Top M pattern at resistance
Price made a first top near 0.4088 and then dropped to the 0.2430 to 0.2490 support. It has now bounced back and made a second top near 0.3969 under the same resistance zone. The second top is slightly lower than the first so buyers are losing strength. That support is the neckline of the M pattern. If price fails to break above 0.4088 a drop toward 0.3726 and then 0.2829 is likely. A close below the neckline would confirm the full breakdown.
🔴Short Entry 0.38315
Take Profits
TP1 0.37261
TP2 0.32000
TP3 0.28290
Stop Loss 0.42908
#magma
1
363
·
--
බෙයාරිෂ්
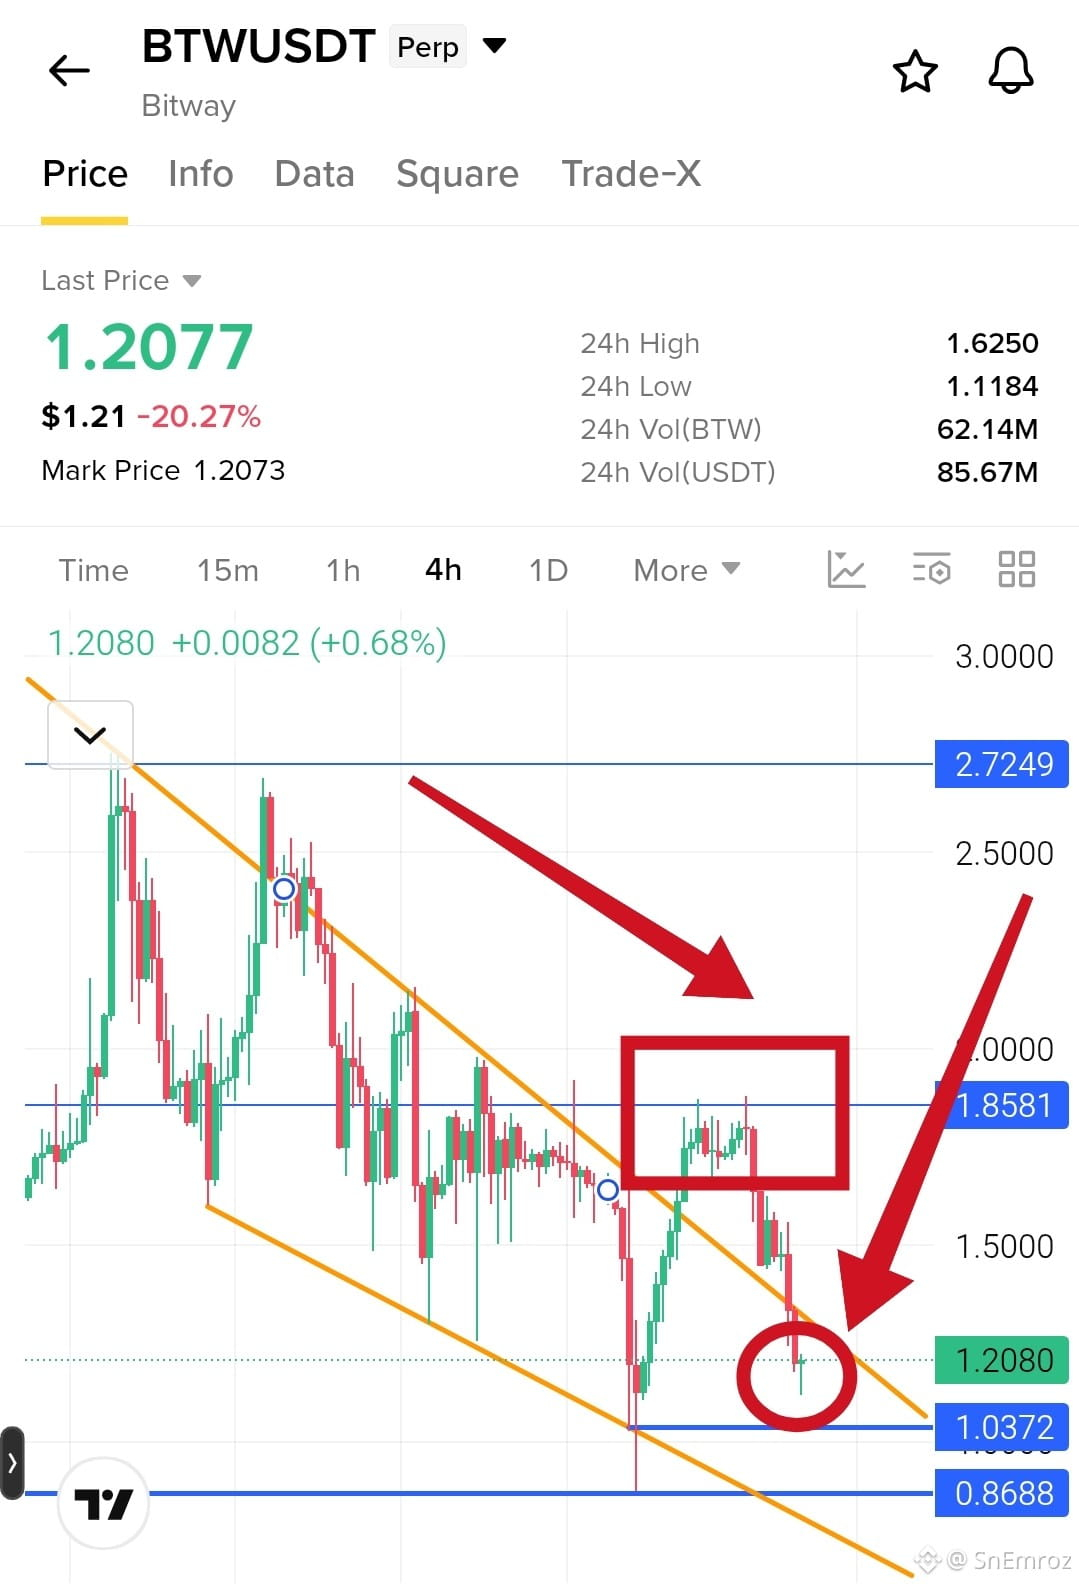
$BTW just dropped over 20% today. Price is at 1.20 now.
We marked the rejection near 1.85 and it played out. Eyes on 1.03 next.
{future}(BTWUSDT)
Lose that and 0.86 is in play. Be careful out there.
#btw
$BTW just dropped over 20% today. Price is at 1.20 now.
We marked the rejection near 1.85 and it played out. Eyes on 1.03 next.
Lose that and 0.86 is in play. Be careful out there.
#btw
We marked the rejection near 1.85 and it played out. Eyes on 1.03 next.
Lose that and 0.86 is in play. Be careful out there.
#btw
1
1.4k
·
--
බෙයාරිෂ්
SnEmroz
·
--
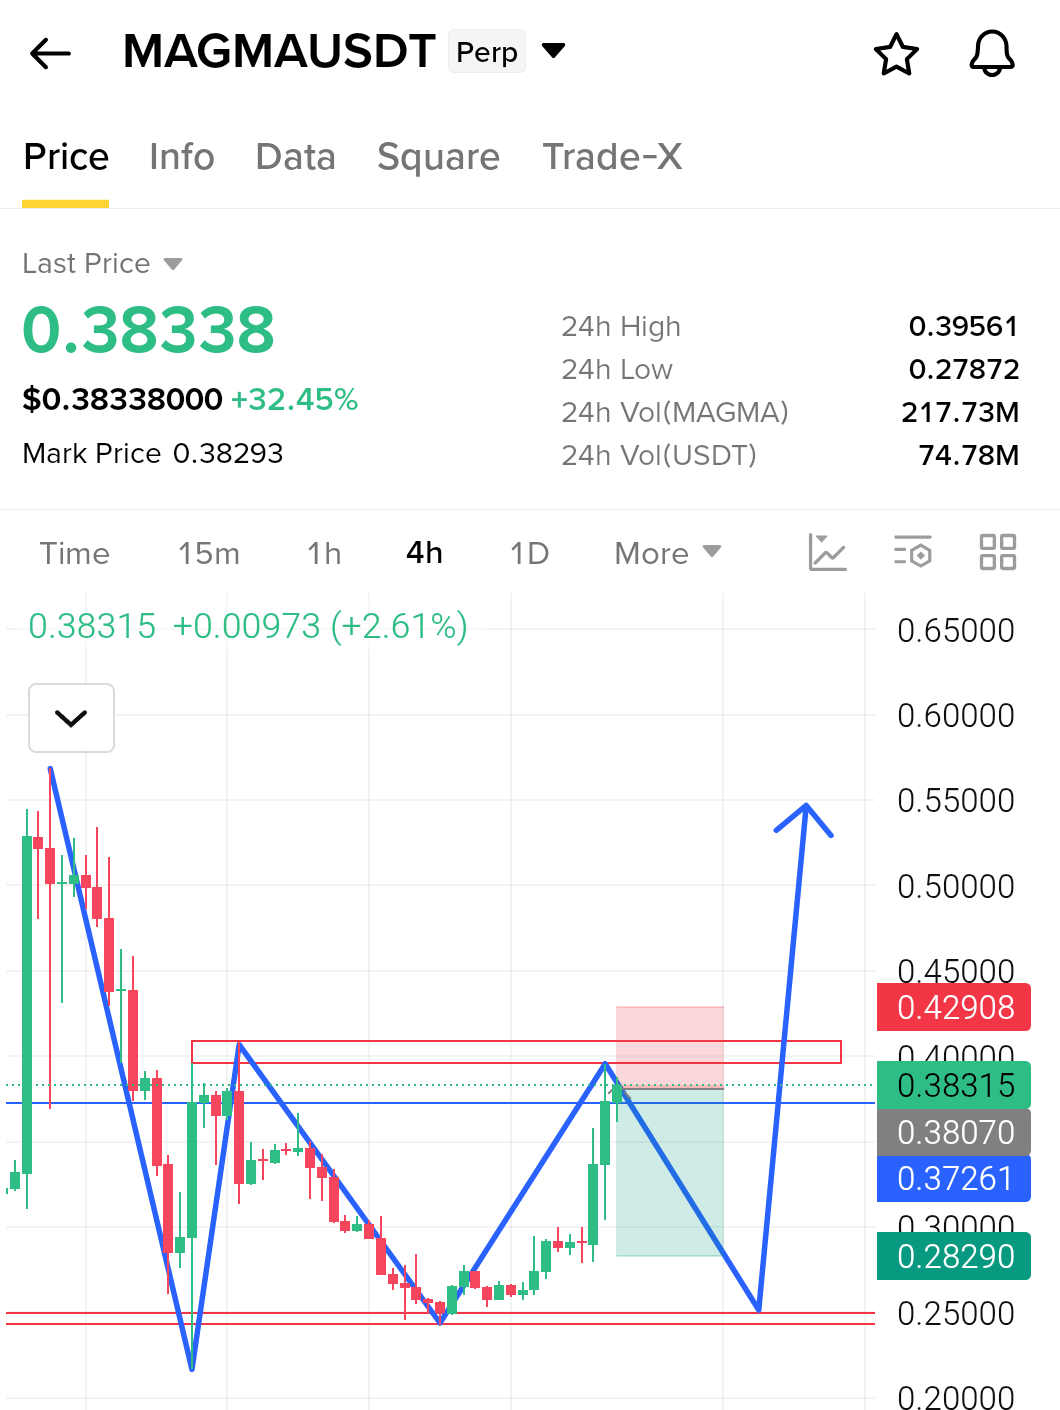
බෙයාරිෂ්$MAGMA Short Setup 4h Chart🔴
Double Top M pattern at resistance
Price made a first top near 0.4088 and then dropped to the 0.2430 to 0.2490 support. It has now bounced back and made a second top near 0.3969 under the same resistance zone. The second top is slightly lower than the first so buyers are losing strength. That support is the neckline of the M pattern. If price fails to break above 0.4088 a drop toward 0.3726 and then 0.2829 is likely. A close below the neckline would confirm the full breakdown.
🔴Short Entry 0.38315
Take Profits
TP1 0.37261
TP2 0.32000
TP3 0.28290
Stop Loss 0.42908
#magma
Double Top M pattern at resistance
Price made a first top near 0.4088 and then dropped to the 0.2430 to 0.2490 support. It has now bounced back and made a second top near 0.3969 under the same resistance zone. The second top is slightly lower than the first so buyers are losing strength. That support is the neckline of the M pattern. If price fails to break above 0.4088 a drop toward 0.3726 and then 0.2829 is likely. A close below the neckline would confirm the full breakdown.
🔴Short Entry 0.38315
Take Profits
TP1 0.37261
TP2 0.32000
TP3 0.28290
Stop Loss 0.42908
#magma
2
1.5k
·
--
බෙයාරිෂ්
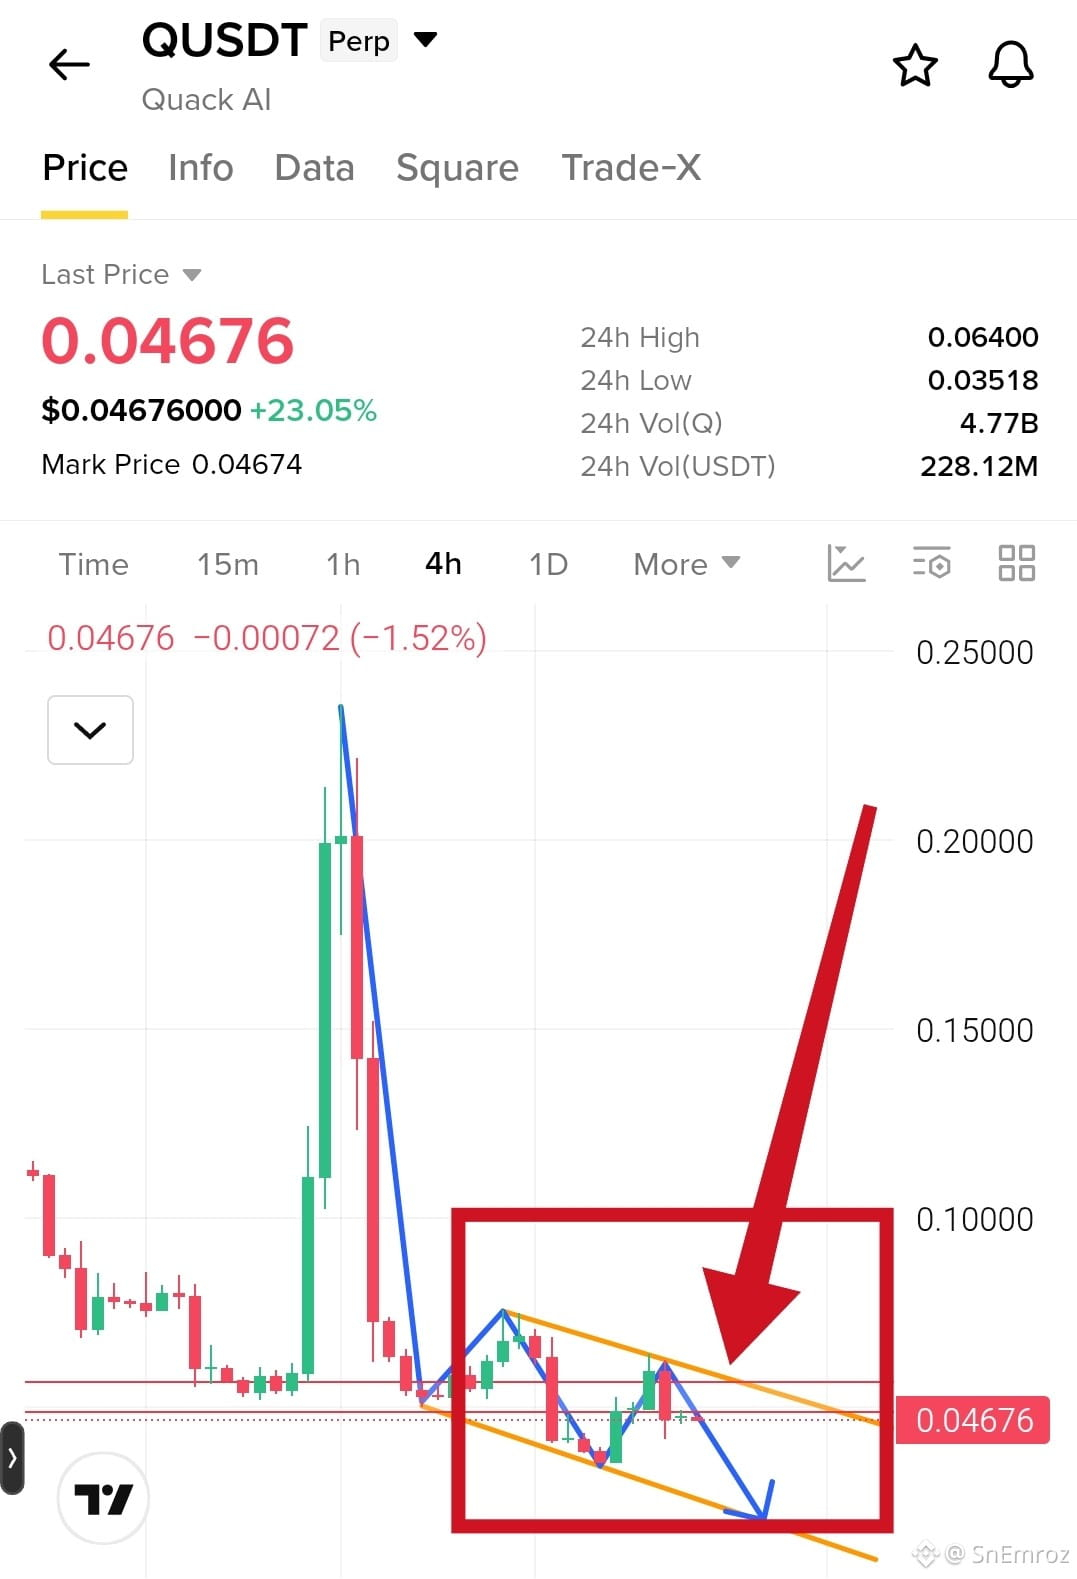
$Q is now at 0.04676.
Price crashed from the 0.235 top in one sharp move. Since then it has been sliding inside a falling channel.
The chart shows a Bear Flag. The big drop is the flagpole and the falling channel is the flag.
{future}(QUSDT)
Every bounce inside the flag got rejected. The last one failed near 0.0640. Lower highs and lower lows are still in place so sellers are in control.
Volume is big at 228M USDT but the bounces are weak. Buyers are not showing real strength.
A clean 4h close below the flag bottom can send price toward the 0.0352 low. Then the 0.0210 area where your blue line points.
If buyers break above 0.0640 the pattern fails.
#Q
$Q is now at 0.04676.
Price crashed from the 0.235 top in one sharp move. Since then it has been sliding inside a falling channel.
The chart shows a Bear Flag. The big drop is the flagpole and the falling channel is the flag.
Every bounce inside the flag got rejected. The last one failed near 0.0640. Lower highs and lower lows are still in place so sellers are in control.
Volume is big at 228M USDT but the bounces are weak. Buyers are not showing real strength.
A clean 4h close below the flag bottom can send price toward the 0.0352 low. Then the 0.0210 area where your blue line points.
If buyers break above 0.0640 the pattern fails.
#Q
Price crashed from the 0.235 top in one sharp move. Since then it has been sliding inside a falling channel.
The chart shows a Bear Flag. The big drop is the flagpole and the falling channel is the flag.
Every bounce inside the flag got rejected. The last one failed near 0.0640. Lower highs and lower lows are still in place so sellers are in control.
Volume is big at 228M USDT but the bounces are weak. Buyers are not showing real strength.
A clean 4h close below the flag bottom can send price toward the 0.0352 low. Then the 0.0210 area where your blue line points.
If buyers break above 0.0640 the pattern fails.
#Q
2
2k
·
--
බෙයාරිෂ්
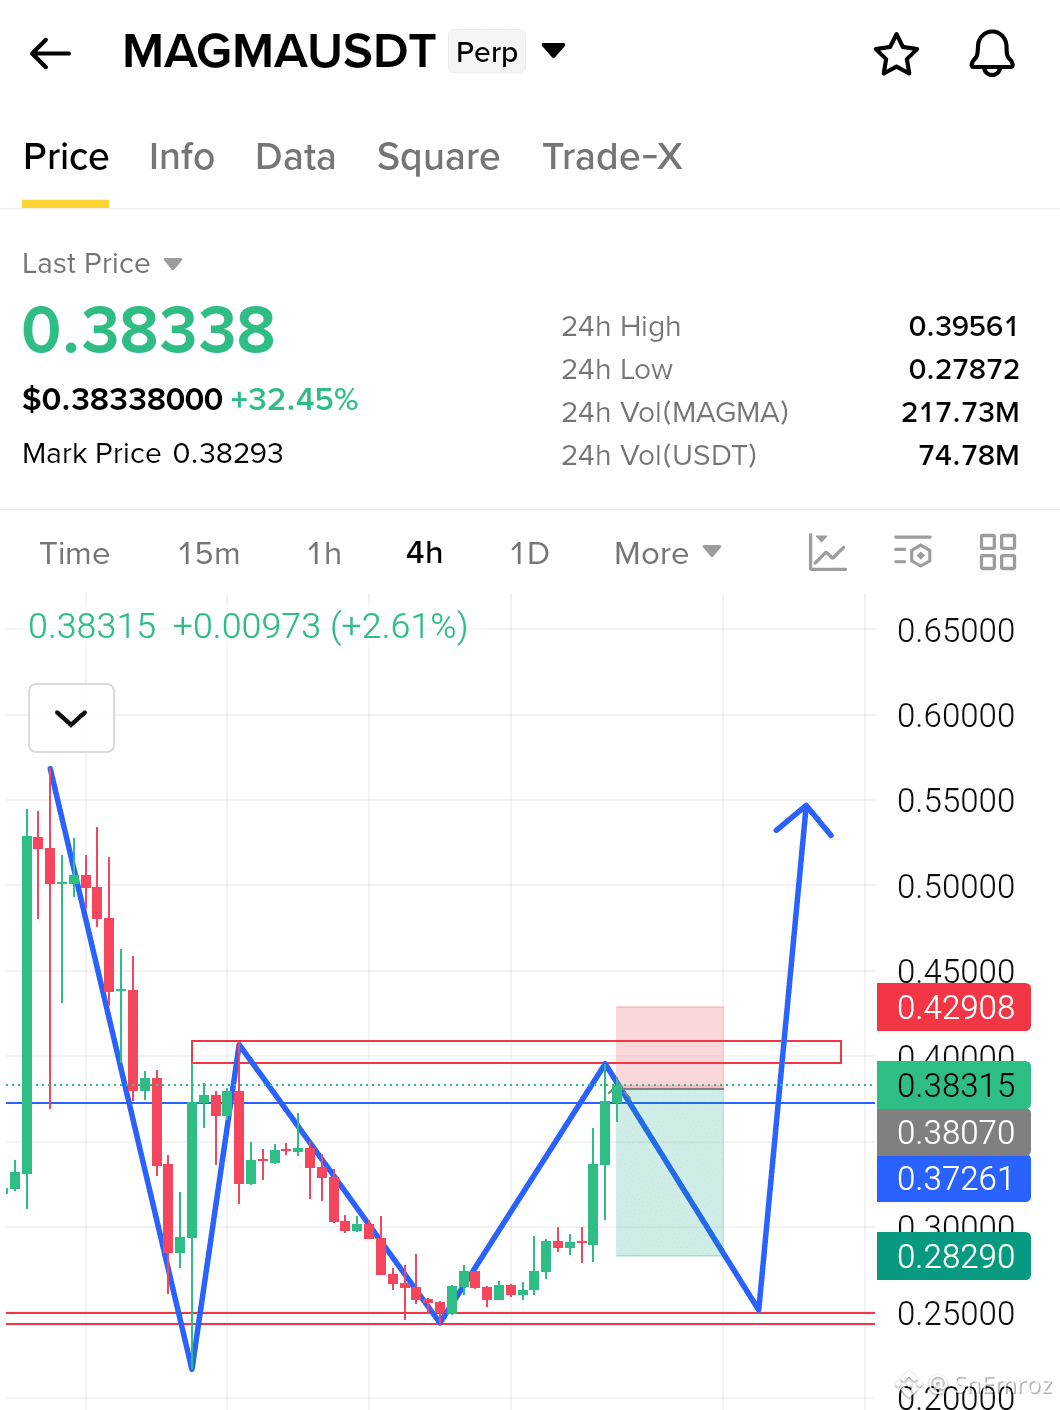
$MAGMA Short Setup 4h Chart🔴
Double Top M pattern at resistance
Price made a first top near 0.4088 and then dropped to the 0.2430 to 0.2490 support. It has now bounced back and made a second top near 0.3969 under the same resistance zone. The second top is slightly lower than the first so buyers are losing strength. That support is the neckline of the M pattern. If price fails to break above 0.4088 a drop toward 0.3726 and then 0.2829 is likely. A close below the neckline would confirm the full breakdown.
🔴Short Entry 0.38315
{future}(MAGMAUSDT)
Take Profits
TP1 0.37261
TP2 0.32000
TP3 0.28290
Stop Loss 0.42908
#magma
$MAGMA Short Setup 4h Chart🔴
Double Top M pattern at resistance
Price made a first top near 0.4088 and then dropped to the 0.2430 to 0.2490 support. It has now bounced back and made a second top near 0.3969 under the same resistance zone. The second top is slightly lower than the first so buyers are losing strength. That support is the neckline of the M pattern. If price fails to break above 0.4088 a drop toward 0.3726 and then 0.2829 is likely. A close below the neckline would confirm the full breakdown.
🔴Short Entry 0.38315
Take Profits
TP1 0.37261
TP2 0.32000
TP3 0.28290
Stop Loss 0.42908
#magma
Double Top M pattern at resistance
Price made a first top near 0.4088 and then dropped to the 0.2430 to 0.2490 support. It has now bounced back and made a second top near 0.3969 under the same resistance zone. The second top is slightly lower than the first so buyers are losing strength. That support is the neckline of the M pattern. If price fails to break above 0.4088 a drop toward 0.3726 and then 0.2829 is likely. A close below the neckline would confirm the full breakdown.
🔴Short Entry 0.38315
Take Profits
TP1 0.37261
TP2 0.32000
TP3 0.28290
Stop Loss 0.42908
#magma
2
2
2
1.4k
·
--
ලිපිය
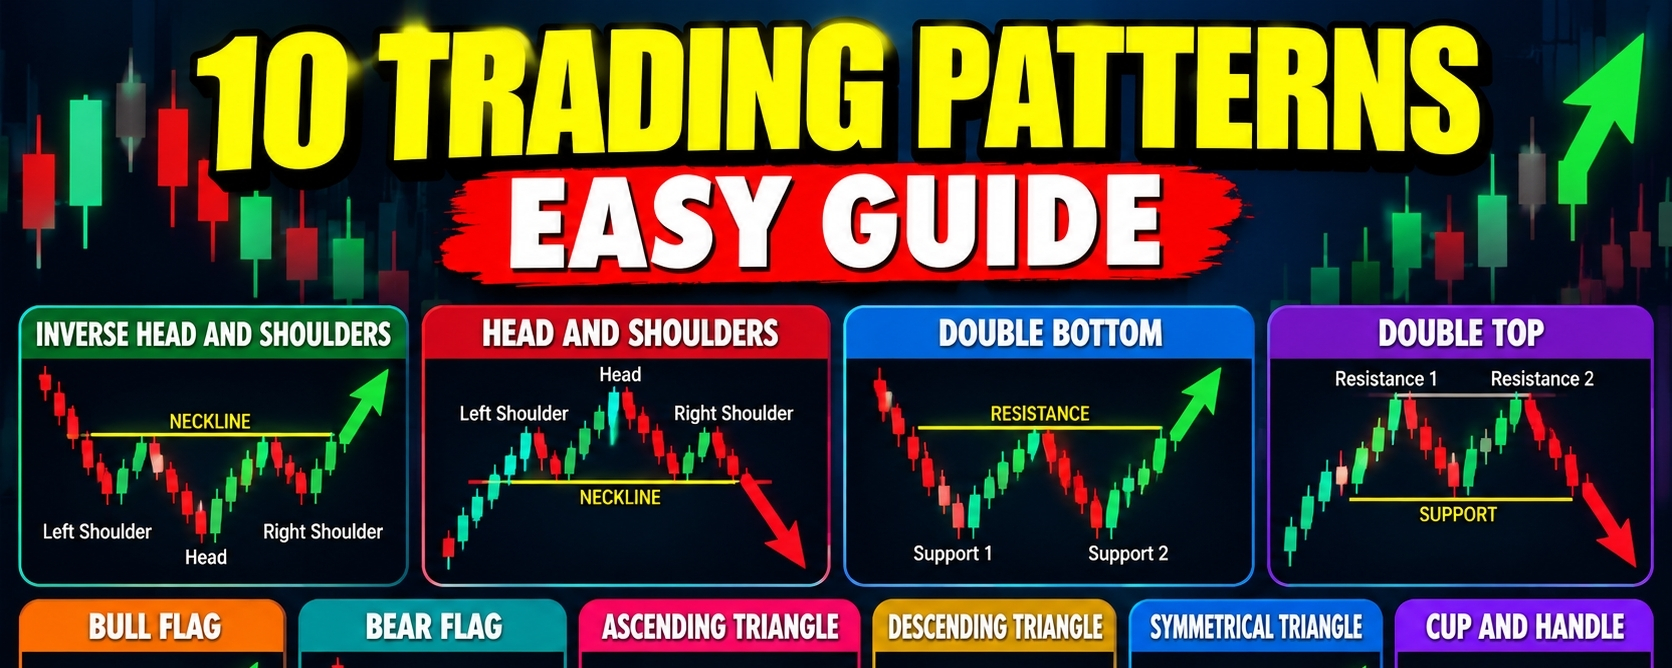
The 10 Most Important Trading Chart Patterns.Trading chart patterns are shapes that form when prices move up and down on a chart. Traders study these patterns to understand the possible direction of the market. Some patterns suggest that a trend may reverse while others suggest that the existing trend may continue. However these patterns do not guarantee future price movements.
1. Inverse Head and Shoulders.
The inverse head and shoulders is a bullish reversal pattern that can appear after a downtrend. It contains three lows. The middle low is the deepest and is called the head. The two outer lows are called the shoulders. A neckline connects the highs between these lows. When the price breaks above the neckline the pattern may indicate that buyers are gaining control and an upward move could begin.
2. Head and Shoulders.
The head and shoulders pattern is a bearish reversal pattern that often appears after an uptrend. It contains three peaks. The middle peak is the highest and is called the head. The two outer peaks are the shoulders. A neckline connects the lows between the peaks. When the price breaks below the neckline the pattern may indicate that buying pressure is weakening and the market could move downward.
3. Double Bottom.
The double bottom is a bullish reversal pattern that looks like the letter W. It forms when the price falls to a similar support area twice and rises after each attempt. This suggests that sellers are struggling to push the price lower. The pattern becomes more meaningful when the price breaks above the resistance level formed between the two lows. This breakout may signal the beginning of an upward move.
4. Double Top.
The double top is a bearish reversal pattern that looks like the letter M. It forms when the price reaches a similar resistance area twice and falls after each attempt. This suggests that buyers are struggling to push the price higher. The pattern is confirmed when the price breaks below the support level between the two peaks. This breakdown may indicate the beginning of a downward move.
5. Bull Flag.
The bull flag is a bullish continuation pattern that usually forms after a strong upward price movement. The sharp rise creates the flagpole. A short period of consolidation forms the flag as the price moves sideways or slightly downward. When the price breaks above the flag the previous upward trend may continue. Traders often look for this pattern when a strong rally pauses before potentially moving higher again.
6. Bear Flag.
The bear flag is a bearish continuation pattern that usually forms after a strong downward price movement. The sharp decline creates the flagpole. A short recovery or sideways movement forms the flag. When the price breaks below the flag the previous downward trend may continue. Traders watch this pattern because a temporary recovery does not always mean that the market has changed direction.
7. Ascending Triangle.
The ascending triangle is a pattern with a relatively flat resistance level and rising support levels. The price repeatedly approaches the same resistance area while each pullback stops at a higher level. This suggests that buyers are gradually pushing the price upward. A breakout above resistance may signal a bullish move. However the price can also fail to break resistance and move downward instead.
8. Descending Triangle.
The descending triangle is a pattern with a relatively flat support level and falling resistance levels. The price repeatedly approaches the same support area while each recovery reaches a lower high. This suggests that sellers are applying increasing pressure. A breakdown below support may signal a bearish move. However the support level can hold and the price may break upward instead.
9. Symmetrical Triangle.
The symmetrical triangle forms when the price creates lower highs and higher lows. These movements bring the resistance and support lines closer together. This shows that the trading range is narrowing as buyers and sellers compete for control. The pattern does not provide a reliable direction before a breakout. A move above resistance may signal an upward move while a break below support may signal a downward move.
10. Cup and Handle.
The cup and handle is generally considered a bullish continuation pattern. The cup forms when the price declines and then gradually recovers to create a rounded shape. The handle forms when the price experiences a smaller pullback or sideways movement near the previous resistance area. A breakout above the handle resistance may indicate that the upward trend is resuming. A deep or prolonged decline in the handle can weaken the pattern.
Trading chart patterns can help us identify possible market reversals and trend continuations. The inverse head and shoulders and double bottom may indicate bullish reversals. The head and shoulders and double top may indicate bearish reversals. Bull flags and bear flags often suggest that an existing trend may continue. Triangles show a narrowing trading range while the cup and handle can indicate a potential continuation of an upward trend.
A pattern should not be treated as a guaranteed signal. We are generally look for a confirmed breakout and consider the broader trend and trading volume before making a decision. Risk management remains important because even well formed chart patterns can fail.
If you think this post informative for you! I think you forget to Follow me!
The 10 Most Important Trading Chart Patterns.
Trading chart patterns are shapes that form when prices move up and down on a chart. Traders study these patterns to understand the possible direction of the market. Some patterns suggest that a trend may reverse while others suggest that the existing trend may continue. However these patterns do not guarantee future price movements.
1. Inverse Head and Shoulders.
The inverse head and shoulders is a bullish reversal pattern that can appear after a downtrend. It contains three lows. The middle low is the deepest and is called the head. The two outer lows are called the shoulders. A neckline connects the highs between these lows. When the price breaks above the neckline the pattern may indicate that buyers are gaining control and an upward move could begin.
2. Head and Shoulders.
The head and shoulders pattern is a bearish reversal pattern that often appears after an uptrend. It contains three peaks. The middle peak is the highest and is called the head. The two outer peaks are the shoulders. A neckline connects the lows between the peaks. When the price breaks below the neckline the pattern may indicate that buying pressure is weakening and the market could move downward.
3. Double Bottom.
The double bottom is a bullish reversal pattern that looks like the letter W. It forms when the price falls to a similar support area twice and rises after each attempt. This suggests that sellers are struggling to push the price lower. The pattern becomes more meaningful when the price breaks above the resistance level formed between the two lows. This breakout may signal the beginning of an upward move.
4. Double Top.
The double top is a bearish reversal pattern that looks like the letter M. It forms when the price reaches a similar resistance area twice and falls after each attempt. This suggests that buyers are struggling to push the price higher. The pattern is confirmed when the price breaks below the support level between the two peaks. This breakdown may indicate the beginning of a downward move.
5. Bull Flag.
The bull flag is a bullish continuation pattern that usually forms after a strong upward price movement. The sharp rise creates the flagpole. A short period of consolidation forms the flag as the price moves sideways or slightly downward. When the price breaks above the flag the previous upward trend may continue. Traders often look for this pattern when a strong rally pauses before potentially moving higher again.
6. Bear Flag.
The bear flag is a bearish continuation pattern that usually forms after a strong downward price movement. The sharp decline creates the flagpole. A short recovery or sideways movement forms the flag. When the price breaks below the flag the previous downward trend may continue. Traders watch this pattern because a temporary recovery does not always mean that the market has changed direction.
7. Ascending Triangle.
The ascending triangle is a pattern with a relatively flat resistance level and rising support levels. The price repeatedly approaches the same resistance area while each pullback stops at a higher level. This suggests that buyers are gradually pushing the price upward. A breakout above resistance may signal a bullish move. However the price can also fail to break resistance and move downward instead.
8. Descending Triangle.
The descending triangle is a pattern with a relatively flat support level and falling resistance levels. The price repeatedly approaches the same support area while each recovery reaches a lower high. This suggests that sellers are applying increasing pressure. A breakdown below support may signal a bearish move. However the support level can hold and the price may break upward instead.
9. Symmetrical Triangle.
The symmetrical triangle forms when the price creates lower highs and higher lows. These movements bring the resistance and support lines closer together. This shows that the trading range is narrowing as buyers and sellers compete for control. The pattern does not provide a reliable direction before a breakout. A move above resistance may signal an upward move while a break below support may signal a downward move.
10. Cup and Handle.
The cup and handle is generally considered a bullish continuation pattern. The cup forms when the price declines and then gradually recovers to create a rounded shape. The handle forms when the price experiences a smaller pullback or sideways movement near the previous resistance area. A breakout above the handle resistance may indicate that the upward trend is resuming. A deep or prolonged decline in the handle can weaken the pattern.
Trading chart patterns can help us identify possible market reversals and trend continuations. The inverse head and shoulders and double bottom may indicate bullish reversals. The head and shoulders and double top may indicate bearish reversals. Bull flags and bear flags often suggest that an existing trend may continue. Triangles show a narrowing trading range while the cup and handle can indicate a potential continuation of an upward trend.
A pattern should not be treated as a guaranteed signal. We are generally look for a confirmed breakout and consider the broader trend and trading volume before making a decision. Risk management remains important because even well formed chart patterns can fail.
If you think this post informative for you! I think you forget to Follow me!
1. Inverse Head and Shoulders.
The inverse head and shoulders is a bullish reversal pattern that can appear after a downtrend. It contains three lows. The middle low is the deepest and is called the head. The two outer lows are called the shoulders. A neckline connects the highs between these lows. When the price breaks above the neckline the pattern may indicate that buyers are gaining control and an upward move could begin.
2. Head and Shoulders.
The head and shoulders pattern is a bearish reversal pattern that often appears after an uptrend. It contains three peaks. The middle peak is the highest and is called the head. The two outer peaks are the shoulders. A neckline connects the lows between the peaks. When the price breaks below the neckline the pattern may indicate that buying pressure is weakening and the market could move downward.
3. Double Bottom.
The double bottom is a bullish reversal pattern that looks like the letter W. It forms when the price falls to a similar support area twice and rises after each attempt. This suggests that sellers are struggling to push the price lower. The pattern becomes more meaningful when the price breaks above the resistance level formed between the two lows. This breakout may signal the beginning of an upward move.
4. Double Top.
The double top is a bearish reversal pattern that looks like the letter M. It forms when the price reaches a similar resistance area twice and falls after each attempt. This suggests that buyers are struggling to push the price higher. The pattern is confirmed when the price breaks below the support level between the two peaks. This breakdown may indicate the beginning of a downward move.
5. Bull Flag.
The bull flag is a bullish continuation pattern that usually forms after a strong upward price movement. The sharp rise creates the flagpole. A short period of consolidation forms the flag as the price moves sideways or slightly downward. When the price breaks above the flag the previous upward trend may continue. Traders often look for this pattern when a strong rally pauses before potentially moving higher again.
6. Bear Flag.
The bear flag is a bearish continuation pattern that usually forms after a strong downward price movement. The sharp decline creates the flagpole. A short recovery or sideways movement forms the flag. When the price breaks below the flag the previous downward trend may continue. Traders watch this pattern because a temporary recovery does not always mean that the market has changed direction.
7. Ascending Triangle.
The ascending triangle is a pattern with a relatively flat resistance level and rising support levels. The price repeatedly approaches the same resistance area while each pullback stops at a higher level. This suggests that buyers are gradually pushing the price upward. A breakout above resistance may signal a bullish move. However the price can also fail to break resistance and move downward instead.
8. Descending Triangle.
The descending triangle is a pattern with a relatively flat support level and falling resistance levels. The price repeatedly approaches the same support area while each recovery reaches a lower high. This suggests that sellers are applying increasing pressure. A breakdown below support may signal a bearish move. However the support level can hold and the price may break upward instead.
9. Symmetrical Triangle.
The symmetrical triangle forms when the price creates lower highs and higher lows. These movements bring the resistance and support lines closer together. This shows that the trading range is narrowing as buyers and sellers compete for control. The pattern does not provide a reliable direction before a breakout. A move above resistance may signal an upward move while a break below support may signal a downward move.
10. Cup and Handle.
The cup and handle is generally considered a bullish continuation pattern. The cup forms when the price declines and then gradually recovers to create a rounded shape. The handle forms when the price experiences a smaller pullback or sideways movement near the previous resistance area. A breakout above the handle resistance may indicate that the upward trend is resuming. A deep or prolonged decline in the handle can weaken the pattern.
Trading chart patterns can help us identify possible market reversals and trend continuations. The inverse head and shoulders and double bottom may indicate bullish reversals. The head and shoulders and double top may indicate bearish reversals. Bull flags and bear flags often suggest that an existing trend may continue. Triangles show a narrowing trading range while the cup and handle can indicate a potential continuation of an upward trend.
A pattern should not be treated as a guaranteed signal. We are generally look for a confirmed breakout and consider the broader trend and trading volume before making a decision. Risk management remains important because even well formed chart patterns can fail.
If you think this post informative for you! I think you forget to Follow me!
159
·
--
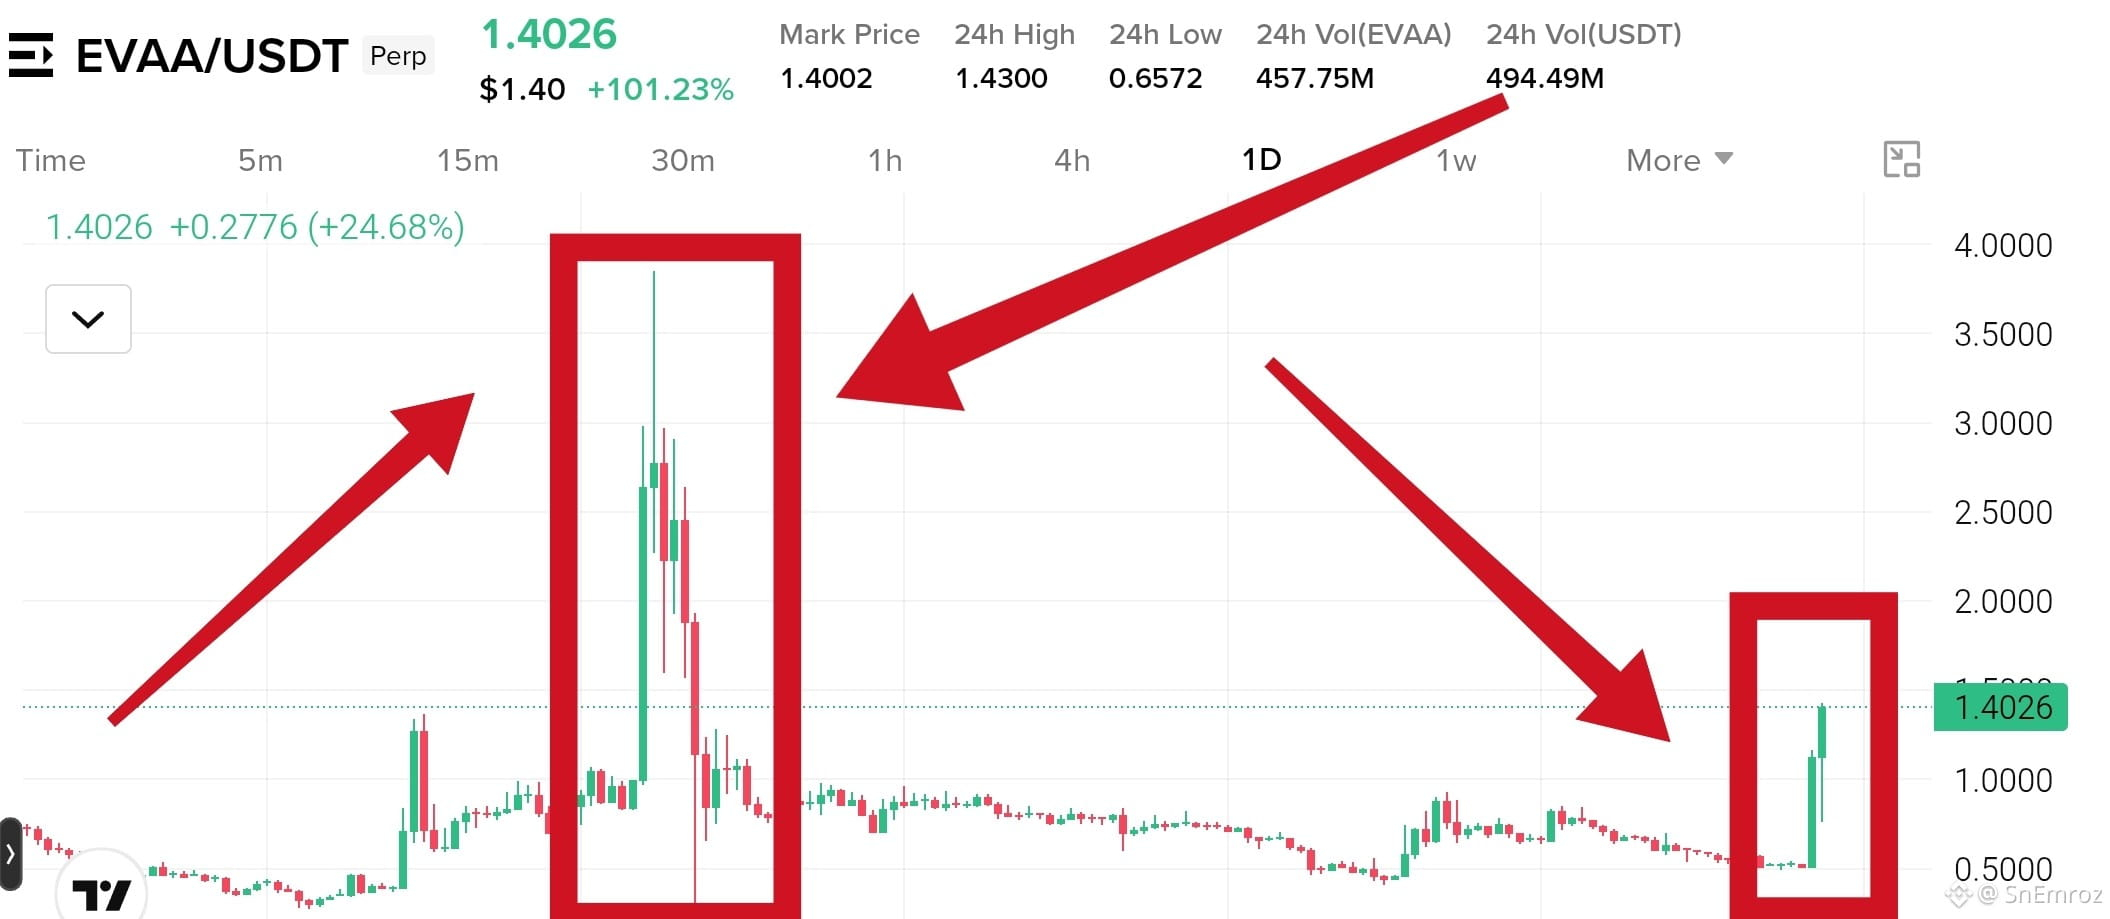
Look at $EVAA on the 1D chart.
The first pump ran from under 1.00 to about 3.85. Then it fell almost all the way back in a few days. Now a new green candle is up 101% today. Many people see this and think it will go to the moon again. This is exactly where money gets lost.
{future}(EVAAUSDT)
How people lose.
They buy because the candle is already green and everyone is talking about it.
They think last time it hit 3.85 so it will do it again.
They enter with big size and high leverage.
They have no stop loss.
They hold when price drops and hope it comes back.
What smart traders do.
Never chase a candle that is already up 100%.
Wait for a pullback and a clear level to hold.
Keep size small on wild coins.
Set the stop loss before the entry.
Take profit while price is up and do not wait for the top.
The first pump gave back almost everything. A big green candle is not a promise. Many times it is the exit for early buyers.
#evva
Look at $EVAA on the 1D chart.
The first pump ran from under 1.00 to about 3.85. Then it fell almost all the way back in a few days. Now a new green candle is up 101% today. Many people see this and think it will go to the moon again. This is exactly where money gets lost.
How people lose.
They buy because the candle is already green and everyone is talking about it.
They think last time it hit 3.85 so it will do it again.
They enter with big size and high leverage.
They have no stop loss.
They hold when price drops and hope it comes back.
What smart traders do.
Never chase a candle that is already up 100%.
Wait for a pullback and a clear level to hold.
Keep size small on wild coins.
Set the stop loss before the entry.
Take profit while price is up and do not wait for the top.
The first pump gave back almost everything. A big green candle is not a promise. Many times it is the exit for early buyers.
#evva
The first pump ran from under 1.00 to about 3.85. Then it fell almost all the way back in a few days. Now a new green candle is up 101% today. Many people see this and think it will go to the moon again. This is exactly where money gets lost.
How people lose.
They buy because the candle is already green and everyone is talking about it.
They think last time it hit 3.85 so it will do it again.
They enter with big size and high leverage.
They have no stop loss.
They hold when price drops and hope it comes back.
What smart traders do.
Never chase a candle that is already up 100%.
Wait for a pullback and a clear level to hold.
Keep size small on wild coins.
Set the stop loss before the entry.
Take profit while price is up and do not wait for the top.
The first pump gave back almost everything. A big green candle is not a promise. Many times it is the exit for early buyers.
#evva
654
·
--
උසබ තත්ත්වය
$BTW
{future}(BTWUSDT)
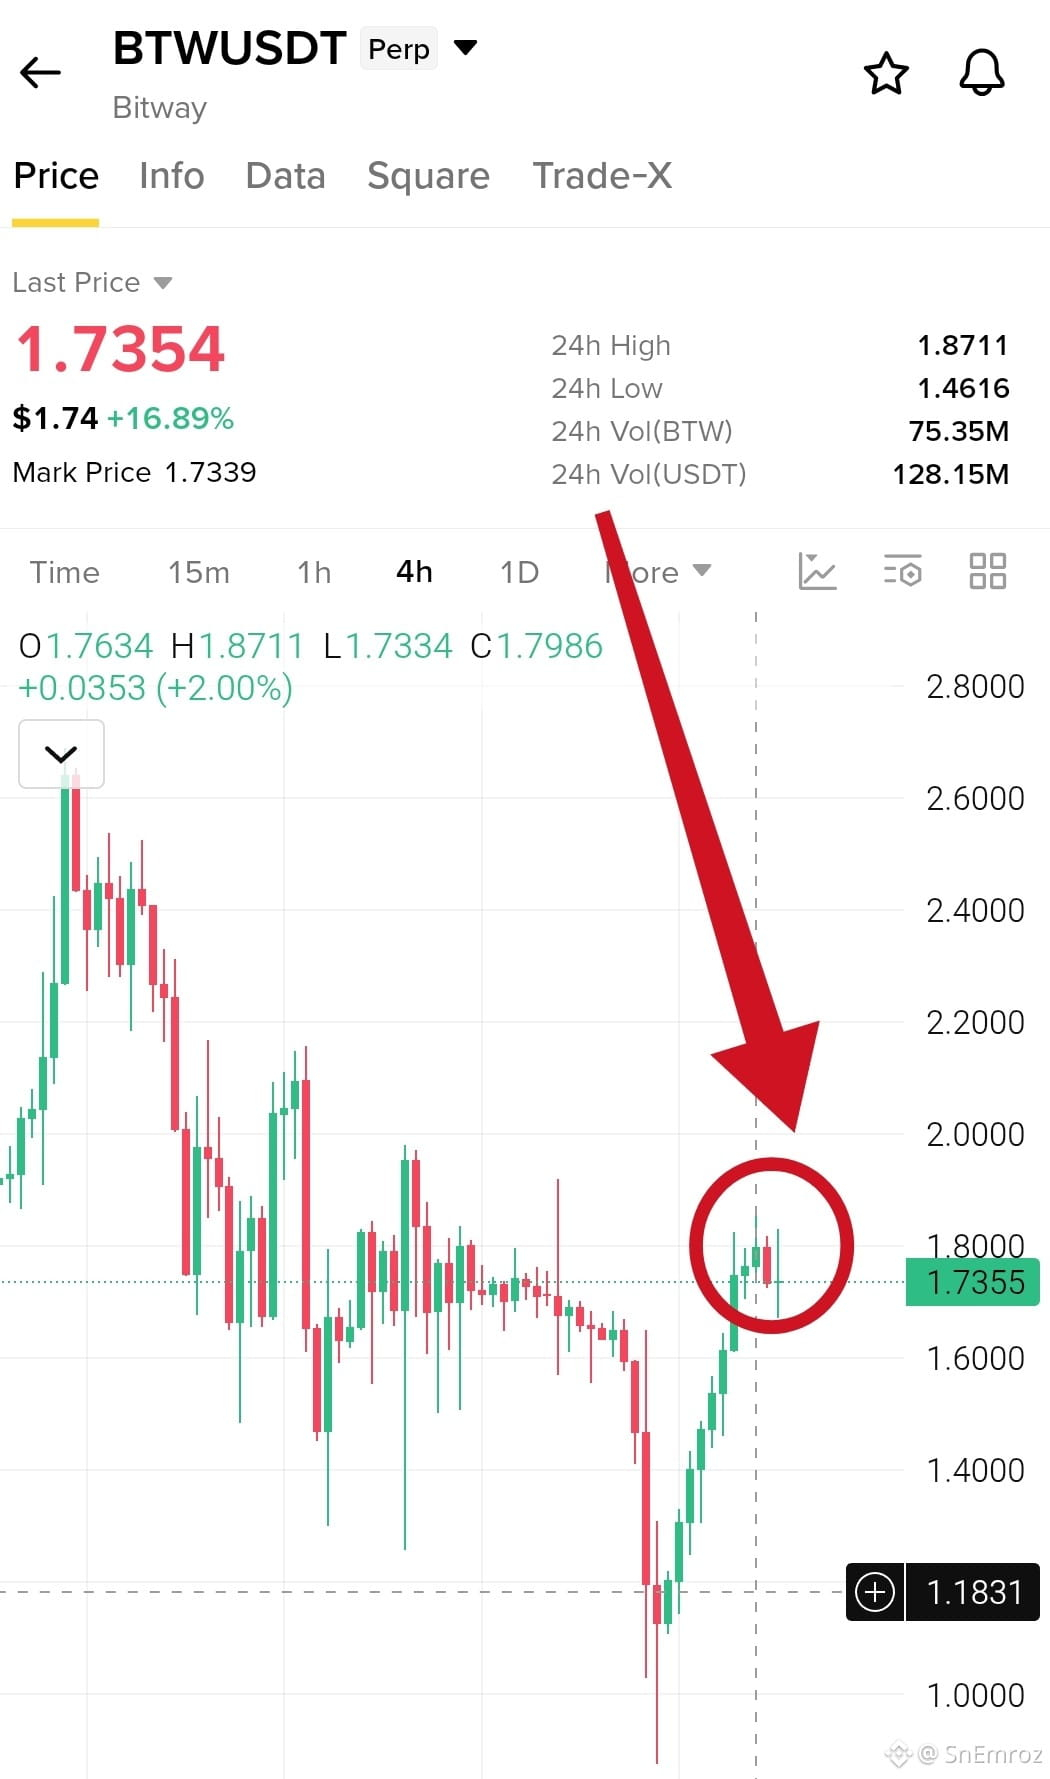
update, target zone touched 🎯
In my last update the price was 1.52 and I named 1.8581 to 1.8711 as the main target. Today's high is 1.8711, so price tapped the top of that zone.
It has pulled back to 1.7354 and the candles show long upper wicks. Sellers are defending the top.
First support to watch is 1.6492. A close below it can drop price toward 1.4616. A clean 4h close above 1.8711 can start a new leg up.
$BTW
update, target zone touched 🎯
In my last update the price was 1.52 and I named 1.8581 to 1.8711 as the main target. Today's high is 1.8711, so price tapped the top of that zone.
It has pulled back to 1.7354 and the candles show long upper wicks. Sellers are defending the top.
First support to watch is 1.6492. A close below it can drop price toward 1.4616. A clean 4h close above 1.8711 can start a new leg up.
update, target zone touched 🎯
In my last update the price was 1.52 and I named 1.8581 to 1.8711 as the main target. Today's high is 1.8711, so price tapped the top of that zone.
It has pulled back to 1.7354 and the candles show long upper wicks. Sellers are defending the top.
First support to watch is 1.6492. A close below it can drop price toward 1.4616. A clean 4h close above 1.8711 can start a new leg up.
SnEmroz
·
--
උසබ තත්ත්වය$BTW is now at 1.52 and up 37% today
Momentum is strong on the 4h chart and buyers are in full control.
Price swept down to 0.8688 and bounced hard from there.
First resistance is 1.6492, the 24h high. The main target is the last high zone at 1.8581 to 1.8711.
After a pump this fast a pullback is normal, so do not chase. Wait for a retest or a clean close above 1.6492.
If buyers lose power, price can give back a big part of the pump.
Momentum is strong on the 4h chart and buyers are in full control.
Price swept down to 0.8688 and bounced hard from there.
First resistance is 1.6492, the 24h high. The main target is the last high zone at 1.8581 to 1.8711.
After a pump this fast a pullback is normal, so do not chase. Wait for a retest or a clean close above 1.6492.
If buyers lose power, price can give back a big part of the pump.
2
568
තවත් අන්තර්ගතයන් ගවේෂණය කිරීමට ඇතුල් වන්න
Binance චතුරශ්රය හි ගෝලීය ක්රිප්ටෝ පරිශීලකයින් හා එක්වන්න
⚡️ ක්රිප්ටෝ පිළිබඳ නවතම සහ ප්රයෝජනවත් තොරතුරු ලබා ගන්න.
💬 ලොව විශාලතම ක්රිප්ටෝ හුවමාරුව මගින් විශ්වාස කෙරේ.
👍 සත්යායනය කරන ලද නිර්මාණකරුවන්ගෙන් සැබෑ විදසුන් සොයා ගන්න.
විද්යුත් තැපෑල / දුරකථන අංකය
නැගී එන මාතෘකා
BinanceReopensWithdrawalsForMoreAssets
9,590 නැරඹීම්
348 සාකච්ඡා කරමින්
Security Incident | Recovery Update #6: Withdrawals Reopen for More Assets (2026-11-03)
Binance Announcement
·118 කැමත්ත දැක්වීම්
·293.4k නැරඹීම්
AppleReportsMixedResults
6,555 නැරඹීම්
293 සාකච්ඡා කරමින්
BinanceHourlyDepositsExceedWithdrawals
22 නැරඹීම්
8 සාකච්ඡා කරමින්