
shaaam
754 පෝස්ටු

shaaam
වාර්තා කරන්න
පරිශීලක අවහිර කරන්න
4.7K+ හඹා යමින්
1.6K+ හඹා යන්නන්
1.0K+ කැමති විය
පෝස්ටු
සියල්ල
උපුටා දැක්වීම්
සජීවි
·
--
{future}(NILUSDT)
collect Hurryup
collect Hurryup

shaaam
·
--
#nil $NIL @Nillion 🤩😍
What is Nillion (NIL) - The Future of Blind Computing?*
Everyone talks about blockchains that store data. Nillion is building a network that _doesn't_ store data, but still computes on it. Interesting, right?
*So what is Nillion?*
Nillion is a decentralized network for *Blind Computing*. It allows AI and data to be processed without ever revealing the actual data.
Think of it like this: You can use your private data for trading, health, or AI, but the network never sees your data. This is possible with their tech called *Nil Message Compute (NMC)*.
*Why is Nillion Getting Hype?*
1. *Not Just Another L1:* Nillion is not competing with Ethereum or Solana. It's a computation network that other blockchains can use.
2. *Real Privacy Use Cases:* Private AI agents, private DePIN, encrypted order books for DeFi, secure health data sharing.
3. *Strong Backing:* Backed by Hack VC, HashKey, and other top VCs. Raised $50M+.
What is Nillion (NIL) - The Future of Blind Computing?*
Everyone talks about blockchains that store data. Nillion is building a network that _doesn't_ store data, but still computes on it. Interesting, right?
*So what is Nillion?*
Nillion is a decentralized network for *Blind Computing*. It allows AI and data to be processed without ever revealing the actual data.
Think of it like this: You can use your private data for trading, health, or AI, but the network never sees your data. This is possible with their tech called *Nil Message Compute (NMC)*.
*Why is Nillion Getting Hype?*
1. *Not Just Another L1:* Nillion is not competing with Ethereum or Solana. It's a computation network that other blockchains can use.
2. *Real Privacy Use Cases:* Private AI agents, private DePIN, encrypted order books for DeFi, secure health data sharing.
3. *Strong Backing:* Backed by Hack VC, HashKey, and other top VCs. Raised $50M+.
84
·
--
Ripple brings Wall Street into 24/7 stock bets, but HSBC warns markets are still thin
Institutions can trade through Ripple Prime and post RLUSD as collateral. Finding enough buyers and sellers for large positions could prove harder.
Ripple brings Wall Street into 24/7 stock bets, but HSBC warns markets are still thin
Institutions can trade through Ripple Prime and post RLUSD as collateral. Finding enough buyers and sellers for large positions could prove harder.
Institutions can trade through Ripple Prime and post RLUSD as collateral. Finding enough buyers and sellers for large positions could prove harder.

86
·
--
Live updates: Bitcoin edges higher as U.S. stocks rebound early Monday
Tech futures bounced after last week’s 5.5% rout; earnings this week put the AI trade to the test again.
{future}(BTCUSDT)
Live updates: Bitcoin edges higher as U.S. stocks rebound early Monday
Tech futures bounced after last week’s 5.5% rout; earnings this week put the AI trade to the test again.
Tech futures bounced after last week’s 5.5% rout; earnings this week put the AI trade to the test again.
81
·
--
Strategy's price chart is about to flash a major bullish signal weeks after bitcoin did
{future}(BTCUSDT)
$BTC
Strategy's price chart is about to flash a major bullish signal weeks after bitcoin did
$BTC
$BTC
112
·
--
#nil $NIL @nillionnetwork 🤩😍
{future}(NILUSDT)
What is Nillion (NIL) - The Future of Blind Computing?*
Everyone talks about blockchains that store data. Nillion is building a network that _doesn't_ store data, but still computes on it. Interesting, right?
*So what is Nillion?*
Nillion is a decentralized network for *Blind Computing*. It allows AI and data to be processed without ever revealing the actual data.
Think of it like this: You can use your private data for trading, health, or AI, but the network never sees your data. This is possible with their tech called *Nil Message Compute (NMC)*.
*Why is Nillion Getting Hype?*
1. *Not Just Another L1:* Nillion is not competing with Ethereum or Solana. It's a computation network that other blockchains can use.
2. *Real Privacy Use Cases:* Private AI agents, private DePIN, encrypted order books for DeFi, secure health data sharing.
3. *Strong Backing:* Backed by Hack VC, HashKey, and other top VCs. Raised $50M+.
#nil $NIL @Nillion 🤩😍
What is Nillion (NIL) - The Future of Blind Computing?*
Everyone talks about blockchains that store data. Nillion is building a network that _doesn't_ store data, but still computes on it. Interesting, right?
*So what is Nillion?*
Nillion is a decentralized network for *Blind Computing*. It allows AI and data to be processed without ever revealing the actual data.
Think of it like this: You can use your private data for trading, health, or AI, but the network never sees your data. This is possible with their tech called *Nil Message Compute (NMC)*.
*Why is Nillion Getting Hype?*
1. *Not Just Another L1:* Nillion is not competing with Ethereum or Solana. It's a computation network that other blockchains can use.
2. *Real Privacy Use Cases:* Private AI agents, private DePIN, encrypted order books for DeFi, secure health data sharing.
3. *Strong Backing:* Backed by Hack VC, HashKey, and other top VCs. Raised $50M+.
What is Nillion (NIL) - The Future of Blind Computing?*
Everyone talks about blockchains that store data. Nillion is building a network that _doesn't_ store data, but still computes on it. Interesting, right?
*So what is Nillion?*
Nillion is a decentralized network for *Blind Computing*. It allows AI and data to be processed without ever revealing the actual data.
Think of it like this: You can use your private data for trading, health, or AI, but the network never sees your data. This is possible with their tech called *Nil Message Compute (NMC)*.
*Why is Nillion Getting Hype?*
1. *Not Just Another L1:* Nillion is not competing with Ethereum or Solana. It's a computation network that other blockchains can use.
2. *Real Privacy Use Cases:* Private AI agents, private DePIN, encrypted order books for DeFi, secure health data sharing.
3. *Strong Backing:* Backed by Hack VC, HashKey, and other top VCs. Raised $50M+.
1
1
92
·
--
#nil
---
The Future of Blind Computing?*
Everyone talks about blockchains that store data. Nillion is building a network that _doesn't_ store data, but still computes on it. Interesting, right?
*So what is Nillion?*
Nillion is a decentralized network for *Blind Computing*. It allows AI and data to be processed without ever revealing the actual data.
#nil
---
The Future of Blind Computing?*
Everyone talks about blockchains that store data. Nillion is building a network that _doesn't_ store data, but still computes on it. Interesting, right?
*So what is Nillion?*
Nillion is a decentralized network for *Blind Computing*. It allows AI and data to be processed without ever revealing the actual data.
---
The Future of Blind Computing?*
Everyone talks about blockchains that store data. Nillion is building a network that _doesn't_ store data, but still computes on it. Interesting, right?
*So what is Nillion?*
Nillion is a decentralized network for *Blind Computing*. It allows AI and data to be processed without ever revealing the actual data.
103
·
--

ලිපිය
Hashi launches with $500 million for Bitcoin loans: the collateral stays on the Bitcoin chainMysten Labs is launching a network on the Sui blockchain through which Bitcoin serves as collateral for loans without leaving the Bitcoin chain. More than $500 million is committed; terms, starting liquidity and the schedule remain open.
Hold Bitcoin and need cash and you long had only one option: sell. Since October 9, 2026 a second variant is on the table. Mysten Labs, the development firm behind the Sui blockchain, is launching Hashi, a network through which Bitcoin serves as collateral for loans without leaving the Bitcoin blockchain. More than $500 million in capital commitments from over twenty partners stands behind it, according to The launch runs in phases through October.
For investors in Europe this is, to begin with, news about a product you will not find in your banking app. It becomes interesting at three points: the question of whom you entrust your Bitcoin to, the tax question around the holding period, and the risk that every collateralised loan carries. Bitcoin trades on Sunday at $83,906, or €74,816.
Hashi launches on Sui: Mysten Labs gathers more than $500 million in commitments
Hashi is a network for Bitcoin finance built by Mysten Labs. Bitcoin finance here simply means that Bitcoin already held is put up as security for borrowing instead of sitting unused in a wallet. The loan is paid out in other assets on the Sui chain, not in Bitcoin itself.
The figure travelling through the reports is $500 million. That number comes from the announcement and describes capital committed by more than twenty partners from the industry. The rollout begins in October and proceeds in stages rather than on a single date.
Hashi launches with $500 million for Bitcoin loans: the collateral stays on the Bitcoin chain
Mysten Labs is launching a network on the Sui blockchain through which Bitcoin serves as collateral for loans without leaving the Bitcoin chain. More than $500 million is committed; terms, starting liquidity and the schedule remain open.
Hold Bitcoin and need cash and you long had only one option: sell. Since October 9, 2026 a second variant is on the table. Mysten Labs, the development firm behind the Sui blockchain, is launching Hashi, a network through which Bitcoin serves as collateral for loans without leaving the Bitcoin blockchain. More than $500 million in capital commitments from over twenty partners stands behind it, according to The launch runs in phases through October.
For investors in Europe this is, to begin with, news about a product you will not find in your banking app. It becomes interesting at three points: the question of whom you entrust your Bitcoin to, the tax question around the holding period, and the risk that every collateralised loan carries. Bitcoin trades on Sunday at $83,906, or €74,816.
Hashi launches on Sui: Mysten Labs gathers more than $500 million in commitments
Hashi is a network for Bitcoin finance built by Mysten Labs. Bitcoin finance here simply means that Bitcoin already held is put up as security for borrowing instead of sitting unused in a wallet. The loan is paid out in other assets on the Sui chain, not in Bitcoin itself.
The figure travelling through the reports is $500 million. That number comes from the announcement and describes capital committed by more than twenty partners from the industry. The rollout begins in October and proceeds in stages rather than on a single date.
Hold Bitcoin and need cash and you long had only one option: sell. Since October 9, 2026 a second variant is on the table. Mysten Labs, the development firm behind the Sui blockchain, is launching Hashi, a network through which Bitcoin serves as collateral for loans without leaving the Bitcoin blockchain. More than $500 million in capital commitments from over twenty partners stands behind it, according to The launch runs in phases through October.
For investors in Europe this is, to begin with, news about a product you will not find in your banking app. It becomes interesting at three points: the question of whom you entrust your Bitcoin to, the tax question around the holding period, and the risk that every collateralised loan carries. Bitcoin trades on Sunday at $83,906, or €74,816.
Hashi launches on Sui: Mysten Labs gathers more than $500 million in commitments
Hashi is a network for Bitcoin finance built by Mysten Labs. Bitcoin finance here simply means that Bitcoin already held is put up as security for borrowing instead of sitting unused in a wallet. The loan is paid out in other assets on the Sui chain, not in Bitcoin itself.
The figure travelling through the reports is $500 million. That number comes from the announcement and describes capital committed by more than twenty partners from the industry. The rollout begins in October and proceeds in stages rather than on a single date.
2
209
·
--
Sui Foundation’s $30 million investment in DATA moves its network to SuiSui Foundation’s $30 million investment in DATA Network pairs funding with a blockchain migration: the AI training data protocol will move to Sui and retire its independent chain. The partnership also brings its data infrastructure to Walrus, with the aim of expanding access to rights-cleared training material for AI labs.
Sui Foundation’s investment in DATA Network
The investment will make Sui Foundation the network’s largest institutional stakeholder, DATA Foundation said. It forms part of a strategic partnership covering both the protocol’s move to Sui and its integration with onchain storage platform Walrus.
DATA Foundation, which supports the network, shifted its focus in June from general intellectual property infrastructure to AI training data. The agreement brings that infrastructure onto Sui rather than maintaining it on a separate blockchain.
How DATA Network and its token will migrate
DATA Network will receive an upgrade to operate natively as a protocol on Sui. Its standalone blockchain will be retired once the transition is complete.
The existing DATA token will transfer at a one-to-one ratio. According to Crypto.news, the joint announcement states that holders will keep economic benefits and governance rights at least equal to what they currently have, while locked tokens and already-established vesting schedules will remain unaffected.
DATA Foundation plans to publish a detailed migration schedule before the upgrade, along with instructions for token holders.
Walrus storage and Trace’s AI data registry
Walrus will serve as the default storage layer for applications operated by DATA Foundation. Sui Foundation’s investment in DATA Network supports a partnership intended to scale the AI training data supply chain and give labs access to real-world material they have permission to use.
The network’s Trace registry, launched in June, records where training data comes from and the rights governing its use. It also settles payments to the people who contribute that data.
According to DATA Foundation’s statement, Trace has registered more than 250 million contributions since launch and handles an average of more than 3 million receipts daily.
Sui Foundation’s $30 million investment in DATA moves its network to Sui
Sui Foundation’s $30 million investment in DATA Network pairs funding with a blockchain migration: the AI training data protocol will move to Sui and retire its independent chain. The partnership also brings its data infrastructure to Walrus, with the aim of expanding access to rights-cleared training material for AI labs.
Sui Foundation’s investment in DATA Network
The investment will make Sui Foundation the network’s largest institutional stakeholder, DATA Foundation said. It forms part of a strategic partnership covering both the protocol’s move to Sui and its integration with onchain storage platform Walrus.
DATA Foundation, which supports the network, shifted its focus in June from general intellectual property infrastructure to AI training data. The agreement brings that infrastructure onto Sui rather than maintaining it on a separate blockchain.
How DATA Network and its token will migrate
DATA Network will receive an upgrade to operate natively as a protocol on Sui. Its standalone blockchain will be retired once the transition is complete.
The existing DATA token will transfer at a one-to-one ratio. According to Crypto.news, the joint announcement states that holders will keep economic benefits and governance rights at least equal to what they currently have, while locked tokens and already-established vesting schedules will remain unaffected.
DATA Foundation plans to publish a detailed migration schedule before the upgrade, along with instructions for token holders.
Walrus storage and Trace’s AI data registry
Walrus will serve as the default storage layer for applications operated by DATA Foundation. Sui Foundation’s investment in DATA Network supports a partnership intended to scale the AI training data supply chain and give labs access to real-world material they have permission to use.
The network’s Trace registry, launched in June, records where training data comes from and the rights governing its use. It also settles payments to the people who contribute that data.
According to DATA Foundation’s statement, Trace has registered more than 250 million contributions since launch and handles an average of more than 3 million receipts daily.
Sui Foundation’s investment in DATA Network
The investment will make Sui Foundation the network’s largest institutional stakeholder, DATA Foundation said. It forms part of a strategic partnership covering both the protocol’s move to Sui and its integration with onchain storage platform Walrus.
DATA Foundation, which supports the network, shifted its focus in June from general intellectual property infrastructure to AI training data. The agreement brings that infrastructure onto Sui rather than maintaining it on a separate blockchain.
How DATA Network and its token will migrate
DATA Network will receive an upgrade to operate natively as a protocol on Sui. Its standalone blockchain will be retired once the transition is complete.
The existing DATA token will transfer at a one-to-one ratio. According to Crypto.news, the joint announcement states that holders will keep economic benefits and governance rights at least equal to what they currently have, while locked tokens and already-established vesting schedules will remain unaffected.
DATA Foundation plans to publish a detailed migration schedule before the upgrade, along with instructions for token holders.
Walrus storage and Trace’s AI data registry
Walrus will serve as the default storage layer for applications operated by DATA Foundation. Sui Foundation’s investment in DATA Network supports a partnership intended to scale the AI training data supply chain and give labs access to real-world material they have permission to use.
The network’s Trace registry, launched in June, records where training data comes from and the rights governing its use. It also settles payments to the people who contribute that data.
According to DATA Foundation’s statement, Trace has registered more than 250 million contributions since launch and handles an average of more than 3 million receipts daily.
1
83
·
--

ලිපිය
Pi Network Price Forecast: PI defends $0.0800 support as selling pressure mountsPi Network hovers above $0.0800 on Monday, extending the losses from the previous day.Retail speculation surrounding the PI token is easing, with the Open Interest below $9 million.The technical outlook for the PI token is bearish, at risk of breaking below the $0.0800 support level.
Pi Network (PI) is trading in the red on Monday, hovering above $0.0800 as selling pressure mounts. PI token’s speculative demand is easing, with Open Interest below $9 million despite rising social chatter, hinting at panic-driven buzz among investors. The technical outlook for PI suggests a bearish bias, with the risk of breaking below the $0.0800 support level.
Retail support declines
Pi Network sees a decline in retail speculation from last week. CoinAnk data shows the PI futures Open Interest (OI) at $8.86 million on Monday, down from $10.52 million last week, suggesting a reduced notional value of active positions, driven by a declining spot price or a positional wipeout. In either case, this indicates a reduced retail participation, which is crucial for speculation-driven tokens like PI.
On the other hand, the market chatter surrounding the PI token is elevated, with Santiment’s data showing PI's social dominance score at 0.36% on Sunday, up from 0.06% on Thursday. The decline in retail activity, despite elevated market buzz around PI, reaffirms a bearish bias in investor sentiment.
Technical outlook: Will PI defend its $0.080 support level?
Pi Network trades above $0.0800 at press time on Monday, holding steady above its crucial support level set by the July 31 low. The PI token extends a bearish near-term bias as price holds well below the 50- and 200-day Exponential Moving Averages (EMAs) at $0.0889 and $0.1230, respectively.
PI remains beneath a descending trendline, connecting the June 20 and August 22 highs, near $0.0880. The pair also trades under the 23.6% Fibonacci retracement at $0.0867, measured from $0.1394 to $0.0704, keeping it confined to the lower end of the recent range.
In addition, the roughly 7% decline on Wednesday broke below the short-term rising support trendline, connecting the July 14 and September 16 lows, near $0.0836, which also capped gains on Saturday.
Momentum remains bearish on the daily chart, with the Relative Strength Index (RSI) declining to 39, below the midline, while the slightly negative Moving Average Convergence Divergence (MACD) suggests that downside momentum is still present.
A confirmed breakout below the $0.0800 level could extend the decline toward the $0.0704 swing low. Any deeper pullback will push PI deeper into untested waters.
On the topside, initial resistance is clustered around the 23.6% Fibonacci retracement, the descending trendline, and the 50-day EMA near $0.0866, $0.0880, and $0.0889, respectively. A daily close above this band would open the way toward the 50% retracement level at $0.1049.
Pi Network Price Forecast: PI defends $0.0800 support as selling pressure mounts
Pi Network hovers above $0.0800 on Monday, extending the losses from the previous day.Retail speculation surrounding the PI token is easing, with the Open Interest below $9 million.The technical outlook for the PI token is bearish, at risk of breaking below the $0.0800 support level.
Pi Network (PI) is trading in the red on Monday, hovering above $0.0800 as selling pressure mounts. PI token’s speculative demand is easing, with Open Interest below $9 million despite rising social chatter, hinting at panic-driven buzz among investors. The technical outlook for PI suggests a bearish bias, with the risk of breaking below the $0.0800 support level.
Retail support declines
Pi Network sees a decline in retail speculation from last week. CoinAnk data shows the PI futures Open Interest (OI) at $8.86 million on Monday, down from $10.52 million last week, suggesting a reduced notional value of active positions, driven by a declining spot price or a positional wipeout. In either case, this indicates a reduced retail participation, which is crucial for speculation-driven tokens like PI.
On the other hand, the market chatter surrounding the PI token is elevated, with Santiment’s data showing PI's social dominance score at 0.36% on Sunday, up from 0.06% on Thursday. The decline in retail activity, despite elevated market buzz around PI, reaffirms a bearish bias in investor sentiment.
Technical outlook: Will PI defend its $0.080 support level?
Pi Network trades above $0.0800 at press time on Monday, holding steady above its crucial support level set by the July 31 low. The PI token extends a bearish near-term bias as price holds well below the 50- and 200-day Exponential Moving Averages (EMAs) at $0.0889 and $0.1230, respectively.
PI remains beneath a descending trendline, connecting the June 20 and August 22 highs, near $0.0880. The pair also trades under the 23.6% Fibonacci retracement at $0.0867, measured from $0.1394 to $0.0704, keeping it confined to the lower end of the recent range.
In addition, the roughly 7% decline on Wednesday broke below the short-term rising support trendline, connecting the July 14 and September 16 lows, near $0.0836, which also capped gains on Saturday.
Momentum remains bearish on the daily chart, with the Relative Strength Index (RSI) declining to 39, below the midline, while the slightly negative Moving Average Convergence Divergence (MACD) suggests that downside momentum is still present.
A confirmed breakout below the $0.0800 level could extend the decline toward the $0.0704 swing low. Any deeper pullback will push PI deeper into untested waters.
On the topside, initial resistance is clustered around the 23.6% Fibonacci retracement, the descending trendline, and the 50-day EMA near $0.0866, $0.0880, and $0.0889, respectively. A daily close above this band would open the way toward the 50% retracement level at $0.1049.
Pi Network (PI) is trading in the red on Monday, hovering above $0.0800 as selling pressure mounts. PI token’s speculative demand is easing, with Open Interest below $9 million despite rising social chatter, hinting at panic-driven buzz among investors. The technical outlook for PI suggests a bearish bias, with the risk of breaking below the $0.0800 support level.
Retail support declines
Pi Network sees a decline in retail speculation from last week. CoinAnk data shows the PI futures Open Interest (OI) at $8.86 million on Monday, down from $10.52 million last week, suggesting a reduced notional value of active positions, driven by a declining spot price or a positional wipeout. In either case, this indicates a reduced retail participation, which is crucial for speculation-driven tokens like PI.
On the other hand, the market chatter surrounding the PI token is elevated, with Santiment’s data showing PI's social dominance score at 0.36% on Sunday, up from 0.06% on Thursday. The decline in retail activity, despite elevated market buzz around PI, reaffirms a bearish bias in investor sentiment.
Technical outlook: Will PI defend its $0.080 support level?
Pi Network trades above $0.0800 at press time on Monday, holding steady above its crucial support level set by the July 31 low. The PI token extends a bearish near-term bias as price holds well below the 50- and 200-day Exponential Moving Averages (EMAs) at $0.0889 and $0.1230, respectively.
PI remains beneath a descending trendline, connecting the June 20 and August 22 highs, near $0.0880. The pair also trades under the 23.6% Fibonacci retracement at $0.0867, measured from $0.1394 to $0.0704, keeping it confined to the lower end of the recent range.
In addition, the roughly 7% decline on Wednesday broke below the short-term rising support trendline, connecting the July 14 and September 16 lows, near $0.0836, which also capped gains on Saturday.
Momentum remains bearish on the daily chart, with the Relative Strength Index (RSI) declining to 39, below the midline, while the slightly negative Moving Average Convergence Divergence (MACD) suggests that downside momentum is still present.
A confirmed breakout below the $0.0800 level could extend the decline toward the $0.0704 swing low. Any deeper pullback will push PI deeper into untested waters.
On the topside, initial resistance is clustered around the 23.6% Fibonacci retracement, the descending trendline, and the 50-day EMA near $0.0866, $0.0880, and $0.0889, respectively. A daily close above this band would open the way toward the 50% retracement level at $0.1049.
1
145
·
--

ලිපිය
XRP Flashes 4-Hour TD Sequential Buy Signal After Drop From $1.53$XRP flashes a fresh four-hour TD Sequential buy signal after falling from $1.53 toward $1.39, putting a potential short-term rebound into focus.
$XRP has printed a fresh TD Sequential buy signal on the four-hour chart after falling from the $1.53 region toward $1.39.
$XRP’s four-hour chart shows a TD Sequential buy signal near $1.409 after price fell from the $1.53 area toward $1.39. An earlier sell signal appeared near the recent local high.
The setup follows an earlier TD Sequential sell signal that appeared close to the recent local high before price turned lower.
The chart places $XRP near $1.409, with the latest decline erasing roughly 9% from the recent peak.
Selling pressure has remained persistent across several four-hour candles, taking $XRP through $1.48 and $1.45 before price reached the $1.39 area.
TD Sequential Flips From Sell to Buy
The TD Sequential indicator is designed to identify periods when a trend may be approaching exhaustion.
On the current chart, a “9” buy signal has now appeared near the latest candles. In this setup, the ninth candle can suggest that the existing move is becoming stretched enough for a pause or reversal attempt to develop.
The earlier signal adds context.
A previous “9” sell signal formed close to the $1.52-$1.53 area. $XRP subsequently rolled over and moved steadily lower, eventually reaching $1.39.
The indicator has now flipped in the opposite direction after that decline.
This does not confirm that $XRP has already established a durable bottom, but it puts the possibility of a short-term low or relief rebound back into focus.
$1.39 Is the First Level Bulls Need to Hold
The latest downside wick reached the $1.39 area, making it the nearest support visible on the four-hour setup.
If buyers continue defending this level, the first recovery area sits around $1.45.
Above that, $XRP would need to reclaim $1.48, followed by the broader $1.50-$1.53 resistance zone where the selloff began.
That sequence matters because a bounce from $1.39 would still need to recover several broken levels before the short-term structure meaningfully improves.
On the other side, a sustained move below $1.39 would weaken the immediate reversal setup and show that sellers remain in control despite the TD Sequential buy signal.
For now, the chart leaves $XRP at a clear inflection point: the indicator is signaling possible exhaustion after a sharp decline, but price still needs to prove that the $1.39 area can hold.
XRP Flashes 4-Hour TD Sequential Buy Signal After Drop From $1.53
$XRP flashes a fresh four-hour TD Sequential buy signal after falling from $1.53 toward $1.39, putting a potential short-term rebound into focus.
$XRP has printed a fresh TD Sequential buy signal on the four-hour chart after falling from the $1.53 region toward $1.39.
$XRP’s four-hour chart shows a TD Sequential buy signal near $1.409 after price fell from the $1.53 area toward $1.39. An earlier sell signal appeared near the recent local high.
The setup follows an earlier TD Sequential sell signal that appeared close to the recent local high before price turned lower.
The chart places $XRP near $1.409, with the latest decline erasing roughly 9% from the recent peak.
Selling pressure has remained persistent across several four-hour candles, taking $XRP through $1.48 and $1.45 before price reached the $1.39 area.
TD Sequential Flips From Sell to Buy
The TD Sequential indicator is designed to identify periods when a trend may be approaching exhaustion.
On the current chart, a “9” buy signal has now appeared near the latest candles. In this setup, the ninth candle can suggest that the existing move is becoming stretched enough for a pause or reversal attempt to develop.
The earlier signal adds context.
A previous “9” sell signal formed close to the $1.52-$1.53 area. $XRP subsequently rolled over and moved steadily lower, eventually reaching $1.39.
The indicator has now flipped in the opposite direction after that decline.
This does not confirm that $XRP has already established a durable bottom, but it puts the possibility of a short-term low or relief rebound back into focus.
$1.39 Is the First Level Bulls Need to Hold
The latest downside wick reached the $1.39 area, making it the nearest support visible on the four-hour setup.
If buyers continue defending this level, the first recovery area sits around $1.45.
Above that, $XRP would need to reclaim $1.48, followed by the broader $1.50-$1.53 resistance zone where the selloff began.
That sequence matters because a bounce from $1.39 would still need to recover several broken levels before the short-term structure meaningfully improves.
On the other side, a sustained move below $1.39 would weaken the immediate reversal setup and show that sellers remain in control despite the TD Sequential buy signal.
For now, the chart leaves $XRP at a clear inflection point: the indicator is signaling possible exhaustion after a sharp decline, but price still needs to prove that the $1.39 area can hold.
$XRP has printed a fresh TD Sequential buy signal on the four-hour chart after falling from the $1.53 region toward $1.39.
$XRP’s four-hour chart shows a TD Sequential buy signal near $1.409 after price fell from the $1.53 area toward $1.39. An earlier sell signal appeared near the recent local high.
The setup follows an earlier TD Sequential sell signal that appeared close to the recent local high before price turned lower.
The chart places $XRP near $1.409, with the latest decline erasing roughly 9% from the recent peak.
Selling pressure has remained persistent across several four-hour candles, taking $XRP through $1.48 and $1.45 before price reached the $1.39 area.
TD Sequential Flips From Sell to Buy
The TD Sequential indicator is designed to identify periods when a trend may be approaching exhaustion.
On the current chart, a “9” buy signal has now appeared near the latest candles. In this setup, the ninth candle can suggest that the existing move is becoming stretched enough for a pause or reversal attempt to develop.
The earlier signal adds context.
A previous “9” sell signal formed close to the $1.52-$1.53 area. $XRP subsequently rolled over and moved steadily lower, eventually reaching $1.39.
The indicator has now flipped in the opposite direction after that decline.
This does not confirm that $XRP has already established a durable bottom, but it puts the possibility of a short-term low or relief rebound back into focus.
$1.39 Is the First Level Bulls Need to Hold
The latest downside wick reached the $1.39 area, making it the nearest support visible on the four-hour setup.
If buyers continue defending this level, the first recovery area sits around $1.45.
Above that, $XRP would need to reclaim $1.48, followed by the broader $1.50-$1.53 resistance zone where the selloff began.
That sequence matters because a bounce from $1.39 would still need to recover several broken levels before the short-term structure meaningfully improves.
On the other side, a sustained move below $1.39 would weaken the immediate reversal setup and show that sellers remain in control despite the TD Sequential buy signal.
For now, the chart leaves $XRP at a clear inflection point: the indicator is signaling possible exhaustion after a sharp decline, but price still needs to prove that the $1.39 area can hold.
4
1.1k
·
--

ලිපිය
Ethereum Price Forecast: ETH drops below $2,500 as rising Treasury yields trigger selling pressureEthereum price today: $2,470
Ethereum declined below $2,500 on Thursday following rising oil prices and US Treasury yields.ETH ETFs recorded $565 million in outflows over seven straight days, while exchange reserves spiked.ETH could find support at the $2,355 and 100-day EMA convergence after breaching the 50-day EMA.
Ethereum (ETH) fell below $2,500 on Thursday, down nearly 4% and extending losses for a third consecutive day.
The decline follows rising Oil prices and US Treasury yields over the past few days. The 10Y Note Yield reached a 24-year high at 5.35%, and the 30Y Note Yield climbed above 5.70% earlier in the day, sparking major distributions in the crypto market. Yields eased to 5.23% and 5.60%, respectively, after President Trump noted in a Truth Social post that the US will not attack Iran "at any time prior" to the US midterm elections on November 3.
ETH sell-off intensifies as distribution climbs across all cohorts
Institutional and retail selling pressure has intensified following the latest developments.
US spot ETH exchange-traded funds (ETFs) have yet to see inflows this week after posting net outflows of $160.7 million on Wednesday, according to SoSoValue data. That marks seven consecutive days of net outflows worth roughly $565 million.
At the same time, the rate at which coins are flowing into exchanges has accelerated this week. Ethereum exchange reserves have ticked up by roughly 132K ETH since Monday. In the past two weeks, those figures have climbed to 233K ETH.
Historically, an increase in an asset's exchange reserves often coincides with increased selling pressure, as seen in ETH over the past few days.
The selling is likely distributed across all wallet cohorts. During the two weeks, whales or wallets with a balance of 10K-100K ETH have offloaded 151K ETH.
Retail investors or wallets holding 1K-10K ETH and 100-1K ETH depleted their collective balance by roughly 276K ETH.
On the derivatives side, Ethereum is leading the crypto market in liquidations, with $351.6 million in liquidated positions over the past 24 hours, per Coinglass data. Long and short liquidations accounted for $294.6 million and $57 million, respectively.
Ethereum technical outlook: ETH's next support is at $2,355 and 100-day EMA convergence
On the daily chart, ETH is retreating from last week’s highs and sitting back under the short-term Exponential Moving Averages. After declining below the 20- and 50-day EMAs at $2,631 and $2,502, price holds above the 100-day EMA at $2,338, which offers underlying trend support. The move hints at a neutral-to-bearish near-term tone.
The 14-day Relative Strength Index (RSI) at 37 leans toward weak momentum, while the Stochastic near 18 suggests oversold conditions that could slow further downside, rather than guarantee an immediate rebound.
On the downside, initial support appears at the horizontal level near $2,355, followed by the 100-day EMA. A daily close below this cluster would expose deeper floors at $2,204 and $1,972.
On the topside, immediate resistance is now located at the horizontal barrier at $2,548. Above this, a broader supply zone is formed by the 20-day EMA and the $2,636 horizontal level, before the $2,781 key hurdle.
Ethereum Price Forecast: ETH drops below $2,500 as rising Treasury yields trigger selling pressure
Ethereum price today: $2,470
Ethereum declined below $2,500 on Thursday following rising oil prices and US Treasury yields.ETH ETFs recorded $565 million in outflows over seven straight days, while exchange reserves spiked.ETH could find support at the $2,355 and 100-day EMA convergence after breaching the 50-day EMA.
Ethereum (ETH) fell below $2,500 on Thursday, down nearly 4% and extending losses for a third consecutive day.
The decline follows rising Oil prices and US Treasury yields over the past few days. The 10Y Note Yield reached a 24-year high at 5.35%, and the 30Y Note Yield climbed above 5.70% earlier in the day, sparking major distributions in the crypto market. Yields eased to 5.23% and 5.60%, respectively, after President Trump noted in a Truth Social post that the US will not attack Iran "at any time prior" to the US midterm elections on November 3.
ETH sell-off intensifies as distribution climbs across all cohorts
Institutional and retail selling pressure has intensified following the latest developments.
US spot ETH exchange-traded funds (ETFs) have yet to see inflows this week after posting net outflows of $160.7 million on Wednesday, according to SoSoValue data. That marks seven consecutive days of net outflows worth roughly $565 million.
At the same time, the rate at which coins are flowing into exchanges has accelerated this week. Ethereum exchange reserves have ticked up by roughly 132K ETH since Monday. In the past two weeks, those figures have climbed to 233K ETH.
Historically, an increase in an asset's exchange reserves often coincides with increased selling pressure, as seen in ETH over the past few days.
The selling is likely distributed across all wallet cohorts. During the two weeks, whales or wallets with a balance of 10K-100K ETH have offloaded 151K ETH.
Retail investors or wallets holding 1K-10K ETH and 100-1K ETH depleted their collective balance by roughly 276K ETH.
On the derivatives side, Ethereum is leading the crypto market in liquidations, with $351.6 million in liquidated positions over the past 24 hours, per Coinglass data. Long and short liquidations accounted for $294.6 million and $57 million, respectively.
Ethereum technical outlook: ETH's next support is at $2,355 and 100-day EMA convergence
On the daily chart, ETH is retreating from last week’s highs and sitting back under the short-term Exponential Moving Averages. After declining below the 20- and 50-day EMAs at $2,631 and $2,502, price holds above the 100-day EMA at $2,338, which offers underlying trend support. The move hints at a neutral-to-bearish near-term tone.
The 14-day Relative Strength Index (RSI) at 37 leans toward weak momentum, while the Stochastic near 18 suggests oversold conditions that could slow further downside, rather than guarantee an immediate rebound.
On the downside, initial support appears at the horizontal level near $2,355, followed by the 100-day EMA. A daily close below this cluster would expose deeper floors at $2,204 and $1,972.
On the topside, immediate resistance is now located at the horizontal barrier at $2,548. Above this, a broader supply zone is formed by the 20-day EMA and the $2,636 horizontal level, before the $2,781 key hurdle.
Ethereum declined below $2,500 on Thursday following rising oil prices and US Treasury yields.ETH ETFs recorded $565 million in outflows over seven straight days, while exchange reserves spiked.ETH could find support at the $2,355 and 100-day EMA convergence after breaching the 50-day EMA.
Ethereum (ETH) fell below $2,500 on Thursday, down nearly 4% and extending losses for a third consecutive day.
The decline follows rising Oil prices and US Treasury yields over the past few days. The 10Y Note Yield reached a 24-year high at 5.35%, and the 30Y Note Yield climbed above 5.70% earlier in the day, sparking major distributions in the crypto market. Yields eased to 5.23% and 5.60%, respectively, after President Trump noted in a Truth Social post that the US will not attack Iran "at any time prior" to the US midterm elections on November 3.
ETH sell-off intensifies as distribution climbs across all cohorts
Institutional and retail selling pressure has intensified following the latest developments.
US spot ETH exchange-traded funds (ETFs) have yet to see inflows this week after posting net outflows of $160.7 million on Wednesday, according to SoSoValue data. That marks seven consecutive days of net outflows worth roughly $565 million.
At the same time, the rate at which coins are flowing into exchanges has accelerated this week. Ethereum exchange reserves have ticked up by roughly 132K ETH since Monday. In the past two weeks, those figures have climbed to 233K ETH.
Historically, an increase in an asset's exchange reserves often coincides with increased selling pressure, as seen in ETH over the past few days.
The selling is likely distributed across all wallet cohorts. During the two weeks, whales or wallets with a balance of 10K-100K ETH have offloaded 151K ETH.
Retail investors or wallets holding 1K-10K ETH and 100-1K ETH depleted their collective balance by roughly 276K ETH.
On the derivatives side, Ethereum is leading the crypto market in liquidations, with $351.6 million in liquidated positions over the past 24 hours, per Coinglass data. Long and short liquidations accounted for $294.6 million and $57 million, respectively.
Ethereum technical outlook: ETH's next support is at $2,355 and 100-day EMA convergence
On the daily chart, ETH is retreating from last week’s highs and sitting back under the short-term Exponential Moving Averages. After declining below the 20- and 50-day EMAs at $2,631 and $2,502, price holds above the 100-day EMA at $2,338, which offers underlying trend support. The move hints at a neutral-to-bearish near-term tone.
The 14-day Relative Strength Index (RSI) at 37 leans toward weak momentum, while the Stochastic near 18 suggests oversold conditions that could slow further downside, rather than guarantee an immediate rebound.
On the downside, initial support appears at the horizontal level near $2,355, followed by the 100-day EMA. A daily close below this cluster would expose deeper floors at $2,204 and $1,972.
On the topside, immediate resistance is now located at the horizontal barrier at $2,548. Above this, a broader supply zone is formed by the 20-day EMA and the $2,636 horizontal level, before the $2,781 key hurdle.
57
·
--
ලිපිය
Crypto Today: Bitcoin, Ethereum and XRP stabilize as bulls seek fresh reboundBitcoin trades above $82,000, signaling stability and attempts to recover after a week-long correction.Ethereum ticks up as bulls eye the 50-day EMA as short-term support for recovery above $2,500.XRP rises and reclaims the $1.40 support level despite a firm MACD sell signal.
Cryptocurrency prices hold broadly stable on Friday, as Bitcoin (BTC) attempts to rise above the reclaimed $82,000 level. Ethereum (ETH) sits above the pivotal $2,500 level while Ripple (XRP) edges up after reclaiming the $1.40 level as support.
Crypto market sentiment softens
The sell-off in the crypto market this week was largely driven by macroeconomic headwinds, geopolitical tensions in the Middle East amid elevated Oil and Energy prices, and overleveraged long positions. Bitcoin declined from highs near $87,000, testing support at $80,000 on Thursday.
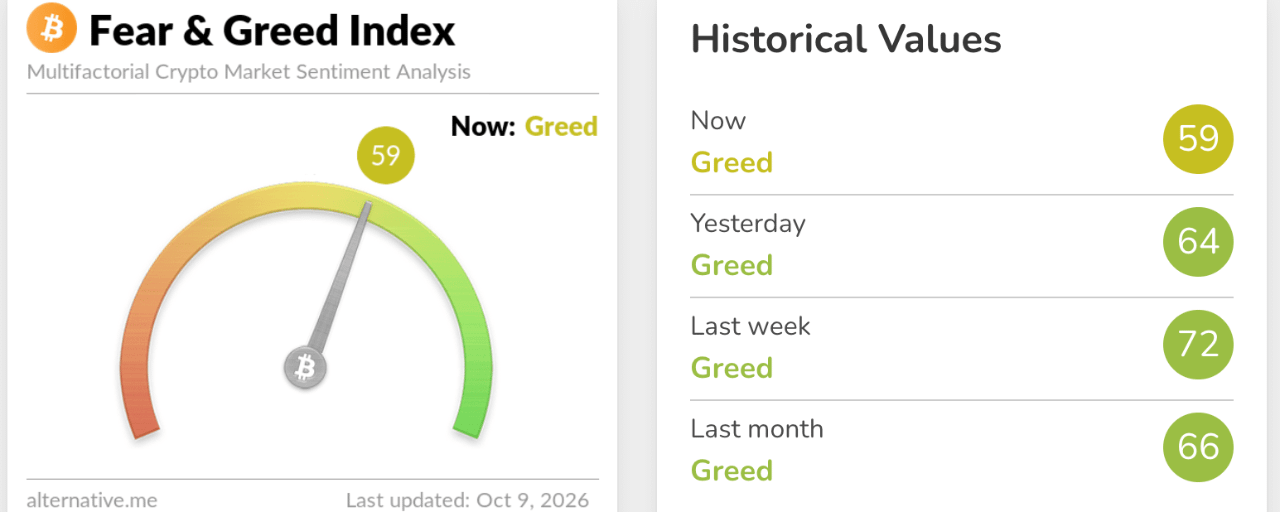
The correction appeared to align with softening demand for crypto assets, as reflected in the Fear & Greed Index at 59 in the Greed territory on Friday, down from 64 the day before. Broadly, the index has retreated from levels at 72 last week and 66 last month.
The Federal Open Market Committee (FOMC) Minutes showed that most officials still expect another rate hike by year-end despite odds of raising rates in October falling below 20%.
Crypto Finance said in an emailed analysis report that “BTC's push toward $87,000 failed and ETH slipped below $2,500. Spot BTC Exchange-Traded Funds (ETFs) shed roughly $700 million from Monday to Thursday, with Wednesday's $487 million the heaviest day of the month, while ETH ETFs lost $486 million, extending a streak that began on 29 September.”
Despite the ongoing recovery, headwinds from capital outflows, macroeconomic uncertainty and geopolitical tensions will likely continue to weigh on market sentiment. Recoveries could be capped, allowing consolidation, especially as demand at $80,000 holds.
Technical analysis: Bitcoin reclaims $82,000 support
Bitcoin has risen above $82,000 as bulls return following this week's sustained sell-off. The largest crypto by market capitalization shows signs of a potential recovery despite facing key psychological resistance levels, as observed on the daily chart.
Moreover, BTC holds well above the 50-day, 100-day and 200-day Exponential Moving Averages (EMAs), which collectively suggest a constructive bullish backdrop. Price also remains above the SuperTrend line at $79,664, reinforcing underlying demand, while the Moving Average Convergence Divergence (MACD) histogram stays negative and the Relative Strength Index (RSI) hovers around the neutral 50 mark, hinting that upside momentum is currently modest rather than impulsive.
Initial support is seen in the $79,700-$79,800 area, where the SuperTrend and the 50-day EMA form a nearby demand cluster just below spot, followed by the 100-day EMA at $75,968 and the 200-day EMA at $75,265 as deeper trend supports. With no immediate technical resistance levels above the market on the daily chart, the pair would likely need a clear uptick in momentum to extend the advance. Still, a daily close back below the $82,000 zone would start to erode the current bullish bias and expose the next EMA supports lower.
Altcoins technical analysis: Ethereum and XRP defend key demand levels
Ethereum bulls are attempting an upward correction from the sharp sell-off from weekly highs of $2,735. The smart contract token holds above $2,500, seeking steady support to help build momentum. The pair maintains a constructive near-term bias as price sits above the 50-day, 100-day and 200-day EMA curves at $2,503, $2,340 and $2,299, respectively.
This alignment of short- and longer-term EMAs suggests underlying demand, although momentum is mixed, with the MACD below zero and deepening in negative territory while the RSI cools toward the 40 area, hinting at a consolidative rather than impulsive phase.
Immediate support is the 50-day EMA at $2,503, with additional demand at the 100-day EMA near $2,340 and the 200-day EMA around $2,299 if selling extends. On the topside, the SuperTrend line at $2,753 is the next notable resistance, and a clear break above this dynamic barrier would likely reopen the path toward recent highs, while failure to reclaim it keeps ETH in a range anchored by the clustered moving-average support below.
XRP, meanwhile, sits above a solid technical structure, raising recovery odds. The token hovers above $1.40, up from weekly lows near $1.30. Despite the headwinds, XRP is holding a constructive near-term tone as it remains above the key moving averages.
Price is trading above the 50-day EMA near $1.40, the 200-day EMA at $1.38, and the 100-day EMA at $1.34, while the SuperTrend indicator at $1.30 reinforces underlying support. However, momentum is soft, with the RSI hovering near 44 and the MACD below zero, suggesting that the bullish bias is supported by structure rather than by strong upside momentum.
The first support level is the 50-day EMA near $1.40, followed by the 200-day EMA at $1.38. Deeper pullbacks would look toward the 100-day EMA at $1.34 and the SuperTrend line at $1.30 as broader trend support. On the topside, the next notable resistance looms at the downward resistance trendline break price around $1.64, and a daily close above this barrier would be needed to open a more extended bullish phase.
Crypto Today: Bitcoin, Ethereum and XRP stabilize as bulls seek fresh rebound
Bitcoin trades above $82,000, signaling stability and attempts to recover after a week-long correction.Ethereum ticks up as bulls eye the 50-day EMA as short-term support for recovery above $2,500.XRP rises and reclaims the $1.40 support level despite a firm MACD sell signal.
Cryptocurrency prices hold broadly stable on Friday, as Bitcoin (BTC) attempts to rise above the reclaimed $82,000 level. Ethereum (ETH) sits above the pivotal $2,500 level while Ripple (XRP) edges up after reclaiming the $1.40 level as support.
Crypto market sentiment softens
The sell-off in the crypto market this week was largely driven by macroeconomic headwinds, geopolitical tensions in the Middle East amid elevated Oil and Energy prices, and overleveraged long positions. Bitcoin declined from highs near $87,000, testing support at $80,000 on Thursday.
The correction appeared to align with softening demand for crypto assets, as reflected in the Fear & Greed Index at 59 in the Greed territory on Friday, down from 64 the day before. Broadly, the index has retreated from levels at 72 last week and 66 last month.
The Federal Open Market Committee (FOMC) Minutes showed that most officials still expect another rate hike by year-end despite odds of raising rates in October falling below 20%.
Crypto Finance said in an emailed analysis report that “BTC's push toward $87,000 failed and ETH slipped below $2,500. Spot BTC Exchange-Traded Funds (ETFs) shed roughly $700 million from Monday to Thursday, with Wednesday's $487 million the heaviest day of the month, while ETH ETFs lost $486 million, extending a streak that began on 29 September.”
Despite the ongoing recovery, headwinds from capital outflows, macroeconomic uncertainty and geopolitical tensions will likely continue to weigh on market sentiment. Recoveries could be capped, allowing consolidation, especially as demand at $80,000 holds.
Technical analysis: Bitcoin reclaims $82,000 support
Bitcoin has risen above $82,000 as bulls return following this week's sustained sell-off. The largest crypto by market capitalization shows signs of a potential recovery despite facing key psychological resistance levels, as observed on the daily chart.
Moreover, BTC holds well above the 50-day, 100-day and 200-day Exponential Moving Averages (EMAs), which collectively suggest a constructive bullish backdrop. Price also remains above the SuperTrend line at $79,664, reinforcing underlying demand, while the Moving Average Convergence Divergence (MACD) histogram stays negative and the Relative Strength Index (RSI) hovers around the neutral 50 mark, hinting that upside momentum is currently modest rather than impulsive.
Initial support is seen in the $79,700-$79,800 area, where the SuperTrend and the 50-day EMA form a nearby demand cluster just below spot, followed by the 100-day EMA at $75,968 and the 200-day EMA at $75,265 as deeper trend supports. With no immediate technical resistance levels above the market on the daily chart, the pair would likely need a clear uptick in momentum to extend the advance. Still, a daily close back below the $82,000 zone would start to erode the current bullish bias and expose the next EMA supports lower.
Altcoins technical analysis: Ethereum and XRP defend key demand levels
Ethereum bulls are attempting an upward correction from the sharp sell-off from weekly highs of $2,735. The smart contract token holds above $2,500, seeking steady support to help build momentum. The pair maintains a constructive near-term bias as price sits above the 50-day, 100-day and 200-day EMA curves at $2,503, $2,340 and $2,299, respectively.
This alignment of short- and longer-term EMAs suggests underlying demand, although momentum is mixed, with the MACD below zero and deepening in negative territory while the RSI cools toward the 40 area, hinting at a consolidative rather than impulsive phase.
Immediate support is the 50-day EMA at $2,503, with additional demand at the 100-day EMA near $2,340 and the 200-day EMA around $2,299 if selling extends. On the topside, the SuperTrend line at $2,753 is the next notable resistance, and a clear break above this dynamic barrier would likely reopen the path toward recent highs, while failure to reclaim it keeps ETH in a range anchored by the clustered moving-average support below.
XRP, meanwhile, sits above a solid technical structure, raising recovery odds. The token hovers above $1.40, up from weekly lows near $1.30. Despite the headwinds, XRP is holding a constructive near-term tone as it remains above the key moving averages.
Price is trading above the 50-day EMA near $1.40, the 200-day EMA at $1.38, and the 100-day EMA at $1.34, while the SuperTrend indicator at $1.30 reinforces underlying support. However, momentum is soft, with the RSI hovering near 44 and the MACD below zero, suggesting that the bullish bias is supported by structure rather than by strong upside momentum.
The first support level is the 50-day EMA near $1.40, followed by the 200-day EMA at $1.38. Deeper pullbacks would look toward the 100-day EMA at $1.34 and the SuperTrend line at $1.30 as broader trend support. On the topside, the next notable resistance looms at the downward resistance trendline break price around $1.64, and a daily close above this barrier would be needed to open a more extended bullish phase.
Cryptocurrency prices hold broadly stable on Friday, as Bitcoin (BTC) attempts to rise above the reclaimed $82,000 level. Ethereum (ETH) sits above the pivotal $2,500 level while Ripple (XRP) edges up after reclaiming the $1.40 level as support.
Crypto market sentiment softens
The sell-off in the crypto market this week was largely driven by macroeconomic headwinds, geopolitical tensions in the Middle East amid elevated Oil and Energy prices, and overleveraged long positions. Bitcoin declined from highs near $87,000, testing support at $80,000 on Thursday.
The correction appeared to align with softening demand for crypto assets, as reflected in the Fear & Greed Index at 59 in the Greed territory on Friday, down from 64 the day before. Broadly, the index has retreated from levels at 72 last week and 66 last month.
The Federal Open Market Committee (FOMC) Minutes showed that most officials still expect another rate hike by year-end despite odds of raising rates in October falling below 20%.
Crypto Finance said in an emailed analysis report that “BTC's push toward $87,000 failed and ETH slipped below $2,500. Spot BTC Exchange-Traded Funds (ETFs) shed roughly $700 million from Monday to Thursday, with Wednesday's $487 million the heaviest day of the month, while ETH ETFs lost $486 million, extending a streak that began on 29 September.”
Despite the ongoing recovery, headwinds from capital outflows, macroeconomic uncertainty and geopolitical tensions will likely continue to weigh on market sentiment. Recoveries could be capped, allowing consolidation, especially as demand at $80,000 holds.
Technical analysis: Bitcoin reclaims $82,000 support
Bitcoin has risen above $82,000 as bulls return following this week's sustained sell-off. The largest crypto by market capitalization shows signs of a potential recovery despite facing key psychological resistance levels, as observed on the daily chart.
Moreover, BTC holds well above the 50-day, 100-day and 200-day Exponential Moving Averages (EMAs), which collectively suggest a constructive bullish backdrop. Price also remains above the SuperTrend line at $79,664, reinforcing underlying demand, while the Moving Average Convergence Divergence (MACD) histogram stays negative and the Relative Strength Index (RSI) hovers around the neutral 50 mark, hinting that upside momentum is currently modest rather than impulsive.
Initial support is seen in the $79,700-$79,800 area, where the SuperTrend and the 50-day EMA form a nearby demand cluster just below spot, followed by the 100-day EMA at $75,968 and the 200-day EMA at $75,265 as deeper trend supports. With no immediate technical resistance levels above the market on the daily chart, the pair would likely need a clear uptick in momentum to extend the advance. Still, a daily close back below the $82,000 zone would start to erode the current bullish bias and expose the next EMA supports lower.
Altcoins technical analysis: Ethereum and XRP defend key demand levels
Ethereum bulls are attempting an upward correction from the sharp sell-off from weekly highs of $2,735. The smart contract token holds above $2,500, seeking steady support to help build momentum. The pair maintains a constructive near-term bias as price sits above the 50-day, 100-day and 200-day EMA curves at $2,503, $2,340 and $2,299, respectively.
This alignment of short- and longer-term EMAs suggests underlying demand, although momentum is mixed, with the MACD below zero and deepening in negative territory while the RSI cools toward the 40 area, hinting at a consolidative rather than impulsive phase.
Immediate support is the 50-day EMA at $2,503, with additional demand at the 100-day EMA near $2,340 and the 200-day EMA around $2,299 if selling extends. On the topside, the SuperTrend line at $2,753 is the next notable resistance, and a clear break above this dynamic barrier would likely reopen the path toward recent highs, while failure to reclaim it keeps ETH in a range anchored by the clustered moving-average support below.
XRP, meanwhile, sits above a solid technical structure, raising recovery odds. The token hovers above $1.40, up from weekly lows near $1.30. Despite the headwinds, XRP is holding a constructive near-term tone as it remains above the key moving averages.
Price is trading above the 50-day EMA near $1.40, the 200-day EMA at $1.38, and the 100-day EMA at $1.34, while the SuperTrend indicator at $1.30 reinforces underlying support. However, momentum is soft, with the RSI hovering near 44 and the MACD below zero, suggesting that the bullish bias is supported by structure rather than by strong upside momentum.
The first support level is the 50-day EMA near $1.40, followed by the 200-day EMA at $1.38. Deeper pullbacks would look toward the 100-day EMA at $1.34 and the SuperTrend line at $1.30 as broader trend support. On the topside, the next notable resistance looms at the downward resistance trendline break price around $1.64, and a daily close above this barrier would be needed to open a more extended bullish phase.
118
·
--
Crypto crumbles as anniversary of flash crash nears
It was October 10, 2025, when bitcoin plunged from about $122,000 to $105,000, with much of the decline occurring within minutes.
Crypto crumbles as anniversary of flash crash nears
It was October 10, 2025, when bitcoin plunged from about $122,000 to $105,000, with much of the decline occurring within minutes.
It was October 10, 2025, when bitcoin plunged from about $122,000 to $105,000, with much of the decline occurring within minutes.
88
·
--
සත්යායනය කළ
Important Ripple News and XRP Price Update: October 8XRP was predicted to break out this week, but the actual move is quite disappointing for the bulls.
The past week or so has been quite eventful for the broader Ripple and XRP ecosystem, with new partnerships and developments concerning both the company and the underlying asset behind it.
We will review the key points in this article and outline some reasons behind the native token’s price slump.
Big Win on Wall Street, Another in Korea
But before we dive into XRP’s price moves, let’s examine some of the big news coming this week. Ripple strengthened its partnership with the Wall Street giant Brevan Howard by enhancing access to multi-asset prime brokerage amid rising demand and integrated investment infrastructure.
Ripple Prime will streamline operations for the Wall Street entity across several asset classes, including traditional and crypto, to improve capital efficiency. The collaboration follows Ripple’s $500 million investment round in 2025, in which Brevan Howard was among the participants, marking a significant evolution in their relationship post-SEC settlement.
The second piece of major macro news comes from the other side of the world, South Korea. Meritz Securities partnered with Ripple to improve its digital asset infrastructure in the country, focusing on custody and tokenization. The agreement aims to align with the evolving local market and regulatory landscape and follows Ripple’s broader expansion in Korea, including deals with K Bank and Kyobo Life Insurance.
Important Ripple News and XRP Price Update: October 8
XRP was predicted to break out this week, but the actual move is quite disappointing for the bulls.
The past week or so has been quite eventful for the broader Ripple and XRP ecosystem, with new partnerships and developments concerning both the company and the underlying asset behind it.
We will review the key points in this article and outline some reasons behind the native token’s price slump.
Big Win on Wall Street, Another in Korea
But before we dive into XRP’s price moves, let’s examine some of the big news coming this week. Ripple strengthened its partnership with the Wall Street giant Brevan Howard by enhancing access to multi-asset prime brokerage amid rising demand and integrated investment infrastructure.
Ripple Prime will streamline operations for the Wall Street entity across several asset classes, including traditional and crypto, to improve capital efficiency. The collaboration follows Ripple’s $500 million investment round in 2025, in which Brevan Howard was among the participants, marking a significant evolution in their relationship post-SEC settlement.
The second piece of major macro news comes from the other side of the world, South Korea. Meritz Securities partnered with Ripple to improve its digital asset infrastructure in the country, focusing on custody and tokenization. The agreement aims to align with the evolving local market and regulatory landscape and follows Ripple’s broader expansion in Korea, including deals with K Bank and Kyobo Life Insurance.
The past week or so has been quite eventful for the broader Ripple and XRP ecosystem, with new partnerships and developments concerning both the company and the underlying asset behind it.
We will review the key points in this article and outline some reasons behind the native token’s price slump.
Big Win on Wall Street, Another in Korea
But before we dive into XRP’s price moves, let’s examine some of the big news coming this week. Ripple strengthened its partnership with the Wall Street giant Brevan Howard by enhancing access to multi-asset prime brokerage amid rising demand and integrated investment infrastructure.
Ripple Prime will streamline operations for the Wall Street entity across several asset classes, including traditional and crypto, to improve capital efficiency. The collaboration follows Ripple’s $500 million investment round in 2025, in which Brevan Howard was among the participants, marking a significant evolution in their relationship post-SEC settlement.
The second piece of major macro news comes from the other side of the world, South Korea. Meritz Securities partnered with Ripple to improve its digital asset infrastructure in the country, focusing on custody and tokenization. The agreement aims to align with the evolving local market and regulatory landscape and follows Ripple’s broader expansion in Korea, including deals with K Bank and Kyobo Life Insurance.
5
1.3k
·
--
Why Is Crypto Down Today? Bitcoin Falls Below $83K as $550M in Bets Get Wiped OutBitcoin fell below $83,000 as the crypto assets sell-off intensified on Monday. Increasing oil prices, rising Treasury yields, a strong dollar, and leveraged positions also contributed to the risk assets’ bearish price action.
Why Is Crypto Down Today?
Several bearish forces are impacting crypto on the same day. Geopolitical risks have grown, oil prices remain elevated, and US bond yields continue to cause competition for risk assets.
Higher yields make cash and government debt relatively more attractive. That environment can reduce demand for speculative assets, including cryptocurrencies. Bitcoin also entered the session with weak technical momentum. Buyers repeatedly failed to push the market through important resistance near $87,000.
Once support levels began to break, leveraged traders accelerated the decline. Liquidations then turned an ordinary pullback into a much sharper intra-day move. For anyone asking why crypto is crashing, macroeconomic pressure only explains part of the story. Weak technical structure and excessive leverage have made the market especially vulnerable.
Bitcoin Falls Below $83,000 as Crypto Sell-Off Accelerates
Bitcoin declined below $83,000 as selling intensified across the broader market. The move wiped out another important short-term support area. The latest Bitcoin price action today shows a clear loss of momentum
had previously attempted to stabilize above $85,000 but failed.
Sellers became more aggressive after Bitcoin slipped through intermediate support. That decline encouraged short-term traders to reduce exposure. Momentum worsened once BTC approached the $83,000 region. Leveraged long positions began closing automatically as collateral levels fell.
Bitcoin remains the largest crypto asset and is usually the direction setter for the market. Its weakness therefore quickly spread into Ethereum and major altcoins. A sustained move below $83,000 would increase attention around lower support zones. Buyers now need to regain control quickly to prevent further deterioration.
Ethereum, XRP and Solana Lead Losses Across the Crypto Market
Altcoins suffered even larger percentage declines as Bitcoin weakened. Ethereum, XRP, and Solana all faced heavy selling during the broader retreat. The Ethereum price today reflects reduced demand for higher-risk crypto exposure.
often experiences stronger percentage swings when Bitcoin volatility increases.
XRP also came under pressure as traders decreased leveraged positions. The XRP price today remains closely tied to broader market risk sentiment. Solana faced similar conditions as traders often treat.
as a higher-beta alternative to Bitcoin. Falling Bitcoin prices therefore create additional pressure across Solana markets.
The result is a classic risk-off rotation. Investors first reduce exposure in smaller assets before reassessing their Bitcoin position.
Why Is Crypto Down Today? Bitcoin Falls Below $83K as $550M in Bets Get Wiped Out
Bitcoin fell below $83,000 as the crypto assets sell-off intensified on Monday. Increasing oil prices, rising Treasury yields, a strong dollar, and leveraged positions also contributed to the risk assets’ bearish price action.
Why Is Crypto Down Today?
Several bearish forces are impacting crypto on the same day. Geopolitical risks have grown, oil prices remain elevated, and US bond yields continue to cause competition for risk assets.
Higher yields make cash and government debt relatively more attractive. That environment can reduce demand for speculative assets, including cryptocurrencies. Bitcoin also entered the session with weak technical momentum. Buyers repeatedly failed to push the market through important resistance near $87,000.
Once support levels began to break, leveraged traders accelerated the decline. Liquidations then turned an ordinary pullback into a much sharper intra-day move. For anyone asking why crypto is crashing, macroeconomic pressure only explains part of the story. Weak technical structure and excessive leverage have made the market especially vulnerable.
Bitcoin Falls Below $83,000 as Crypto Sell-Off Accelerates
Bitcoin declined below $83,000 as selling intensified across the broader market. The move wiped out another important short-term support area. The latest Bitcoin price action today shows a clear loss of momentum
had previously attempted to stabilize above $85,000 but failed.
Sellers became more aggressive after Bitcoin slipped through intermediate support. That decline encouraged short-term traders to reduce exposure. Momentum worsened once BTC approached the $83,000 region. Leveraged long positions began closing automatically as collateral levels fell.
Bitcoin remains the largest crypto asset and is usually the direction setter for the market. Its weakness therefore quickly spread into Ethereum and major altcoins. A sustained move below $83,000 would increase attention around lower support zones. Buyers now need to regain control quickly to prevent further deterioration.
Ethereum, XRP and Solana Lead Losses Across the Crypto Market
Altcoins suffered even larger percentage declines as Bitcoin weakened. Ethereum, XRP, and Solana all faced heavy selling during the broader retreat. The Ethereum price today reflects reduced demand for higher-risk crypto exposure.
often experiences stronger percentage swings when Bitcoin volatility increases.
XRP also came under pressure as traders decreased leveraged positions. The XRP price today remains closely tied to broader market risk sentiment. Solana faced similar conditions as traders often treat.
as a higher-beta alternative to Bitcoin. Falling Bitcoin prices therefore create additional pressure across Solana markets.
The result is a classic risk-off rotation. Investors first reduce exposure in smaller assets before reassessing their Bitcoin position.
Why Is Crypto Down Today?
Several bearish forces are impacting crypto on the same day. Geopolitical risks have grown, oil prices remain elevated, and US bond yields continue to cause competition for risk assets.
Higher yields make cash and government debt relatively more attractive. That environment can reduce demand for speculative assets, including cryptocurrencies. Bitcoin also entered the session with weak technical momentum. Buyers repeatedly failed to push the market through important resistance near $87,000.
Once support levels began to break, leveraged traders accelerated the decline. Liquidations then turned an ordinary pullback into a much sharper intra-day move. For anyone asking why crypto is crashing, macroeconomic pressure only explains part of the story. Weak technical structure and excessive leverage have made the market especially vulnerable.
Bitcoin Falls Below $83,000 as Crypto Sell-Off Accelerates
Bitcoin declined below $83,000 as selling intensified across the broader market. The move wiped out another important short-term support area. The latest Bitcoin price action today shows a clear loss of momentum
had previously attempted to stabilize above $85,000 but failed.
Sellers became more aggressive after Bitcoin slipped through intermediate support. That decline encouraged short-term traders to reduce exposure. Momentum worsened once BTC approached the $83,000 region. Leveraged long positions began closing automatically as collateral levels fell.
Bitcoin remains the largest crypto asset and is usually the direction setter for the market. Its weakness therefore quickly spread into Ethereum and major altcoins. A sustained move below $83,000 would increase attention around lower support zones. Buyers now need to regain control quickly to prevent further deterioration.
Ethereum, XRP and Solana Lead Losses Across the Crypto Market
Altcoins suffered even larger percentage declines as Bitcoin weakened. Ethereum, XRP, and Solana all faced heavy selling during the broader retreat. The Ethereum price today reflects reduced demand for higher-risk crypto exposure.
often experiences stronger percentage swings when Bitcoin volatility increases.
XRP also came under pressure as traders decreased leveraged positions. The XRP price today remains closely tied to broader market risk sentiment. Solana faced similar conditions as traders often treat.
as a higher-beta alternative to Bitcoin. Falling Bitcoin prices therefore create additional pressure across Solana markets.
The result is a classic risk-off rotation. Investors first reduce exposure in smaller assets before reassessing their Bitcoin position.
149
·
--
Trump bought up to $25 million in Meta and millions in SpaceX debt in AugustPresident Donald Trump disclosed more than 500 securities transactions in August, including a purchase of up to $25 million in Meta stock and an investment of as much as $5 million in SpaceX debt two days before he signed a sweeping policy aimed at expanding U.S. commercial space transportation, according to a newly released financial disclosure.
The 517 purchases and sales totaled roughly $74.3 million to $273.3 million, according to a CNBC analysis of Trump’s August financial disclosure, which reports each item in a range of value. Purchases accounted for at least $44.2 million and sales at least $30.1 million, CNBC calculated.
The 18-page filing shows Trump’s portfolio remained highly active, even as trading slowed from June and July, when he disclosed more than 1,000 transactions in each month.
The largest transaction was an Aug. 21 purchase of between $5 million and $25 million in Meta shares, amid a broader portfolio reshuffling that day. Trump also reported buying between $1 million and $5 million each of AT&T, ConocoPhillips, Abbott Laboratories, Netflix and Chevron the same day.
On the sell side, on Aug. 21, he unloaded between $1 million and $5 million each of Advanced Micro Devices and Church & Dwight, along with stakes worth between $500,001 and $1 million in companies including Boeing, Home Depot, T-Mobile, Datadog, Dell Technologies, Palo Alto Networks and Nvidia.
The filing also shows a sizable new investment in SpaceX.
On Aug. 18, Trump’s accounts purchased between $1 million and $5 million in senior unsecured notes issued by Elon Musk’s rocket and satellite company, carrying a 5.35% interest rate and maturing in July 2031.
Two days later, Trump signed a national space transportation policy calling for the U.S. to support more than 1,000 launches and reentries annually by 2030. The policy directs federal agencies to facilitate commercial access to federal launch facilities and encourage private investment and public-private partnerships in space infrastructure.
SpaceX is a major Pentagon contractor and NASA launch provider, putting it in a prime position to benefit from policies aimed at expanding the U.S. commercial launch market.
Trump had already invested in SpaceX, but on a far smaller scale, buying $15,001 to $50,000 in shares in both June — the month of its IPO — and July and selling $1,001 to $15,000 in July.
The White House and SpaceX did not immediately respond to CNBC’s requests for comment.
The White House has repeatedly defended the activity, saying independent advisors manage the portfolio without input from Trump or his family. Recent presidents, by contrast, have generally divested individual stocks or relied on blind trusts or diversified funds to avoid potential conflicts.
The new filing does not reveal the precise size of Trump’s investments because federal disclosures report transactions in broad value ranges rather than exact amounts. But heavy trading has become a hallmark of Trump’s second term.
His 2025 annual financial disclosure showed more than 21,000 securities trades across eight accounts holding at least $858 million, compared with just 86 stock transactions disclosed during his first year in office in 2017.
The August disclosure also shows continued investments across some of the country’s largest publicly traded companies. Trump reported purchases of between $1 million and $5 million each in Microsoft, McDonald’s and Comcast on Aug. 10
Later, on Aug. 26, Trump’s portfolio bought between $15,001 and $50,000 of Tyson Foods on the same day he signed a proclamation temporarily expanding low-tariff imports of lean beef trimmings by 300,000 metric tons.
The move, aimed at easing elevated beef prices, took effect Sept. 1 for up to 90 days. Trump had signaled plans to address beef prices before the Tyson trade, and the disclosure does not show whether the Tyson purchase came before or after he signed the proclamation.
Trump’s account also continued buying municipal debt, a pattern that has emerged repeatedly in his disclosures. The August filing includes dozens of municipal securities tied to state and local governments, schools, hospitals, housing authorities and other public entities.
Trump bought up to $25 million in Meta and millions in SpaceX debt in August
President Donald Trump disclosed more than 500 securities transactions in August, including a purchase of up to $25 million in Meta stock and an investment of as much as $5 million in SpaceX debt two days before he signed a sweeping policy aimed at expanding U.S. commercial space transportation, according to a newly released financial disclosure.
The 517 purchases and sales totaled roughly $74.3 million to $273.3 million, according to a CNBC analysis of Trump’s August financial disclosure, which reports each item in a range of value. Purchases accounted for at least $44.2 million and sales at least $30.1 million, CNBC calculated.
The 18-page filing shows Trump’s portfolio remained highly active, even as trading slowed from June and July, when he disclosed more than 1,000 transactions in each month.
The largest transaction was an Aug. 21 purchase of between $5 million and $25 million in Meta shares, amid a broader portfolio reshuffling that day. Trump also reported buying between $1 million and $5 million each of AT&T, ConocoPhillips, Abbott Laboratories, Netflix and Chevron the same day.
On the sell side, on Aug. 21, he unloaded between $1 million and $5 million each of Advanced Micro Devices and Church & Dwight, along with stakes worth between $500,001 and $1 million in companies including Boeing, Home Depot, T-Mobile, Datadog, Dell Technologies, Palo Alto Networks and Nvidia.
The filing also shows a sizable new investment in SpaceX.
On Aug. 18, Trump’s accounts purchased between $1 million and $5 million in senior unsecured notes issued by Elon Musk’s rocket and satellite company, carrying a 5.35% interest rate and maturing in July 2031.
Two days later, Trump signed a national space transportation policy calling for the U.S. to support more than 1,000 launches and reentries annually by 2030. The policy directs federal agencies to facilitate commercial access to federal launch facilities and encourage private investment and public-private partnerships in space infrastructure.
SpaceX is a major Pentagon contractor and NASA launch provider, putting it in a prime position to benefit from policies aimed at expanding the U.S. commercial launch market.
Trump had already invested in SpaceX, but on a far smaller scale, buying $15,001 to $50,000 in shares in both June — the month of its IPO — and July and selling $1,001 to $15,000 in July.
The White House and SpaceX did not immediately respond to CNBC’s requests for comment.
The White House has repeatedly defended the activity, saying independent advisors manage the portfolio without input from Trump or his family. Recent presidents, by contrast, have generally divested individual stocks or relied on blind trusts or diversified funds to avoid potential conflicts.
The new filing does not reveal the precise size of Trump’s investments because federal disclosures report transactions in broad value ranges rather than exact amounts. But heavy trading has become a hallmark of Trump’s second term.
His 2025 annual financial disclosure showed more than 21,000 securities trades across eight accounts holding at least $858 million, compared with just 86 stock transactions disclosed during his first year in office in 2017.
The August disclosure also shows continued investments across some of the country’s largest publicly traded companies. Trump reported purchases of between $1 million and $5 million each in Microsoft, McDonald’s and Comcast on Aug. 10
Later, on Aug. 26, Trump’s portfolio bought between $15,001 and $50,000 of Tyson Foods on the same day he signed a proclamation temporarily expanding low-tariff imports of lean beef trimmings by 300,000 metric tons.
The move, aimed at easing elevated beef prices, took effect Sept. 1 for up to 90 days. Trump had signaled plans to address beef prices before the Tyson trade, and the disclosure does not show whether the Tyson purchase came before or after he signed the proclamation.
Trump’s account also continued buying municipal debt, a pattern that has emerged repeatedly in his disclosures. The August filing includes dozens of municipal securities tied to state and local governments, schools, hospitals, housing authorities and other public entities.
The 517 purchases and sales totaled roughly $74.3 million to $273.3 million, according to a CNBC analysis of Trump’s August financial disclosure, which reports each item in a range of value. Purchases accounted for at least $44.2 million and sales at least $30.1 million, CNBC calculated.
The 18-page filing shows Trump’s portfolio remained highly active, even as trading slowed from June and July, when he disclosed more than 1,000 transactions in each month.
The largest transaction was an Aug. 21 purchase of between $5 million and $25 million in Meta shares, amid a broader portfolio reshuffling that day. Trump also reported buying between $1 million and $5 million each of AT&T, ConocoPhillips, Abbott Laboratories, Netflix and Chevron the same day.
On the sell side, on Aug. 21, he unloaded between $1 million and $5 million each of Advanced Micro Devices and Church & Dwight, along with stakes worth between $500,001 and $1 million in companies including Boeing, Home Depot, T-Mobile, Datadog, Dell Technologies, Palo Alto Networks and Nvidia.
The filing also shows a sizable new investment in SpaceX.
On Aug. 18, Trump’s accounts purchased between $1 million and $5 million in senior unsecured notes issued by Elon Musk’s rocket and satellite company, carrying a 5.35% interest rate and maturing in July 2031.
Two days later, Trump signed a national space transportation policy calling for the U.S. to support more than 1,000 launches and reentries annually by 2030. The policy directs federal agencies to facilitate commercial access to federal launch facilities and encourage private investment and public-private partnerships in space infrastructure.
SpaceX is a major Pentagon contractor and NASA launch provider, putting it in a prime position to benefit from policies aimed at expanding the U.S. commercial launch market.
Trump had already invested in SpaceX, but on a far smaller scale, buying $15,001 to $50,000 in shares in both June — the month of its IPO — and July and selling $1,001 to $15,000 in July.
The White House and SpaceX did not immediately respond to CNBC’s requests for comment.
The White House has repeatedly defended the activity, saying independent advisors manage the portfolio without input from Trump or his family. Recent presidents, by contrast, have generally divested individual stocks or relied on blind trusts or diversified funds to avoid potential conflicts.
The new filing does not reveal the precise size of Trump’s investments because federal disclosures report transactions in broad value ranges rather than exact amounts. But heavy trading has become a hallmark of Trump’s second term.
His 2025 annual financial disclosure showed more than 21,000 securities trades across eight accounts holding at least $858 million, compared with just 86 stock transactions disclosed during his first year in office in 2017.
The August disclosure also shows continued investments across some of the country’s largest publicly traded companies. Trump reported purchases of between $1 million and $5 million each in Microsoft, McDonald’s and Comcast on Aug. 10
Later, on Aug. 26, Trump’s portfolio bought between $15,001 and $50,000 of Tyson Foods on the same day he signed a proclamation temporarily expanding low-tariff imports of lean beef trimmings by 300,000 metric tons.
The move, aimed at easing elevated beef prices, took effect Sept. 1 for up to 90 days. Trump had signaled plans to address beef prices before the Tyson trade, and the disclosure does not show whether the Tyson purchase came before or after he signed the proclamation.
Trump’s account also continued buying municipal debt, a pattern that has emerged repeatedly in his disclosures. The August filing includes dozens of municipal securities tied to state and local governments, schools, hospitals, housing authorities and other public entities.
442
·
--
සත්යායනය කළ
XRP price dips near $1.45 despite $3.14M inflows into U.S. spot XRP ETFs on Oct. 7XRP's price dropped about 3.9% from $1.52 to $1.46 on Oct. 6-7, even as U.S. spot XRP ETFs saw $3.14 million in net inflows, led by Bitwise's $10.55 million inflow. Despite these positive fund flows, XRP's price decline suggests ETF activity did not directly drive the price. Technical analysis points to $1.40 as support and $1.4850 as resistance, with a possible false breakdown if prices hold above these levels. Additionally, Evernorth Holdings plans a business combination with Armada Acquisition Corp. II, aiming for Nasdaq trading under ticker XRPN around Oct. 12, while the XRP Ledger upgrade is set to activate on Oct. 9 pending validator support.
XRP price movement provides context for cryptocurrency trends on Pluang. As of Oct 07, 2026 18:23 WIB, only 6 of 50 major cryptocurrencies rose while 43 fell. Notable movers include BAL at Rp16.297 with +11.14%, ENJ at Rp528 with -10.87%, and UNI at Rp142.226 with -10.28%.
XRP price dips near $1.45 despite $3.14M inflows into U.S. spot XRP ETFs on Oct. 7
XRP's price dropped about 3.9% from $1.52 to $1.46 on Oct. 6-7, even as U.S. spot XRP ETFs saw $3.14 million in net inflows, led by Bitwise's $10.55 million inflow. Despite these positive fund flows, XRP's price decline suggests ETF activity did not directly drive the price. Technical analysis points to $1.40 as support and $1.4850 as resistance, with a possible false breakdown if prices hold above these levels. Additionally, Evernorth Holdings plans a business combination with Armada Acquisition Corp. II, aiming for Nasdaq trading under ticker XRPN around Oct. 12, while the XRP Ledger upgrade is set to activate on Oct. 9 pending validator support.
XRP price movement provides context for cryptocurrency trends on Pluang. As of Oct 07, 2026 18:23 WIB, only 6 of 50 major cryptocurrencies rose while 43 fell. Notable movers include BAL at Rp16.297 with +11.14%, ENJ at Rp528 with -10.87%, and UNI at Rp142.226 with -10.28%.
XRP price movement provides context for cryptocurrency trends on Pluang. As of Oct 07, 2026 18:23 WIB, only 6 of 50 major cryptocurrencies rose while 43 fell. Notable movers include BAL at Rp16.297 with +11.14%, ENJ at Rp528 with -10.87%, and UNI at Rp142.226 with -10.28%.
1
1.2k
·
--
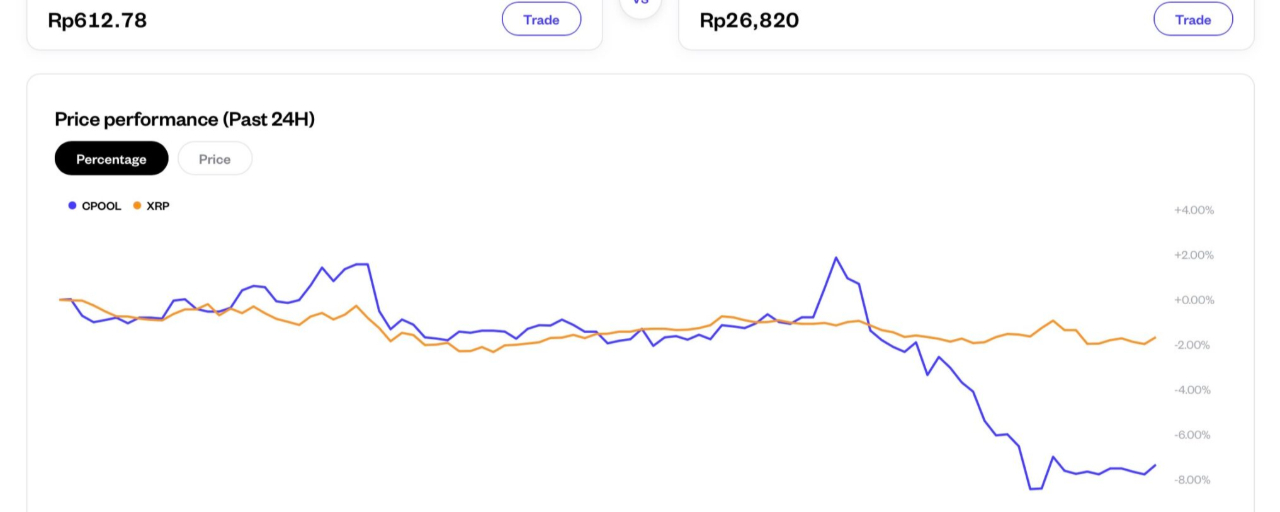
ලිපිය
XRP News Today: Will Clearpool’s XRPL Lending Boost XRP Demand?Not directly. Under the planned setup, each party has a clear role:
Clearpool: provides the lending platformCicada Partners: audits and underwrites borrowersRipple: participates as a limited partnerHex Trust: handles custody and compliance
All financing is planned in RLUSD, Ripple’s dollar stablecoin, not XRP. So the expansion does not create the same direct demand for the XRP token.
The lending framework also depends on two new XRPL standards, XLS-65 and XLS-66. Both were in Devnet testing in early October. They need approval from 80% of validators before going live on mainnet.
XRP itself is drifting lower. It trades near $1.49, down about 1.7% over 24 hours, with a market cap of about $94.4 billion. The four-hour chart shows XRP stuck between $1.45 and $1.55 since September 25.
CPOOL trades near $0.0366. That followed a breakout from a year-long range between roughly $0.013 and $0.020.
The token sat above its medium-term moving average near $0.0282. The next major resistance zone stands near $0.101
XRP News Today: Will Clearpool’s XRPL Lending Boost XRP Demand?
Not directly. Under the planned setup, each party has a clear role:
Clearpool: provides the lending platformCicada Partners: audits and underwrites borrowersRipple: participates as a limited partnerHex Trust: handles custody and compliance
All financing is planned in RLUSD, Ripple’s dollar stablecoin, not XRP. So the expansion does not create the same direct demand for the XRP token.
The lending framework also depends on two new XRPL standards, XLS-65 and XLS-66. Both were in Devnet testing in early October. They need approval from 80% of validators before going live on mainnet.
XRP itself is drifting lower. It trades near $1.49, down about 1.7% over 24 hours, with a market cap of about $94.4 billion. The four-hour chart shows XRP stuck between $1.45 and $1.55 since September 25.
CPOOL trades near $0.0366. That followed a breakout from a year-long range between roughly $0.013 and $0.020.
The token sat above its medium-term moving average near $0.0282. The next major resistance zone stands near $0.101
Clearpool: provides the lending platformCicada Partners: audits and underwrites borrowersRipple: participates as a limited partnerHex Trust: handles custody and compliance
All financing is planned in RLUSD, Ripple’s dollar stablecoin, not XRP. So the expansion does not create the same direct demand for the XRP token.
The lending framework also depends on two new XRPL standards, XLS-65 and XLS-66. Both were in Devnet testing in early October. They need approval from 80% of validators before going live on mainnet.
XRP itself is drifting lower. It trades near $1.49, down about 1.7% over 24 hours, with a market cap of about $94.4 billion. The four-hour chart shows XRP stuck between $1.45 and $1.55 since September 25.
CPOOL trades near $0.0366. That followed a breakout from a year-long range between roughly $0.013 and $0.020.
The token sat above its medium-term moving average near $0.0282. The next major resistance zone stands near $0.101
1
139
·
--
Clearpool Vote Backs XRPL Expansion With 1.125B CLEAR PlanIn XRP news today, Clearpool’s community has approved an expansion to the XRP Ledger and a 1:1 swap of its Ethereum-based CPOOL token for a new CLEAR token. The Snapshot vote passed on October 5 with 97.16% in favor and 2.84% against. The migration is targeted for Q4 2026.
At the center of the plan are a larger 1.125 billion-token supply and a pledge to use half of protocol fees to buy back and burn CLEAR.
Clearpool Vote Backs XRPL Expansion With 1.125B CLEAR Plan
In XRP news today, Clearpool’s community has approved an expansion to the XRP Ledger and a 1:1 swap of its Ethereum-based CPOOL token for a new CLEAR token. The Snapshot vote passed on October 5 with 97.16% in favor and 2.84% against. The migration is targeted for Q4 2026.
At the center of the plan are a larger 1.125 billion-token supply and a pledge to use half of protocol fees to buy back and burn CLEAR.
At the center of the plan are a larger 1.125 billion-token supply and a pledge to use half of protocol fees to buy back and burn CLEAR.
165
තවත් අන්තර්ගතයන් ගවේෂණය කිරීමට ඇතුල් වන්න
Binance චතුරශ්රය හි ගෝලීය ක්රිප්ටෝ පරිශීලකයින් හා එක්වන්න
⚡️ ක්රිප්ටෝ පිළිබඳ නවතම සහ ප්රයෝජනවත් තොරතුරු ලබා ගන්න.
💬 ලොව විශාලතම ක්රිප්ටෝ හුවමාරුව මගින් විශ්වාස කෙරේ.
👍 සත්යායනය කරන ලද නිර්මාණකරුවන්ගෙන් සැබෑ විදසුන් සොයා ගන්න.
විද්යුත් තැපෑල / දුරකථන අංකය
නැගී එන මාතෘකා
BTCRebounds80K
1,144 නැරඹීම්
164 සාකච්ඡා කරමින්
بيتكوين مسحت خساير الأمس ورجعت فوق 80 ألف دولار (حوالي 80,700)
السبب👇
غموض الانتخابات انزاح
Short Squeeze قوي (تصفية مراكز قصيرة بأكثر من 415 مليون دولار)
هبوط النفط خفف مخاوف التضخم
⭐ الارتداد قوي ومسح خسارة 5 آلاف دولار بيوم واحد، بس جزء كبير منه كان تصفية مراكز مو شراء مؤسسي حقيقي.
ال 80 ألف هي خط الفصل اليوم
فوقها السوق بخير، وتحتها في حذر وتقلب
هذا رأيي الشخصي وليس نصيحة استثمارية
DYOR
$BTC
#BTCRebounds80K
Storm89
·1 කැමත්ත දැක්වීම්
·836 නැරඹීම්
Binance98PercentReplenished
3,740 නැරඹීම්
262 සාකච්ඡා කරමින්
USMidterms-WhatAreMarketsExpecting?
218,375 නැරඹීම්
1,712 සාකච්ඡා කරමින්