
Sadaf shahbaz
2.7k පෝස්ටු

Sadaf shahbaz
වාර්තා කරන්න
පරිශීලක අවහිර කරන්න
Crypto Trader & Market Analyst | Daily market insights, price action & smart money concepts | Education over hype
විවෘත වෙළෙඳාම

{ටෝකන්} දරන්නා
ඉඳහිට වෙළෙන්දා
{වේලාව} වසර
25 හඹා යමින්
407 හඹා යන්නන්
2.6K+ කැමති විය
පෝස්ටු
ආයෝජන කළඹ
සියල්ල
උපුටා දැක්වීම්
·
--
$XRP Price Prediction: Can XRP Reach $5 by 2030?
$XRP is trading around $1.30–$1.40, well below its July 2025 high of about $3.65. Market sentiment is also cautious, with the Fear & Greed reading at 39 on November 8. So can it hit $5 by 2030?
Why It Could
ETF demand: Spot $XRP ETFs have attracted roughly $1.4 billion since launching in November 2025.
Real use case: Ripple keeps expanding bank and cross-border payment partnerships.
Market cycles: Four years is enough time for a full bull run.
Why It Might Not
Heavy math: $5 means roughly a $300B market cap and a gain of about 270%+ from today's price.
Supply pressure: Tokens released from escrow can weigh on price.
Weak momentum: XRP has struggled to hold key levels recently.
The Verdict
$5 by 2030 is possible, but it's a bull-cycle scenario, not a base case. It would likely need strong ETF inflows, real payment adoption and a hot crypto market all at once.
#xrp #BinanceReopensWithdrawalsForMoreAssets
$XRP Price Prediction: Can XRP Reach $5 by 2030?
$XRP is trading around $1.30–$1.40, well below its July 2025 high of about $3.65. Market sentiment is also cautious, with the Fear & Greed reading at 39 on November 8. So can it hit $5 by 2030?
Why It Could
ETF demand: Spot $XRP ETFs have attracted roughly $1.4 billion since launching in November 2025.
Real use case: Ripple keeps expanding bank and cross-border payment partnerships.
Market cycles: Four years is enough time for a full bull run.
Why It Might Not
Heavy math: $5 means roughly a $300B market cap and a gain of about 270%+ from today's price.
Supply pressure: Tokens released from escrow can weigh on price.
Weak momentum: XRP has struggled to hold key levels recently.
The Verdict
$5 by 2030 is possible, but it's a bull-cycle scenario, not a base case. It would likely need strong ETF inflows, real payment adoption and a hot crypto market all at once.
#xrp #BinanceReopensWithdrawalsForMoreAssets
$XRP is trading around $1.30–$1.40, well below its July 2025 high of about $3.65. Market sentiment is also cautious, with the Fear & Greed reading at 39 on November 8. So can it hit $5 by 2030?
Why It Could
ETF demand: Spot $XRP ETFs have attracted roughly $1.4 billion since launching in November 2025.
Real use case: Ripple keeps expanding bank and cross-border payment partnerships.
Market cycles: Four years is enough time for a full bull run.
Why It Might Not
Heavy math: $5 means roughly a $300B market cap and a gain of about 270%+ from today's price.
Supply pressure: Tokens released from escrow can weigh on price.
Weak momentum: XRP has struggled to hold key levels recently.
The Verdict
$5 by 2030 is possible, but it's a bull-cycle scenario, not a base case. It would likely need strong ETF inflows, real payment adoption and a hot crypto market all at once.
#xrp #BinanceReopensWithdrawalsForMoreAssets

516
·
--
🐸🔥 $PEPE — BULLISH MOMENTUM IS BUILDING!
$PEPE is showing fresh bullish strength, currently trading around $0.00000508 (+3.67%) on the 4H chart.
Buyers are holding above the MA(7), MA(25), and MA(99), keeping the short-term structure positive. The immediate resistance is $0.00000510. A strong breakout above this level could open the door toward $0.00000530–$0.00000568.
📊 Key Levels:
- Current Price: $0.00000508
- Support: $0.00000495–$0.00000480
- Resistance: $0.00000510
- Next Targets: $0.00000530 / $0.00000568
⚠️ RSI is around 76, so a short-term pullback is possible. Watch for volume confirmation before chasing the breakout.
🚀 Can $PEPE reach $0.00000568 next?
Are you BUYING, HOLDING, or WAITING?
#PEPE #Memecoin #BinanceSquare #Bullish
🐸🔥 $PEPE — BULLISH MOMENTUM IS BUILDING!
$PEPE is showing fresh bullish strength, currently trading around $0.00000508 (+3.67%) on the 4H chart.
Buyers are holding above the MA(7), MA(25), and MA(99), keeping the short-term structure positive. The immediate resistance is $0.00000510. A strong breakout above this level could open the door toward $0.00000530–$0.00000568.
📊 Key Levels:
- Current Price: $0.00000508
- Support: $0.00000495–$0.00000480
- Resistance: $0.00000510
- Next Targets: $0.00000530 / $0.00000568
⚠️ RSI is around 76, so a short-term pullback is possible. Watch for volume confirmation before chasing the breakout.
🚀 Can $PEPE reach $0.00000568 next?
Are you BUYING, HOLDING, or WAITING?
#PEPE #Memecoin #BinanceSquare #Bullish
$PEPE is showing fresh bullish strength, currently trading around $0.00000508 (+3.67%) on the 4H chart.
Buyers are holding above the MA(7), MA(25), and MA(99), keeping the short-term structure positive. The immediate resistance is $0.00000510. A strong breakout above this level could open the door toward $0.00000530–$0.00000568.
📊 Key Levels:
- Current Price: $0.00000508
- Support: $0.00000495–$0.00000480
- Resistance: $0.00000510
- Next Targets: $0.00000530 / $0.00000568
⚠️ RSI is around 76, so a short-term pullback is possible. Watch for volume confirmation before chasing the breakout.
🚀 Can $PEPE reach $0.00000568 next?
Are you BUYING, HOLDING, or WAITING?
#PEPE #Memecoin #BinanceSquare #Bullish

111
·
--
🚀 $JCT — NEW ALL-TIME HIGH LOADING! 🔥
$JCT is making an explosive move! 📈
Currently trading at $0.010632, up an incredible +285.50% in 24 hours!
💥 24H High: $0.011798
📊 24H Volume: $492.29M USDT
🟢 MA(7): $0.005002
🟣 MA(25): $0.004226
🔵 MA(99): $0.005330
Buyers are showing massive strength, and trading volume is rising sharply.
🎯 Next Psychological Target: $0.01200
🚀 Bigger Target: $0.01500
A new ATH could be on the horizon if bullish momentum continues!
🔥 JCT's next big move could be exciting. Are you READY?
👇 What do you think — $0.015 coming soon?
#JCT #Binance #CryptoBreakout #BullishMomentum
🚀 $JCT — NEW ALL-TIME HIGH LOADING! 🔥
$JCT is making an explosive move! 📈
Currently trading at $0.010632, up an incredible +285.50% in 24 hours!
💥 24H High: $0.011798
📊 24H Volume: $492.29M USDT
🟢 MA(7): $0.005002
🟣 MA(25): $0.004226
🔵 MA(99): $0.005330
Buyers are showing massive strength, and trading volume is rising sharply.
🎯 Next Psychological Target: $0.01200
🚀 Bigger Target: $0.01500
A new ATH could be on the horizon if bullish momentum continues!
🔥 JCT's next big move could be exciting. Are you READY?
👇 What do you think — $0.015 coming soon?
#JCT #Binance #CryptoBreakout #BullishMomentum
$JCT is making an explosive move! 📈
Currently trading at $0.010632, up an incredible +285.50% in 24 hours!
💥 24H High: $0.011798
📊 24H Volume: $492.29M USDT
🟢 MA(7): $0.005002
🟣 MA(25): $0.004226
🔵 MA(99): $0.005330
Buyers are showing massive strength, and trading volume is rising sharply.
🎯 Next Psychological Target: $0.01200
🚀 Bigger Target: $0.01500
A new ATH could be on the horizon if bullish momentum continues!
🔥 JCT's next big move could be exciting. Are you READY?
👇 What do you think — $0.015 coming soon?
#JCT #Binance #CryptoBreakout #BullishMomentum

613
·
--
🚀 $HOT — Bullish Momentum Is Heating Up! 🔥
$HOT is trading at $0.000485, up +33.6%, with buyers pushing price toward a fresh breakout.
🎯 Targets: $0.000500 → $0.000550
🟢 Support: $0.000425 – $0.000396
A breakout above $0.000500 could trigger another bullish move. Watch for confirmation and avoid chasing the pump!
🔥 Are you HOLDING or BUYING $HOT ?
#BinanceSquare #cryptotrading
🚀 $HOT — Bullish Momentum Is Heating Up! 🔥
$HOT is trading at $0.000485, up +33.6%, with buyers pushing price toward a fresh breakout.
🎯 Targets: $0.000500 → $0.000550
🟢 Support: $0.000425 – $0.000396
A breakout above $0.000500 could trigger another bullish move. Watch for confirmation and avoid chasing the pump!
🔥 Are you HOLDING or BUYING $HOT ?
#BinanceSquare #cryptotrading
$HOT is trading at $0.000485, up +33.6%, with buyers pushing price toward a fresh breakout.
🎯 Targets: $0.000500 → $0.000550
🟢 Support: $0.000425 – $0.000396
A breakout above $0.000500 could trigger another bullish move. Watch for confirmation and avoid chasing the pump!
🔥 Are you HOLDING or BUYING $HOT ?
#BinanceSquare #cryptotrading

1
167
·
--
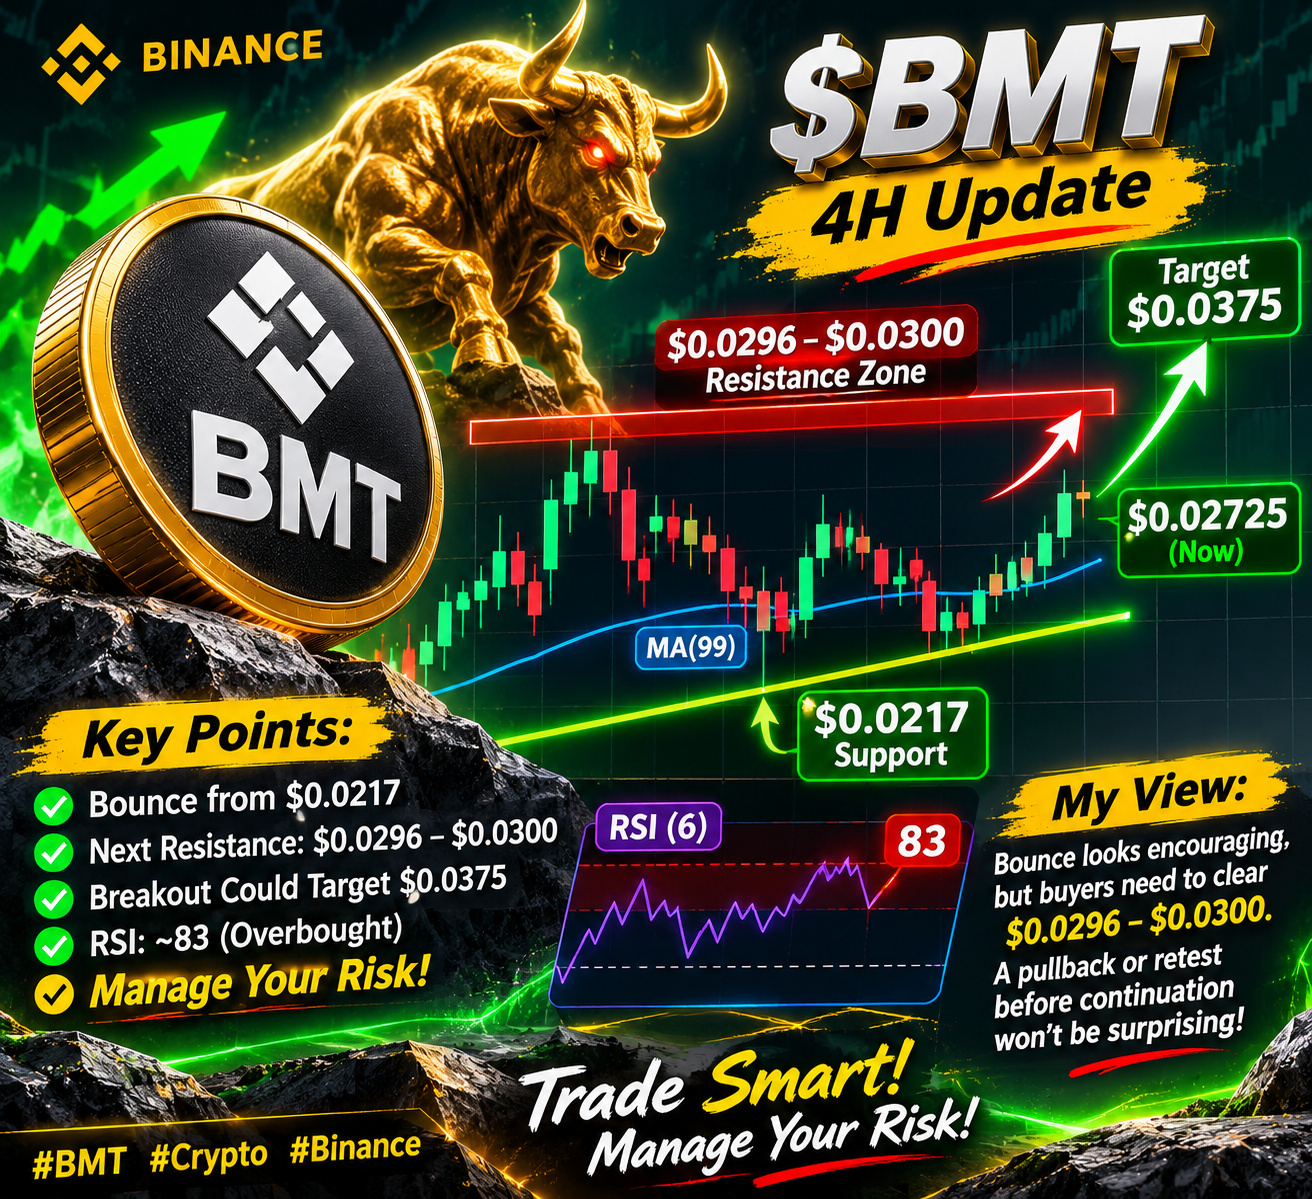
$BMT 4H Update
$BMT is bouncing from rising support near $0.0217 and trading around $0.02725 on this chart.
Next test is the $0.0296 to $0.0300 resistance zone, where the MA(99) and the previous swing highs sit. A breakout and successful retest could open a move toward $0.0375.
My view: the bounce looks encouraging, but buyers still need to clear resistance. Losing $0.0217 would weaken this setup.
RSI is already around 83 (overbought), so a pullback or retest before continuation wouldn't be surprising.
Manage your risk.
#BMT #crypto #Binance
$BMT 4H Update
$BMT is bouncing from rising support near $0.0217 and trading around $0.02725 on this chart.
Next test is the $0.0296 to $0.0300 resistance zone, where the MA(99) and the previous swing highs sit. A breakout and successful retest could open a move toward $0.0375.
My view: the bounce looks encouraging, but buyers still need to clear resistance. Losing $0.0217 would weaken this setup.
RSI is already around 83 (overbought), so a pullback or retest before continuation wouldn't be surprising.
Manage your risk.
#BMT #crypto #Binance
$BMT is bouncing from rising support near $0.0217 and trading around $0.02725 on this chart.
Next test is the $0.0296 to $0.0300 resistance zone, where the MA(99) and the previous swing highs sit. A breakout and successful retest could open a move toward $0.0375.
My view: the bounce looks encouraging, but buyers still need to clear resistance. Losing $0.0217 would weaken this setup.
RSI is already around 83 (overbought), so a pullback or retest before continuation wouldn't be surprising.
Manage your risk.
#BMT #crypto #Binance
50
·
--
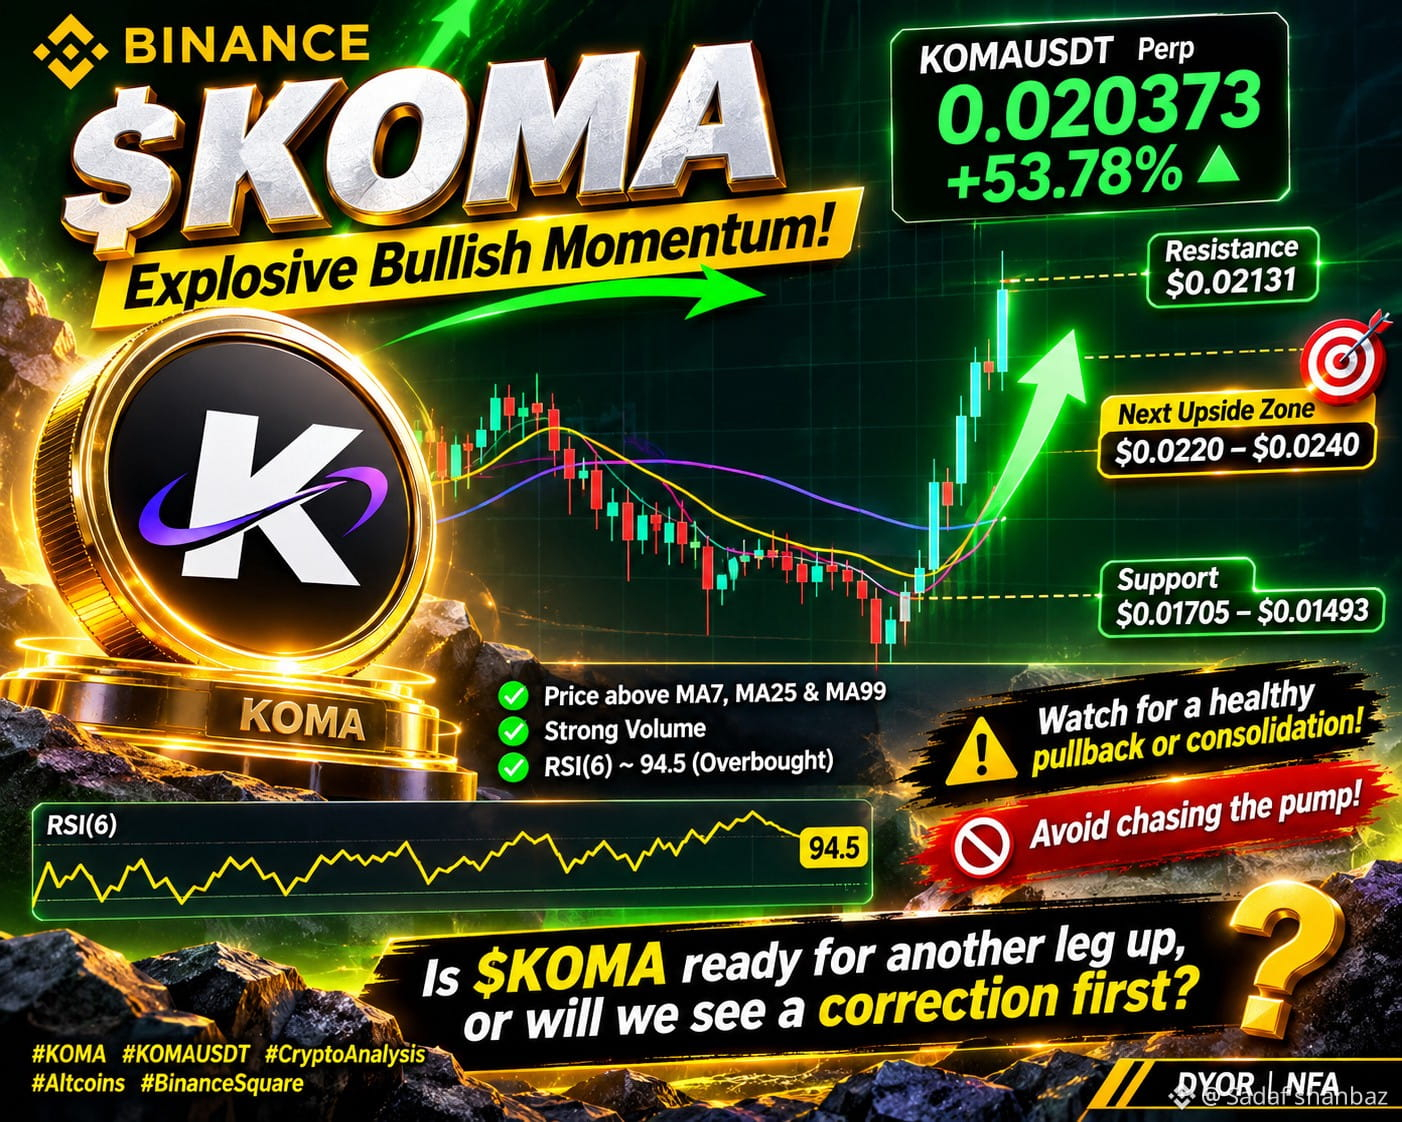
🚀 $KOMA — Explosive Bullish Momentum!
$KOMA is showing a powerful breakout on the 4H chart, currently trading at $0.020373 (+53.78%) with a massive surge in trading volume.
📊 Key Levels:
- Resistance: $0.02131
- Support: $0.01705 – $0.01493
- Next upside zone: $0.0220 – $0.0240
The price is trading well above MA7, MA25 and MA99, confirming strong bullish momentum. However, RSI(6) is near 94.5, indicating extremely overbought conditions.
I'm watching for a healthy pullback or consolidation before the next potential move. Avoid chasing the pump!
🔥 Is $KOMA ready for another leg up, or will we see a correction first?
#KOMA #KOMAUSDT #CryptoAnalysis #Altcoins #BinanceSquare
DYOR | NFA
🚀 $KOMA — Explosive Bullish Momentum!
$KOMA is showing a powerful breakout on the 4H chart, currently trading at $0.020373 (+53.78%) with a massive surge in trading volume.
📊 Key Levels:
- Resistance: $0.02131
- Support: $0.01705 – $0.01493
- Next upside zone: $0.0220 – $0.0240
The price is trading well above MA7, MA25 and MA99, confirming strong bullish momentum. However, RSI(6) is near 94.5, indicating extremely overbought conditions.
I'm watching for a healthy pullback or consolidation before the next potential move. Avoid chasing the pump!
🔥 Is $KOMA ready for another leg up, or will we see a correction first?
#KOMA #KOMAUSDT #CryptoAnalysis #Altcoins #BinanceSquare
DYOR | NFA
$KOMA is showing a powerful breakout on the 4H chart, currently trading at $0.020373 (+53.78%) with a massive surge in trading volume.
📊 Key Levels:
- Resistance: $0.02131
- Support: $0.01705 – $0.01493
- Next upside zone: $0.0220 – $0.0240
The price is trading well above MA7, MA25 and MA99, confirming strong bullish momentum. However, RSI(6) is near 94.5, indicating extremely overbought conditions.
I'm watching for a healthy pullback or consolidation before the next potential move. Avoid chasing the pump!
🔥 Is $KOMA ready for another leg up, or will we see a correction first?
#KOMA #KOMAUSDT #CryptoAnalysis #Altcoins #BinanceSquare
DYOR | NFA
73
·
--
🚀 $IDOL — What Should You Do Next?
👇 Are you BUYING, WAITING, or TAKING PROFITS?
IDOLUSDT has shown impressive momentum on the 4H chart, currently trading at 0.032658, up approximately 30% in 24 hours.
📊 Key Levels:
- 24H High: 0.045550 (long upper wick indicates selling pressure)
- 24H Low: 0.023399
- MA(7): 0.0313
- MA(25): 0.0246
- MA(99): 0.0162
- RSI(6): 72 (approaching overbought territory)
- 24H Volume: 464M USDT (strong trading activity)
📈 My Analysis:
Price is trading above all three moving averages, keeping the overall trend bullish. After a massive rally from 0.0068 to 0.0455, $IDOL is now experiencing a pullback.
The key is to watch whether buyers defend the current levels or selling pressure increases.
💬 What's your move?
🟢 BUYING – Looking for a pullback entry
🟡 WAITING – Waiting for confirmation
🔴 TAKING PROFITS – Securing gains
Drop your opinion in the comments! 👇
#IDOL #BinanceVietnamSquare #BinanceSquare #futures
🚀 $IDOL — What Should You Do Next?
👇 Are you BUYING, WAITING, or TAKING PROFITS?
IDOLUSDT has shown impressive momentum on the 4H chart, currently trading at 0.032658, up approximately 30% in 24 hours.
📊 Key Levels:
- 24H High: 0.045550 (long upper wick indicates selling pressure)
- 24H Low: 0.023399
- MA(7): 0.0313
- MA(25): 0.0246
- MA(99): 0.0162
- RSI(6): 72 (approaching overbought territory)
- 24H Volume: 464M USDT (strong trading activity)
📈 My Analysis:
Price is trading above all three moving averages, keeping the overall trend bullish. After a massive rally from 0.0068 to 0.0455, $IDOL is now experiencing a pullback.
The key is to watch whether buyers defend the current levels or selling pressure increases.
💬 What's your move?
🟢 BUYING – Looking for a pullback entry
🟡 WAITING – Waiting for confirmation
🔴 TAKING PROFITS – Securing gains
Drop your opinion in the comments! 👇
#IDOL #BinanceVietnamSquare #BinanceSquare #futures
👇 Are you BUYING, WAITING, or TAKING PROFITS?
IDOLUSDT has shown impressive momentum on the 4H chart, currently trading at 0.032658, up approximately 30% in 24 hours.
📊 Key Levels:
- 24H High: 0.045550 (long upper wick indicates selling pressure)
- 24H Low: 0.023399
- MA(7): 0.0313
- MA(25): 0.0246
- MA(99): 0.0162
- RSI(6): 72 (approaching overbought territory)
- 24H Volume: 464M USDT (strong trading activity)
📈 My Analysis:
Price is trading above all three moving averages, keeping the overall trend bullish. After a massive rally from 0.0068 to 0.0455, $IDOL is now experiencing a pullback.
The key is to watch whether buyers defend the current levels or selling pressure increases.
💬 What's your move?
🟢 BUYING – Looking for a pullback entry
🟡 WAITING – Waiting for confirmation
🔴 TAKING PROFITS – Securing gains
Drop your opinion in the comments! 👇
#IDOL #BinanceVietnamSquare #BinanceSquare #futures

259
·
--
$IDOL USDT Perp | 4H Technical Update
IDOL has delivered a strong breakout after a prolonged consolidation phase. Price is trading at 0.0410, up roughly 71% in the last 24 hours.
Market Snapshot
• Last Price: 0.041053
• 24h High / Low: 0.045550 / 0.021929
• 24h Volume: 325.98M USDT
• Mark Price: 0.041303
Technical Outlook
• Price is trading above the MA(7), MA(25) and MA(99), signaling a strong bullish trend
• A notable surge in volume supports the breakout
• RSI(6) is near 89.9, placing the market firmly in overbought territory
Key Levels
• Resistance: 0.0455
• Support: 0.0304 / 0.0219
Risk Note
After such a sharp rally, price is stretched far above the MA(7), so a short-term pullback or consolidation is possible. Waiting for confirmation on a pullback may be a better approach for new entries. Please apply proper risk management, use a stop-loss, and keep leverage low.
#IDOL #IDOLUSDT #BinanceSquare #Futures #CryptoAnalysis
$IDOL USDT Perp | 4H Technical Update
IDOL has delivered a strong breakout after a prolonged consolidation phase. Price is trading at 0.0410, up roughly 71% in the last 24 hours.
Market Snapshot
• Last Price: 0.041053
• 24h High / Low: 0.045550 / 0.021929
• 24h Volume: 325.98M USDT
• Mark Price: 0.041303
Technical Outlook
• Price is trading above the MA(7), MA(25) and MA(99), signaling a strong bullish trend
• A notable surge in volume supports the breakout
• RSI(6) is near 89.9, placing the market firmly in overbought territory
Key Levels
• Resistance: 0.0455
• Support: 0.0304 / 0.0219
Risk Note
After such a sharp rally, price is stretched far above the MA(7), so a short-term pullback or consolidation is possible. Waiting for confirmation on a pullback may be a better approach for new entries. Please apply proper risk management, use a stop-loss, and keep leverage low.
#IDOL #IDOLUSDT #BinanceSquare #Futures #CryptoAnalysis
IDOL has delivered a strong breakout after a prolonged consolidation phase. Price is trading at 0.0410, up roughly 71% in the last 24 hours.
Market Snapshot
• Last Price: 0.041053
• 24h High / Low: 0.045550 / 0.021929
• 24h Volume: 325.98M USDT
• Mark Price: 0.041303
Technical Outlook
• Price is trading above the MA(7), MA(25) and MA(99), signaling a strong bullish trend
• A notable surge in volume supports the breakout
• RSI(6) is near 89.9, placing the market firmly in overbought territory
Key Levels
• Resistance: 0.0455
• Support: 0.0304 / 0.0219
Risk Note
After such a sharp rally, price is stretched far above the MA(7), so a short-term pullback or consolidation is possible. Waiting for confirmation on a pullback may be a better approach for new entries. Please apply proper risk management, use a stop-loss, and keep leverage low.
#IDOL #IDOLUSDT #BinanceSquare #Futures #CryptoAnalysis

358
·
--
📊 Trading Strategy | Two Potential Long Setups
I'm watching two possible entry opportunities based on the current chart structure. The key levels are clear, but confirmation is important before entering.
🟢 SETUP A – Pullback Entry (Preferred)
Wait for price to retest the MA99 support zone.
- Entry: $0.00780 – $0.00800
- Stop Loss: $0.00695
- TP1: $0.00854
- TP2: $0.00950
- TP3: $0.01010
🎯 SETUP B – Breakout Entry
A confirmed 4H candle close above $0.00854 with strong volume could signal another bullish continuation.
- Entry: $0.00860 – $0.00870
- Stop Loss: $0.00790
- TP1: $0.00950
- TP2: $0.01010
📌 My Strategy: I prefer Setup A for a better entry near support. However, if buyers confirm a strong breakout, Setup B could offer another opportunity.
Trade smart. Protect your capital. 💚
$MITO
#CryptoTrading #TradingSetup #TechnicalAnalysis #longsignal #dyor
📊 Trading Strategy | Two Potential Long Setups
I'm watching two possible entry opportunities based on the current chart structure. The key levels are clear, but confirmation is important before entering.
🟢 SETUP A – Pullback Entry (Preferred)
Wait for price to retest the MA99 support zone.
- Entry: $0.00780 – $0.00800
- Stop Loss: $0.00695
- TP1: $0.00854
- TP2: $0.00950
- TP3: $0.01010
🎯 SETUP B – Breakout Entry
A confirmed 4H candle close above $0.00854 with strong volume could signal another bullish continuation.
- Entry: $0.00860 – $0.00870
- Stop Loss: $0.00790
- TP1: $0.00950
- TP2: $0.01010
📌 My Strategy: I prefer Setup A for a better entry near support. However, if buyers confirm a strong breakout, Setup B could offer another opportunity.
Trade smart. Protect your capital. 💚
$MITO
#CryptoTrading #TradingSetup #TechnicalAnalysis #longsignal #dyor
I'm watching two possible entry opportunities based on the current chart structure. The key levels are clear, but confirmation is important before entering.
🟢 SETUP A – Pullback Entry (Preferred)
Wait for price to retest the MA99 support zone.
- Entry: $0.00780 – $0.00800
- Stop Loss: $0.00695
- TP1: $0.00854
- TP2: $0.00950
- TP3: $0.01010
🎯 SETUP B – Breakout Entry
A confirmed 4H candle close above $0.00854 with strong volume could signal another bullish continuation.
- Entry: $0.00860 – $0.00870
- Stop Loss: $0.00790
- TP1: $0.00950
- TP2: $0.01010
📌 My Strategy: I prefer Setup A for a better entry near support. However, if buyers confirm a strong breakout, Setup B could offer another opportunity.
Trade smart. Protect your capital. 💚
$MITO
#CryptoTrading #TradingSetup #TechnicalAnalysis #longsignal #dyor
207
·
--
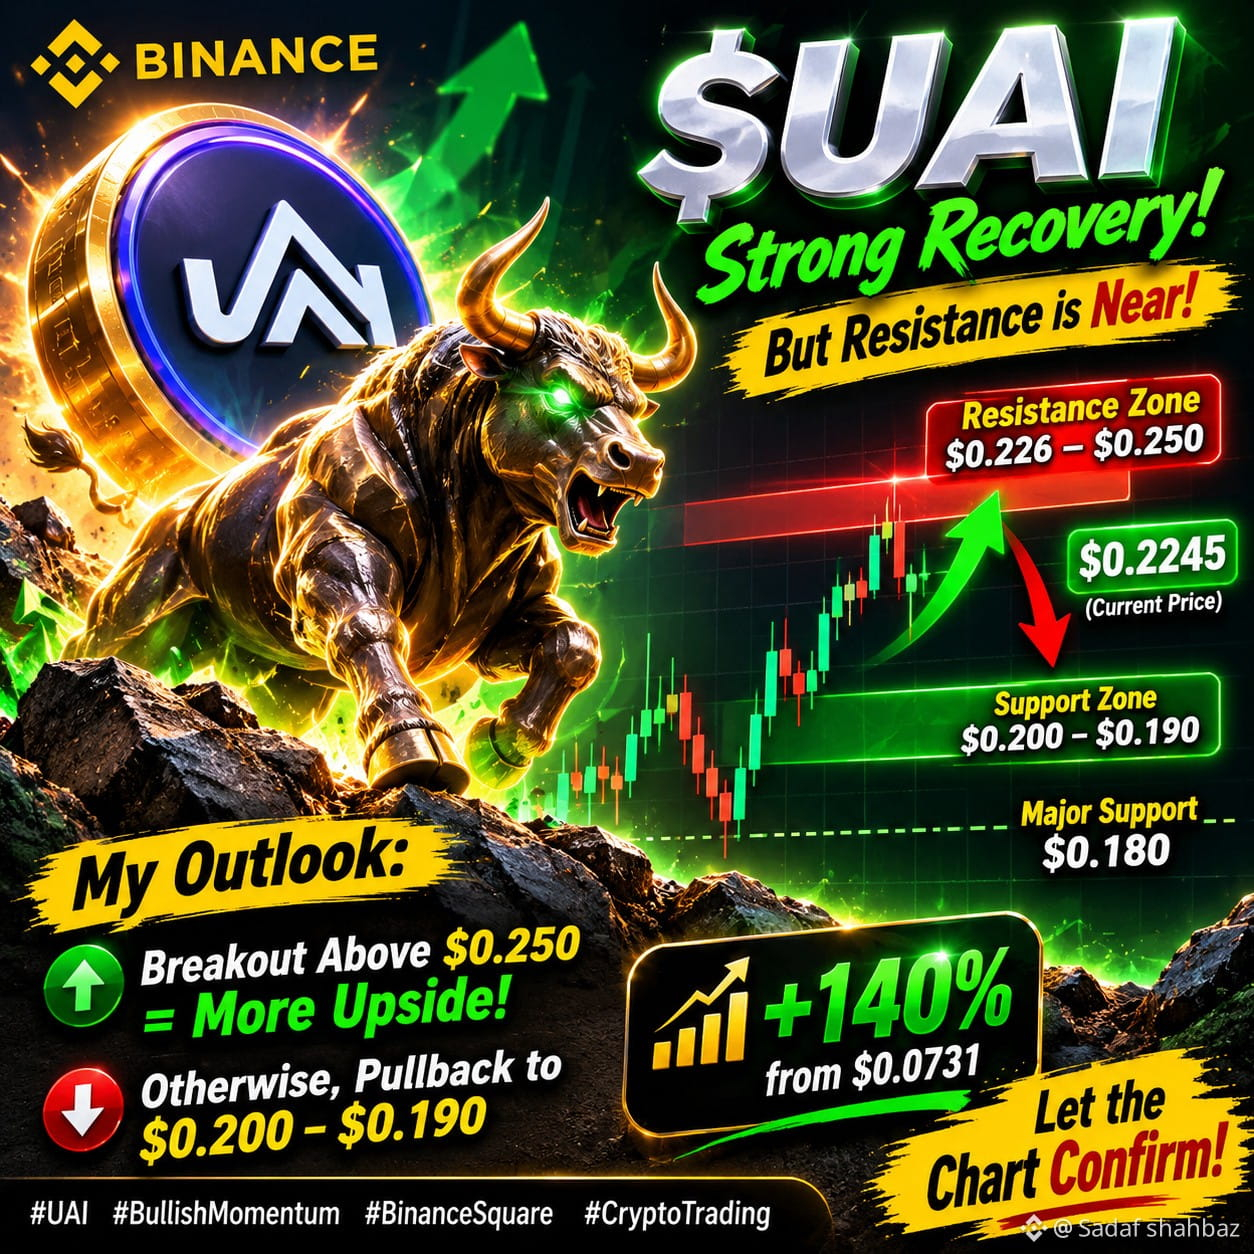
🚀 $UAI – Strong Recovery, But Resistance Is Near!
$UAI has delivered an impressive recovery from its recent low of $0.0731, surging over 140% and now trading around $0.2245.
Bullish momentum is strong, with a massive volume spike. However, price is approaching the critical $0.226–$0.250 resistance zone, while RSI(6) is already above 85, indicating overbought conditions.
🎯 My Outlook:
- Resistance: $0.226–$0.250
- Support: $0.200–$0.190
- Major Support: $0.180
I’m watching for a clean breakout above $0.250 for further upside. Otherwise, a short-term pullback toward support wouldn't be surprising.
The trend is bullish, but chasing an extended pump carries risk. Let the chart confirm the next move! 🔥
#UAI #BullishMomentum #cryptotrading #BinanceSquare
🚀 $UAI – Strong Recovery, But Resistance Is Near!
$UAI has delivered an impressive recovery from its recent low of $0.0731, surging over 140% and now trading around $0.2245.
Bullish momentum is strong, with a massive volume spike. However, price is approaching the critical $0.226–$0.250 resistance zone, while RSI(6) is already above 85, indicating overbought conditions.
🎯 My Outlook:
- Resistance: $0.226–$0.250
- Support: $0.200–$0.190
- Major Support: $0.180
I’m watching for a clean breakout above $0.250 for further upside. Otherwise, a short-term pullback toward support wouldn't be surprising.
The trend is bullish, but chasing an extended pump carries risk. Let the chart confirm the next move! 🔥
#UAI #BullishMomentum #cryptotrading #BinanceSquare
$UAI has delivered an impressive recovery from its recent low of $0.0731, surging over 140% and now trading around $0.2245.
Bullish momentum is strong, with a massive volume spike. However, price is approaching the critical $0.226–$0.250 resistance zone, while RSI(6) is already above 85, indicating overbought conditions.
🎯 My Outlook:
- Resistance: $0.226–$0.250
- Support: $0.200–$0.190
- Major Support: $0.180
I’m watching for a clean breakout above $0.250 for further upside. Otherwise, a short-term pullback toward support wouldn't be surprising.
The trend is bullish, but chasing an extended pump carries risk. Let the chart confirm the next move! 🔥
#UAI #BullishMomentum #cryptotrading #BinanceSquare
156
·
--
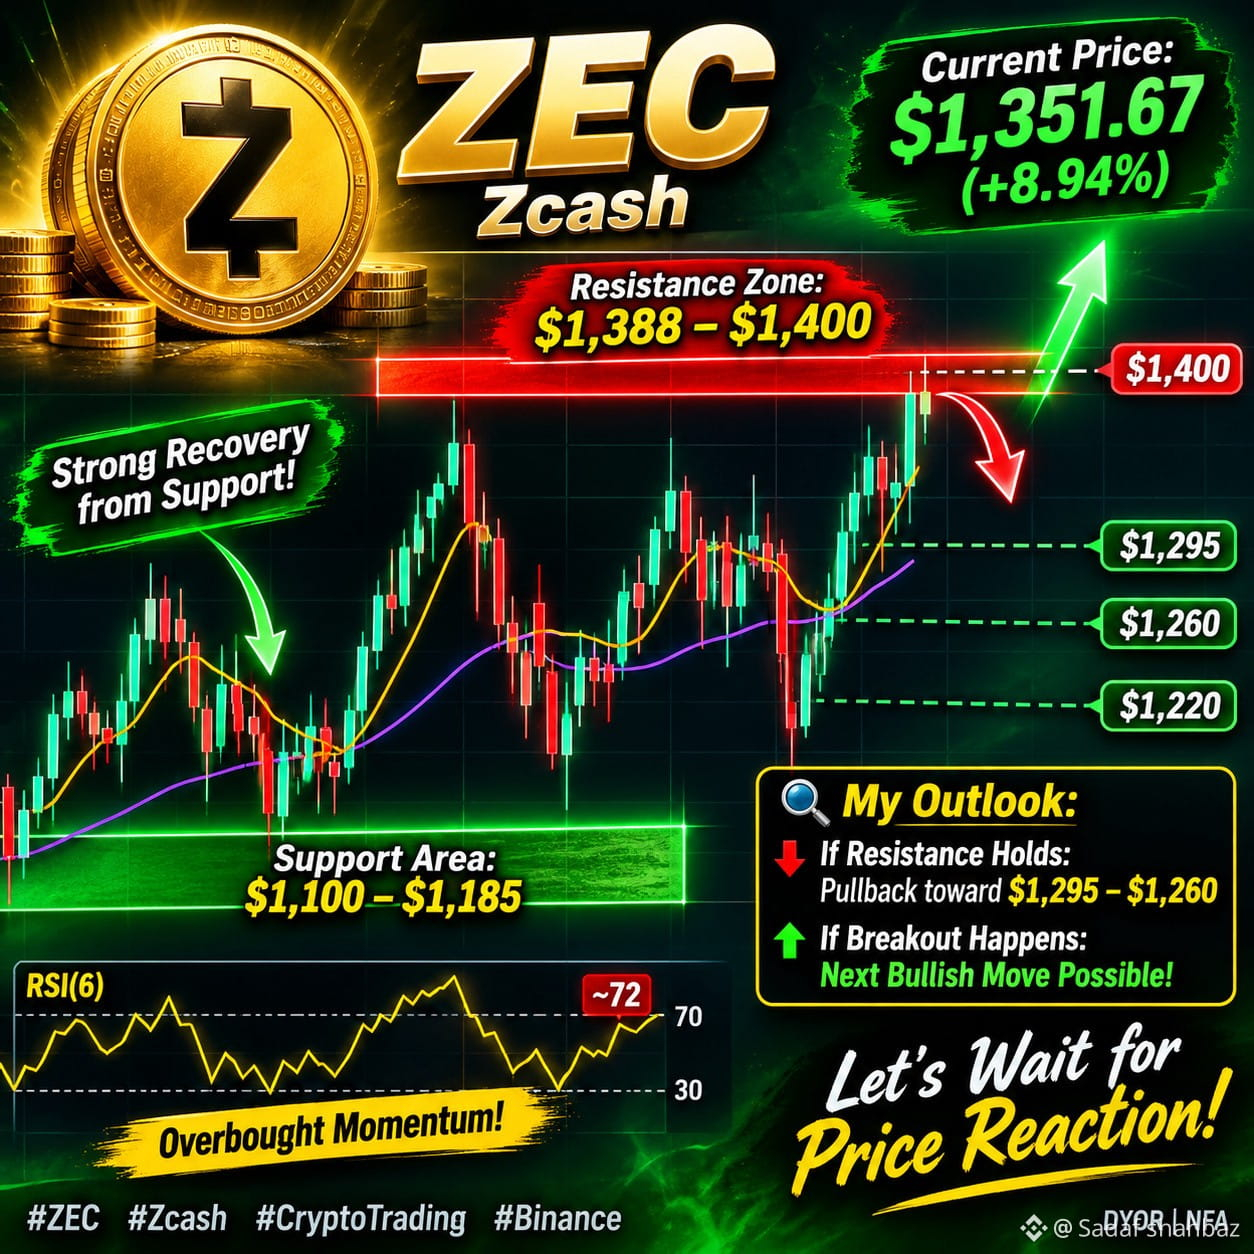
📊 $ZEC – Key Resistance Zone Ahead! ⚠️
$ZEC is showing impressive bullish recovery, currently trading around $1,351.67 (+8.94%) on the 4H chart.
Price has bounced strongly from the $1,100–$1,185 support area and is now approaching a major resistance zone at $1,388–$1,400, where sellers could step in again.
🔴 My Trading Outlook:
I'm watching for a possible rejection from this resistance, with a potential pullback toward:
🎯 First Support: $1,295
🎯 Second Support: $1,260
🎯 Major Support: $1,220
RSI(6) is around 72, indicating overbought short-term momentum, so a correction wouldn't be surprising.
However, a strong 4H breakout and sustained close above $1,400 could invalidate the bearish setup and open the door for another bullish move.
Let's watch the reaction at resistance before taking a position. No chasing candles! 🔥
#ZEC #CryptoTrading #TechnicalAnalysis #Binance
📊 $ZEC – Key Resistance Zone Ahead! ⚠️
$ZEC is showing impressive bullish recovery, currently trading around $1,351.67 (+8.94%) on the 4H chart.
Price has bounced strongly from the $1,100–$1,185 support area and is now approaching a major resistance zone at $1,388–$1,400, where sellers could step in again.
🔴 My Trading Outlook:
I'm watching for a possible rejection from this resistance, with a potential pullback toward:
🎯 First Support: $1,295
🎯 Second Support: $1,260
🎯 Major Support: $1,220
RSI(6) is around 72, indicating overbought short-term momentum, so a correction wouldn't be surprising.
However, a strong 4H breakout and sustained close above $1,400 could invalidate the bearish setup and open the door for another bullish move.
Let's watch the reaction at resistance before taking a position. No chasing candles! 🔥
#ZEC #CryptoTrading #TechnicalAnalysis #Binance
$ZEC is showing impressive bullish recovery, currently trading around $1,351.67 (+8.94%) on the 4H chart.
Price has bounced strongly from the $1,100–$1,185 support area and is now approaching a major resistance zone at $1,388–$1,400, where sellers could step in again.
🔴 My Trading Outlook:
I'm watching for a possible rejection from this resistance, with a potential pullback toward:
🎯 First Support: $1,295
🎯 Second Support: $1,260
🎯 Major Support: $1,220
RSI(6) is around 72, indicating overbought short-term momentum, so a correction wouldn't be surprising.
However, a strong 4H breakout and sustained close above $1,400 could invalidate the bearish setup and open the door for another bullish move.
Let's watch the reaction at resistance before taking a position. No chasing candles! 🔥
#ZEC #CryptoTrading #TechnicalAnalysis #Binance
10
·
--
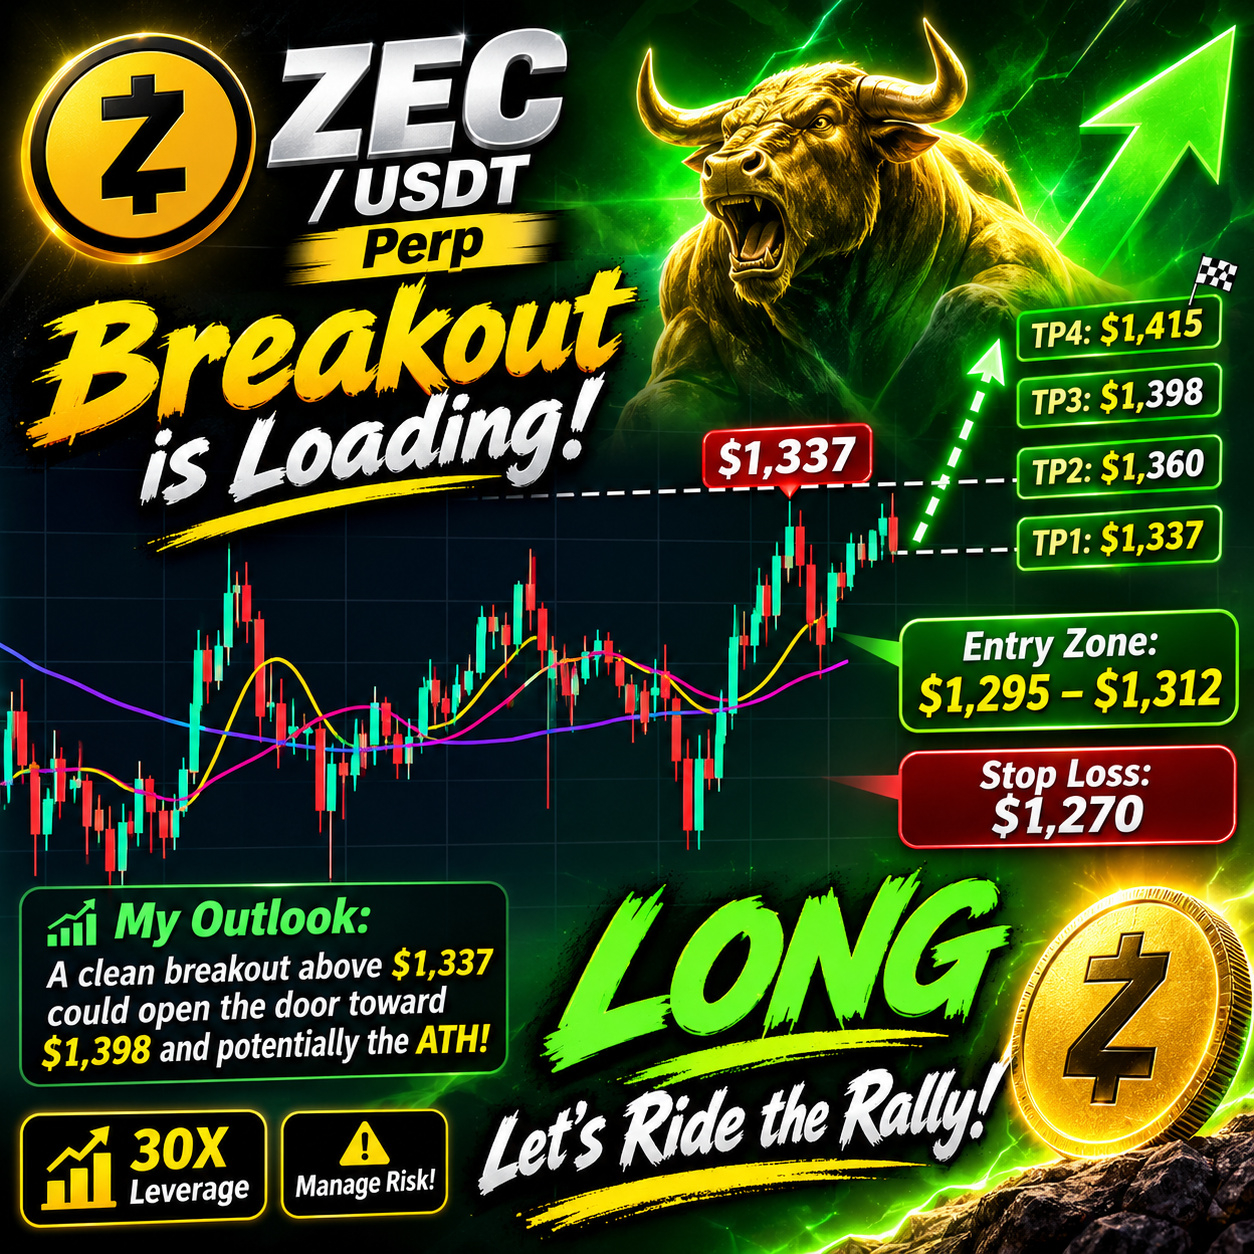
🚀 $ZEC – BULLISH BREAKOUT SETUP | LONG
$ZEC is showing strong bullish momentum on the 4H chart! 🔥
Currently trading at $1,310.67 (+0.9%), price is holding above MA7, MA25 and MA99. RSI(6) is around 63.67, indicating positive momentum without being extremely overbought.
I'm watching for another bullish move toward major resistance levels.
🟢 LONG TRADE SETUP
Entry Zone: $1,295 – $1,312
Stop Loss: $1,270
🎯 TP1: $1,337
🎯 TP2: $1,360
🎯 TP3: $1,398
🎯 Final Target: $1,415
My Outlook: A clean breakout above $1,337 could open the door toward $1,398 and potentially higher.
Are we going to see $ZEC reclaim $1,400? 👀🔥
#ZEC #Zcash #cryptotrading #longsignal
🚀 $ZEC – BULLISH BREAKOUT SETUP | LONG
$ZEC is showing strong bullish momentum on the 4H chart! 🔥
Currently trading at $1,310.67 (+0.9%), price is holding above MA7, MA25 and MA99. RSI(6) is around 63.67, indicating positive momentum without being extremely overbought.
I'm watching for another bullish move toward major resistance levels.
🟢 LONG TRADE SETUP
Entry Zone: $1,295 – $1,312
Stop Loss: $1,270
🎯 TP1: $1,337
🎯 TP2: $1,360
🎯 TP3: $1,398
🎯 Final Target: $1,415
My Outlook: A clean breakout above $1,337 could open the door toward $1,398 and potentially higher.
Are we going to see $ZEC reclaim $1,400? 👀🔥
#ZEC #Zcash #cryptotrading #longsignal
$ZEC is showing strong bullish momentum on the 4H chart! 🔥
Currently trading at $1,310.67 (+0.9%), price is holding above MA7, MA25 and MA99. RSI(6) is around 63.67, indicating positive momentum without being extremely overbought.
I'm watching for another bullish move toward major resistance levels.
🟢 LONG TRADE SETUP
Entry Zone: $1,295 – $1,312
Stop Loss: $1,270
🎯 TP1: $1,337
🎯 TP2: $1,360
🎯 TP3: $1,398
🎯 Final Target: $1,415
My Outlook: A clean breakout above $1,337 could open the door toward $1,398 and potentially higher.
Are we going to see $ZEC reclaim $1,400? 👀🔥
#ZEC #Zcash #cryptotrading #longsignal
315
·
--
🚀 $PEPE – Bullish Momentum Building! 🐸🔥
PEPE is showing positive momentum on the 4H chart, currently trading around $0.00000506 (+2.02%).
Buyers are holding above MA(7), MA(25), and MA(99), while RSI(6) is around 65, indicating strengthening bullish momentum.
If buyers maintain control, we could see another move toward the next resistance zones.
🟢 BUY SETUP – PEPE/USDT
Entry: $0.00000495 – $0.00000508
Stop Loss: $0.00000462
TP1: $0.00000515
TP2: $0.00000536
TP3: $0.00000560
🔥 Key Levels to Watch: Support: $0.00000488 – $0.00000474
Resistance: $0.00000515 – $0.00000536
My view: As long as $PEPE holds above its moving averages, another bullish push remains possible. A breakout above $0.00000515 could attract more buyers.
Are we preparing for another $PEPE rally? 🐸🚀
#PEPEUSDT #CryptoTrading
🚀 $PEPE – Bullish Momentum Building! 🐸🔥
PEPE is showing positive momentum on the 4H chart, currently trading around $0.00000506 (+2.02%).
Buyers are holding above MA(7), MA(25), and MA(99), while RSI(6) is around 65, indicating strengthening bullish momentum.
If buyers maintain control, we could see another move toward the next resistance zones.
🟢 BUY SETUP – PEPE/USDT
Entry: $0.00000495 – $0.00000508
Stop Loss: $0.00000462
TP1: $0.00000515
TP2: $0.00000536
TP3: $0.00000560
🔥 Key Levels to Watch: Support: $0.00000488 – $0.00000474
Resistance: $0.00000515 – $0.00000536
My view: As long as $PEPE holds above its moving averages, another bullish push remains possible. A breakout above $0.00000515 could attract more buyers.
Are we preparing for another $PEPE rally? 🐸🚀
#PEPEUSDT #CryptoTrading
PEPE is showing positive momentum on the 4H chart, currently trading around $0.00000506 (+2.02%).
Buyers are holding above MA(7), MA(25), and MA(99), while RSI(6) is around 65, indicating strengthening bullish momentum.
If buyers maintain control, we could see another move toward the next resistance zones.
🟢 BUY SETUP – PEPE/USDT
Entry: $0.00000495 – $0.00000508
Stop Loss: $0.00000462
TP1: $0.00000515
TP2: $0.00000536
TP3: $0.00000560
🔥 Key Levels to Watch: Support: $0.00000488 – $0.00000474
Resistance: $0.00000515 – $0.00000536
My view: As long as $PEPE holds above its moving averages, another bullish push remains possible. A breakout above $0.00000515 could attract more buyers.
Are we preparing for another $PEPE rally? 🐸🚀
#PEPEUSDT #CryptoTrading

93
·
--
ලිපිය
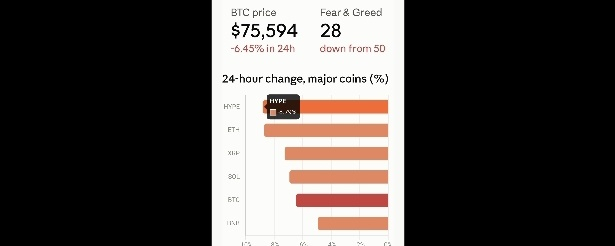
🚨 Crypto Bloodbath! Nasdaq Crash Drags BTC Down to $75K, Is $70K Next? 📉The crypto market is awash in red today. 🔴 $BTC is trading near $75,500, down more than 6% in the last 24 hours. $ETH has dropped about 8.7%, while $SOL and $XRP are both down around 7%.
Why is the market falling?
1️⃣ Stock market shock: After the US midterm elections, valuations in the AI and chip sectors came under fresh scrutiny, and the Nasdaq fell more than 5% in a single day. Crypto is now closely tied to Wall Street, so it fell along with it.
2️⃣ Liquidations: Roughly $1.09 billion in positions were liquidated over 24 hours, mostly longs. Forced selling from leveraged traders accelerated the drop.
3️⃣ Failed rebound: Bitcoin slid from around $81K back to $75K, wiping out the previous day's recovery.
4️⃣ Jobs report ahead: US nonfarm payrolls are due today. The numbers could shift interest rate expectations, so traders are staying cautious.
5️⃣ Sentiment: The Fear & Greed Index plunged from 50 to 28, showing fear is taking over.
Key levels to watch:
📌 $75,000 is the most important support right now. A close below it could open the door to $70,000. On the upside, $80,000 is strong resistance.
A word of caution for traders:
In a market this volatile, using leverage without a plan is dangerous. Always set a stop-loss and define your risk limit in advance.
💬 What's your take?
Will the $75K support hold, or are we heading to $70K?
👇 Drop your prediction in the comments: "75K Holds" or "70K Down"? And tell us: are you buying the dip, selling, or waiting on the sidelines?
#Bitcoin #BTC #CryptoCrash $#BinanceSquare #Nasdaq
🚨 Crypto Bloodbath! Nasdaq Crash Drags BTC Down to $75K, Is $70K Next? 📉
The crypto market is awash in red today. 🔴 $BTC is trading near $75,500, down more than 6% in the last 24 hours. $ETH has dropped about 8.7%, while $SOL and $XRP are both down around 7%.
Why is the market falling?
1️⃣ Stock market shock: After the US midterm elections, valuations in the AI and chip sectors came under fresh scrutiny, and the Nasdaq fell more than 5% in a single day. Crypto is now closely tied to Wall Street, so it fell along with it.
2️⃣ Liquidations: Roughly $1.09 billion in positions were liquidated over 24 hours, mostly longs. Forced selling from leveraged traders accelerated the drop.
3️⃣ Failed rebound: Bitcoin slid from around $81K back to $75K, wiping out the previous day's recovery.
4️⃣ Jobs report ahead: US nonfarm payrolls are due today. The numbers could shift interest rate expectations, so traders are staying cautious.
5️⃣ Sentiment: The Fear & Greed Index plunged from 50 to 28, showing fear is taking over.
Key levels to watch:
📌 $75,000 is the most important support right now. A close below it could open the door to $70,000. On the upside, $80,000 is strong resistance.
A word of caution for traders:
In a market this volatile, using leverage without a plan is dangerous. Always set a stop-loss and define your risk limit in advance.
💬 What's your take?
Will the $75K support hold, or are we heading to $70K?
👇 Drop your prediction in the comments: "75K Holds" or "70K Down"? And tell us: are you buying the dip, selling, or waiting on the sidelines?
#Bitcoin #BTC #CryptoCrash $#BinanceSquare #Nasdaq
Why is the market falling?
1️⃣ Stock market shock: After the US midterm elections, valuations in the AI and chip sectors came under fresh scrutiny, and the Nasdaq fell more than 5% in a single day. Crypto is now closely tied to Wall Street, so it fell along with it.
2️⃣ Liquidations: Roughly $1.09 billion in positions were liquidated over 24 hours, mostly longs. Forced selling from leveraged traders accelerated the drop.
3️⃣ Failed rebound: Bitcoin slid from around $81K back to $75K, wiping out the previous day's recovery.
4️⃣ Jobs report ahead: US nonfarm payrolls are due today. The numbers could shift interest rate expectations, so traders are staying cautious.
5️⃣ Sentiment: The Fear & Greed Index plunged from 50 to 28, showing fear is taking over.
Key levels to watch:
📌 $75,000 is the most important support right now. A close below it could open the door to $70,000. On the upside, $80,000 is strong resistance.
A word of caution for traders:
In a market this volatile, using leverage without a plan is dangerous. Always set a stop-loss and define your risk limit in advance.
💬 What's your take?
Will the $75K support hold, or are we heading to $70K?
👇 Drop your prediction in the comments: "75K Holds" or "70K Down"? And tell us: are you buying the dip, selling, or waiting on the sidelines?
#Bitcoin #BTC #CryptoCrash $#BinanceSquare #Nasdaq
108
·
--
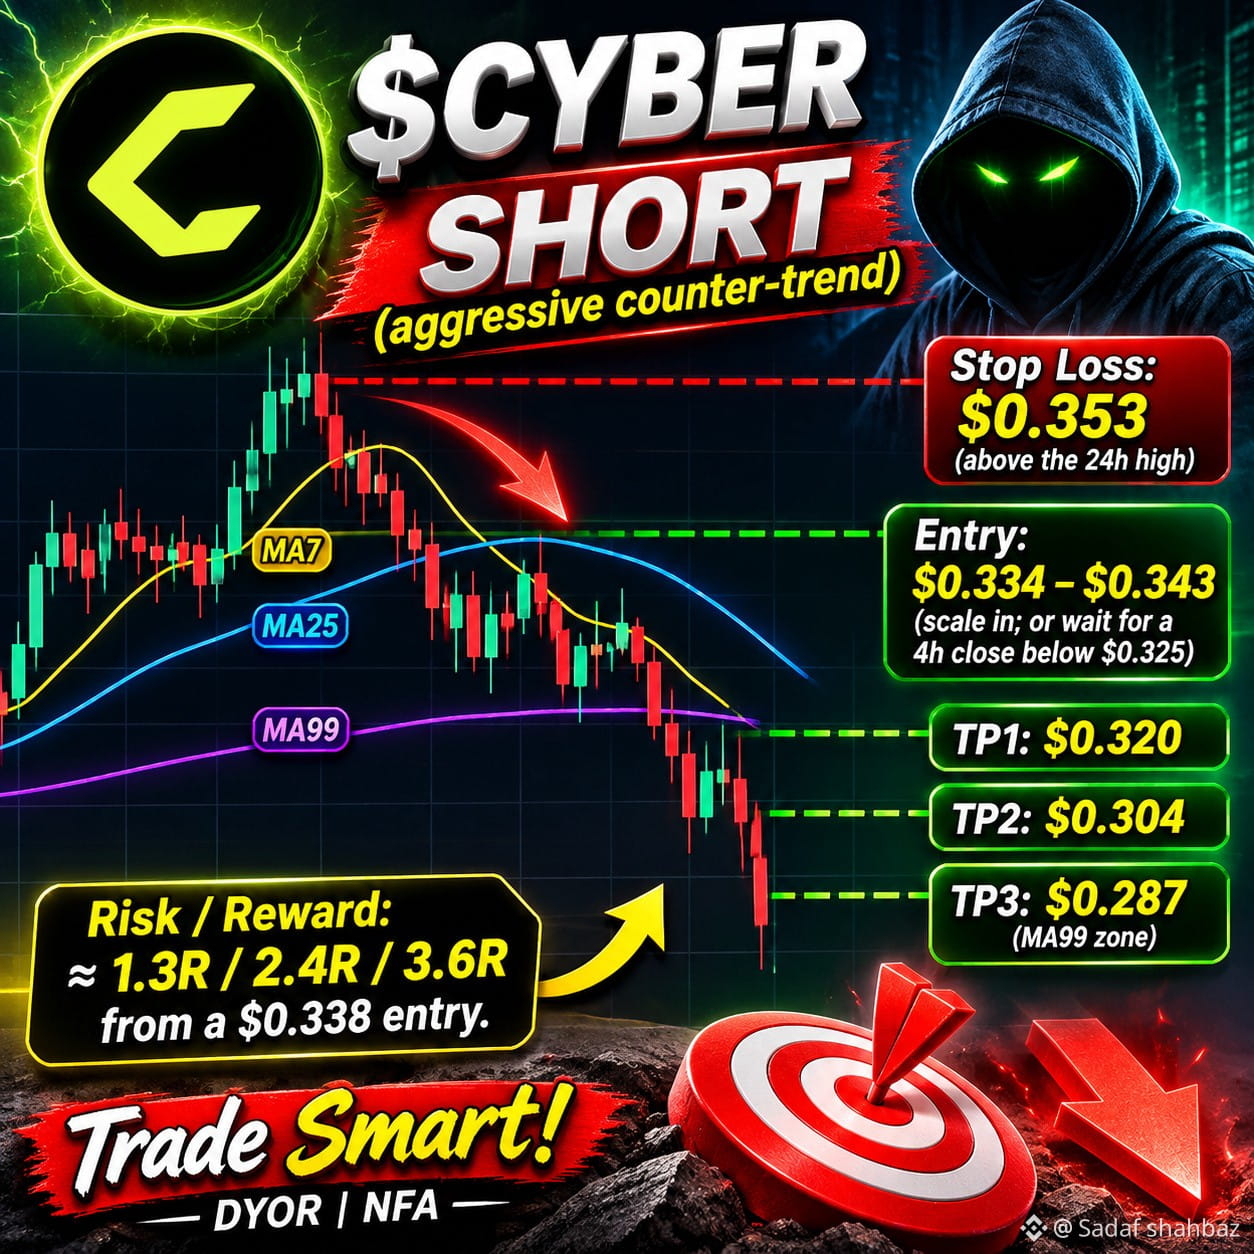
📉 $CYBER : SHORT (aggressive counter-trend)
Entry: $0.334 – $0.343 (scale in; or wait for a 4h close below $0.325)
Stop Loss: $0.353 (above the 24h high)
Take Profit Targets
TP1: $0.320
TP2: $0.304
TP3: $0.287 (MA99 zone)
Risk/reward is roughly 1.3R / 2.4R / 3.6R from a $0.338 entry.
📉 $CYBER : SHORT (aggressive counter-trend)
Entry: $0.334 – $0.343 (scale in; or wait for a 4h close below $0.325)
Stop Loss: $0.353 (above the 24h high)
Take Profit Targets
TP1: $0.320
TP2: $0.304
TP3: $0.287 (MA99 zone)
Risk/reward is roughly 1.3R / 2.4R / 3.6R from a $0.338 entry.
Entry: $0.334 – $0.343 (scale in; or wait for a 4h close below $0.325)
Stop Loss: $0.353 (above the 24h high)
Take Profit Targets
TP1: $0.320
TP2: $0.304
TP3: $0.287 (MA99 zone)
Risk/reward is roughly 1.3R / 2.4R / 3.6R from a $0.338 entry.
147
·
--
🚀 $JCT – BUY NOW | LONG SETUP
$JCT is showing strong bullish momentum, currently trading at $0.005897 (+42.88%).
The 4H chart shows a bullish recovery above key moving averages, supported by increasing volume. Buyers are stepping in, but RSI is around 78, so manage risk carefully.
🟢 Trade Setup:
- Entry: $0.00585 – $0.00590
- Stop Loss: $0.00520
- TP1: $0.00625
- TP2: $0.00680
- TP3: $0.00725
🔥 Momentum is strong, and another upward move is possible if buyers maintain control.
Don't chase blindly. Manage your risk and trade smart!
What do you think? Can $JCT break $0.007?
#JCT #Crypto #Binance #Altcoins #LONG
🚀 $JCT – BUY NOW | LONG SETUP
$JCT is showing strong bullish momentum, currently trading at $0.005897 (+42.88%).
The 4H chart shows a bullish recovery above key moving averages, supported by increasing volume. Buyers are stepping in, but RSI is around 78, so manage risk carefully.
🟢 Trade Setup:
- Entry: $0.00585 – $0.00590
- Stop Loss: $0.00520
- TP1: $0.00625
- TP2: $0.00680
- TP3: $0.00725
🔥 Momentum is strong, and another upward move is possible if buyers maintain control.
Don't chase blindly. Manage your risk and trade smart!
What do you think? Can $JCT break $0.007?
#JCT #Crypto #Binance #Altcoins #LONG
$JCT is showing strong bullish momentum, currently trading at $0.005897 (+42.88%).
The 4H chart shows a bullish recovery above key moving averages, supported by increasing volume. Buyers are stepping in, but RSI is around 78, so manage risk carefully.
🟢 Trade Setup:
- Entry: $0.00585 – $0.00590
- Stop Loss: $0.00520
- TP1: $0.00625
- TP2: $0.00680
- TP3: $0.00725
🔥 Momentum is strong, and another upward move is possible if buyers maintain control.
Don't chase blindly. Manage your risk and trade smart!
What do you think? Can $JCT break $0.007?
#JCT #Crypto #Binance #Altcoins #LONG
406
·
--
Small scalp, big smile! 😜🔥
$JCT is showing strong bullish momentum! 💚 Another clean move, and $556 profit successfully booked! 💰💪
JCTUSDT is now trading at $0.005938 (+70.98%), approaching its 24H high of $0.005971.
Buyers are still showing strength, but after this massive pump, stay smart and manage your risk.
More opportunities ahead! 🚀
#JCT #Junction #CryptoTrading #Binance #ProfitBooked
Small scalp, big smile! 😜🔥
$JCT is showing strong bullish momentum! 💚 Another clean move, and $556 profit successfully booked! 💰💪
JCTUSDT is now trading at $0.005938 (+70.98%), approaching its 24H high of $0.005971.
Buyers are still showing strength, but after this massive pump, stay smart and manage your risk.
More opportunities ahead! 🚀
#JCT #Junction #CryptoTrading #Binance #ProfitBooked
$JCT is showing strong bullish momentum! 💚 Another clean move, and $556 profit successfully booked! 💰💪
JCTUSDT is now trading at $0.005938 (+70.98%), approaching its 24H high of $0.005971.
Buyers are still showing strength, but after this massive pump, stay smart and manage your risk.
More opportunities ahead! 🚀
#JCT #Junction #CryptoTrading #Binance #ProfitBooked

1
295
·
--
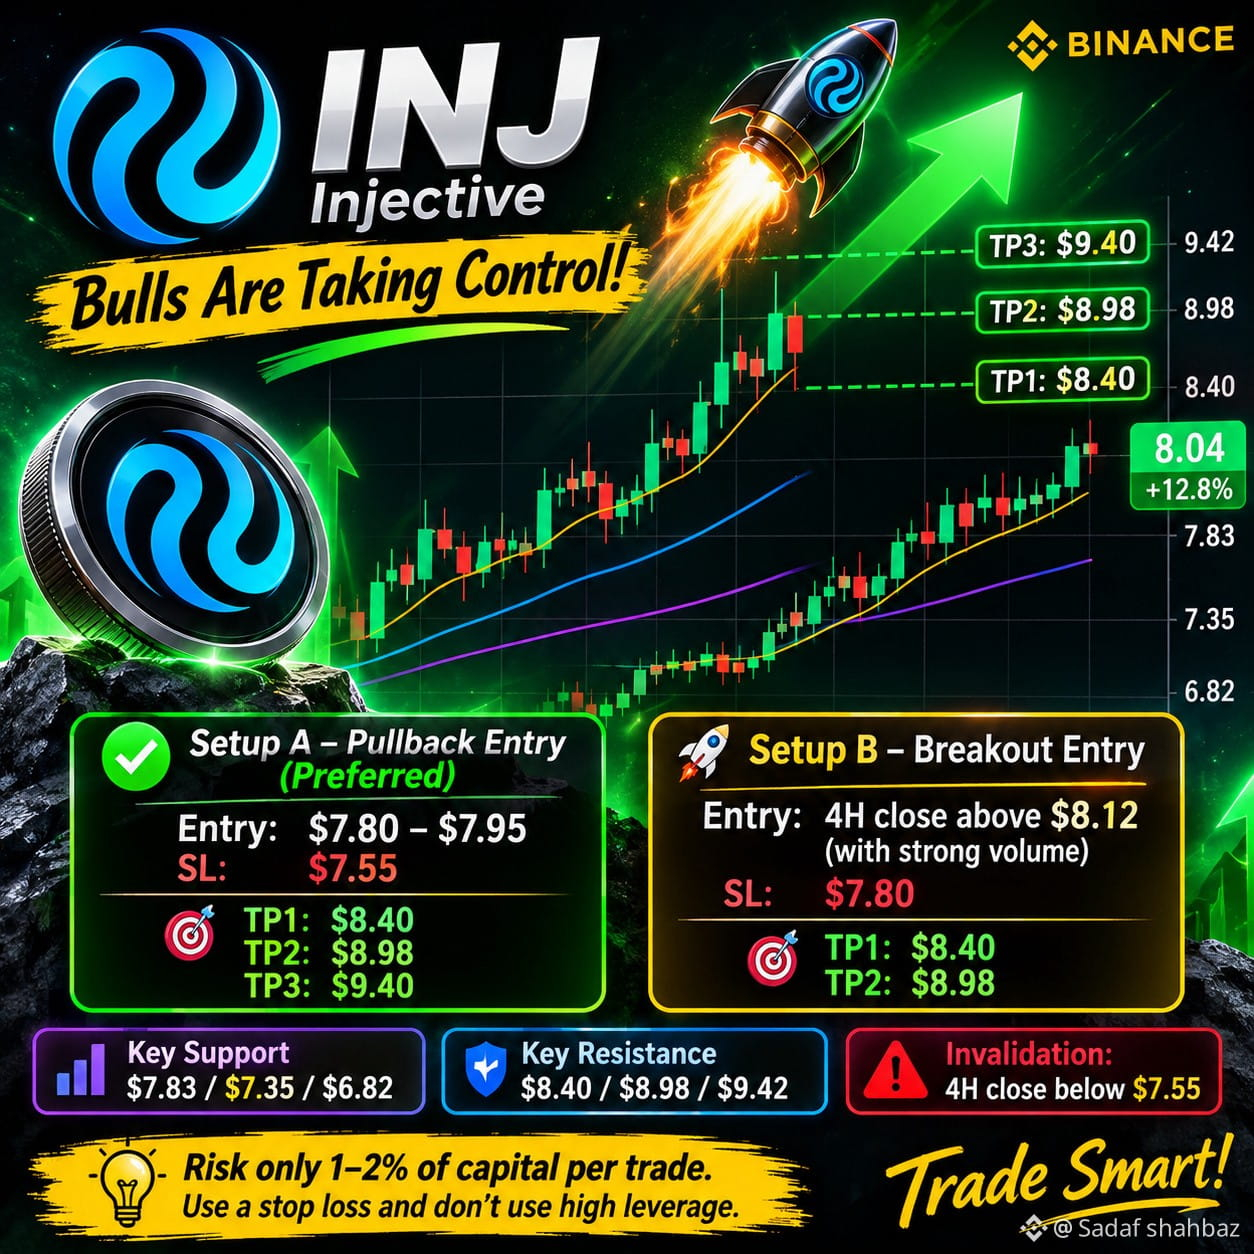
🚀 $INJ – Bulls Are Taking Control!
INJ is showing strong bullish momentum, trading above all major moving averages. However, RSI(6) near 85 signals overbought conditions, so a pullback entry looks safer than chasing the pump.
🟢 LONG SETUP
Entry: $7.80 – $7.95
Stop Loss: $7.55
🎯 Take Profit Targets:
- TP1: $8.40
- TP2: $8.98
- TP3: $9.40
🚀 Breakout Entry: 4H candle close above $8.12 with strong volume.
Key Support: $7.83 / $7.35
Resistance: $8.40 / $8.98 / $9.42
What's your target for $INJ ? 👀
#İNJ #Injective #CryptoTrading #TradingSignals
🚀 $INJ – Bulls Are Taking Control!
INJ is showing strong bullish momentum, trading above all major moving averages. However, RSI(6) near 85 signals overbought conditions, so a pullback entry looks safer than chasing the pump.
🟢 LONG SETUP
Entry: $7.80 – $7.95
Stop Loss: $7.55
🎯 Take Profit Targets:
- TP1: $8.40
- TP2: $8.98
- TP3: $9.40
🚀 Breakout Entry: 4H candle close above $8.12 with strong volume.
Key Support: $7.83 / $7.35
Resistance: $8.40 / $8.98 / $9.42
What's your target for $INJ ? 👀
#İNJ #Injective #CryptoTrading #TradingSignals
INJ is showing strong bullish momentum, trading above all major moving averages. However, RSI(6) near 85 signals overbought conditions, so a pullback entry looks safer than chasing the pump.
🟢 LONG SETUP
Entry: $7.80 – $7.95
Stop Loss: $7.55
🎯 Take Profit Targets:
- TP1: $8.40
- TP2: $8.98
- TP3: $9.40
🚀 Breakout Entry: 4H candle close above $8.12 with strong volume.
Key Support: $7.83 / $7.35
Resistance: $8.40 / $8.98 / $9.42
What's your target for $INJ ? 👀
#İNJ #Injective #CryptoTrading #TradingSignals
268
·
--
🚀 $JCT – Bullish Momentum Is Back! 🔥
Congratulations, guys! All our previous targets have been hit successfully. 💰✅
$JCT is showing strong bullish momentum again, currently trading at $0.005764 (+48.25%).
Looking at the 4H chart, price has reclaimed all major moving averages, while buying volume is increasing. Bulls are pushing toward the next resistance levels.
📈 New LONG Targets:
🎯 TP1: $0.00600
🎯 TP2: $0.00625 – $0.00650
🚀 Final Target: $0.00700 – $0.00790
Key Support: $0.00530 – $0.00500
The momentum looks promising, but RSI is already elevated, so avoid chasing the pump. Watch for a healthy pullback before entering.
🔥 Another bullish move could be coming!
Follow for more
#BullishMomentum #cryptotrading
🚀 $JCT – Bullish Momentum Is Back! 🔥
Congratulations, guys! All our previous targets have been hit successfully. 💰✅
$JCT is showing strong bullish momentum again, currently trading at $0.005764 (+48.25%).
Looking at the 4H chart, price has reclaimed all major moving averages, while buying volume is increasing. Bulls are pushing toward the next resistance levels.
📈 New LONG Targets:
🎯 TP1: $0.00600
🎯 TP2: $0.00625 – $0.00650
🚀 Final Target: $0.00700 – $0.00790
Key Support: $0.00530 – $0.00500
The momentum looks promising, but RSI is already elevated, so avoid chasing the pump. Watch for a healthy pullback before entering.
🔥 Another bullish move could be coming!
Follow for more
#BullishMomentum #cryptotrading
Congratulations, guys! All our previous targets have been hit successfully. 💰✅
$JCT is showing strong bullish momentum again, currently trading at $0.005764 (+48.25%).
Looking at the 4H chart, price has reclaimed all major moving averages, while buying volume is increasing. Bulls are pushing toward the next resistance levels.
📈 New LONG Targets:
🎯 TP1: $0.00600
🎯 TP2: $0.00625 – $0.00650
🚀 Final Target: $0.00700 – $0.00790
Key Support: $0.00530 – $0.00500
The momentum looks promising, but RSI is already elevated, so avoid chasing the pump. Watch for a healthy pullback before entering.
🔥 Another bullish move could be coming!
Follow for more
#BullishMomentum #cryptotrading

185
තවත් අන්තර්ගතයන් ගවේෂණය කිරීමට ඇතුල් වන්න
Binance චතුරශ්රය හි ගෝලීය ක්රිප්ටෝ පරිශීලකයින් හා එක්වන්න
⚡️ ක්රිප්ටෝ පිළිබඳ නවතම සහ ප්රයෝජනවත් තොරතුරු ලබා ගන්න.
💬 ලොව විශාලතම ක්රිප්ටෝ හුවමාරුව මගින් විශ්වාස කෙරේ.
👍 සත්යායනය කරන ලද නිර්මාණකරුවන්ගෙන් සැබෑ විදසුන් සොයා ගන්න.
විද්යුත් තැපෑල / දුරකථන අංකය
නැගී එන මාතෘකා
HotCPIDecemberHikePriced
57,490 නැරඹීම්
847 සාකච්ඡා කරමින්
CPI Market Watch | US CPI Rises 0.4% in October, Hotter Than 0.3% Forecast
Binance News
·23 කැමත්ත දැක්වීම්
·39.2k නැරඹීම්
AnthropicRejectsIPODelayValuationinQuestion
191,113 නැරඹීම්
1,662 සාකච්ඡා කරමින්
NvidiaInvestigatesAfterHuang’sAffairApology
469,576 නැරඹීම්
3,105 සාකච්ඡා කරමින්