
OMGart
273 පෝස්ටු

OMGart
වාර්තා කරන්න
පරිශීලක අවහිර කරන්න
Artist - @thisisomgart
0mgart.eth
179 හඹා යමින්
13.5K+ හඹා යන්නන්
2.3K+ කැමති විය
පෝස්ටු
සියල්ල
උපුටා දැක්වීම්
වීඩියෝ
අමුණා ඇත
·
--
උසබ තත්ත්වය
OMGart in Space ;) end of 2025. 2026 vision soon... $BNB
{spot}(BNBUSDT)
OMGart in Space ;) end of 2025. 2026 vision soon... $BNB

1
5
2.9k
·
--
ලිපිය
Did you know that $GOOGL (Alphabet Inc.)...?Reading time: 3 minutes • Focus: Search Dominance, AI Research & Cloud Growth
The Short Version (TL;DR):
Alphabet Inc. did not achieve its market position by accident. Its $2.2T valuation reflects a calculated, multi-year strategy — though rising competition and elevated expectations mean its dominance faces real challenges.
Why Alphabet Inc. Matters to You
Every search, YouTube video, Android device, Google Maps route, and Cloud AI workload connects to Google's infrastructure — the invisible backbone of daily digital life and the global digital economy.
1. From Startup to Industry Titan
**Alphabet Inc.** was founded in **1998** in **Mountain View, California** by **Larry Page, Sergey Brin**. What started as a mission to organize the world's information and make it universally accessible has evolved into a defining force in search dominance, ai research and beyond. Today's market leadership is the payoff of a strategy decades in the making.
Common Myth: Google is falling behind in AI compared to OpenAI.
The Reality: Google owns the full AI stack from custom TPUs to DeepMind algorithms, Gemini 2.0, and 2B+ user distribution touchpoints.
2. The Pagerank + Distributed Compute Infrastructure That Changed Everything
**Alphabet Inc.** established its technical credibility with the **PageRank + distributed compute infrastructure**. This breakthrough was not a single product launch — it created the foundational platform that enabled the company's subsequent market dominance. The engineering decisions behind this innovation required years of R&D investment and represented a fundamental shift in how search dominance, ai research operates.
Common Myth: Waymo is just an expensive experiment.
The Reality: Waymo is the undisputed leader in commercial autonomous rides, completing over 150,000 paid rides/week.
3. Market Dominance and the Competitive Moat
Operating with a **$2.2T** market cap and **$345B** in trailing twelve-month revenue, Alphabet Inc.'s market position rests on three pillars:
1. **Search & Digital Ad Monopoly (90%+ Market Share)**: A structural advantage that compounds through network effects and scale.
2. **Massive Global Distribution (Android, YouTube, Chrome)**: A structural advantage that compounds through network effects and scale.
3. **Full-Stack AI & Custom Silicon Infrastructure (TPU v5e/v6, DeepMind)**: Brand authority as the category definer creates pricing power and customer loyalty beyond specs.
Common Myth: AI Overviews will destroy Google's search ad business.
The Reality: AI Overviews increase search engagement and user queries, creating new high-intent monetization surfaces.
4. The Evolution: 6 Defining Milestones
1998 (Google Search founded by Larry Page and Sergey Brin) → 2004 (Gmail launch & Initial Public Offering (IPO)) → 2005 (Android acquisition & YouTube purchase (2006)) → 2015 (Alphabet Inc. corporate restructuring) → 2023 (DeepMind/Brain merger & Gemini AI launch) → 2025 (Waymo commercial scaling & Cloud AI profitability surge)
• **1998** — Google Search founded by Larry Page and Sergey Brin: *Revolutionized information organization and access*
• **2004** — Gmail launch & Initial Public Offering (IPO): *Redefined web email and unlocked public market capital*
• **2005** — Android acquisition & YouTube purchase (2006): *Established dominant mobile OS and online video platforms*
• **2015** — Alphabet Inc. corporate restructuring: *Separated core Google Search/Ads from 'Other Bets' like Waymo*
• **2023** — DeepMind/Brain merger & Gemini AI launch: *Consolidated AI research to launch native multimodal Gemini LLMs*
• **2025** — Waymo commercial scaling & Cloud AI profitability surge: *Proved commercial robotaxi leadership and AI Cloud momentum*
5. Financial Snapshot: Reading Behind the Numbers
• **Market Cap**: $2.2T
• **Revenue (TTM)**: $345B
• **P/E Ratio**: 24
• **Employees**: 181,000
These metrics reflect a company operating at massive scale, yet its valuation requires careful interpretation. A P/E of 24 is a pricing metric, not a guarantee of value — it reflects how aggressively the market prices in future growth, leaving little room for operational missteps.
Common Myth: Google Cloud is an unprofitable third-place player.
The Reality: Google Cloud is highly profitable ($1B+ operating income per quarter) and growing rapidly driven by enterprise AI workloads.
6. What Comes Next: Roadmap and Risks
With **over 20%** of revenue funneled back into R&D, Alphabet Inc. continues to expand across search dominance, ai research and adjacent markets. However, three distinct risks shadow its roadmap:
1. **DOJ Antitrust Remedies & Search Distribution Risks**: A material risk requiring continuous monitoring and strategic hedging.
2. **Generative AI Search Disruption (OpenAI, Perplexity)**: A material risk requiring continuous monitoring and strategic hedging.
3. **Heavy AI CapEx Intensity ($50B+ Annual) vs Cloud Monetization**: Any slowdown in infrastructure spending could cool demand for core products, particularly in capital-intensive segments.
Common Myth: Google doesn't return cash to shareholders.
The Reality: Alphabet initiated a quarterly dividend in 2024 alongside multi-billion-dollar share repurchase programs.
Quick Reference: Claim vs. Reality
| Popular Claim | Historical & Market Reality |
|---------------|-----------------------------|
| Google is falling behind in AI compared to OpenAI. | Google owns the full AI stack from custom TPUs to DeepMind algorithms, Gemini 2.0, and 2B+ user distribution touchpoints. |
| Waymo is just an expensive experiment. | Waymo is the undisputed leader in commercial autonomous rides, completing over 150,000 paid rides/week. |
| AI Overviews will destroy Google's search ad business. | AI Overviews increase search engagement and user queries, creating new high-intent monetization surfaces. |
| Google Cloud is an unprofitable third-place player. | Google Cloud is highly profitable ($1B+ operating income per quarter) and growing rapidly driven by enterprise AI workloads. |
| DOJ lawsuits will force immediate breakup of Alphabet. | Appeals and remedy negotiations take years; structural breakup is rare, though distribution contract modifications are expected. |
| Google doesn't return cash to shareholders. | Alphabet initiated a quarterly dividend in 2024 alongside multi-billion-dollar share repurchase programs. |
The Bottom Line: What This Means for You
• **If you are a consumer**: Today's products are the result of 26 years of architectural refinement, even if this category is no longer the primary revenue driver.
• **If you use search dominance daily**: Most tools you rely on run on this company's platform, though growing competition means future solutions will likely run on more diverse infrastructure.
• **If you are an investor**: A **$2.2T** valuation and **24 P/E** ratio signal immense market confidence, alongside significant downside risk if growth normalizes.
• **If you follow tech**: Real-world impact depends on supply chains and deployment timelines rather than keynote announcements.
## Sources
- Wikipedia
- Yahoo Finance
- Company Filings
- Industry Reports
- Wikimedia Commons
Did you know that $GOOGL (Alphabet Inc.)...?
Reading time: 3 minutes • Focus: Search Dominance, AI Research & Cloud Growth
The Short Version (TL;DR):
Alphabet Inc. did not achieve its market position by accident. Its $2.2T valuation reflects a calculated, multi-year strategy — though rising competition and elevated expectations mean its dominance faces real challenges.
Why Alphabet Inc. Matters to You
Every search, YouTube video, Android device, Google Maps route, and Cloud AI workload connects to Google's infrastructure — the invisible backbone of daily digital life and the global digital economy.
1. From Startup to Industry Titan
**Alphabet Inc.** was founded in **1998** in **Mountain View, California** by **Larry Page, Sergey Brin**. What started as a mission to organize the world's information and make it universally accessible has evolved into a defining force in search dominance, ai research and beyond. Today's market leadership is the payoff of a strategy decades in the making.
Common Myth: Google is falling behind in AI compared to OpenAI.
The Reality: Google owns the full AI stack from custom TPUs to DeepMind algorithms, Gemini 2.0, and 2B+ user distribution touchpoints.
2. The Pagerank + Distributed Compute Infrastructure That Changed Everything
**Alphabet Inc.** established its technical credibility with the **PageRank + distributed compute infrastructure**. This breakthrough was not a single product launch — it created the foundational platform that enabled the company's subsequent market dominance. The engineering decisions behind this innovation required years of R&D investment and represented a fundamental shift in how search dominance, ai research operates.
Common Myth: Waymo is just an expensive experiment.
The Reality: Waymo is the undisputed leader in commercial autonomous rides, completing over 150,000 paid rides/week.
3. Market Dominance and the Competitive Moat
Operating with a **$2.2T** market cap and **$345B** in trailing twelve-month revenue, Alphabet Inc.'s market position rests on three pillars:
1. **Search & Digital Ad Monopoly (90%+ Market Share)**: A structural advantage that compounds through network effects and scale.
2. **Massive Global Distribution (Android, YouTube, Chrome)**: A structural advantage that compounds through network effects and scale.
3. **Full-Stack AI & Custom Silicon Infrastructure (TPU v5e/v6, DeepMind)**: Brand authority as the category definer creates pricing power and customer loyalty beyond specs.
Common Myth: AI Overviews will destroy Google's search ad business.
The Reality: AI Overviews increase search engagement and user queries, creating new high-intent monetization surfaces.
4. The Evolution: 6 Defining Milestones
1998 (Google Search founded by Larry Page and Sergey Brin) → 2004 (Gmail launch & Initial Public Offering (IPO)) → 2005 (Android acquisition & YouTube purchase (2006)) → 2015 (Alphabet Inc. corporate restructuring) → 2023 (DeepMind/Brain merger & Gemini AI launch) → 2025 (Waymo commercial scaling & Cloud AI profitability surge)
• **1998** — Google Search founded by Larry Page and Sergey Brin: *Revolutionized information organization and access*
• **2004** — Gmail launch & Initial Public Offering (IPO): *Redefined web email and unlocked public market capital*
• **2005** — Android acquisition & YouTube purchase (2006): *Established dominant mobile OS and online video platforms*
• **2015** — Alphabet Inc. corporate restructuring: *Separated core Google Search/Ads from 'Other Bets' like Waymo*
• **2023** — DeepMind/Brain merger & Gemini AI launch: *Consolidated AI research to launch native multimodal Gemini LLMs*
• **2025** — Waymo commercial scaling & Cloud AI profitability surge: *Proved commercial robotaxi leadership and AI Cloud momentum*
5. Financial Snapshot: Reading Behind the Numbers
• **Market Cap**: $2.2T
• **Revenue (TTM)**: $345B
• **P/E Ratio**: 24
• **Employees**: 181,000
These metrics reflect a company operating at massive scale, yet its valuation requires careful interpretation. A P/E of 24 is a pricing metric, not a guarantee of value — it reflects how aggressively the market prices in future growth, leaving little room for operational missteps.
Common Myth: Google Cloud is an unprofitable third-place player.
The Reality: Google Cloud is highly profitable ($1B+ operating income per quarter) and growing rapidly driven by enterprise AI workloads.
6. What Comes Next: Roadmap and Risks
With **over 20%** of revenue funneled back into R&D, Alphabet Inc. continues to expand across search dominance, ai research and adjacent markets. However, three distinct risks shadow its roadmap:
1. **DOJ Antitrust Remedies & Search Distribution Risks**: A material risk requiring continuous monitoring and strategic hedging.
2. **Generative AI Search Disruption (OpenAI, Perplexity)**: A material risk requiring continuous monitoring and strategic hedging.
3. **Heavy AI CapEx Intensity ($50B+ Annual) vs Cloud Monetization**: Any slowdown in infrastructure spending could cool demand for core products, particularly in capital-intensive segments.
Common Myth: Google doesn't return cash to shareholders.
The Reality: Alphabet initiated a quarterly dividend in 2024 alongside multi-billion-dollar share repurchase programs.
Quick Reference: Claim vs. Reality
| Popular Claim | Historical & Market Reality |
|---------------|-----------------------------|
| Google is falling behind in AI compared to OpenAI. | Google owns the full AI stack from custom TPUs to DeepMind algorithms, Gemini 2.0, and 2B+ user distribution touchpoints. |
| Waymo is just an expensive experiment. | Waymo is the undisputed leader in commercial autonomous rides, completing over 150,000 paid rides/week. |
| AI Overviews will destroy Google's search ad business. | AI Overviews increase search engagement and user queries, creating new high-intent monetization surfaces. |
| Google Cloud is an unprofitable third-place player. | Google Cloud is highly profitable ($1B+ operating income per quarter) and growing rapidly driven by enterprise AI workloads. |
| DOJ lawsuits will force immediate breakup of Alphabet. | Appeals and remedy negotiations take years; structural breakup is rare, though distribution contract modifications are expected. |
| Google doesn't return cash to shareholders. | Alphabet initiated a quarterly dividend in 2024 alongside multi-billion-dollar share repurchase programs. |
The Bottom Line: What This Means for You
• **If you are a consumer**: Today's products are the result of 26 years of architectural refinement, even if this category is no longer the primary revenue driver.
• **If you use search dominance daily**: Most tools you rely on run on this company's platform, though growing competition means future solutions will likely run on more diverse infrastructure.
• **If you are an investor**: A **$2.2T** valuation and **24 P/E** ratio signal immense market confidence, alongside significant downside risk if growth normalizes.
• **If you follow tech**: Real-world impact depends on supply chains and deployment timelines rather than keynote announcements.
## Sources
- Wikipedia
- Yahoo Finance
- Company Filings
- Industry Reports
- Wikimedia Commons
The Short Version (TL;DR):
Alphabet Inc. did not achieve its market position by accident. Its $2.2T valuation reflects a calculated, multi-year strategy — though rising competition and elevated expectations mean its dominance faces real challenges.
Why Alphabet Inc. Matters to You
Every search, YouTube video, Android device, Google Maps route, and Cloud AI workload connects to Google's infrastructure — the invisible backbone of daily digital life and the global digital economy.
1. From Startup to Industry Titan
**Alphabet Inc.** was founded in **1998** in **Mountain View, California** by **Larry Page, Sergey Brin**. What started as a mission to organize the world's information and make it universally accessible has evolved into a defining force in search dominance, ai research and beyond. Today's market leadership is the payoff of a strategy decades in the making.
Common Myth: Google is falling behind in AI compared to OpenAI.
The Reality: Google owns the full AI stack from custom TPUs to DeepMind algorithms, Gemini 2.0, and 2B+ user distribution touchpoints.
2. The Pagerank + Distributed Compute Infrastructure That Changed Everything
**Alphabet Inc.** established its technical credibility with the **PageRank + distributed compute infrastructure**. This breakthrough was not a single product launch — it created the foundational platform that enabled the company's subsequent market dominance. The engineering decisions behind this innovation required years of R&D investment and represented a fundamental shift in how search dominance, ai research operates.
Common Myth: Waymo is just an expensive experiment.
The Reality: Waymo is the undisputed leader in commercial autonomous rides, completing over 150,000 paid rides/week.
3. Market Dominance and the Competitive Moat
Operating with a **$2.2T** market cap and **$345B** in trailing twelve-month revenue, Alphabet Inc.'s market position rests on three pillars:
1. **Search & Digital Ad Monopoly (90%+ Market Share)**: A structural advantage that compounds through network effects and scale.
2. **Massive Global Distribution (Android, YouTube, Chrome)**: A structural advantage that compounds through network effects and scale.
3. **Full-Stack AI & Custom Silicon Infrastructure (TPU v5e/v6, DeepMind)**: Brand authority as the category definer creates pricing power and customer loyalty beyond specs.
Common Myth: AI Overviews will destroy Google's search ad business.
The Reality: AI Overviews increase search engagement and user queries, creating new high-intent monetization surfaces.
4. The Evolution: 6 Defining Milestones
1998 (Google Search founded by Larry Page and Sergey Brin) → 2004 (Gmail launch & Initial Public Offering (IPO)) → 2005 (Android acquisition & YouTube purchase (2006)) → 2015 (Alphabet Inc. corporate restructuring) → 2023 (DeepMind/Brain merger & Gemini AI launch) → 2025 (Waymo commercial scaling & Cloud AI profitability surge)
• **1998** — Google Search founded by Larry Page and Sergey Brin: *Revolutionized information organization and access*
• **2004** — Gmail launch & Initial Public Offering (IPO): *Redefined web email and unlocked public market capital*
• **2005** — Android acquisition & YouTube purchase (2006): *Established dominant mobile OS and online video platforms*
• **2015** — Alphabet Inc. corporate restructuring: *Separated core Google Search/Ads from 'Other Bets' like Waymo*
• **2023** — DeepMind/Brain merger & Gemini AI launch: *Consolidated AI research to launch native multimodal Gemini LLMs*
• **2025** — Waymo commercial scaling & Cloud AI profitability surge: *Proved commercial robotaxi leadership and AI Cloud momentum*
5. Financial Snapshot: Reading Behind the Numbers
• **Market Cap**: $2.2T
• **Revenue (TTM)**: $345B
• **P/E Ratio**: 24
• **Employees**: 181,000
These metrics reflect a company operating at massive scale, yet its valuation requires careful interpretation. A P/E of 24 is a pricing metric, not a guarantee of value — it reflects how aggressively the market prices in future growth, leaving little room for operational missteps.
Common Myth: Google Cloud is an unprofitable third-place player.
The Reality: Google Cloud is highly profitable ($1B+ operating income per quarter) and growing rapidly driven by enterprise AI workloads.
6. What Comes Next: Roadmap and Risks
With **over 20%** of revenue funneled back into R&D, Alphabet Inc. continues to expand across search dominance, ai research and adjacent markets. However, three distinct risks shadow its roadmap:
1. **DOJ Antitrust Remedies & Search Distribution Risks**: A material risk requiring continuous monitoring and strategic hedging.
2. **Generative AI Search Disruption (OpenAI, Perplexity)**: A material risk requiring continuous monitoring and strategic hedging.
3. **Heavy AI CapEx Intensity ($50B+ Annual) vs Cloud Monetization**: Any slowdown in infrastructure spending could cool demand for core products, particularly in capital-intensive segments.
Common Myth: Google doesn't return cash to shareholders.
The Reality: Alphabet initiated a quarterly dividend in 2024 alongside multi-billion-dollar share repurchase programs.
Quick Reference: Claim vs. Reality
| Popular Claim | Historical & Market Reality |
|---------------|-----------------------------|
| Google is falling behind in AI compared to OpenAI. | Google owns the full AI stack from custom TPUs to DeepMind algorithms, Gemini 2.0, and 2B+ user distribution touchpoints. |
| Waymo is just an expensive experiment. | Waymo is the undisputed leader in commercial autonomous rides, completing over 150,000 paid rides/week. |
| AI Overviews will destroy Google's search ad business. | AI Overviews increase search engagement and user queries, creating new high-intent monetization surfaces. |
| Google Cloud is an unprofitable third-place player. | Google Cloud is highly profitable ($1B+ operating income per quarter) and growing rapidly driven by enterprise AI workloads. |
| DOJ lawsuits will force immediate breakup of Alphabet. | Appeals and remedy negotiations take years; structural breakup is rare, though distribution contract modifications are expected. |
| Google doesn't return cash to shareholders. | Alphabet initiated a quarterly dividend in 2024 alongside multi-billion-dollar share repurchase programs. |
The Bottom Line: What This Means for You
• **If you are a consumer**: Today's products are the result of 26 years of architectural refinement, even if this category is no longer the primary revenue driver.
• **If you use search dominance daily**: Most tools you rely on run on this company's platform, though growing competition means future solutions will likely run on more diverse infrastructure.
• **If you are an investor**: A **$2.2T** valuation and **24 P/E** ratio signal immense market confidence, alongside significant downside risk if growth normalizes.
• **If you follow tech**: Real-world impact depends on supply chains and deployment timelines rather than keynote announcements.
## Sources
- Wikipedia
- Yahoo Finance
- Company Filings
- Industry Reports
- Wikimedia Commons
GOOGL-1.84%
GOOGUS-0.93%
145
·
--
බෙයාරිෂ්
The world is overshadowed by an inflated economic bubble, impending disasters, geopolitical tensions between the West and the East (Russia/China), and wars. The imagery appears to reflect numerous outbreaks in 2007 that hadn't yet burst but were on the verge of doing so (the 2008 financial crisis, the precursors to the Arab Spring, the climate crisis).
#2027 #TheEconomist
The world is overshadowed by an inflated economic bubble, impending disasters, geopolitical tensions between the West and the East (Russia/China), and wars. The imagery appears to reflect numerous outbreaks in 2007 that hadn't yet burst but were on the verge of doing so (the 2008 financial crisis, the precursors to the Arab Spring, the climate crisis).
#2027 #TheEconomist
#2027 #TheEconomist

111
·
--
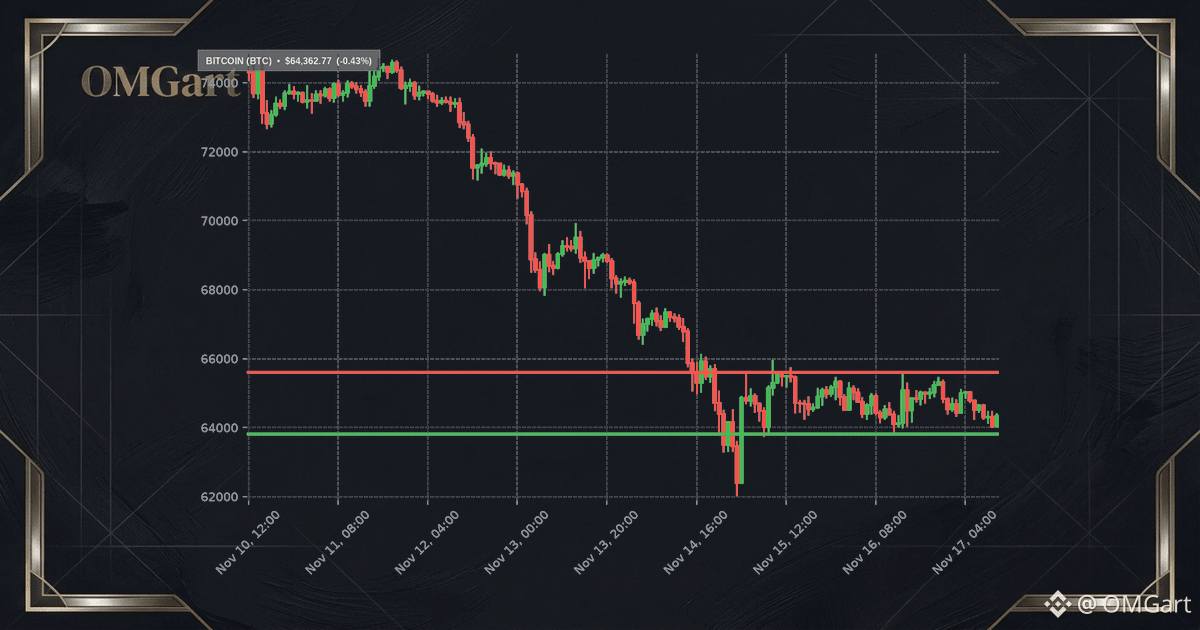
$BTC Update: Price is $64,362.77 (-0.43% 24h). Hawkish Fed and Middle East oil spike replicate 2022 tightening cycle where dollar strength crushed risk assets before policy pivot.
⚠️ Not Financial Advice. DYOR. Past performance ≠ future results.
$BTC Update: Price is $64,362.77 (-0.43% 24h). Hawkish Fed and Middle East oil spike replicate 2022 tightening cycle where dollar strength crushed risk assets before policy pivot.
⚠️ Not Financial Advice. DYOR. Past performance ≠ future results.
⚠️ Not Financial Advice. DYOR. Past performance ≠ future results.
382
·
--
ලිපිය
Did you know that $MSFT (Microsoft Corporation)...?Reading time: 3 minutes • Focus: Enterprise Software, Cloud Platform & AI Integration
The Short Version (TL;DR):
Microsoft Corporation did not achieve its market position by accident. Its $3.1T valuation reflects a calculated, multi-year strategy — though rising competition and elevated expectations mean its dominance faces real challenges.
Why Microsoft Corporation Matters to You
From Office documents to Azure cloud to GitHub code, Microsoft's platforms power how modern organizations work, build, and collaborate.
1. From Startup to Industry Titan
**Microsoft Corporation** was founded in **1975** in **Redmond, Washington** by **Bill Gates, Paul Allen**. What started as a mission to put a computer on every desk and in every home has evolved into a defining force in enterprise software, cloud platform and beyond. Today's market leadership is the payoff of a strategy decades in the making.
Common Myth: Success was accidental.
The Reality: Result of deliberate long-term strategy.
2. The Windows + Office Ecosystem + Azure Cloud That Changed Everything
**Microsoft Corporation** established its technical credibility with the **Windows + Office ecosystem + Azure cloud**. This breakthrough was not a single product launch — it created the foundational platform that enabled the company's subsequent market dominance. The engineering decisions behind this innovation required years of R&D investment and represented a fundamental shift in how enterprise software, cloud platform operates.
Common Myth: They invented the core technology.
The Reality: Commercialized and scaled existing concepts.
3. Market Dominance and the Competitive Moat
Operating with a **$3.1T** market cap and **$245B** in trailing twelve-month revenue, Microsoft Corporation's market position rests on three pillars:
1. **Enterprise Lock-in (Office/Windows)**: Developers and customers face steep switching costs when considering alternatives.
2. **Azure Hybrid Cloud**: A structural advantage that compounds through network effects and scale.
3. **Developer Ecosystem (GitHub/VS Code)**: Developers and customers face steep switching costs when considering alternatives.
Common Myth: Lock-in is unbreakable.
The Reality: Alternatives are emerging despite switching costs.
4. The Evolution: 5 Defining Milestones
1975 (Microsoft founded) → 1985 (Windows 1.0 launch) → 2001 (Xbox launch) → 2010 (Azure cloud platform launch) → 2016 (LinkedIn acquisition)
• **1975** — Microsoft founded: *Beginning of the PC software era*
• **1985** — Windows 1.0 launch: *GUI on IBM PC compatibles*
• **2001** — Xbox launch: *Entry into gaming console market*
• **2010** — Azure cloud platform launch: *Major cloud computing player*
• **2016** — LinkedIn acquisition: *Professional network integration*
5. Financial Snapshot: Reading Behind the Numbers
• **Market Cap**: $3.1T
• **Revenue (TTM)**: $245B
• **P/E Ratio**: 35
• **Employees**: 221,000
These metrics reflect a company operating at massive scale, yet its valuation requires careful interpretation. A P/E of 35 is a pricing metric, not a guarantee of value — it reflects how aggressively the market prices in future growth, leaving little room for operational missteps.
Common Myth: High P/E guarantees growth.
The Reality: Prices in expectations; valuation risk is real.
6. What Comes Next: Roadmap and Risks
With **over 20%** of revenue funneled back into R&D, Microsoft Corporation continues to expand across enterprise software, cloud platform and adjacent markets. However, three distinct risks shadow its roadmap:
1. **Cloud Growth Deceleration**: A material risk requiring continuous monitoring and strategic hedging.
2. **Activision Integration Risk**: A material risk requiring continuous monitoring and strategic hedging.
3. **OpenAI Partnership Dependency**: Strategic decision-making and public perception are unusually tied to a single individual, creating governance and succession risk.
Common Myth: They operate quietly.
The Reality: They operate at the center of global attention.
Quick Reference: Claim vs. Reality
| Popular Claim | Historical & Market Reality |
|---------------|-----------------------------|
| Success was accidental. | Result of deliberate long-term strategy. |
| They invented the core technology. | Commercialized and scaled existing concepts. |
| Lock-in is unbreakable. | Alternatives are emerging despite switching costs. |
| High P/E guarantees growth. | Prices in expectations; valuation risk is real. |
| Regulators ignore leaders. | Scrutiny intensifies with market dominance. |
| They operate quietly. | They operate at the center of global attention. |
The Bottom Line: What This Means for You
• **If you are a consumer**: Today's products are the result of 49 years of architectural refinement, even if this category is no longer the primary revenue driver.
• **If you use enterprise software daily**: Most tools you rely on run on this company's platform, though growing competition means future solutions will likely run on more diverse infrastructure.
• **If you are an investor**: A **$3.1T** valuation and **35 P/E** ratio signal immense market confidence, alongside significant downside risk if growth normalizes.
• **If you follow tech**: Real-world impact depends on supply chains and deployment timelines rather than keynote announcements.
$MSFT
## Sources
- Microsoft Annual Report (Form 10-K) FY2025
- SEC EDGAR Filings (8-K, 10-Q)
- Microsoft Investor Relations (microsoft.com/investor)
- Azure & AI Platform Revenue Disclosures
- Activision Blizzard Acquisition Filings
Did you know that $MSFT (Microsoft Corporation)...?
Reading time: 3 minutes • Focus: Enterprise Software, Cloud Platform & AI Integration
The Short Version (TL;DR):
Microsoft Corporation did not achieve its market position by accident. Its $3.1T valuation reflects a calculated, multi-year strategy — though rising competition and elevated expectations mean its dominance faces real challenges.
Why Microsoft Corporation Matters to You
From Office documents to Azure cloud to GitHub code, Microsoft's platforms power how modern organizations work, build, and collaborate.
1. From Startup to Industry Titan
**Microsoft Corporation** was founded in **1975** in **Redmond, Washington** by **Bill Gates, Paul Allen**. What started as a mission to put a computer on every desk and in every home has evolved into a defining force in enterprise software, cloud platform and beyond. Today's market leadership is the payoff of a strategy decades in the making.
Common Myth: Success was accidental.
The Reality: Result of deliberate long-term strategy.
2. The Windows + Office Ecosystem + Azure Cloud That Changed Everything
**Microsoft Corporation** established its technical credibility with the **Windows + Office ecosystem + Azure cloud**. This breakthrough was not a single product launch — it created the foundational platform that enabled the company's subsequent market dominance. The engineering decisions behind this innovation required years of R&D investment and represented a fundamental shift in how enterprise software, cloud platform operates.
Common Myth: They invented the core technology.
The Reality: Commercialized and scaled existing concepts.
3. Market Dominance and the Competitive Moat
Operating with a **$3.1T** market cap and **$245B** in trailing twelve-month revenue, Microsoft Corporation's market position rests on three pillars:
1. **Enterprise Lock-in (Office/Windows)**: Developers and customers face steep switching costs when considering alternatives.
2. **Azure Hybrid Cloud**: A structural advantage that compounds through network effects and scale.
3. **Developer Ecosystem (GitHub/VS Code)**: Developers and customers face steep switching costs when considering alternatives.
Common Myth: Lock-in is unbreakable.
The Reality: Alternatives are emerging despite switching costs.
4. The Evolution: 5 Defining Milestones
1975 (Microsoft founded) → 1985 (Windows 1.0 launch) → 2001 (Xbox launch) → 2010 (Azure cloud platform launch) → 2016 (LinkedIn acquisition)
• **1975** — Microsoft founded: *Beginning of the PC software era*
• **1985** — Windows 1.0 launch: *GUI on IBM PC compatibles*
• **2001** — Xbox launch: *Entry into gaming console market*
• **2010** — Azure cloud platform launch: *Major cloud computing player*
• **2016** — LinkedIn acquisition: *Professional network integration*
5. Financial Snapshot: Reading Behind the Numbers
• **Market Cap**: $3.1T
• **Revenue (TTM)**: $245B
• **P/E Ratio**: 35
• **Employees**: 221,000
These metrics reflect a company operating at massive scale, yet its valuation requires careful interpretation. A P/E of 35 is a pricing metric, not a guarantee of value — it reflects how aggressively the market prices in future growth, leaving little room for operational missteps.
Common Myth: High P/E guarantees growth.
The Reality: Prices in expectations; valuation risk is real.
6. What Comes Next: Roadmap and Risks
With **over 20%** of revenue funneled back into R&D, Microsoft Corporation continues to expand across enterprise software, cloud platform and adjacent markets. However, three distinct risks shadow its roadmap:
1. **Cloud Growth Deceleration**: A material risk requiring continuous monitoring and strategic hedging.
2. **Activision Integration Risk**: A material risk requiring continuous monitoring and strategic hedging.
3. **OpenAI Partnership Dependency**: Strategic decision-making and public perception are unusually tied to a single individual, creating governance and succession risk.
Common Myth: They operate quietly.
The Reality: They operate at the center of global attention.
Quick Reference: Claim vs. Reality
| Popular Claim | Historical & Market Reality |
|---------------|-----------------------------|
| Success was accidental. | Result of deliberate long-term strategy. |
| They invented the core technology. | Commercialized and scaled existing concepts. |
| Lock-in is unbreakable. | Alternatives are emerging despite switching costs. |
| High P/E guarantees growth. | Prices in expectations; valuation risk is real. |
| Regulators ignore leaders. | Scrutiny intensifies with market dominance. |
| They operate quietly. | They operate at the center of global attention. |
The Bottom Line: What This Means for You
• **If you are a consumer**: Today's products are the result of 49 years of architectural refinement, even if this category is no longer the primary revenue driver.
• **If you use enterprise software daily**: Most tools you rely on run on this company's platform, though growing competition means future solutions will likely run on more diverse infrastructure.
• **If you are an investor**: A **$3.1T** valuation and **35 P/E** ratio signal immense market confidence, alongside significant downside risk if growth normalizes.
• **If you follow tech**: Real-world impact depends on supply chains and deployment timelines rather than keynote announcements.
$MSFT
## Sources
- Microsoft Annual Report (Form 10-K) FY2025
- SEC EDGAR Filings (8-K, 10-Q)
- Microsoft Investor Relations (microsoft.com/investor)
- Azure & AI Platform Revenue Disclosures
- Activision Blizzard Acquisition Filings
The Short Version (TL;DR):
Microsoft Corporation did not achieve its market position by accident. Its $3.1T valuation reflects a calculated, multi-year strategy — though rising competition and elevated expectations mean its dominance faces real challenges.
Why Microsoft Corporation Matters to You
From Office documents to Azure cloud to GitHub code, Microsoft's platforms power how modern organizations work, build, and collaborate.
1. From Startup to Industry Titan
**Microsoft Corporation** was founded in **1975** in **Redmond, Washington** by **Bill Gates, Paul Allen**. What started as a mission to put a computer on every desk and in every home has evolved into a defining force in enterprise software, cloud platform and beyond. Today's market leadership is the payoff of a strategy decades in the making.
Common Myth: Success was accidental.
The Reality: Result of deliberate long-term strategy.
2. The Windows + Office Ecosystem + Azure Cloud That Changed Everything
**Microsoft Corporation** established its technical credibility with the **Windows + Office ecosystem + Azure cloud**. This breakthrough was not a single product launch — it created the foundational platform that enabled the company's subsequent market dominance. The engineering decisions behind this innovation required years of R&D investment and represented a fundamental shift in how enterprise software, cloud platform operates.
Common Myth: They invented the core technology.
The Reality: Commercialized and scaled existing concepts.
3. Market Dominance and the Competitive Moat
Operating with a **$3.1T** market cap and **$245B** in trailing twelve-month revenue, Microsoft Corporation's market position rests on three pillars:
1. **Enterprise Lock-in (Office/Windows)**: Developers and customers face steep switching costs when considering alternatives.
2. **Azure Hybrid Cloud**: A structural advantage that compounds through network effects and scale.
3. **Developer Ecosystem (GitHub/VS Code)**: Developers and customers face steep switching costs when considering alternatives.
Common Myth: Lock-in is unbreakable.
The Reality: Alternatives are emerging despite switching costs.
4. The Evolution: 5 Defining Milestones
1975 (Microsoft founded) → 1985 (Windows 1.0 launch) → 2001 (Xbox launch) → 2010 (Azure cloud platform launch) → 2016 (LinkedIn acquisition)
• **1975** — Microsoft founded: *Beginning of the PC software era*
• **1985** — Windows 1.0 launch: *GUI on IBM PC compatibles*
• **2001** — Xbox launch: *Entry into gaming console market*
• **2010** — Azure cloud platform launch: *Major cloud computing player*
• **2016** — LinkedIn acquisition: *Professional network integration*
5. Financial Snapshot: Reading Behind the Numbers
• **Market Cap**: $3.1T
• **Revenue (TTM)**: $245B
• **P/E Ratio**: 35
• **Employees**: 221,000
These metrics reflect a company operating at massive scale, yet its valuation requires careful interpretation. A P/E of 35 is a pricing metric, not a guarantee of value — it reflects how aggressively the market prices in future growth, leaving little room for operational missteps.
Common Myth: High P/E guarantees growth.
The Reality: Prices in expectations; valuation risk is real.
6. What Comes Next: Roadmap and Risks
With **over 20%** of revenue funneled back into R&D, Microsoft Corporation continues to expand across enterprise software, cloud platform and adjacent markets. However, three distinct risks shadow its roadmap:
1. **Cloud Growth Deceleration**: A material risk requiring continuous monitoring and strategic hedging.
2. **Activision Integration Risk**: A material risk requiring continuous monitoring and strategic hedging.
3. **OpenAI Partnership Dependency**: Strategic decision-making and public perception are unusually tied to a single individual, creating governance and succession risk.
Common Myth: They operate quietly.
The Reality: They operate at the center of global attention.
Quick Reference: Claim vs. Reality
| Popular Claim | Historical & Market Reality |
|---------------|-----------------------------|
| Success was accidental. | Result of deliberate long-term strategy. |
| They invented the core technology. | Commercialized and scaled existing concepts. |
| Lock-in is unbreakable. | Alternatives are emerging despite switching costs. |
| High P/E guarantees growth. | Prices in expectations; valuation risk is real. |
| Regulators ignore leaders. | Scrutiny intensifies with market dominance. |
| They operate quietly. | They operate at the center of global attention. |
The Bottom Line: What This Means for You
• **If you are a consumer**: Today's products are the result of 49 years of architectural refinement, even if this category is no longer the primary revenue driver.
• **If you use enterprise software daily**: Most tools you rely on run on this company's platform, though growing competition means future solutions will likely run on more diverse infrastructure.
• **If you are an investor**: A **$3.1T** valuation and **35 P/E** ratio signal immense market confidence, alongside significant downside risk if growth normalizes.
• **If you follow tech**: Real-world impact depends on supply chains and deployment timelines rather than keynote announcements.
$MSFT
## Sources
- Microsoft Annual Report (Form 10-K) FY2025
- SEC EDGAR Filings (8-K, 10-Q)
- Microsoft Investor Relations (microsoft.com/investor)
- Azure & AI Platform Revenue Disclosures
- Activision Blizzard Acquisition Filings
46
·
--
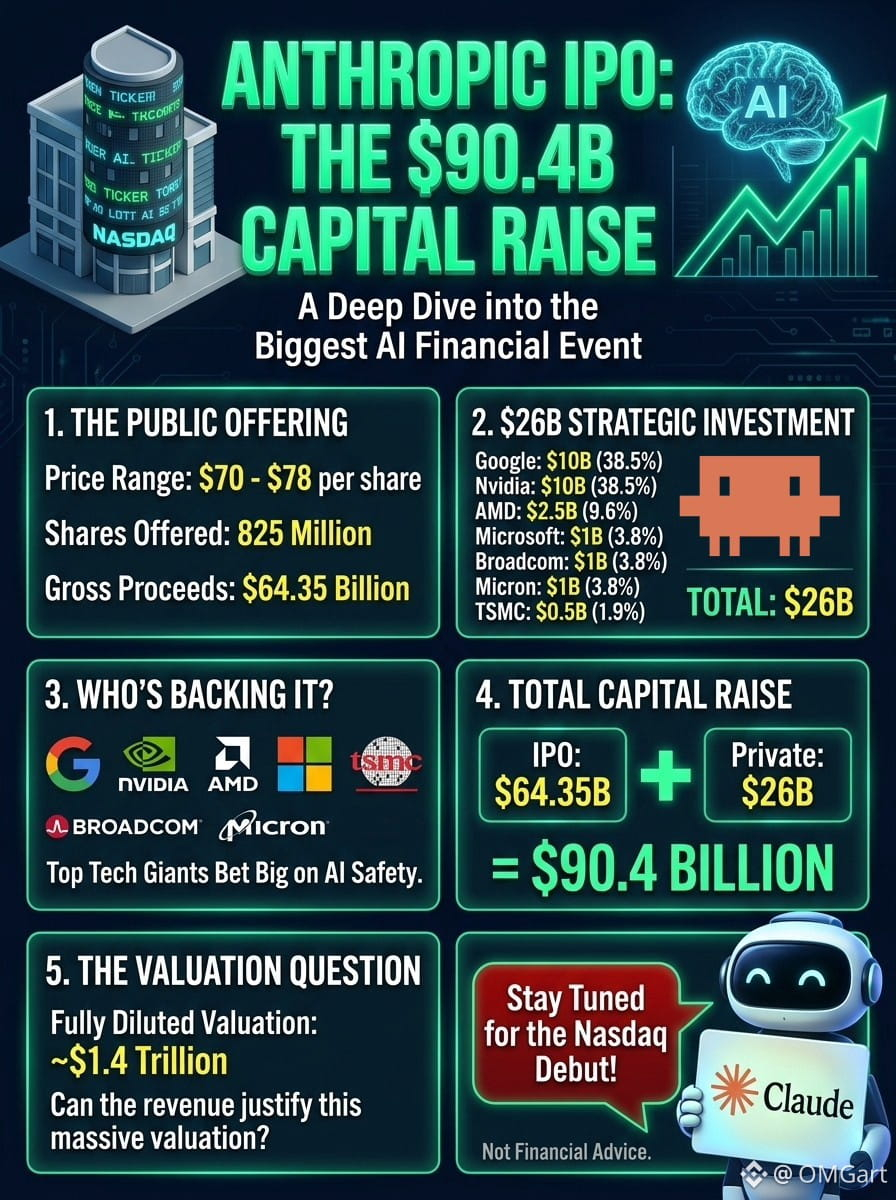
AI Tokenized Equity is the next major frontier 🚀 Binance keeps expanding tokenized equities ($CRMB, $GPROB, $ADBEB) while global market attention builds around . On-chain tokenized stocks are bridging Wall Street AI giants with 24/7 crypto liquidity. ⚠️ Not Financial Advice. DYOR. Past performance ≠ future results.
AI Tokenized Equity is the next major frontier 🚀 Binance keeps expanding tokenized equities ($CRMB , $GPROB , $ADBEB ) while global market attention builds around . On-chain tokenized stocks are bridging Wall Street AI giants with 24/7 crypto liquidity. ⚠️ Not Financial Advice. DYOR. Past performance ≠ future results.
2
159
·
--
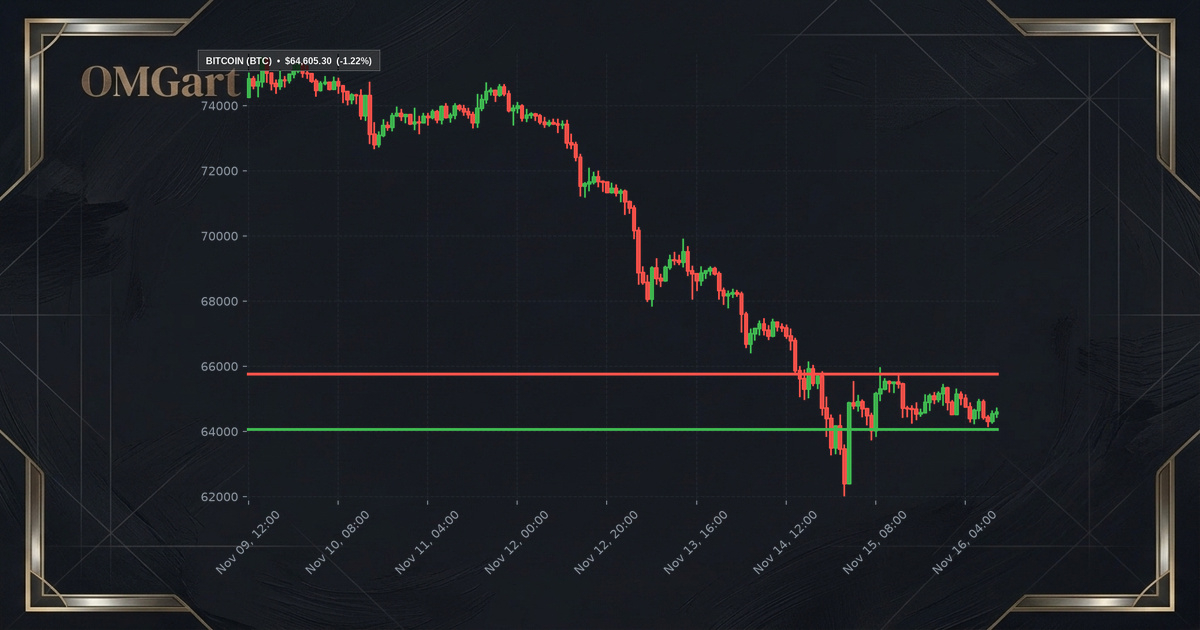
$BTC Update: Price is $64,605.30 (-1.22% 24h). Bitcoin consolidates near recent highs as leverage flushes mirror the August carry unwind pattern where brief dips preceded strong recoveries driven by renewed spot demand.
⚠️ Not Financial Advice. DYOR. Past performance ≠ future results.
$BTC Update: Price is $64,605.30 (-1.22% 24h). Bitcoin consolidates near recent highs as leverage flushes mirror the August carry unwind pattern where brief dips preceded strong recoveries driven by renewed spot demand.
⚠️ Not Financial Advice. DYOR. Past performance ≠ future results.
⚠️ Not Financial Advice. DYOR. Past performance ≠ future results.
126
·
--
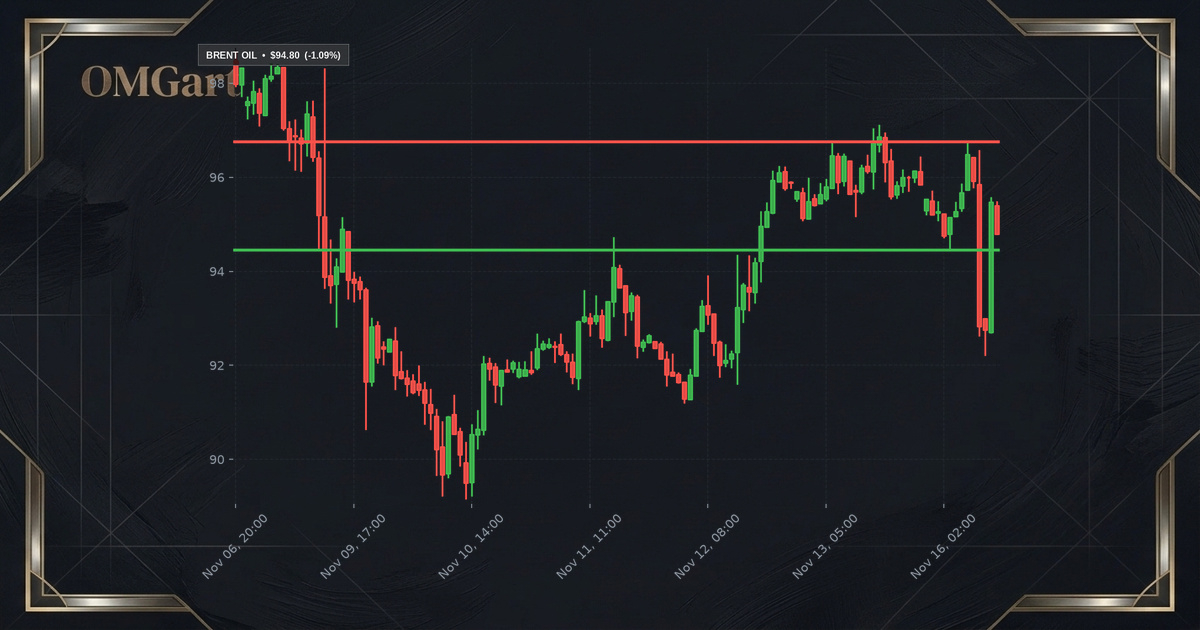
Oil Update: $Brent $94.80 (-1.09% 24h), WTI $87.75. OPEC+ supply discipline balances ongoing geopolitical risks while a strengthening USD and softening global demand outlook exert downward pressure on crude markets.
$USOIL
⚠️ Not Financial Advice. DYOR. Past performance ≠ future results.
Oil Update: $Brent $94.80 (-1.09% 24h), WTI $87.75. OPEC+ supply discipline balances ongoing geopolitical risks while a strengthening USD and softening global demand outlook exert downward pressure on crude markets.
$USOIL
⚠️ Not Financial Advice. DYOR. Past performance ≠ future results.
$USOIL
⚠️ Not Financial Advice. DYOR. Past performance ≠ future results.
271
·
--
ලිපිය
Did you know that $AAPL (Apple Inc.)...?Reading time: 6 minutes • Focus: Tech History, Silicon Roadmap & Services Growth
The Short Version (TL;DR):
Apple Inc. did not reach its $5.2 trillion valuation by accident, nor was its rise solely driven by the iPhone. Its enduring dominance is the result of a relentless integration of custom silicon, hardware design, and a high-margin services ecosystem—though regulatory headwinds and mature upgrade cycles present ongoing challenges.
Much of the narrative surrounding Apple online is either overly romanticized or stripped of its economic context. Below is a grounded look at the company's 50-year trajectory, separating verifiable milestones from common industry misconceptions.
Why Apple Matters to You
Whether you are typing on a MacBook powered by M-series silicon, communicating via an iPhone, or subscribing to iCloud and Apple Music, Apple's hardware and software touch billions of daily lives. Understanding how the company achieved this scale requires looking past marketing keynotes and examining the architectural and financial moats that lock users into its ecosystem.
1. From a Cupertino Garage to a Trillion-Dollar Titan
Founded in 1976 in Cupertino, California, by Steve Jobs, Steve Wozniak, and Ronald Wayne, Apple started with a modest vision: bringing accessible computing power to everyday people. Today's identity as a global consumer electronics and services giant is the payoff of decades of iterative design and bold strategic pivots.
Common Myth: Apple is merely a consumer hardware manufacturer dependent on phone upgrades.
The Reality: Apple operates a massive high-margin services ecosystem generating over $123B annually, anchoring user retention and driving recurring cash flows.
2. The Technology That Changed Everything
Apple transformed personal computing with the Macintosh in 1984, popularized digital media with the iPod in 2001, and revolutionized global communications with the iPhone in 2007. More recently, the historic transition from Intel processors to custom Apple Silicon (M1, M3, M4) redefined industry standards for performance and energy efficiency.
Common Myth: Apple's transition from Intel to M-series silicon was a minor supplier switch.
The Reality: Custom Apple Silicon represents a foundational architectural moat, delivering industry-leading energy efficiency and performance-per-watt superiority.
3. Market Dominance and the Competitive Moat
Operating with a $5.2 trillion market cap and $478.8 billion in trailing twelve-month revenue, Apple's market position rests on three pillars:
• Ecosystem Lock-in: Seamless integration across iOS, macOS, iPadOS, and wearables creates formidable switching costs.
• Silicon Leadership: Proprietary M-series architecture provides unmatched computing efficiency.
• Services Scale: A high-margin software and subscription division that softens hardware cycle volatility.
Common Myth: EU regulatory mandates like the Digital Markets Act will destroy Apple's App Store business.
The Reality: While EU side-loading and alternative app marketplaces create compliance headwinds, Apple's global services revenue continues robust double-digit expansion.
4. The Evolution: Six Defining Milestones
Apple's historic trajectory follows a clear, sequential chain of engineering milestones:
1976 (Apple I) → 1984 (Macintosh) → 2001 (iPod) → 2007 (iPhone) → 2020 (Apple Silicon) → 2024 (Vision Pro)
• 1976 — Apple I: Initiated the personal computer revolution from a garage in Los Altos.
• 1984 — Macintosh: Popularized the graphical user interface and computer mouse.
• 2001 — iPod: Reshaped the music industry and established consumer electronics leadership.
• 2007 — iPhone: Redefined global mobile telecommunications and created the modern app economy.
• 2020 — Apple Silicon M1: Broke away from Intel to deliver breakthrough performance-per-watt.
• 2024 — Vision Pro: Pioneered high-end spatial computing and advanced micro-OLED display engineering.
Common Myth: The Apple Vision Pro was a failed experiment with no long-term strategic value.
The Reality: Vision Pro established Apple's spatial computing foundation and advanced micro-OLED display engineering for future lightweight AR devices.
5. Financial Snapshot: Reading Behind the Numbers
At a glance, Apple's financial scale is staggering, supported by massive free cash flow and disciplined capital allocation:
• Market Cap: $5.2 Trillion
• Revenue (TTM): $478.8 Billion
• P/E Ratio: 39.6
• Employees: 167,000
Common Myth: Apple's massive share buyback program is a sign of stagnant internal innovation.
The Reality: Apple deployed over $450B in buybacks over recent years while simultaneously increasing R&D spending to record highs above $45B.
6. What Comes Next: Roadmap and Risks
With annual R&D expenditures surging past $45 billion, Apple continues to invest in generative AI (Apple Intelligence), advanced silicon, and spatial computing. However, three distinct risks shadow its roadmap:
1. Regulatory Scrutiny: Antitrust actions from the U.S. DOJ and EU Digital Markets Act challenge App Store commissions and default search arrangements.
2. Geographic Exposure: Economic volatility and intense domestic competition in Greater China pose headwinds for iPhone volumes.
3. Mature Upgrade Cycles: Slower hardware upgrade cadences require services expansion to maintain top-line growth.
Common Myth: Apple missed the artificial intelligence wave by ignoring generative AI.
The Reality: Apple Intelligence integrates privacy-focused on-device and private cloud foundation models across hundreds of millions of active devices.
Quick Reference: Claim vs. Reality
Popular Claim | Historical & Market Reality
-- | --
Apple is just a hardware maker. | Services revenue exceeds $123B annually with high operating margins.
M-series is a basic supplier switch. | Custom silicon provides an unmatched performance-per-watt moat.
EU DMA will destroy the App Store. | Global services growth continues robustly despite regulatory compliance adjustments.
Vision Pro was a failed experiment. | It established spatial computing foundations and micro-OLED engineering.
Buybacks signal stagnant innovation. | Apple combines massive share repurchases with record R&D investments above $45B.
Apple missed the AI boom. | Apple Intelligence deploys privacy-first foundation models across active devices.
The Bottom Line: What This Means for You
• If you are an Apple user: Your devices benefit from decades of hardware-software integration and custom silicon efficiency, though ecosystem lock-in remains tight.
• If you are an app developer: Navigating alternative app marketplaces and regulatory changes requires adapting to a shifting compliance landscape.
• If you are an investor: A $5.2T valuation reflects elite cash flow generation and capital return, tempered by regulatory risks and growth rates in mature markets.
• If you follow tech: Apple's long-term trajectory depends on executing its spatial computing and privacy-first AI strategies.
## Sources
- Apple Inc. FY2026 Form 10-K (SEC EDGAR)
- Apple Inc. Q4 FY2026 Press Release
- StockRow Financial Analytics
- The Filing Desk Corporate Financials
- Fox Business Market Data
Did you know that $AAPL (Apple Inc.)...?
Reading time: 6 minutes • Focus: Tech History, Silicon Roadmap & Services Growth
The Short Version (TL;DR):
Apple Inc. did not reach its $5.2 trillion valuation by accident, nor was its rise solely driven by the iPhone. Its enduring dominance is the result of a relentless integration of custom silicon, hardware design, and a high-margin services ecosystem—though regulatory headwinds and mature upgrade cycles present ongoing challenges.
Much of the narrative surrounding Apple online is either overly romanticized or stripped of its economic context. Below is a grounded look at the company's 50-year trajectory, separating verifiable milestones from common industry misconceptions.
Why Apple Matters to You
Whether you are typing on a MacBook powered by M-series silicon, communicating via an iPhone, or subscribing to iCloud and Apple Music, Apple's hardware and software touch billions of daily lives. Understanding how the company achieved this scale requires looking past marketing keynotes and examining the architectural and financial moats that lock users into its ecosystem.
1. From a Cupertino Garage to a Trillion-Dollar Titan
Founded in 1976 in Cupertino, California, by Steve Jobs, Steve Wozniak, and Ronald Wayne, Apple started with a modest vision: bringing accessible computing power to everyday people. Today's identity as a global consumer electronics and services giant is the payoff of decades of iterative design and bold strategic pivots.
Common Myth: Apple is merely a consumer hardware manufacturer dependent on phone upgrades.
The Reality: Apple operates a massive high-margin services ecosystem generating over $123B annually, anchoring user retention and driving recurring cash flows.
2. The Technology That Changed Everything
Apple transformed personal computing with the Macintosh in 1984, popularized digital media with the iPod in 2001, and revolutionized global communications with the iPhone in 2007. More recently, the historic transition from Intel processors to custom Apple Silicon (M1, M3, M4) redefined industry standards for performance and energy efficiency.
Common Myth: Apple's transition from Intel to M-series silicon was a minor supplier switch.
The Reality: Custom Apple Silicon represents a foundational architectural moat, delivering industry-leading energy efficiency and performance-per-watt superiority.
3. Market Dominance and the Competitive Moat
Operating with a $5.2 trillion market cap and $478.8 billion in trailing twelve-month revenue, Apple's market position rests on three pillars:
• Ecosystem Lock-in: Seamless integration across iOS, macOS, iPadOS, and wearables creates formidable switching costs.
• Silicon Leadership: Proprietary M-series architecture provides unmatched computing efficiency.
• Services Scale: A high-margin software and subscription division that softens hardware cycle volatility.
Common Myth: EU regulatory mandates like the Digital Markets Act will destroy Apple's App Store business.
The Reality: While EU side-loading and alternative app marketplaces create compliance headwinds, Apple's global services revenue continues robust double-digit expansion.
4. The Evolution: Six Defining Milestones
Apple's historic trajectory follows a clear, sequential chain of engineering milestones:
1976 (Apple I) → 1984 (Macintosh) → 2001 (iPod) → 2007 (iPhone) → 2020 (Apple Silicon) → 2024 (Vision Pro)
• 1976 — Apple I: Initiated the personal computer revolution from a garage in Los Altos.
• 1984 — Macintosh: Popularized the graphical user interface and computer mouse.
• 2001 — iPod: Reshaped the music industry and established consumer electronics leadership.
• 2007 — iPhone: Redefined global mobile telecommunications and created the modern app economy.
• 2020 — Apple Silicon M1: Broke away from Intel to deliver breakthrough performance-per-watt.
• 2024 — Vision Pro: Pioneered high-end spatial computing and advanced micro-OLED display engineering.
Common Myth: The Apple Vision Pro was a failed experiment with no long-term strategic value.
The Reality: Vision Pro established Apple's spatial computing foundation and advanced micro-OLED display engineering for future lightweight AR devices.
5. Financial Snapshot: Reading Behind the Numbers
At a glance, Apple's financial scale is staggering, supported by massive free cash flow and disciplined capital allocation:
• Market Cap: $5.2 Trillion
• Revenue (TTM): $478.8 Billion
• P/E Ratio: 39.6
• Employees: 167,000
Common Myth: Apple's massive share buyback program is a sign of stagnant internal innovation.
The Reality: Apple deployed over $450B in buybacks over recent years while simultaneously increasing R&D spending to record highs above $45B.
6. What Comes Next: Roadmap and Risks
With annual R&D expenditures surging past $45 billion, Apple continues to invest in generative AI (Apple Intelligence), advanced silicon, and spatial computing. However, three distinct risks shadow its roadmap:
1. Regulatory Scrutiny: Antitrust actions from the U.S. DOJ and EU Digital Markets Act challenge App Store commissions and default search arrangements.
2. Geographic Exposure: Economic volatility and intense domestic competition in Greater China pose headwinds for iPhone volumes.
3. Mature Upgrade Cycles: Slower hardware upgrade cadences require services expansion to maintain top-line growth.
Common Myth: Apple missed the artificial intelligence wave by ignoring generative AI.
The Reality: Apple Intelligence integrates privacy-focused on-device and private cloud foundation models across hundreds of millions of active devices.
Quick Reference: Claim vs. Reality
Popular Claim | Historical & Market Reality
-- | --
Apple is just a hardware maker. | Services revenue exceeds $123B annually with high operating margins.
M-series is a basic supplier switch. | Custom silicon provides an unmatched performance-per-watt moat.
EU DMA will destroy the App Store. | Global services growth continues robustly despite regulatory compliance adjustments.
Vision Pro was a failed experiment. | It established spatial computing foundations and micro-OLED engineering.
Buybacks signal stagnant innovation. | Apple combines massive share repurchases with record R&D investments above $45B.
Apple missed the AI boom. | Apple Intelligence deploys privacy-first foundation models across active devices.
The Bottom Line: What This Means for You
• If you are an Apple user: Your devices benefit from decades of hardware-software integration and custom silicon efficiency, though ecosystem lock-in remains tight.
• If you are an app developer: Navigating alternative app marketplaces and regulatory changes requires adapting to a shifting compliance landscape.
• If you are an investor: A $5.2T valuation reflects elite cash flow generation and capital return, tempered by regulatory risks and growth rates in mature markets.
• If you follow tech: Apple's long-term trajectory depends on executing its spatial computing and privacy-first AI strategies.
## Sources
- Apple Inc. FY2026 Form 10-K (SEC EDGAR)
- Apple Inc. Q4 FY2026 Press Release
- StockRow Financial Analytics
- The Filing Desk Corporate Financials
- Fox Business Market Data
The Short Version (TL;DR):
Apple Inc. did not reach its $5.2 trillion valuation by accident, nor was its rise solely driven by the iPhone. Its enduring dominance is the result of a relentless integration of custom silicon, hardware design, and a high-margin services ecosystem—though regulatory headwinds and mature upgrade cycles present ongoing challenges.
Much of the narrative surrounding Apple online is either overly romanticized or stripped of its economic context. Below is a grounded look at the company's 50-year trajectory, separating verifiable milestones from common industry misconceptions.
Why Apple Matters to You
Whether you are typing on a MacBook powered by M-series silicon, communicating via an iPhone, or subscribing to iCloud and Apple Music, Apple's hardware and software touch billions of daily lives. Understanding how the company achieved this scale requires looking past marketing keynotes and examining the architectural and financial moats that lock users into its ecosystem.
1. From a Cupertino Garage to a Trillion-Dollar Titan
Founded in 1976 in Cupertino, California, by Steve Jobs, Steve Wozniak, and Ronald Wayne, Apple started with a modest vision: bringing accessible computing power to everyday people. Today's identity as a global consumer electronics and services giant is the payoff of decades of iterative design and bold strategic pivots.
Common Myth: Apple is merely a consumer hardware manufacturer dependent on phone upgrades.
The Reality: Apple operates a massive high-margin services ecosystem generating over $123B annually, anchoring user retention and driving recurring cash flows.
2. The Technology That Changed Everything
Apple transformed personal computing with the Macintosh in 1984, popularized digital media with the iPod in 2001, and revolutionized global communications with the iPhone in 2007. More recently, the historic transition from Intel processors to custom Apple Silicon (M1, M3, M4) redefined industry standards for performance and energy efficiency.
Common Myth: Apple's transition from Intel to M-series silicon was a minor supplier switch.
The Reality: Custom Apple Silicon represents a foundational architectural moat, delivering industry-leading energy efficiency and performance-per-watt superiority.
3. Market Dominance and the Competitive Moat
Operating with a $5.2 trillion market cap and $478.8 billion in trailing twelve-month revenue, Apple's market position rests on three pillars:
• Ecosystem Lock-in: Seamless integration across iOS, macOS, iPadOS, and wearables creates formidable switching costs.
• Silicon Leadership: Proprietary M-series architecture provides unmatched computing efficiency.
• Services Scale: A high-margin software and subscription division that softens hardware cycle volatility.
Common Myth: EU regulatory mandates like the Digital Markets Act will destroy Apple's App Store business.
The Reality: While EU side-loading and alternative app marketplaces create compliance headwinds, Apple's global services revenue continues robust double-digit expansion.
4. The Evolution: Six Defining Milestones
Apple's historic trajectory follows a clear, sequential chain of engineering milestones:
1976 (Apple I) → 1984 (Macintosh) → 2001 (iPod) → 2007 (iPhone) → 2020 (Apple Silicon) → 2024 (Vision Pro)
• 1976 — Apple I: Initiated the personal computer revolution from a garage in Los Altos.
• 1984 — Macintosh: Popularized the graphical user interface and computer mouse.
• 2001 — iPod: Reshaped the music industry and established consumer electronics leadership.
• 2007 — iPhone: Redefined global mobile telecommunications and created the modern app economy.
• 2020 — Apple Silicon M1: Broke away from Intel to deliver breakthrough performance-per-watt.
• 2024 — Vision Pro: Pioneered high-end spatial computing and advanced micro-OLED display engineering.
Common Myth: The Apple Vision Pro was a failed experiment with no long-term strategic value.
The Reality: Vision Pro established Apple's spatial computing foundation and advanced micro-OLED display engineering for future lightweight AR devices.
5. Financial Snapshot: Reading Behind the Numbers
At a glance, Apple's financial scale is staggering, supported by massive free cash flow and disciplined capital allocation:
• Market Cap: $5.2 Trillion
• Revenue (TTM): $478.8 Billion
• P/E Ratio: 39.6
• Employees: 167,000
Common Myth: Apple's massive share buyback program is a sign of stagnant internal innovation.
The Reality: Apple deployed over $450B in buybacks over recent years while simultaneously increasing R&D spending to record highs above $45B.
6. What Comes Next: Roadmap and Risks
With annual R&D expenditures surging past $45 billion, Apple continues to invest in generative AI (Apple Intelligence), advanced silicon, and spatial computing. However, three distinct risks shadow its roadmap:
1. Regulatory Scrutiny: Antitrust actions from the U.S. DOJ and EU Digital Markets Act challenge App Store commissions and default search arrangements.
2. Geographic Exposure: Economic volatility and intense domestic competition in Greater China pose headwinds for iPhone volumes.
3. Mature Upgrade Cycles: Slower hardware upgrade cadences require services expansion to maintain top-line growth.
Common Myth: Apple missed the artificial intelligence wave by ignoring generative AI.
The Reality: Apple Intelligence integrates privacy-focused on-device and private cloud foundation models across hundreds of millions of active devices.
Quick Reference: Claim vs. Reality
Popular Claim | Historical & Market Reality
-- | --
Apple is just a hardware maker. | Services revenue exceeds $123B annually with high operating margins.
M-series is a basic supplier switch. | Custom silicon provides an unmatched performance-per-watt moat.
EU DMA will destroy the App Store. | Global services growth continues robustly despite regulatory compliance adjustments.
Vision Pro was a failed experiment. | It established spatial computing foundations and micro-OLED engineering.
Buybacks signal stagnant innovation. | Apple combines massive share repurchases with record R&D investments above $45B.
Apple missed the AI boom. | Apple Intelligence deploys privacy-first foundation models across active devices.
The Bottom Line: What This Means for You
• If you are an Apple user: Your devices benefit from decades of hardware-software integration and custom silicon efficiency, though ecosystem lock-in remains tight.
• If you are an app developer: Navigating alternative app marketplaces and regulatory changes requires adapting to a shifting compliance landscape.
• If you are an investor: A $5.2T valuation reflects elite cash flow generation and capital return, tempered by regulatory risks and growth rates in mature markets.
• If you follow tech: Apple's long-term trajectory depends on executing its spatial computing and privacy-first AI strategies.
## Sources
- Apple Inc. FY2026 Form 10-K (SEC EDGAR)
- Apple Inc. Q4 FY2026 Press Release
- StockRow Financial Analytics
- The Filing Desk Corporate Financials
- Fox Business Market Data
327
·
--
අර්ධ වශයෙන් සත්යයි
ලිපිය
Did you know that $TSLA (Tesla Inc.)...?Reading time: 3 minutes • Focus: Clean Energy Transition, Manufacturing Innovation & AI/Autonomy
The Short Version (TL;DR):
Tesla Inc. did not achieve its market position by accident. Its $800B valuation reflects a calculated, multi-year strategy — though rising competition and elevated expectations mean its dominance faces real challenges.
Why Tesla Inc. Matters to You
Your next car, home battery, or AI assistant may run on Tesla's stack — the company's vertical integration spans vehicles, energy, and robotics.
1. From Startup to Industry Titan
**Tesla Inc.** was founded in **2003** in **Austin, Texas** by **Martin Eberhard, Marc Tarpenning**. What started as a mission to accelerate the world's transition to sustainable energy has evolved into a defining force in clean energy transition, manufacturing innovation and beyond. Today's market leadership is the payoff of a strategy decades in the making.
Common Myth: Tesla is just a car company.
The Reality: Energy storage, software, AI, robotics platform with auto as first application.
2. The Vertical Integration That Changed Everything
**Tesla Inc.** established its technical credibility with the **Vertical integration (batteries, software, manufacturing)**. This breakthrough was not a single product launch — it created the foundational platform that enabled the company's subsequent market dominance. The engineering decisions behind this innovation required years of R&D investment and represented a fundamental shift in how clean energy transition, manufacturing innovation operates.
Common Myth: FSD is almost solved.
The Reality: L4/L5 autonomy remains years away; regulatory gating is the primary blocker.
3. Market Dominance and the Competitive Moat
Operating with a **$800B** market cap and **$97B** in trailing twelve-month revenue, Tesla Inc.'s market position rests on three pillars:
1. **Supercharger Network + Vertical Integration**: Massive production volumes and vertical integration drive down unit costs, fueling continuous reinvestment.
2. **FSD Data Advantage**: Real-world fleet data from millions of vehicles creates an insurmountable training advantage for autonomy.
3. **Brand as Clean Energy Icon**: Brand authority as the category definer creates pricing power and customer loyalty beyond specs.
Common Myth: Elon Musk is the sole founder.
The Reality: Founded by Martin Eberhard and Marc Tarpenning in 2003; Musk joined as lead investor.
4. The Evolution: 5 Defining Milestones
2008 (Roadster first electric sports car) → 2012 (Model S launch) → 2017 (Model 3 mass market entry) → 2020 (Added to S&P 500) → 2023 (Cybertruck deliveries begin)
• **2008** — Roadster first electric sports car: *Revival of the EV market*
• **2012** — Model S launch: *Formation of luxury EV segment*
• **2017** — Model 3 mass market entry: *EVs enter mainstream*
• **2020** — Added to S&P 500: *Financial legitimacy for EV companies*
• **2023** — Cybertruck deliveries begin: *Expansion of commercial EV market*
5. Financial Snapshot: Reading Behind the Numbers
• **Market Cap**: $800B
• **Revenue (TTM)**: $97B
• **P/E Ratio**: 70
• **Employees**: 140,000
These metrics reflect a company operating at massive scale, yet its valuation requires careful interpretation. A P/E of 70 is a pricing metric, not a guarantee of value — it reflects how aggressively the market prices in future growth, leaving little room for operational missteps.
Common Myth: Supercharger network is purely a cost center.
The Reality: Now opening to other OEMs; becoming a revenue-generating infrastructure asset.
6. What Comes Next: Roadmap and Risks
With **over 20%** of revenue funneled back into R&D, Tesla Inc. continues to expand across clean energy transition, manufacturing innovation and adjacent markets. However, three distinct risks shadow its roadmap:
1. **BYD/Legacy Auto Competition**: Well-funded competitors are actively chipping away at market share in key segments with aggressive pricing and localized supply chains.
2. **FSD Regulatory Timeline Uncertainty**: Government policy directly restricts addressable market and operational flexibility — especially in cross-border tech transfer.
3. **Elon Musk Key-Person Dependency**: Strategic decision-making and public perception are unusually tied to a single individual, creating governance and succession risk.
Common Myth: Competition cannot catch Tesla's lead.
The Reality: BYD surpassed in unit volume; legacy auto investing $1T+ in EV transition.
Quick Reference: Claim vs. Reality
| Popular Claim | Historical & Market Reality |
|---------------|-----------------------------|
| Tesla is just a car company. | Energy storage, software, AI, robotics platform with auto as first application. |
| FSD is almost solved. | L4/L5 autonomy remains years away; regulatory gating is the primary blocker. |
| Elon Musk is the sole founder. | Founded by Martin Eberhard and Marc Tarpenning in 2003; Musk joined as lead investor. |
| Supercharger network is purely a cost center. | Now opening to other OEMs; becoming a revenue-generating infrastructure asset. |
| EVs are Tesla's only growth driver. | Energy storage (Megapack) and software (FSD licensing) are expanding TAM. |
| Competition cannot catch Tesla's lead. | BYD surpassed in unit volume; legacy auto investing $1T+ in EV transition. |
The Bottom Line: What This Means for You
• **If you are a consumer**: Today's products are the result of 21 years of architectural refinement, even if this category is no longer the primary revenue driver.
• **If you use clean energy transition daily**: Most tools you rely on run on this company's platform, though growing competition means future solutions will likely run on more diverse infrastructure.
• **If you are an investor**: A **$800B** valuation and **70 P/E** ratio signal immense market confidence, alongside significant downside risk if growth normalizes.
• **If you follow tech**: Real-world impact depends on supply chains and deployment timelines rather than keynote announcements.
## Sources
- Wikipedia
- Yahoo Finance
- Company Filings
- Industry Reports
- Wikimedia Commons
Did you know that $TSLA (Tesla Inc.)...?
Reading time: 3 minutes • Focus: Clean Energy Transition, Manufacturing Innovation & AI/Autonomy
The Short Version (TL;DR):
Tesla Inc. did not achieve its market position by accident. Its $800B valuation reflects a calculated, multi-year strategy — though rising competition and elevated expectations mean its dominance faces real challenges.
Why Tesla Inc. Matters to You
Your next car, home battery, or AI assistant may run on Tesla's stack — the company's vertical integration spans vehicles, energy, and robotics.
1. From Startup to Industry Titan
**Tesla Inc.** was founded in **2003** in **Austin, Texas** by **Martin Eberhard, Marc Tarpenning**. What started as a mission to accelerate the world's transition to sustainable energy has evolved into a defining force in clean energy transition, manufacturing innovation and beyond. Today's market leadership is the payoff of a strategy decades in the making.
Common Myth: Tesla is just a car company.
The Reality: Energy storage, software, AI, robotics platform with auto as first application.
2. The Vertical Integration That Changed Everything
**Tesla Inc.** established its technical credibility with the **Vertical integration (batteries, software, manufacturing)**. This breakthrough was not a single product launch — it created the foundational platform that enabled the company's subsequent market dominance. The engineering decisions behind this innovation required years of R&D investment and represented a fundamental shift in how clean energy transition, manufacturing innovation operates.
Common Myth: FSD is almost solved.
The Reality: L4/L5 autonomy remains years away; regulatory gating is the primary blocker.
3. Market Dominance and the Competitive Moat
Operating with a **$800B** market cap and **$97B** in trailing twelve-month revenue, Tesla Inc.'s market position rests on three pillars:
1. **Supercharger Network + Vertical Integration**: Massive production volumes and vertical integration drive down unit costs, fueling continuous reinvestment.
2. **FSD Data Advantage**: Real-world fleet data from millions of vehicles creates an insurmountable training advantage for autonomy.
3. **Brand as Clean Energy Icon**: Brand authority as the category definer creates pricing power and customer loyalty beyond specs.
Common Myth: Elon Musk is the sole founder.
The Reality: Founded by Martin Eberhard and Marc Tarpenning in 2003; Musk joined as lead investor.
4. The Evolution: 5 Defining Milestones
2008 (Roadster first electric sports car) → 2012 (Model S launch) → 2017 (Model 3 mass market entry) → 2020 (Added to S&P 500) → 2023 (Cybertruck deliveries begin)
• **2008** — Roadster first electric sports car: *Revival of the EV market*
• **2012** — Model S launch: *Formation of luxury EV segment*
• **2017** — Model 3 mass market entry: *EVs enter mainstream*
• **2020** — Added to S&P 500: *Financial legitimacy for EV companies*
• **2023** — Cybertruck deliveries begin: *Expansion of commercial EV market*
5. Financial Snapshot: Reading Behind the Numbers
• **Market Cap**: $800B
• **Revenue (TTM)**: $97B
• **P/E Ratio**: 70
• **Employees**: 140,000
These metrics reflect a company operating at massive scale, yet its valuation requires careful interpretation. A P/E of 70 is a pricing metric, not a guarantee of value — it reflects how aggressively the market prices in future growth, leaving little room for operational missteps.
Common Myth: Supercharger network is purely a cost center.
The Reality: Now opening to other OEMs; becoming a revenue-generating infrastructure asset.
6. What Comes Next: Roadmap and Risks
With **over 20%** of revenue funneled back into R&D, Tesla Inc. continues to expand across clean energy transition, manufacturing innovation and adjacent markets. However, three distinct risks shadow its roadmap:
1. **BYD/Legacy Auto Competition**: Well-funded competitors are actively chipping away at market share in key segments with aggressive pricing and localized supply chains.
2. **FSD Regulatory Timeline Uncertainty**: Government policy directly restricts addressable market and operational flexibility — especially in cross-border tech transfer.
3. **Elon Musk Key-Person Dependency**: Strategic decision-making and public perception are unusually tied to a single individual, creating governance and succession risk.
Common Myth: Competition cannot catch Tesla's lead.
The Reality: BYD surpassed in unit volume; legacy auto investing $1T+ in EV transition.
Quick Reference: Claim vs. Reality
| Popular Claim | Historical & Market Reality |
|---------------|-----------------------------|
| Tesla is just a car company. | Energy storage, software, AI, robotics platform with auto as first application. |
| FSD is almost solved. | L4/L5 autonomy remains years away; regulatory gating is the primary blocker. |
| Elon Musk is the sole founder. | Founded by Martin Eberhard and Marc Tarpenning in 2003; Musk joined as lead investor. |
| Supercharger network is purely a cost center. | Now opening to other OEMs; becoming a revenue-generating infrastructure asset. |
| EVs are Tesla's only growth driver. | Energy storage (Megapack) and software (FSD licensing) are expanding TAM. |
| Competition cannot catch Tesla's lead. | BYD surpassed in unit volume; legacy auto investing $1T+ in EV transition. |
The Bottom Line: What This Means for You
• **If you are a consumer**: Today's products are the result of 21 years of architectural refinement, even if this category is no longer the primary revenue driver.
• **If you use clean energy transition daily**: Most tools you rely on run on this company's platform, though growing competition means future solutions will likely run on more diverse infrastructure.
• **If you are an investor**: A **$800B** valuation and **70 P/E** ratio signal immense market confidence, alongside significant downside risk if growth normalizes.
• **If you follow tech**: Real-world impact depends on supply chains and deployment timelines rather than keynote announcements.
## Sources
- Wikipedia
- Yahoo Finance
- Company Filings
- Industry Reports
- Wikimedia Commons
The Short Version (TL;DR):
Tesla Inc. did not achieve its market position by accident. Its $800B valuation reflects a calculated, multi-year strategy — though rising competition and elevated expectations mean its dominance faces real challenges.
Why Tesla Inc. Matters to You
Your next car, home battery, or AI assistant may run on Tesla's stack — the company's vertical integration spans vehicles, energy, and robotics.
1. From Startup to Industry Titan
**Tesla Inc.** was founded in **2003** in **Austin, Texas** by **Martin Eberhard, Marc Tarpenning**. What started as a mission to accelerate the world's transition to sustainable energy has evolved into a defining force in clean energy transition, manufacturing innovation and beyond. Today's market leadership is the payoff of a strategy decades in the making.
Common Myth: Tesla is just a car company.
The Reality: Energy storage, software, AI, robotics platform with auto as first application.
2. The Vertical Integration That Changed Everything
**Tesla Inc.** established its technical credibility with the **Vertical integration (batteries, software, manufacturing)**. This breakthrough was not a single product launch — it created the foundational platform that enabled the company's subsequent market dominance. The engineering decisions behind this innovation required years of R&D investment and represented a fundamental shift in how clean energy transition, manufacturing innovation operates.
Common Myth: FSD is almost solved.
The Reality: L4/L5 autonomy remains years away; regulatory gating is the primary blocker.
3. Market Dominance and the Competitive Moat
Operating with a **$800B** market cap and **$97B** in trailing twelve-month revenue, Tesla Inc.'s market position rests on three pillars:
1. **Supercharger Network + Vertical Integration**: Massive production volumes and vertical integration drive down unit costs, fueling continuous reinvestment.
2. **FSD Data Advantage**: Real-world fleet data from millions of vehicles creates an insurmountable training advantage for autonomy.
3. **Brand as Clean Energy Icon**: Brand authority as the category definer creates pricing power and customer loyalty beyond specs.
Common Myth: Elon Musk is the sole founder.
The Reality: Founded by Martin Eberhard and Marc Tarpenning in 2003; Musk joined as lead investor.
4. The Evolution: 5 Defining Milestones
2008 (Roadster first electric sports car) → 2012 (Model S launch) → 2017 (Model 3 mass market entry) → 2020 (Added to S&P 500) → 2023 (Cybertruck deliveries begin)
• **2008** — Roadster first electric sports car: *Revival of the EV market*
• **2012** — Model S launch: *Formation of luxury EV segment*
• **2017** — Model 3 mass market entry: *EVs enter mainstream*
• **2020** — Added to S&P 500: *Financial legitimacy for EV companies*
• **2023** — Cybertruck deliveries begin: *Expansion of commercial EV market*
5. Financial Snapshot: Reading Behind the Numbers
• **Market Cap**: $800B
• **Revenue (TTM)**: $97B
• **P/E Ratio**: 70
• **Employees**: 140,000
These metrics reflect a company operating at massive scale, yet its valuation requires careful interpretation. A P/E of 70 is a pricing metric, not a guarantee of value — it reflects how aggressively the market prices in future growth, leaving little room for operational missteps.
Common Myth: Supercharger network is purely a cost center.
The Reality: Now opening to other OEMs; becoming a revenue-generating infrastructure asset.
6. What Comes Next: Roadmap and Risks
With **over 20%** of revenue funneled back into R&D, Tesla Inc. continues to expand across clean energy transition, manufacturing innovation and adjacent markets. However, three distinct risks shadow its roadmap:
1. **BYD/Legacy Auto Competition**: Well-funded competitors are actively chipping away at market share in key segments with aggressive pricing and localized supply chains.
2. **FSD Regulatory Timeline Uncertainty**: Government policy directly restricts addressable market and operational flexibility — especially in cross-border tech transfer.
3. **Elon Musk Key-Person Dependency**: Strategic decision-making and public perception are unusually tied to a single individual, creating governance and succession risk.
Common Myth: Competition cannot catch Tesla's lead.
The Reality: BYD surpassed in unit volume; legacy auto investing $1T+ in EV transition.
Quick Reference: Claim vs. Reality
| Popular Claim | Historical & Market Reality |
|---------------|-----------------------------|
| Tesla is just a car company. | Energy storage, software, AI, robotics platform with auto as first application. |
| FSD is almost solved. | L4/L5 autonomy remains years away; regulatory gating is the primary blocker. |
| Elon Musk is the sole founder. | Founded by Martin Eberhard and Marc Tarpenning in 2003; Musk joined as lead investor. |
| Supercharger network is purely a cost center. | Now opening to other OEMs; becoming a revenue-generating infrastructure asset. |
| EVs are Tesla's only growth driver. | Energy storage (Megapack) and software (FSD licensing) are expanding TAM. |
| Competition cannot catch Tesla's lead. | BYD surpassed in unit volume; legacy auto investing $1T+ in EV transition. |
The Bottom Line: What This Means for You
• **If you are a consumer**: Today's products are the result of 21 years of architectural refinement, even if this category is no longer the primary revenue driver.
• **If you use clean energy transition daily**: Most tools you rely on run on this company's platform, though growing competition means future solutions will likely run on more diverse infrastructure.
• **If you are an investor**: A **$800B** valuation and **70 P/E** ratio signal immense market confidence, alongside significant downside risk if growth normalizes.
• **If you follow tech**: Real-world impact depends on supply chains and deployment timelines rather than keynote announcements.
## Sources
- Wikipedia
- Yahoo Finance
- Company Filings
- Industry Reports
- Wikimedia Commons
151
·
--
අර්ධ වශයෙන් සත්යයි
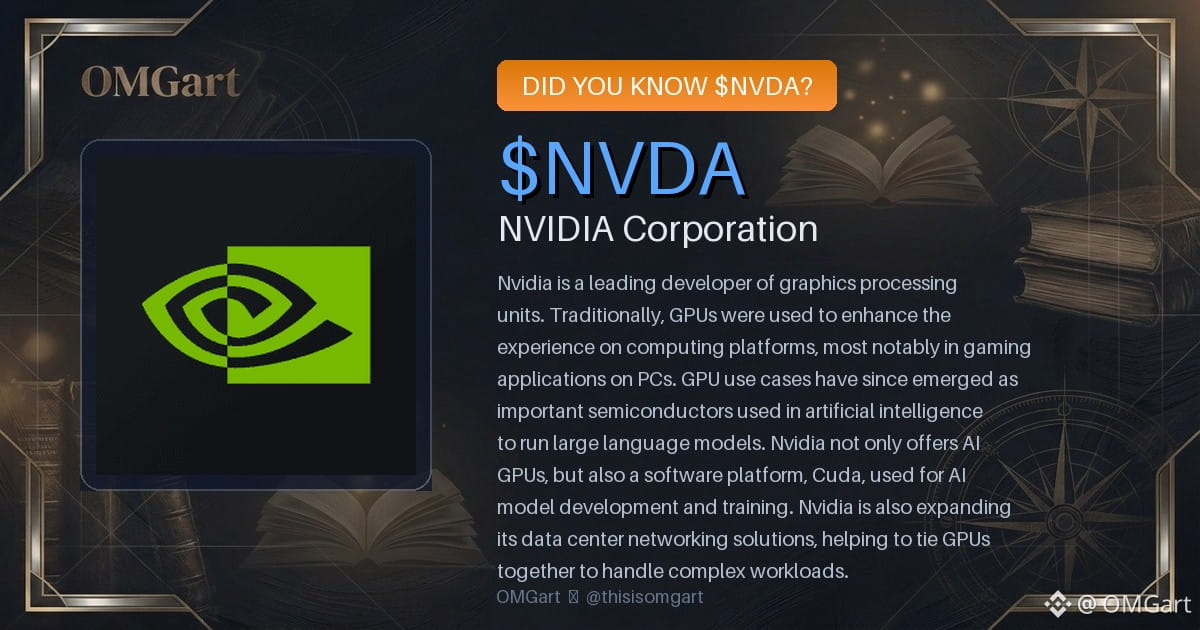
ලිපිය
Did you know that $NVDA (NVIDIA Corporation)...?Reading time: 5 minutes • Focus: Tech History, Market Analysis & AI Infrastructure
The Short Version (TL;DR):
NVIDIA did not stumble into the AI boom by accident, nor did it invent the GPU from scratch. Its $3.2 trillion valuation is the result of a calculated, 20-year software strategy—though rising competition and high expectations mean its dominance is no longer unchallenged.
Much of the narrative surrounding NVIDIA online is either overly romanticized or stripped of its historical context. Below is a grounded look at the company’s 33-year trajectory, separating verifiable milestones from common industry misconceptions.
Why NVIDIA Matters to You
Whether you are gaming, querying an AI model like ChatGPT, or relying on lane-keeping systems in a modern car, NVIDIA’s hardware is likely running behind the scenes. Understanding how the company got here requires looking past marketing headlines and examining the engineering decisions that built its moat.
1. From a Silicon Valley Startup to an Industry Titan
Founded in 1993 in Santa Clara, California, by Jensen Huang, Chris Malachowsky, and Curtis Priem, NVIDIA started with a focused goal: bringing 3D graphics to the gaming and multimedia markets. Today’s identity as an AI powerhouse is not a sudden pivot. It is the payoff of a strategy decades in the making.
Common Myth: NVIDIA was strictly a gaming company that stumbled into AI by luck.
The Reality: The move into AI was a calculated wager. When NVIDIA launched its CUDA parallel computing platform in 2006, it laid the groundwork years before the deep learning boom. By the time AlexNet disrupted AI in 2012, NVIDIA's infrastructure was already waiting.
2. The Technology That Changed Everything
NVIDIA put itself on the map in 1999 with the GeForce 256. By integrating transform and lighting (T&L) calculations onto a single chip, the company commercialized the modern graphics processing unit.
Common Myth: NVIDIA invented the GPU.
The Reality: Graphics accelerators existed before 1999. NVIDIA’s real achievement was coining and standardizing the term "GPU" by bringing hardware-accelerated T&L to everyday consumers.
Fast forward to 2024, and the spotlight shifted to the Blackwell B200 and GB200 NVL72 architectures, setting a new baseline for trillion-parameter AI models.
Common Myth: Blackwell launched in 2024 and saw immediate, widespread deployment.
The Reality: Unveiled in March 2024, actual shipments began later that year, with broad adoption stretching into 2025. Furthermore, the GB200 NVL72 is not a single chip—it is a rack-scale server system housing 72 GPUs.
3. Market Dominance and the Competitive Moat
Operating with a $3.2 trillion market cap and $113 billion in trailing twelve-month revenue, NVIDIA’s market position rests on three pillars:
• Technological Leadership: Decades of aggressive R&D have built an intellectual property barrier that rivals struggle to breach.
• Ecosystem Lock-in: Developers built on CUDA face steep switching costs when considering alternative hardware.
• Economies of Scale: Massive production volumes drive down unit costs, fueling continuous reinvestment.
Common Myth: Ecosystem lock-in means customers will never leave NVIDIA.
The Reality: High switching costs do not guarantee an unbreakable monopoly. As AMD’s ROCm and open-source software stacks mature, cost-conscious enterprises are actively exploring alternatives—especially for AI inference workloads.
4. The Evolution: Six Defining Milestones
Instead of a sudden overnight success, NVIDIA’s rise follows a clear, sequential chain:
1999 (GeForce 256) → 2006 (CUDA) → 2012 (AlexNet) → 2020 (A100) → 2022 (H100) → 2024 (Blackwell)
• 1999 — GeForce 256: Popularized the "GPU" moniker and defined consumer graphics.
• 2006 — CUDA Platform: Standardized general-purpose GPU computing, creating the software layer for future AI.
• 2012 — AlexNet: Trained on NVIDIA GPUs, sparking the modern deep learning revolution.
• 2020 — A100 (Ampere): Became the industry standard for data center AI training.
• 2022 — H100 (Hopper): Served as the hardware backbone for the generative AI explosion.
• 2024 — Blackwell: Set the new benchmark for trillion-parameter model training and inference.
5. Financial Snapshot: Reading Behind the Numbers
At a glance, NVIDIA's scale is staggering, yet its valuation metrics require careful interpretation:
• Market Cap: $3.2 Trillion
• Revenue (TTM): $113 Billion
• P/E Ratio: 65
• Employees: 29,600
Common Myth: A P/E ratio of 65 proves future growth is guaranteed.
The Reality: A P/E of 65 is a pricing metric, not a guarantee of value. It reflects how aggressively the market is pricing in future growth—leaving very little room for operational missteps.
6. What Comes Next: Roadmap and Risks
With over 20% of its revenue funneled back into R&D, NVIDIA continues to expand across data centers and automotive systems. However, three distinct risks shadow its roadmap:
1. Regulatory Scrutiny: U.S.-China export controls directly restrict NVIDIA's addressable market.
2. Custom Silicon: Hyperscalers (like Google, Amazon, and Microsoft) designing in-house AI chips are actively chipping away at NVIDIA's share.
3. CapEx Cycles: Any slowdown in cloud infrastructure spending could cool data center demand.
Common Myth: NVIDIA has been "quietly" reshaping tech for three decades.
The Reality: There has been nothing quiet about NVIDIA since 2012. Over the past five years, it has operated at the absolute center of global financial attention.
Quick Reference: Claim vs. Reality
Popular Claim Historical & Market Reality
NVIDIA invented the GPU. Commercialized and popularized the term in 1999 with the GeForce 256.
Pivoted to AI by luck. Executed a deliberate strategy starting with CUDA in 2006.
Blackwell deployed instantly in 2024. Announced in March 2024; broad rollout extended into 2025.
GB200 NVL72 is a single chip. It is a full rack-scale system integrating 72 GPUs.
P/E of 65 guarantees value. Reflects high growth expectations and carries valuation risk.
CUDA lock-in is absolute. Switching costs are high, but alternatives are gaining traction.
The Bottom Line: What This Means for You
• If you are a gamer: Today's graphics cards are the result of 33 years of architectural refinement, even though gaming is no longer NVIDIA's primary revenue driver.
• If you use AI daily: Most tools you rely on were trained on NVIDIA silicon, though growing competition means future AI will likely run on more diverse hardware.
• If you are an investor: A $3.2T valuation and 65 P/E ratio signal immense market confidence, alongside significant downside risk if growth normalizes.
• If you follow tech: Real-world impact depends on supply chains and deployment timelines rather than keynote announcements.
## Sources
- Wikipedia
- Yahoo Finance
- Company Filings
- Industry Reports
- Wikimedia Commons
Did you know that $NVDA (NVIDIA Corporation)...?
Reading time: 5 minutes • Focus: Tech History, Market Analysis & AI Infrastructure
The Short Version (TL;DR):
NVIDIA did not stumble into the AI boom by accident, nor did it invent the GPU from scratch. Its $3.2 trillion valuation is the result of a calculated, 20-year software strategy—though rising competition and high expectations mean its dominance is no longer unchallenged.
Much of the narrative surrounding NVIDIA online is either overly romanticized or stripped of its historical context. Below is a grounded look at the company’s 33-year trajectory, separating verifiable milestones from common industry misconceptions.
Why NVIDIA Matters to You
Whether you are gaming, querying an AI model like ChatGPT, or relying on lane-keeping systems in a modern car, NVIDIA’s hardware is likely running behind the scenes. Understanding how the company got here requires looking past marketing headlines and examining the engineering decisions that built its moat.
1. From a Silicon Valley Startup to an Industry Titan
Founded in 1993 in Santa Clara, California, by Jensen Huang, Chris Malachowsky, and Curtis Priem, NVIDIA started with a focused goal: bringing 3D graphics to the gaming and multimedia markets. Today’s identity as an AI powerhouse is not a sudden pivot. It is the payoff of a strategy decades in the making.
Common Myth: NVIDIA was strictly a gaming company that stumbled into AI by luck.
The Reality: The move into AI was a calculated wager. When NVIDIA launched its CUDA parallel computing platform in 2006, it laid the groundwork years before the deep learning boom. By the time AlexNet disrupted AI in 2012, NVIDIA's infrastructure was already waiting.
2. The Technology That Changed Everything
NVIDIA put itself on the map in 1999 with the GeForce 256. By integrating transform and lighting (T&L) calculations onto a single chip, the company commercialized the modern graphics processing unit.
Common Myth: NVIDIA invented the GPU.
The Reality: Graphics accelerators existed before 1999. NVIDIA’s real achievement was coining and standardizing the term "GPU" by bringing hardware-accelerated T&L to everyday consumers.
Fast forward to 2024, and the spotlight shifted to the Blackwell B200 and GB200 NVL72 architectures, setting a new baseline for trillion-parameter AI models.
Common Myth: Blackwell launched in 2024 and saw immediate, widespread deployment.
The Reality: Unveiled in March 2024, actual shipments began later that year, with broad adoption stretching into 2025. Furthermore, the GB200 NVL72 is not a single chip—it is a rack-scale server system housing 72 GPUs.
3. Market Dominance and the Competitive Moat
Operating with a $3.2 trillion market cap and $113 billion in trailing twelve-month revenue, NVIDIA’s market position rests on three pillars:
• Technological Leadership: Decades of aggressive R&D have built an intellectual property barrier that rivals struggle to breach.
• Ecosystem Lock-in: Developers built on CUDA face steep switching costs when considering alternative hardware.
• Economies of Scale: Massive production volumes drive down unit costs, fueling continuous reinvestment.
Common Myth: Ecosystem lock-in means customers will never leave NVIDIA.
The Reality: High switching costs do not guarantee an unbreakable monopoly. As AMD’s ROCm and open-source software stacks mature, cost-conscious enterprises are actively exploring alternatives—especially for AI inference workloads.
4. The Evolution: Six Defining Milestones
Instead of a sudden overnight success, NVIDIA’s rise follows a clear, sequential chain:
1999 (GeForce 256) → 2006 (CUDA) → 2012 (AlexNet) → 2020 (A100) → 2022 (H100) → 2024 (Blackwell)
• 1999 — GeForce 256: Popularized the "GPU" moniker and defined consumer graphics.
• 2006 — CUDA Platform: Standardized general-purpose GPU computing, creating the software layer for future AI.
• 2012 — AlexNet: Trained on NVIDIA GPUs, sparking the modern deep learning revolution.
• 2020 — A100 (Ampere): Became the industry standard for data center AI training.
• 2022 — H100 (Hopper): Served as the hardware backbone for the generative AI explosion.
• 2024 — Blackwell: Set the new benchmark for trillion-parameter model training and inference.
5. Financial Snapshot: Reading Behind the Numbers
At a glance, NVIDIA's scale is staggering, yet its valuation metrics require careful interpretation:
• Market Cap: $3.2 Trillion
• Revenue (TTM): $113 Billion
• P/E Ratio: 65
• Employees: 29,600
Common Myth: A P/E ratio of 65 proves future growth is guaranteed.
The Reality: A P/E of 65 is a pricing metric, not a guarantee of value. It reflects how aggressively the market is pricing in future growth—leaving very little room for operational missteps.
6. What Comes Next: Roadmap and Risks
With over 20% of its revenue funneled back into R&D, NVIDIA continues to expand across data centers and automotive systems. However, three distinct risks shadow its roadmap:
1. Regulatory Scrutiny: U.S.-China export controls directly restrict NVIDIA's addressable market.
2. Custom Silicon: Hyperscalers (like Google, Amazon, and Microsoft) designing in-house AI chips are actively chipping away at NVIDIA's share.
3. CapEx Cycles: Any slowdown in cloud infrastructure spending could cool data center demand.
Common Myth: NVIDIA has been "quietly" reshaping tech for three decades.
The Reality: There has been nothing quiet about NVIDIA since 2012. Over the past five years, it has operated at the absolute center of global financial attention.
Quick Reference: Claim vs. Reality
Popular Claim Historical & Market Reality
NVIDIA invented the GPU. Commercialized and popularized the term in 1999 with the GeForce 256.
Pivoted to AI by luck. Executed a deliberate strategy starting with CUDA in 2006.
Blackwell deployed instantly in 2024. Announced in March 2024; broad rollout extended into 2025.
GB200 NVL72 is a single chip. It is a full rack-scale system integrating 72 GPUs.
P/E of 65 guarantees value. Reflects high growth expectations and carries valuation risk.
CUDA lock-in is absolute. Switching costs are high, but alternatives are gaining traction.
The Bottom Line: What This Means for You
• If you are a gamer: Today's graphics cards are the result of 33 years of architectural refinement, even though gaming is no longer NVIDIA's primary revenue driver.
• If you use AI daily: Most tools you rely on were trained on NVIDIA silicon, though growing competition means future AI will likely run on more diverse hardware.
• If you are an investor: A $3.2T valuation and 65 P/E ratio signal immense market confidence, alongside significant downside risk if growth normalizes.
• If you follow tech: Real-world impact depends on supply chains and deployment timelines rather than keynote announcements.
## Sources
- Wikipedia
- Yahoo Finance
- Company Filings
- Industry Reports
- Wikimedia Commons
The Short Version (TL;DR):
NVIDIA did not stumble into the AI boom by accident, nor did it invent the GPU from scratch. Its $3.2 trillion valuation is the result of a calculated, 20-year software strategy—though rising competition and high expectations mean its dominance is no longer unchallenged.
Much of the narrative surrounding NVIDIA online is either overly romanticized or stripped of its historical context. Below is a grounded look at the company’s 33-year trajectory, separating verifiable milestones from common industry misconceptions.
Why NVIDIA Matters to You
Whether you are gaming, querying an AI model like ChatGPT, or relying on lane-keeping systems in a modern car, NVIDIA’s hardware is likely running behind the scenes. Understanding how the company got here requires looking past marketing headlines and examining the engineering decisions that built its moat.
1. From a Silicon Valley Startup to an Industry Titan
Founded in 1993 in Santa Clara, California, by Jensen Huang, Chris Malachowsky, and Curtis Priem, NVIDIA started with a focused goal: bringing 3D graphics to the gaming and multimedia markets. Today’s identity as an AI powerhouse is not a sudden pivot. It is the payoff of a strategy decades in the making.
Common Myth: NVIDIA was strictly a gaming company that stumbled into AI by luck.
The Reality: The move into AI was a calculated wager. When NVIDIA launched its CUDA parallel computing platform in 2006, it laid the groundwork years before the deep learning boom. By the time AlexNet disrupted AI in 2012, NVIDIA's infrastructure was already waiting.
2. The Technology That Changed Everything
NVIDIA put itself on the map in 1999 with the GeForce 256. By integrating transform and lighting (T&L) calculations onto a single chip, the company commercialized the modern graphics processing unit.
Common Myth: NVIDIA invented the GPU.
The Reality: Graphics accelerators existed before 1999. NVIDIA’s real achievement was coining and standardizing the term "GPU" by bringing hardware-accelerated T&L to everyday consumers.
Fast forward to 2024, and the spotlight shifted to the Blackwell B200 and GB200 NVL72 architectures, setting a new baseline for trillion-parameter AI models.
Common Myth: Blackwell launched in 2024 and saw immediate, widespread deployment.
The Reality: Unveiled in March 2024, actual shipments began later that year, with broad adoption stretching into 2025. Furthermore, the GB200 NVL72 is not a single chip—it is a rack-scale server system housing 72 GPUs.
3. Market Dominance and the Competitive Moat
Operating with a $3.2 trillion market cap and $113 billion in trailing twelve-month revenue, NVIDIA’s market position rests on three pillars:
• Technological Leadership: Decades of aggressive R&D have built an intellectual property barrier that rivals struggle to breach.
• Ecosystem Lock-in: Developers built on CUDA face steep switching costs when considering alternative hardware.
• Economies of Scale: Massive production volumes drive down unit costs, fueling continuous reinvestment.
Common Myth: Ecosystem lock-in means customers will never leave NVIDIA.
The Reality: High switching costs do not guarantee an unbreakable monopoly. As AMD’s ROCm and open-source software stacks mature, cost-conscious enterprises are actively exploring alternatives—especially for AI inference workloads.
4. The Evolution: Six Defining Milestones
Instead of a sudden overnight success, NVIDIA’s rise follows a clear, sequential chain:
1999 (GeForce 256) → 2006 (CUDA) → 2012 (AlexNet) → 2020 (A100) → 2022 (H100) → 2024 (Blackwell)
• 1999 — GeForce 256: Popularized the "GPU" moniker and defined consumer graphics.
• 2006 — CUDA Platform: Standardized general-purpose GPU computing, creating the software layer for future AI.
• 2012 — AlexNet: Trained on NVIDIA GPUs, sparking the modern deep learning revolution.
• 2020 — A100 (Ampere): Became the industry standard for data center AI training.
• 2022 — H100 (Hopper): Served as the hardware backbone for the generative AI explosion.
• 2024 — Blackwell: Set the new benchmark for trillion-parameter model training and inference.
5. Financial Snapshot: Reading Behind the Numbers
At a glance, NVIDIA's scale is staggering, yet its valuation metrics require careful interpretation:
• Market Cap: $3.2 Trillion
• Revenue (TTM): $113 Billion
• P/E Ratio: 65
• Employees: 29,600
Common Myth: A P/E ratio of 65 proves future growth is guaranteed.
The Reality: A P/E of 65 is a pricing metric, not a guarantee of value. It reflects how aggressively the market is pricing in future growth—leaving very little room for operational missteps.
6. What Comes Next: Roadmap and Risks
With over 20% of its revenue funneled back into R&D, NVIDIA continues to expand across data centers and automotive systems. However, three distinct risks shadow its roadmap:
1. Regulatory Scrutiny: U.S.-China export controls directly restrict NVIDIA's addressable market.
2. Custom Silicon: Hyperscalers (like Google, Amazon, and Microsoft) designing in-house AI chips are actively chipping away at NVIDIA's share.
3. CapEx Cycles: Any slowdown in cloud infrastructure spending could cool data center demand.
Common Myth: NVIDIA has been "quietly" reshaping tech for three decades.
The Reality: There has been nothing quiet about NVIDIA since 2012. Over the past five years, it has operated at the absolute center of global financial attention.
Quick Reference: Claim vs. Reality
Popular Claim Historical & Market Reality
NVIDIA invented the GPU. Commercialized and popularized the term in 1999 with the GeForce 256.
Pivoted to AI by luck. Executed a deliberate strategy starting with CUDA in 2006.
Blackwell deployed instantly in 2024. Announced in March 2024; broad rollout extended into 2025.
GB200 NVL72 is a single chip. It is a full rack-scale system integrating 72 GPUs.
P/E of 65 guarantees value. Reflects high growth expectations and carries valuation risk.
CUDA lock-in is absolute. Switching costs are high, but alternatives are gaining traction.
The Bottom Line: What This Means for You
• If you are a gamer: Today's graphics cards are the result of 33 years of architectural refinement, even though gaming is no longer NVIDIA's primary revenue driver.
• If you use AI daily: Most tools you rely on were trained on NVIDIA silicon, though growing competition means future AI will likely run on more diverse hardware.
• If you are an investor: A $3.2T valuation and 65 P/E ratio signal immense market confidence, alongside significant downside risk if growth normalizes.
• If you follow tech: Real-world impact depends on supply chains and deployment timelines rather than keynote announcements.
## Sources
- Wikipedia
- Yahoo Finance
- Company Filings
- Industry Reports
- Wikimedia Commons
249
·
--
$BTC Update: Price is $65,410.59 (-2.67% 24h). Historical analogs mirror macro liquidity tightening and geopolitical risk impulses, driving short-term capital flight and risk compression across digital assets.
⚠️ Not Financial Advice. DYOR. Past performance ≠ future results.
$BTC Update: Price is $65,410.59 (-2.67% 24h). Historical analogs mirror macro liquidity tightening and geopolitical risk impulses, driving short-term capital flight and risk compression across digital assets.
⚠️ Not Financial Advice. DYOR. Past performance ≠ future results.
⚠️ Not Financial Advice. DYOR. Past performance ≠ future results.
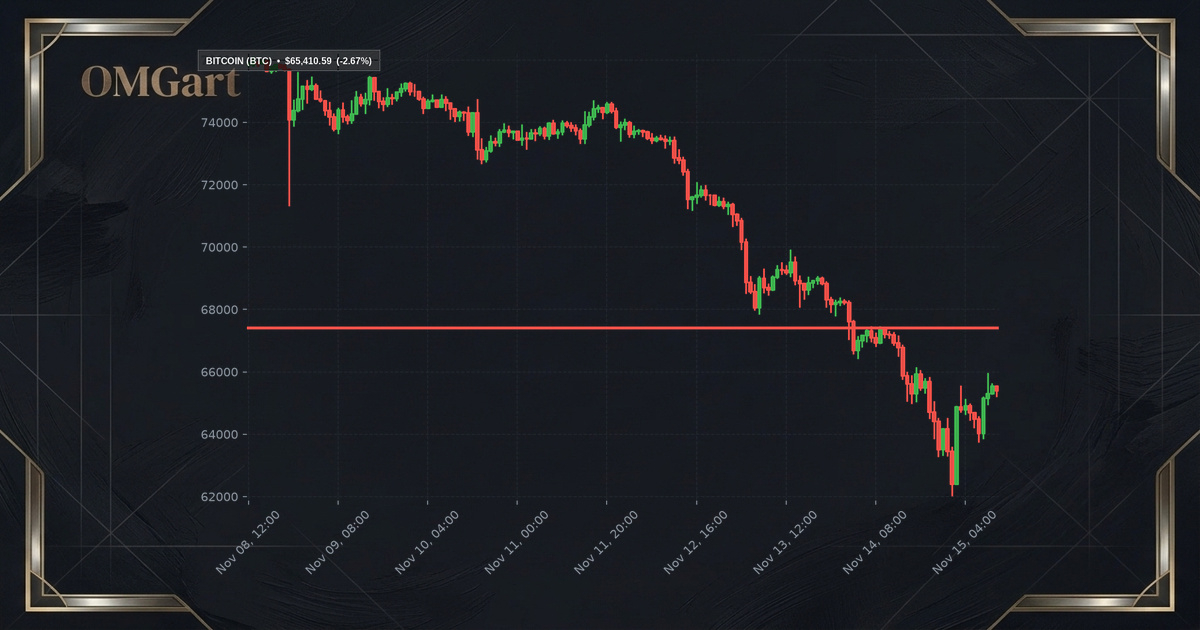
128
·
--
Annual Macro Review: Gold $3,886.30, Silver $49.12, Brent $95.84, BTC $66,562.24. Global liquidity easing and central bank accumulation anchored precious metals during the structural regime shift. Geopolitical energy risks kept Brent crude elevated within disciplined supply corridors. Liquidity rotation into digital assets accelerated institutional adoption amid shifting monetary policy cycles.
#2026 $PAXG $BTC
⚠️ Not Financial Advice. DYOR. Past performance ≠ future results.
Annual Macro Review: Gold $3,886.30, Silver $49.12, Brent $95.84, BTC $66,562.24. Global liquidity easing and central bank accumulation anchored precious metals during the structural regime shift. Geopolitical energy risks kept Brent crude elevated within disciplined supply corridors. Liquidity rotation into digital assets accelerated institutional adoption amid shifting monetary policy cycles.
#2026 $PAXG $BTC
⚠️ Not Financial Advice. DYOR. Past performance ≠ future results.
#2026 $PAXG $BTC
⚠️ Not Financial Advice. DYOR. Past performance ≠ future results.
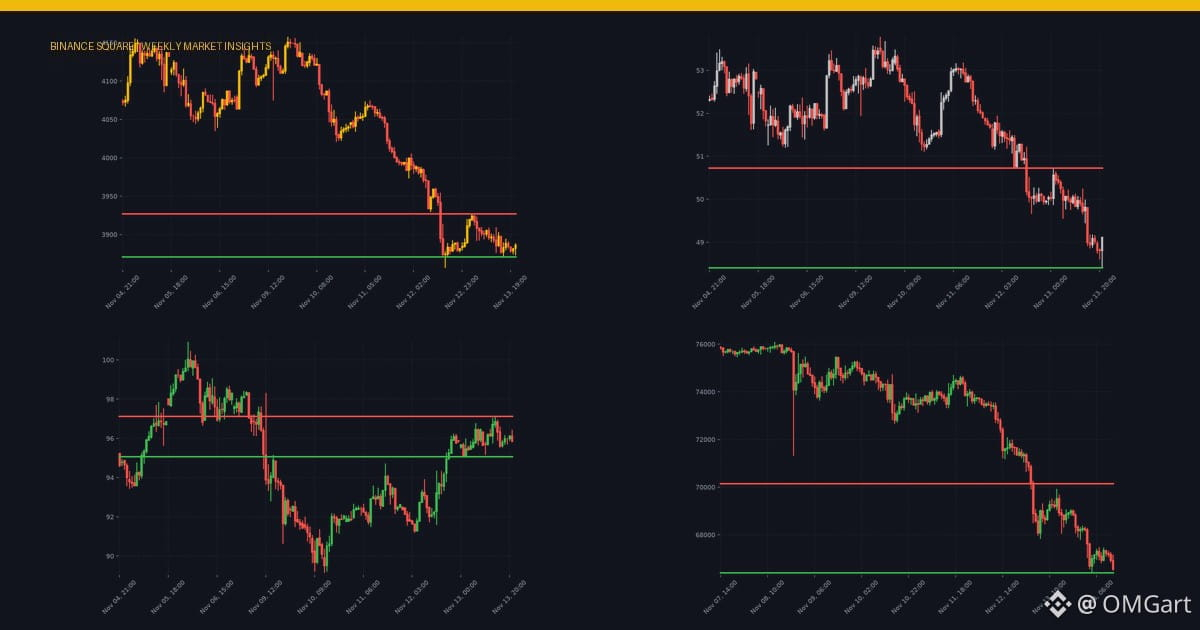
649
·
--
විවාදිත
$PAXG & $SLV: Gold $3,869.25, Silver $44.20. Precious metals reflect persistent safe-haven flows amid geopolitical tensions and shifting central bank liquidity, while dollar strength caps wider gains.
⚠️ Not Financial Advice. DYOR. Past performance ≠ future results.
$PAXG & $SLV: Gold $3,869.25, Silver $44.20. Precious metals reflect persistent safe-haven flows amid geopolitical tensions and shifting central bank liquidity, while dollar strength caps wider gains.
⚠️ Not Financial Advice. DYOR. Past performance ≠ future results.
⚠️ Not Financial Advice. DYOR. Past performance ≠ future results.
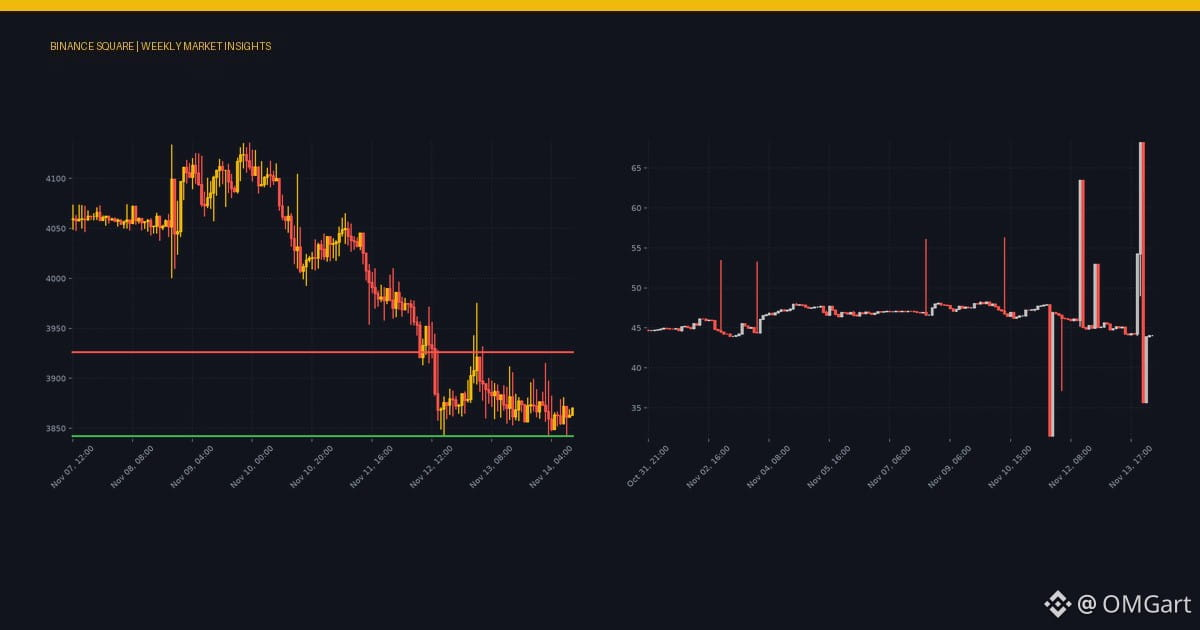
625
·
--
$BTC dropped 4.72% to $68,050.50, breaking key support near $69k. Momentum has shifted bearish in the near term due to liquidation pressure. Watch $66.5k support; holding is crucial to avoid a deeper retest toward $62k. Near-term outlook remains range-bound with high volatility.
⚠️ Not Financial Advice. DYOR. Past performance ≠ future results.
$BTC dropped 4.72% to $68,050.50, breaking key support near $69k. Momentum has shifted bearish in the near term due to liquidation pressure. Watch $66.5k support; holding is crucial to avoid a deeper retest toward $62k. Near-term outlook remains range-bound with high volatility.
⚠️ Not Financial Advice. DYOR. Past performance ≠ future results.
⚠️ Not Financial Advice. DYOR. Past performance ≠ future results.
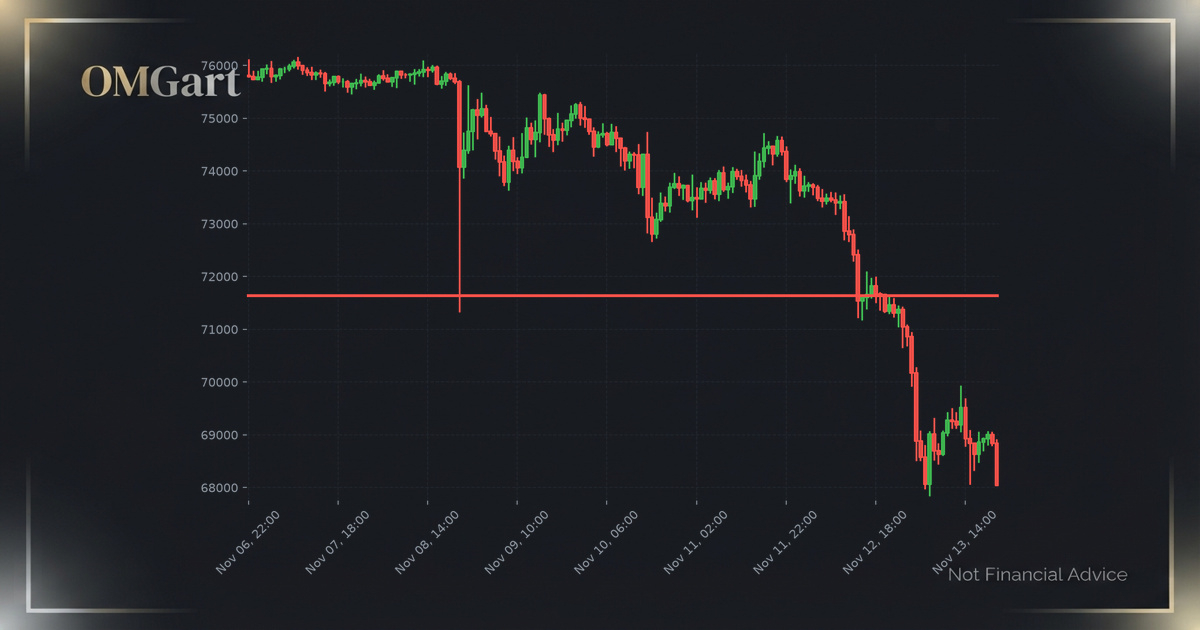
180
·
--
$BTC Update:$71,690.81 (-3.35% 24h). 72K is the key level: holding above signals recovery, sustained below increases selling pressure. Supports critical, watch cautiously.
⚠️ Not Financial Advice. DYOR. Past performance ≠ future results.
$BTC Update:$71,690.81 (-3.35% 24h). 72K is the key level: holding above signals recovery, sustained below increases selling pressure. Supports critical, watch cautiously.
⚠️ Not Financial Advice. DYOR. Past performance ≠ future results.
⚠️ Not Financial Advice. DYOR. Past performance ≠ future results.
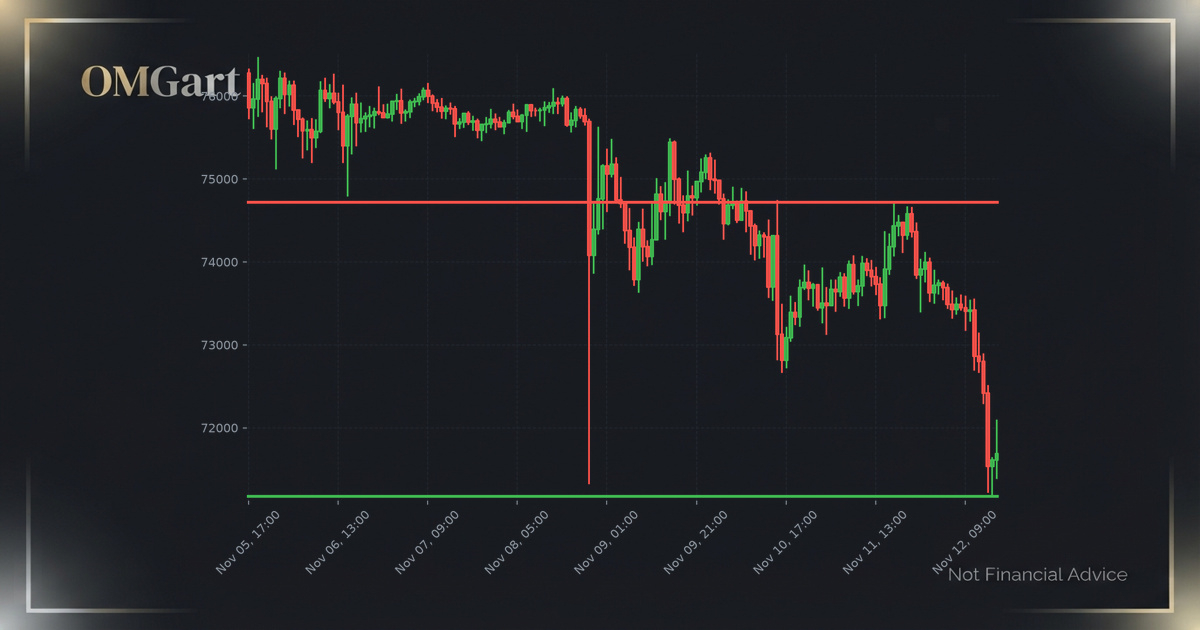
154
·
--
$USOon Oil Update: Price is $142.76 (2.70% 24h). Energy markets are reacting to global supply data. Watch for breakouts.
⚠️ Not Financial Advice. DYOR. Past performance ≠ future results.
$USOon Oil Update: Price is $142.76 (2.70% 24h). Energy markets are reacting to global supply data. Watch for breakouts.
⚠️ Not Financial Advice. DYOR. Past performance ≠ future results.
⚠️ Not Financial Advice. DYOR. Past performance ≠ future results.
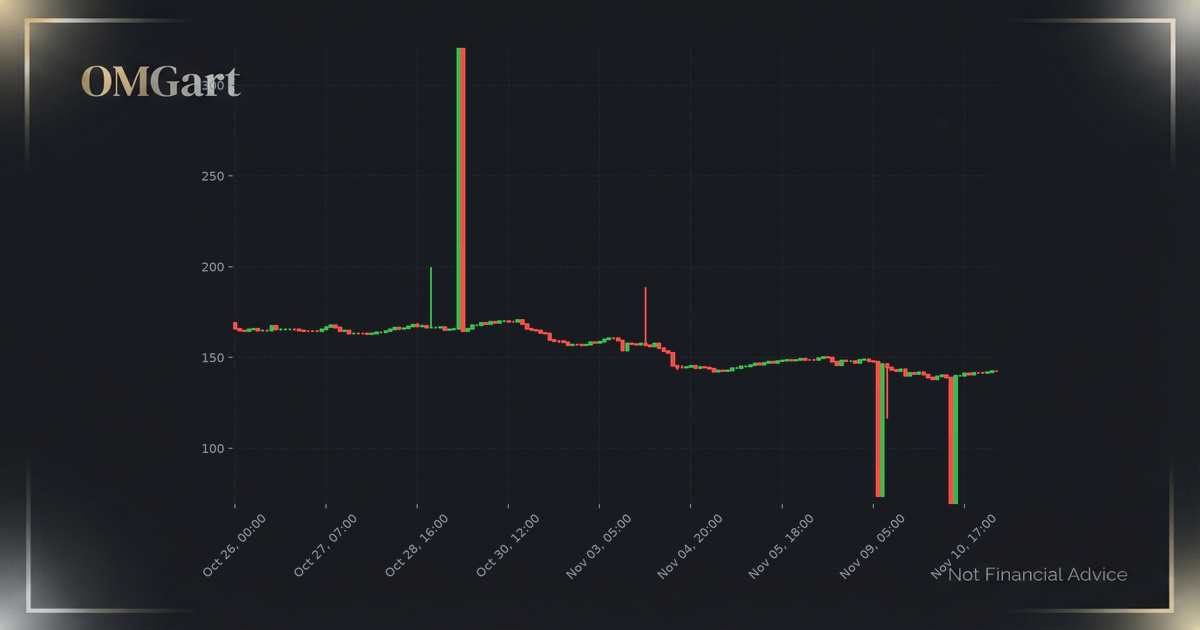
103
·
--
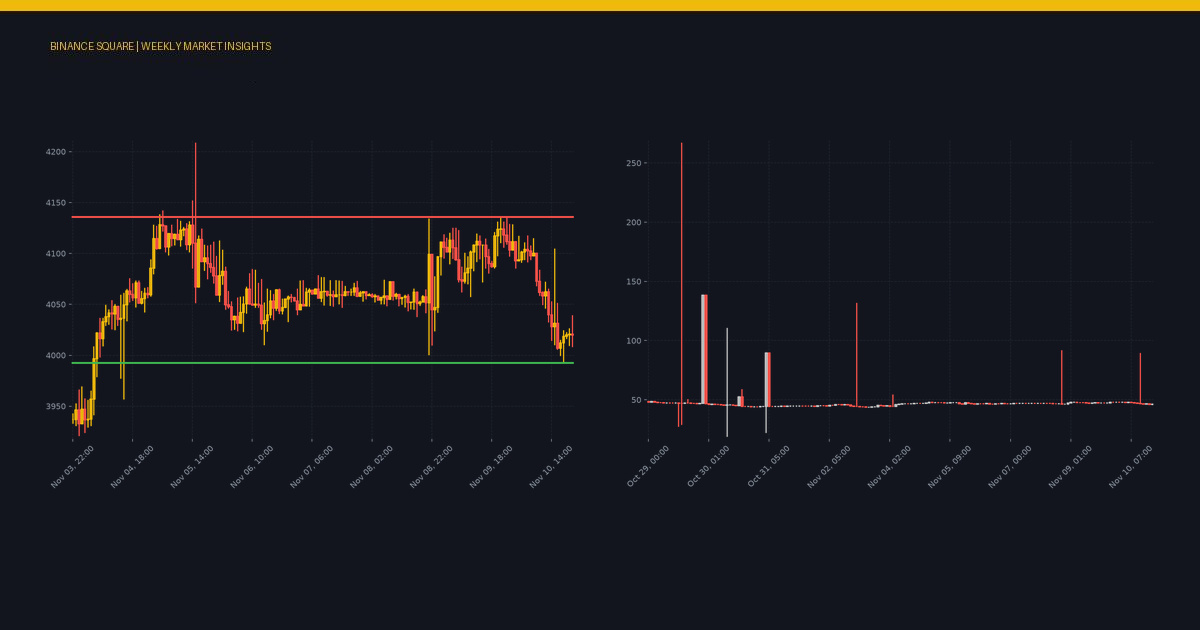
ලිපිය
$PAXG & $SLV Weekly Review: Gold at $4019, Silver at $46.50. Precious metals showing key movements.$PAXG & $SLV Weekly Review: Gold at $4019, Silver at $46.50. Precious metals showing key movements.
⚠️ Not Financial Advice. DYOR. Past performance ≠ future results.
$PAXG & $SLV Weekly Review: Gold at $4019, Silver at $46.50. Precious metals showing key movements.
$PAXG & $SLV Weekly Review: Gold at $4019, Silver at $46.50. Precious metals showing key movements.
⚠️ Not Financial Advice. DYOR. Past performance ≠ future results.
⚠️ Not Financial Advice. DYOR. Past performance ≠ future results.
1
1
531
·
--
බෙයාරිෂ්
Valid until 1/1/27
️ Not Financial Advice. DYOR. Past performance ≠ future results.
Valid until 1/1/27
️ Not Financial Advice. DYOR. Past performance ≠ future results.
️ Not Financial Advice. DYOR. Past performance ≠ future results.
OMGart
·
--
Gold holds above $4,100, but here's the key risk. US midterms pressure the dollar and yields. A break below $4,040 could open the door to $3,650 and $3,500 supports. Can $Gold hold these levels? Comment below. Not Financial Advice. #Gold $Gold #XAUUSD
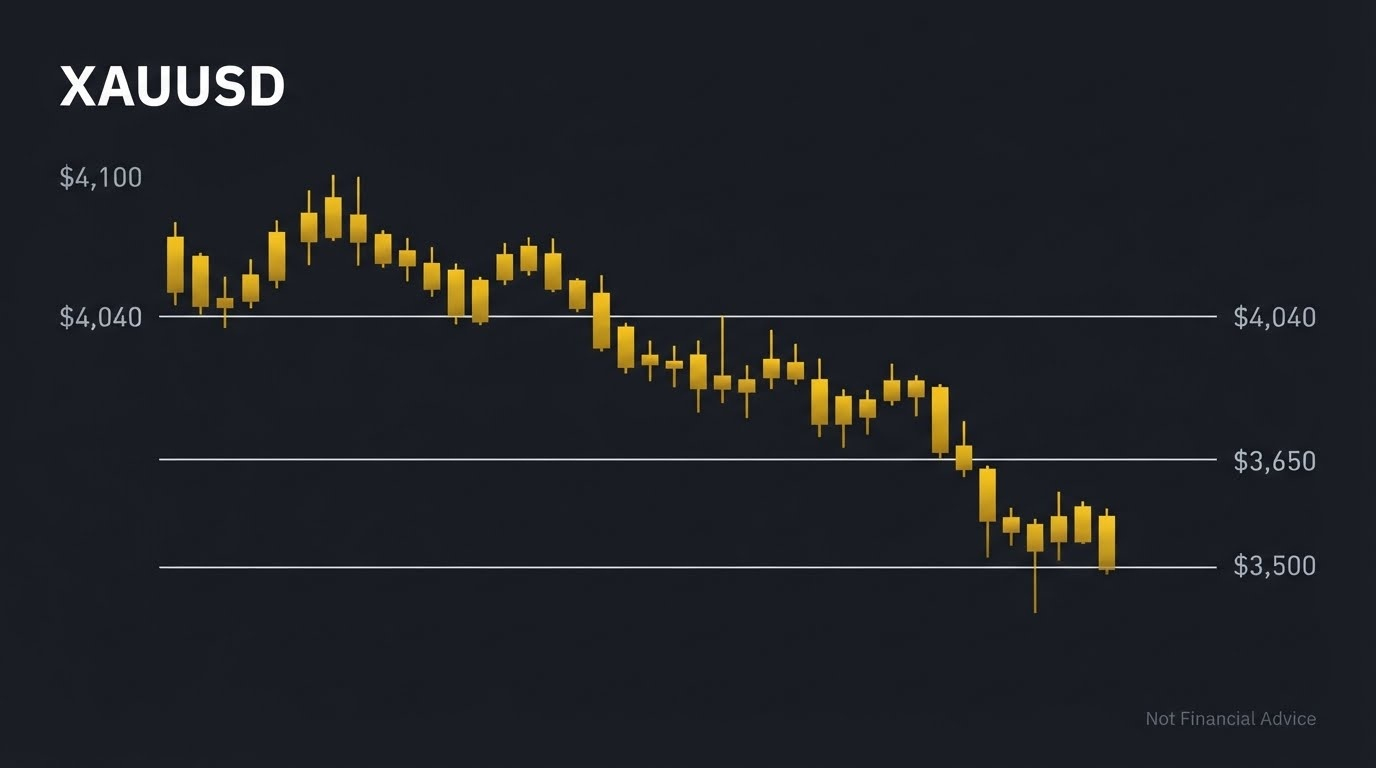
37
·
--
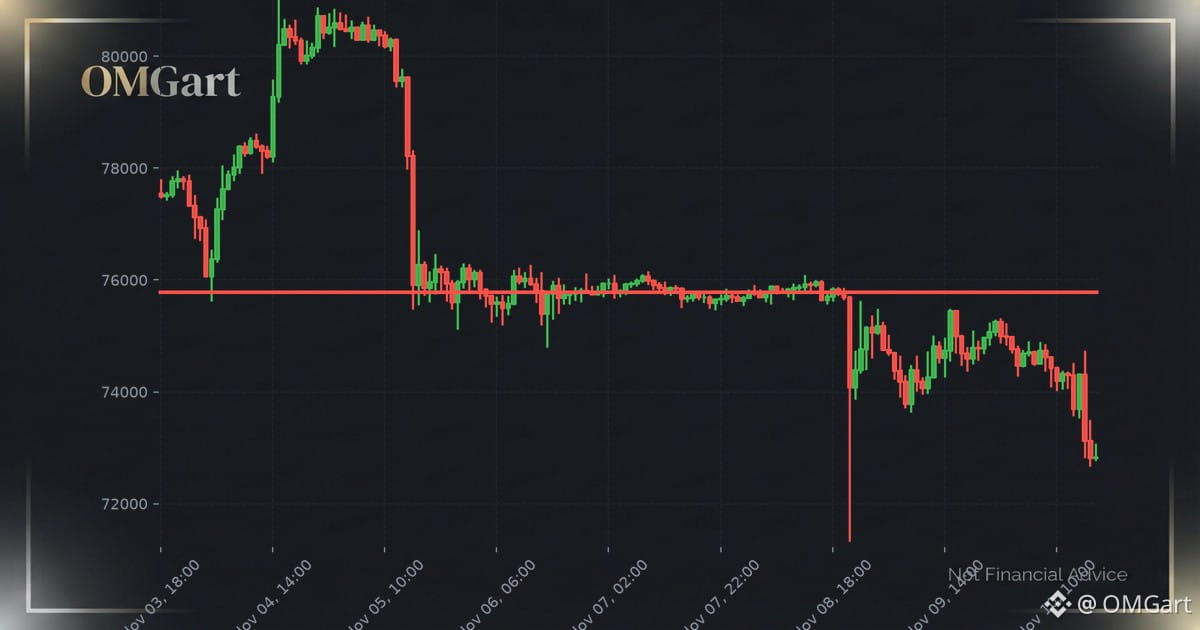
ලිපිය
$BTC Update: Price is $72831.57 (-2.6% 24h). Market is showing volatility. Keep an eye on key levels.$BTC Update: Price is $72831.57 (-2.6% 24h). Market is showing volatility. Keep an eye on key levels.
⚠️ Not Financial Advice. DYOR.
$BTC Update: Price is $72831.57 (-2.6% 24h). Market is showing volatility. Keep an eye on key levels.
$BTC Update: Price is $72831.57 (-2.6% 24h). Market is showing volatility. Keep an eye on key levels.
⚠️ Not Financial Advice. DYOR.
⚠️ Not Financial Advice. DYOR.
133
තවත් අන්තර්ගතයන් ගවේෂණය කිරීමට ඇතුල් වන්න
Binance චතුරශ්රය හි ගෝලීය ක්රිප්ටෝ පරිශීලකයින් හා එක්වන්න
⚡️ ක්රිප්ටෝ පිළිබඳ නවතම සහ ප්රයෝජනවත් තොරතුරු ලබා ගන්න.
💬 ලොව විශාලතම ක්රිප්ටෝ හුවමාරුව මගින් විශ්වාස කෙරේ.
👍 සත්යායනය කරන ලද නිර්මාණකරුවන්ගෙන් සැබෑ විදසුන් සොයා ගන්න.
විද්යුත් තැපෑල / දුරකථන අංකය
නැගී එන මාතෘකා
NvidiaEarningsTonight:AIStocks’NextMove?
77,324 නැරඹීම්
1,026 සාකච්ඡා කරමින්
Nvidia Earnings Day: Interim CEO's First Appearance — Can the AI Story Hold?
Binance News
·17 කැමත්ත දැක්වීම්
·7.9k නැරඹීම්
A Packed Week of Earnings and Data Tests Markets
125,875 නැරඹීම්
622 සාකච්ඡා කරමින්
AnthropicIPOTestsInvestorAppetiteForAI
280,266 නැරඹීම්
2,694 සාකච්ඡා කරමින්