
Bloock CHAIN 1
5k පෝස්ටු

Bloock CHAIN 1
වාර්තා කරන්න
පරිශීලක අවහිර කරන්න
he crypto sajjad Ahmed 804 market price trading value and all coin
14 හඹා යමින්
28.0K+ හඹා යන්නන්
9.2K+ කැමති විය
පෝස්ටු
සියල්ල
උපුටා දැක්වීම්
සජීවි
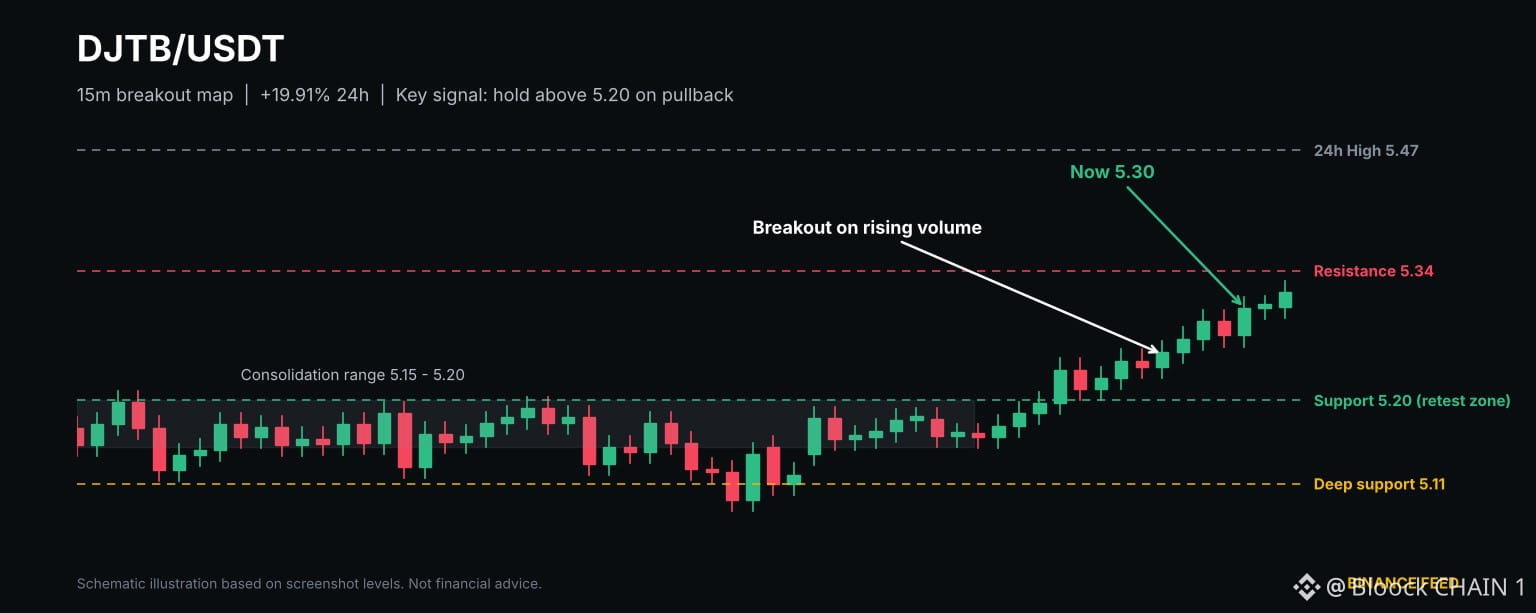
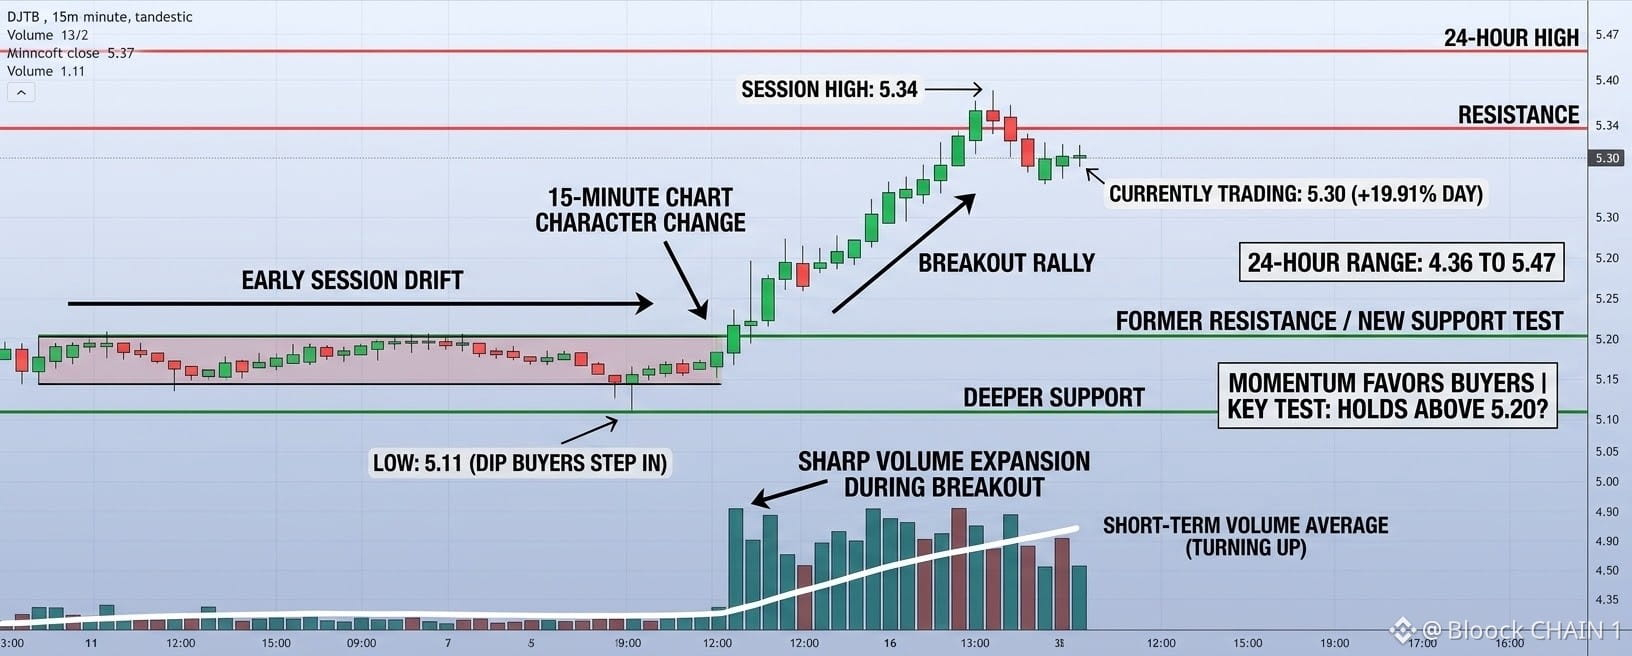
For most of the session, $DJTB drifted sideways in a narrow band around 5.15 to 5.20, with sellers briefly pushing price down to 5.11 before dip buyers stepped in. Then the 15-minute chart changed character. A string of strong green candles carried the pair to a session high of 5.34, and it now trades at 5.30, up 19.91 percent on the day.
Volume confirms the move. Trading activity expanded sharply during the breakout, and the short-term volume average has turned upward, which suggests genuine participation rather than a thin spike. The 24-hour range of 4.36 to 5.47 shows the pair is still working below its daily high.
Key levels are clear. Support sits near 5.20, the former consolidation ceiling, with deeper support at 5.11. Resistance appears at 5.34, then the 24-hour high of 5.47.
The most important signal is whether price holds above 5.20 on any pullback. A successful retest would strengthen the bullish case, while a close back inside the old range would hint at a failed breakout. The pair also trades slightly below the underlying stock's reference price, a gap worth monitoring.
Momentum favors buyers for now, but a near-20 percent daily gain demands discipline and defined risk.
Will DJTB convert 5.20 into lasting support, or return to its range
For most of the session, $DJTB drifted sideways in a narrow band around 5.15 to 5.20, with sellers briefly pushing price down to 5.11 before dip buyers stepped in. Then the 15-minute chart changed character. A string of strong green candles carried the pair to a session high of 5.34, and it now trades at 5.30, up 19.91 percent on the day.
Volume confirms the move. Trading activity expanded sharply during the breakout, and the short-term volume average has turned upward, which suggests genuine participation rather than a thin spike. The 24-hour range of 4.36 to 5.47 shows the pair is still working below its daily high.
Key levels are clear. Support sits near 5.20, the former consolidation ceiling, with deeper support at 5.11. Resistance appears at 5.34, then the 24-hour high of 5.47.
The most important signal is whether price holds above 5.20 on any pullback. A successful retest would strengthen the bullish case, while a close back inside the old range would hint at a failed breakout. The pair also trades slightly below the underlying stock's reference price, a gap worth monitoring.
Momentum favors buyers for now, but a near-20 percent daily gain demands discipline and defined risk.
Will DJTB convert 5.20 into lasting support, or return to its range
Volume confirms the move. Trading activity expanded sharply during the breakout, and the short-term volume average has turned upward, which suggests genuine participation rather than a thin spike. The 24-hour range of 4.36 to 5.47 shows the pair is still working below its daily high.
Key levels are clear. Support sits near 5.20, the former consolidation ceiling, with deeper support at 5.11. Resistance appears at 5.34, then the 24-hour high of 5.47.
The most important signal is whether price holds above 5.20 on any pullback. A successful retest would strengthen the bullish case, while a close back inside the old range would hint at a failed breakout. The pair also trades slightly below the underlying stock's reference price, a gap worth monitoring.
Momentum favors buyers for now, but a near-20 percent daily gain demands discipline and defined risk.
Will DJTB convert 5.20 into lasting support, or return to its range
92
$HOT /USDT: A Powerful Rebound Brings Buyers Back Into Focus
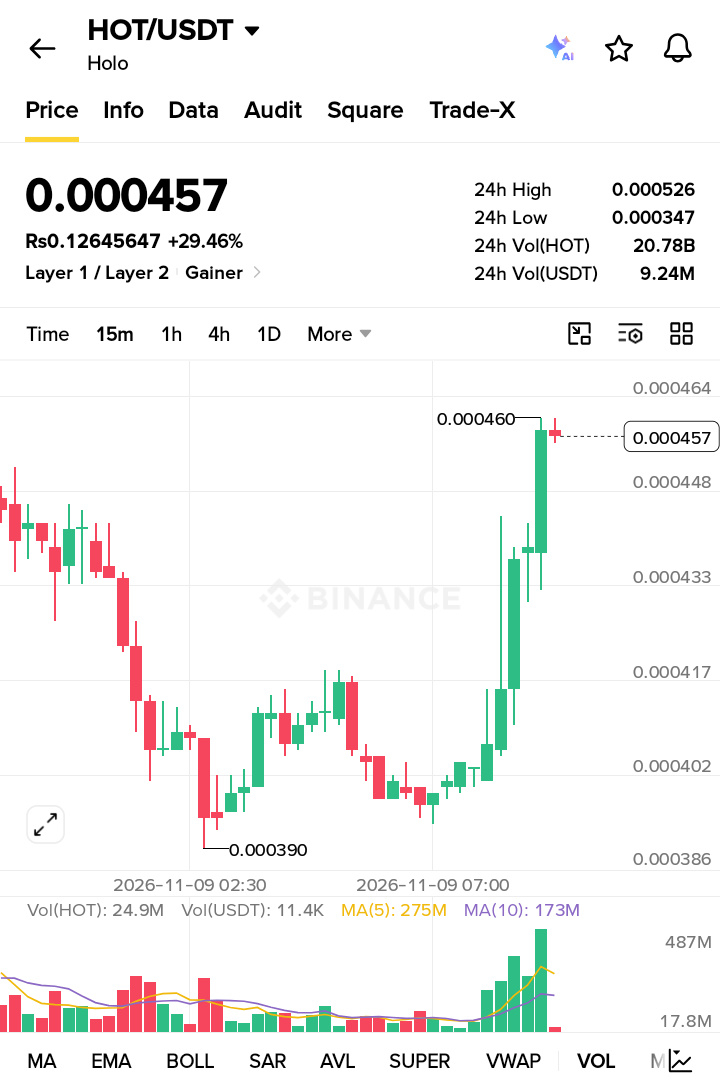
Holo (HOT) is showing renewed bullish strength, trading at $0.000457, up 29.46% over the last 24 hours. The 15-minute chart reveals a notable recovery after price declined toward the $0.000390 area. Buyers gradually regained control, building momentum before a sharp upward move pushed HOT toward $0.000460.
However, the latest candles suggest the market is approaching an important decision zone. The $0.000460 level is the immediate resistance, while the broader 24-hour high of $0.000526 represents the next major upside barrier.
On the downside, $0.000448 and $0.000433 are the first support areas to monitor. A deeper retracement could bring $0.000417 and $0.000402 into focus.
If buyers maintain control above $0.000448 and secure a convincing breakout above $0.000460, bullish momentum could continue. Conversely, rejection near resistance may trigger profit-taking and a temporary cooling phase.
Key Takeaway: HOT has demonstrated impressive recovery strength, but holding recent gains and overcoming resistance will determine whether this rally develops into a stronger trend.
$HOT /USDT: A Powerful Rebound Brings Buyers Back Into Focus
Holo (HOT) is showing renewed bullish strength, trading at $0.000457, up 29.46% over the last 24 hours. The 15-minute chart reveals a notable recovery after price declined toward the $0.000390 area. Buyers gradually regained control, building momentum before a sharp upward move pushed HOT toward $0.000460.
However, the latest candles suggest the market is approaching an important decision zone. The $0.000460 level is the immediate resistance, while the broader 24-hour high of $0.000526 represents the next major upside barrier.
On the downside, $0.000448 and $0.000433 are the first support areas to monitor. A deeper retracement could bring $0.000417 and $0.000402 into focus.
If buyers maintain control above $0.000448 and secure a convincing breakout above $0.000460, bullish momentum could continue. Conversely, rejection near resistance may trigger profit-taking and a temporary cooling phase.
Key Takeaway: HOT has demonstrated impressive recovery strength, but holding recent gains and overcoming resistance will determine whether this rally develops into a stronger trend.
Holo (HOT) is showing renewed bullish strength, trading at $0.000457, up 29.46% over the last 24 hours. The 15-minute chart reveals a notable recovery after price declined toward the $0.000390 area. Buyers gradually regained control, building momentum before a sharp upward move pushed HOT toward $0.000460.
However, the latest candles suggest the market is approaching an important decision zone. The $0.000460 level is the immediate resistance, while the broader 24-hour high of $0.000526 represents the next major upside barrier.
On the downside, $0.000448 and $0.000433 are the first support areas to monitor. A deeper retracement could bring $0.000417 and $0.000402 into focus.
If buyers maintain control above $0.000448 and secure a convincing breakout above $0.000460, bullish momentum could continue. Conversely, rejection near resistance may trigger profit-taking and a temporary cooling phase.
Key Takeaway: HOT has demonstrated impressive recovery strength, but holding recent gains and overcoming resistance will determine whether this rally develops into a stronger trend.
198
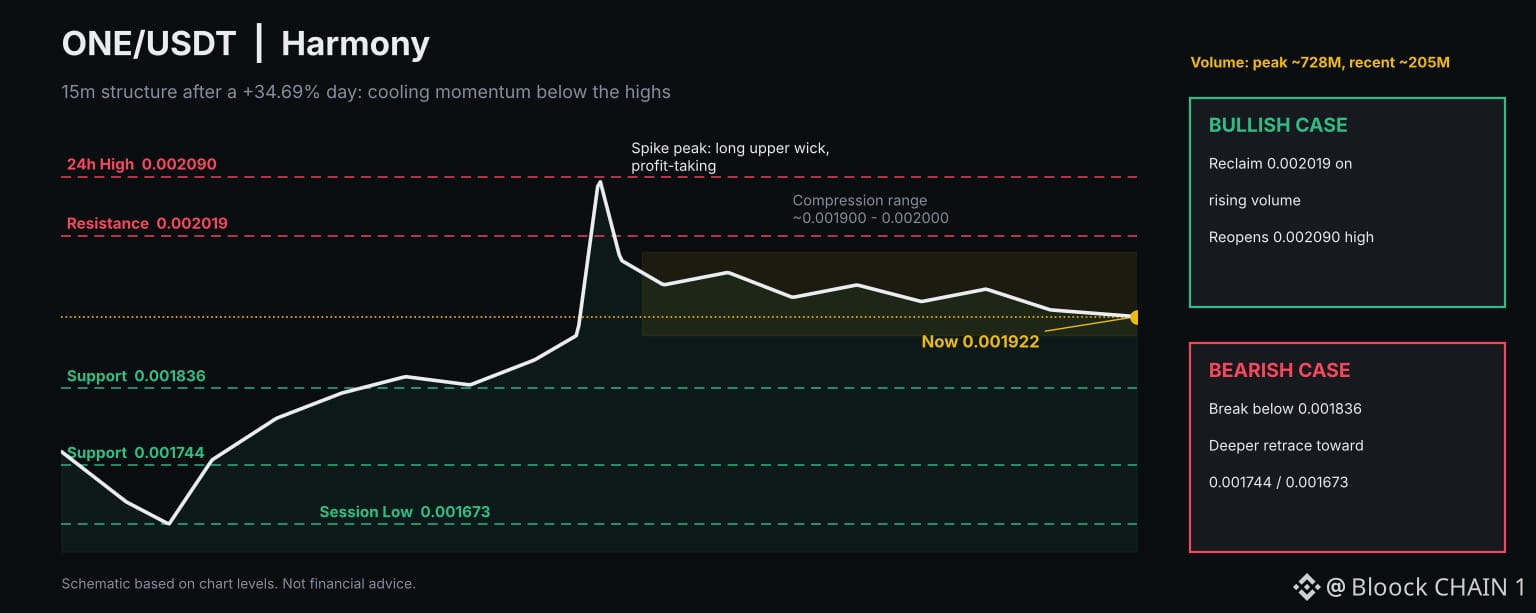
Harmony's $ONE /USDT is trading at 0.001922, up 34.69% on the day, yet the 15-minute chart shows momentum fading near the highs. A sharp vertical push carried price to the 24h high of 0.002090, but the long upper wick on that candle signals aggressive profit-taking. Sellers have defended that zone ever since.
Since then, price has compressed into a tight band between roughly 0.001900 and 0.002000, printing a string of small-bodied candles. The latest red candles, with upper wicks near 0.002000, suggest buyers are struggling to reclaim momentum.
Volume tells a similar story. The spike candle drew the largest bar on the chart, near 728M, while recent bars are noticeably lighter, hovering around 205M. The 5-period volume average has slipped back toward the 10-period line, showing cooling participation.
Key levels: support sits near 0.001836, with deeper support at 0.001744 and the session low at 0.001673. Resistance is 0.002019, then the 0.002090 peak.
Bullish case: a clean reclaim of 0.002019 on rising volume reopens the high. Bearish case: a breakdown below 0.001836 could trigger a deeper retracement.
Takeaway: after a 34% day, patience and confirmation matter more than chasing candles.
Harmony's $ONE /USDT is trading at 0.001922, up 34.69% on the day, yet the 15-minute chart shows momentum fading near the highs. A sharp vertical push carried price to the 24h high of 0.002090, but the long upper wick on that candle signals aggressive profit-taking. Sellers have defended that zone ever since.
Since then, price has compressed into a tight band between roughly 0.001900 and 0.002000, printing a string of small-bodied candles. The latest red candles, with upper wicks near 0.002000, suggest buyers are struggling to reclaim momentum.
Volume tells a similar story. The spike candle drew the largest bar on the chart, near 728M, while recent bars are noticeably lighter, hovering around 205M. The 5-period volume average has slipped back toward the 10-period line, showing cooling participation.
Key levels: support sits near 0.001836, with deeper support at 0.001744 and the session low at 0.001673. Resistance is 0.002019, then the 0.002090 peak.
Bullish case: a clean reclaim of 0.002019 on rising volume reopens the high. Bearish case: a breakdown below 0.001836 could trigger a deeper retracement.
Takeaway: after a 34% day, patience and confirmation matter more than chasing candles.
Since then, price has compressed into a tight band between roughly 0.001900 and 0.002000, printing a string of small-bodied candles. The latest red candles, with upper wicks near 0.002000, suggest buyers are struggling to reclaim momentum.
Volume tells a similar story. The spike candle drew the largest bar on the chart, near 728M, while recent bars are noticeably lighter, hovering around 205M. The 5-period volume average has slipped back toward the 10-period line, showing cooling participation.
Key levels: support sits near 0.001836, with deeper support at 0.001744 and the session low at 0.001673. Resistance is 0.002019, then the 0.002090 peak.
Bullish case: a clean reclaim of 0.002019 on rising volume reopens the high. Bearish case: a breakdown below 0.001836 could trigger a deeper retracement.
Takeaway: after a 34% day, patience and confirmation matter more than chasing candles.
298
·
--
උසබ තත්ත්වය
$APPB Cools Near 330 After a Violent Breakout: Digestion or Distribution?
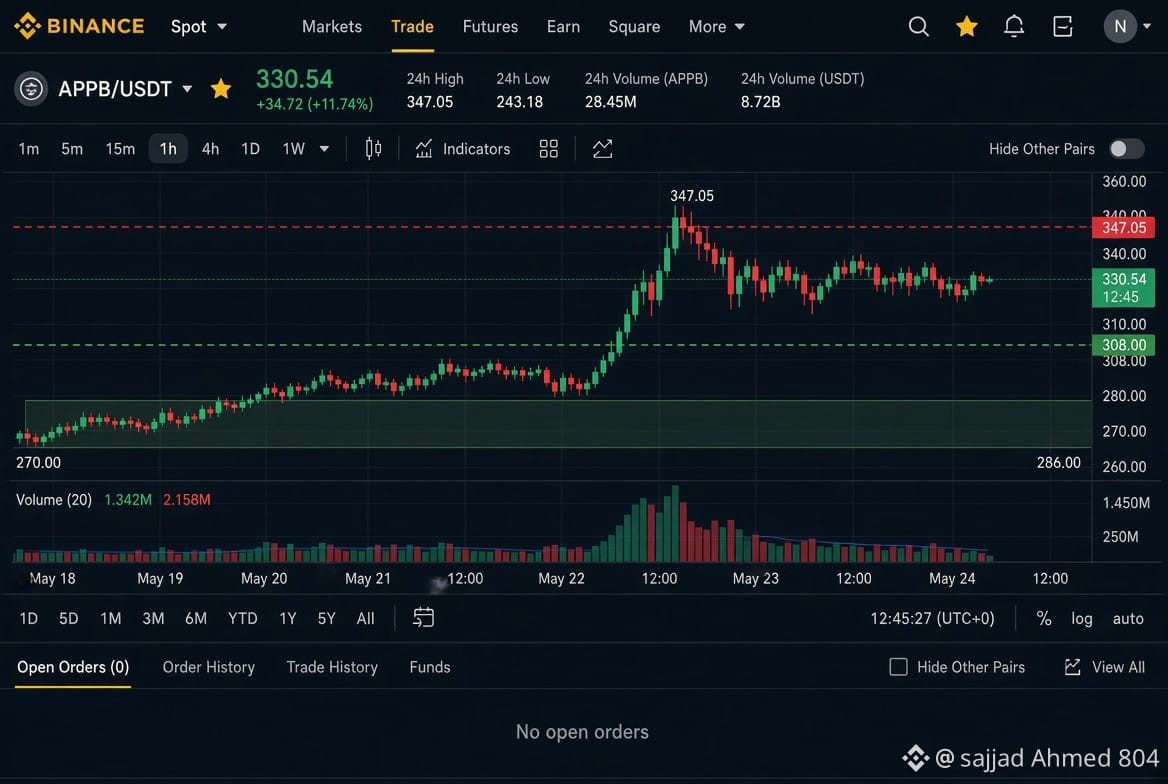
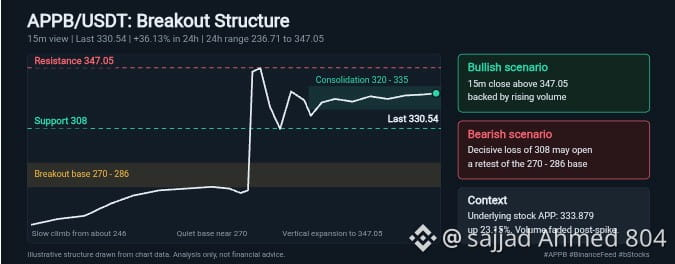
APPB/USDT sits at 330.54, up 36.13% over 24 hours, with a range between 236.71 and 347.05. The chart reads like two different markets stitched together. First came a patient grind from about 246 toward 270, then an abrupt vertical push that took price to the 347.05 high within a handful of candles.
What matters now is how price is behaving after the spike. Instead of a sharp reversal, candles have compressed into a narrow band between roughly 320 and 335. That kind of tight, small-bodied action often points to the market absorbing gains, though it can also precede a move in either direction. The underlying stock, APP, trades at 333.879, up 23.15%, keeping the bStocks pairing in line with its reference asset.
Resistance: 347.05. Support: 308, with the pre-breakout base around 270 to 286 as a deeper fallback.
Bullish scenario: a 15m close above 347.05 backed by renewed volume. Bearish scenario: a decisive loss of 308 could invite a pullback toward the breakout zone.
Volume surged on the move and has since cooled, so the next volume expansion will likely reveal intent.
Takeaway: after vertical rallies, defined levels beat emotion. Not financial advice.
$APPB Cools Near 330 After a Violent Breakout: Digestion or Distribution?
APPB/USDT sits at 330.54, up 36.13% over 24 hours, with a range between 236.71 and 347.05. The chart reads like two different markets stitched together. First came a patient grind from about 246 toward 270, then an abrupt vertical push that took price to the 347.05 high within a handful of candles.
What matters now is how price is behaving after the spike. Instead of a sharp reversal, candles have compressed into a narrow band between roughly 320 and 335. That kind of tight, small-bodied action often points to the market absorbing gains, though it can also precede a move in either direction. The underlying stock, APP, trades at 333.879, up 23.15%, keeping the bStocks pairing in line with its reference asset.
Resistance: 347.05. Support: 308, with the pre-breakout base around 270 to 286 as a deeper fallback.
Bullish scenario: a 15m close above 347.05 backed by renewed volume. Bearish scenario: a decisive loss of 308 could invite a pullback toward the breakout zone.
Volume surged on the move and has since cooled, so the next volume expansion will likely reveal intent.
Takeaway: after vertical rallies, defined levels beat emotion. Not financial advice.
APPB/USDT sits at 330.54, up 36.13% over 24 hours, with a range between 236.71 and 347.05. The chart reads like two different markets stitched together. First came a patient grind from about 246 toward 270, then an abrupt vertical push that took price to the 347.05 high within a handful of candles.
What matters now is how price is behaving after the spike. Instead of a sharp reversal, candles have compressed into a narrow band between roughly 320 and 335. That kind of tight, small-bodied action often points to the market absorbing gains, though it can also precede a move in either direction. The underlying stock, APP, trades at 333.879, up 23.15%, keeping the bStocks pairing in line with its reference asset.
Resistance: 347.05. Support: 308, with the pre-breakout base around 270 to 286 as a deeper fallback.
Bullish scenario: a 15m close above 347.05 backed by renewed volume. Bearish scenario: a decisive loss of 308 could invite a pullback toward the breakout zone.
Volume surged on the move and has since cooled, so the next volume expansion will likely reveal intent.
Takeaway: after vertical rallies, defined levels beat emotion. Not financial advice.
1
194
·
--
උසබ තත්ත්වය
$BOTB Holds Its Gains, but 23.17 Is the Line Buyers Cannot Lose
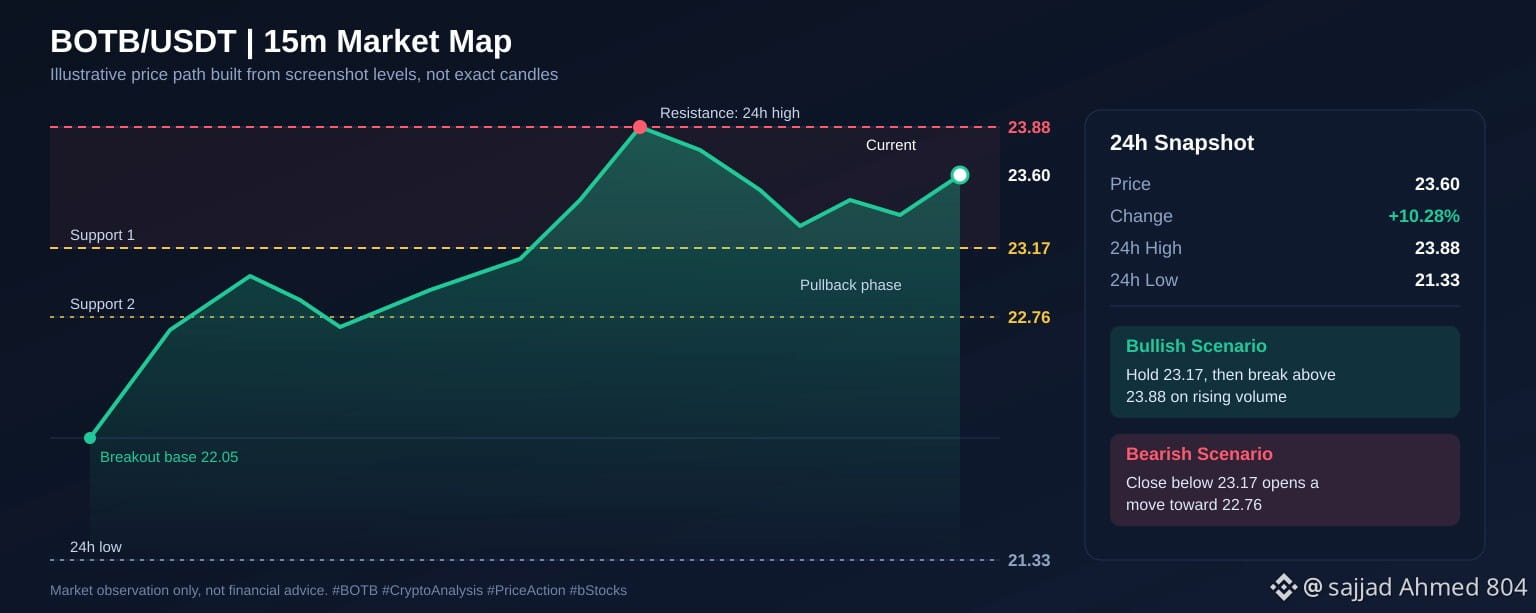
BOTB/USDT is trading at 23.60, up 10.28% over 24 hours, with a daily range of 21.33 to 23.88. Price sits close to the top of that band, which keeps the short-term bias constructive.
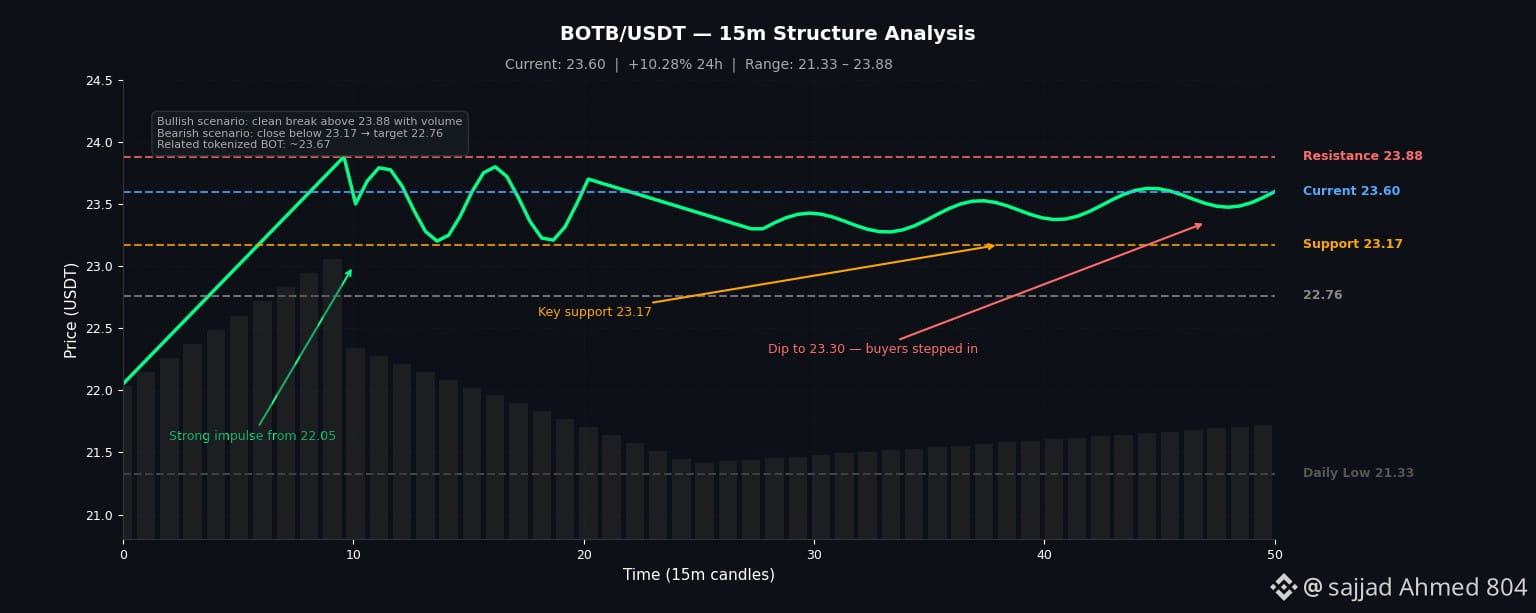
The 15m structure shows a strong impulse from the 22.05 area, followed by consolidation and a push to the 23.88 high. Since then, candles have turned mixed, with a sharp red move dragging price toward 23.30 before buyers stepped back in. Volume peaked during the early surge and has thinned out since, which suggests the rally is running on less fuel.
Resistance: 23.88, the 24h high. Support: 23.17, followed by 22.76 and the 21.33 daily low.
Bullish scenario: a clean break above 23.88 with rising volume would open the door to fresh highs. Bearish scenario: a close below 23.17 could signal fading momentum and invite a deeper retracement toward 22.76.
The related tokenized stock BOT is trading near 23.67, up 8.88%, showing similar strength.
Takeaway: the trend is positive, but follow-through volume will decide whether this is a breakout or a pause. Not financial advice.
$BOTB Holds Its Gains, but 23.17 Is the Line Buyers Cannot Lose
BOTB/USDT is trading at 23.60, up 10.28% over 24 hours, with a daily range of 21.33 to 23.88. Price sits close to the top of that band, which keeps the short-term bias constructive.
The 15m structure shows a strong impulse from the 22.05 area, followed by consolidation and a push to the 23.88 high. Since then, candles have turned mixed, with a sharp red move dragging price toward 23.30 before buyers stepped back in. Volume peaked during the early surge and has thinned out since, which suggests the rally is running on less fuel.
Resistance: 23.88, the 24h high. Support: 23.17, followed by 22.76 and the 21.33 daily low.
Bullish scenario: a clean break above 23.88 with rising volume would open the door to fresh highs. Bearish scenario: a close below 23.17 could signal fading momentum and invite a deeper retracement toward 22.76.
The related tokenized stock BOT is trading near 23.67, up 8.88%, showing similar strength.
Takeaway: the trend is positive, but follow-through volume will decide whether this is a breakout or a pause. Not financial advice.
BOTB/USDT is trading at 23.60, up 10.28% over 24 hours, with a daily range of 21.33 to 23.88. Price sits close to the top of that band, which keeps the short-term bias constructive.
The 15m structure shows a strong impulse from the 22.05 area, followed by consolidation and a push to the 23.88 high. Since then, candles have turned mixed, with a sharp red move dragging price toward 23.30 before buyers stepped back in. Volume peaked during the early surge and has thinned out since, which suggests the rally is running on less fuel.
Resistance: 23.88, the 24h high. Support: 23.17, followed by 22.76 and the 21.33 daily low.
Bullish scenario: a clean break above 23.88 with rising volume would open the door to fresh highs. Bearish scenario: a close below 23.17 could signal fading momentum and invite a deeper retracement toward 22.76.
The related tokenized stock BOT is trading near 23.67, up 8.88%, showing similar strength.
Takeaway: the trend is positive, but follow-through volume will decide whether this is a breakout or a pause. Not financial advice.
1
180
·
--
උසබ තත්ත්වය
$GPROB Pushes Past 1.09 After a Violent Overnight Reversal
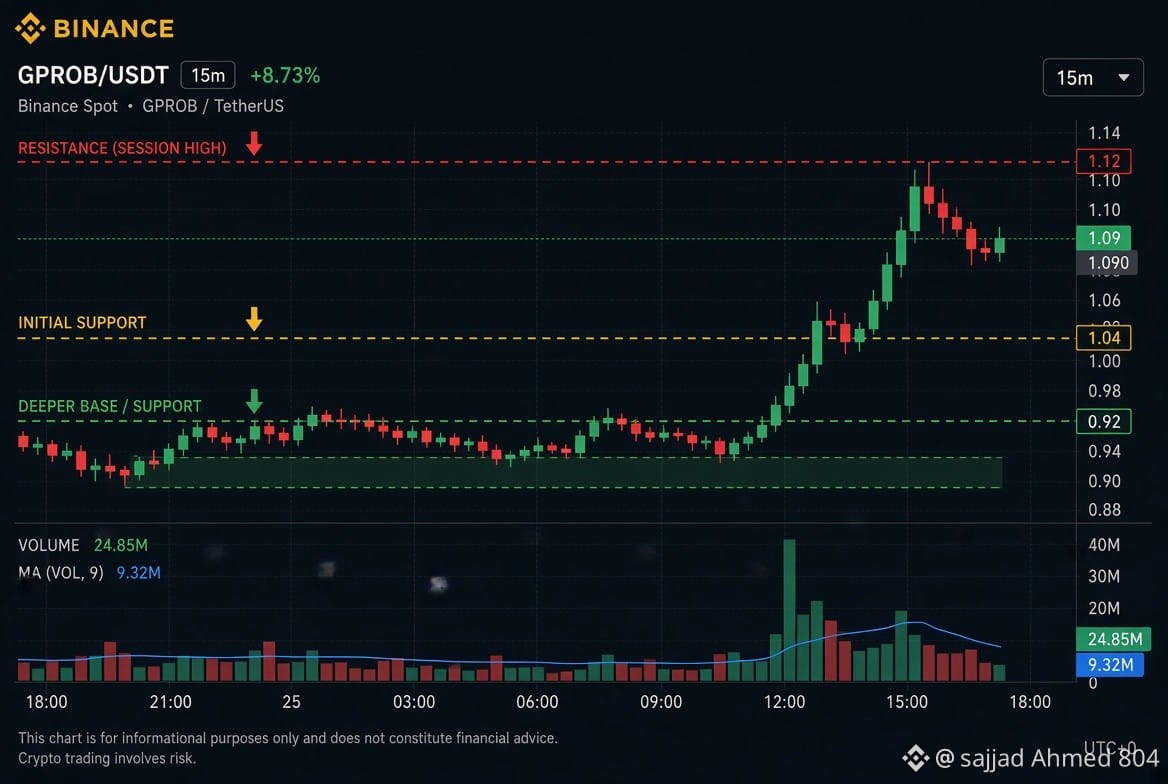
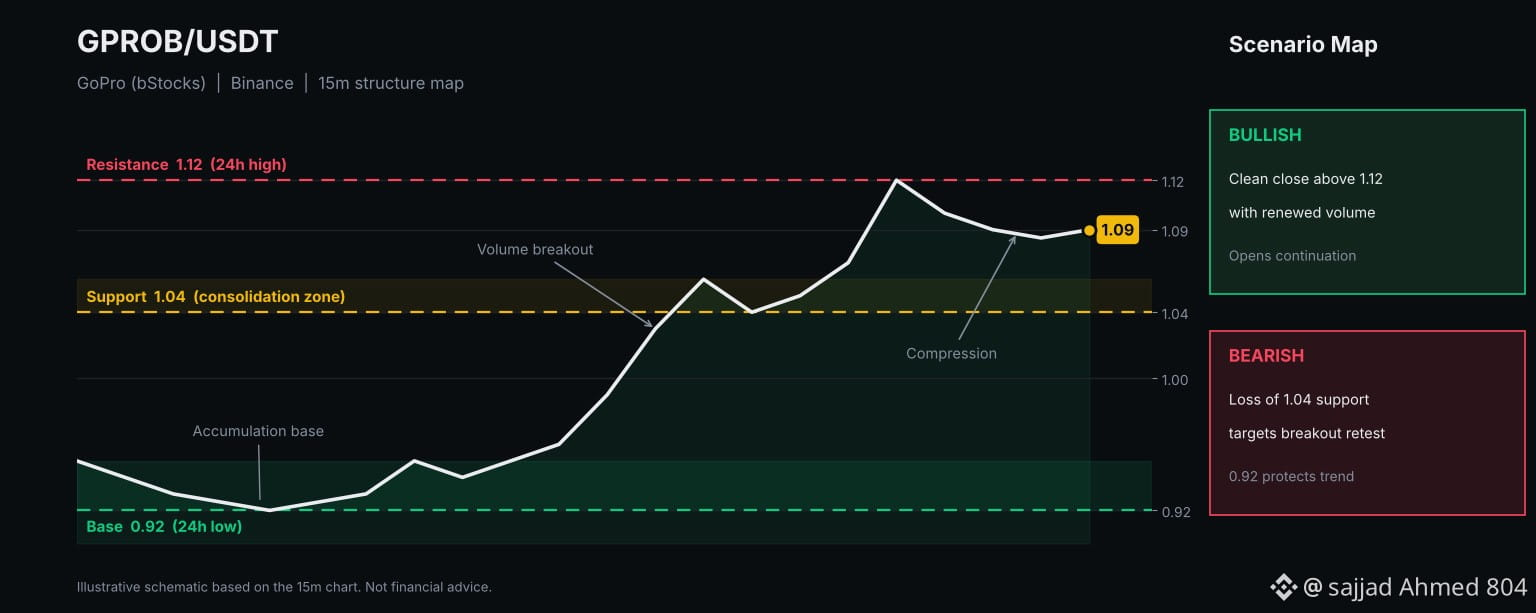
GoPro (bStocks) against USDT has changed character in a single session. After grinding sideways near the 0.92 floor on the 15-minute chart, price broke upward on a burst of heavy volume and tagged 1.12 before settling at 1.09, up 14.74 percent.
The structure tells a clear story. A tight base around 0.92 to 0.95 absorbed selling, then two large green candles cleared overhead supply in quick succession. Since the peak, candles have turned small and compressed, suggesting buyers are holding ground while momentum cools. Volume has faded from its spike, and the moving averages on the volume panel are curling lower, a sign the initial rush is exhausting.
Resistance sits at 1.12, the session high. Initial support is near 1.04, where an earlier consolidation formed, with the deeper base at 0.92 as the line that matters for trend integrity.
The bullish case needs a clean close above 1.12 backed by renewed volume. The bearish case begins if 1.04 gives way, opening a retest of the breakout zone.
Takeaway: the move is real, but the next volume reaction decides whether this is continuation or a pause before retracement. Manage risk accordingly.
$GPROB Pushes Past 1.09 After a Violent Overnight Reversal
GoPro (bStocks) against USDT has changed character in a single session. After grinding sideways near the 0.92 floor on the 15-minute chart, price broke upward on a burst of heavy volume and tagged 1.12 before settling at 1.09, up 14.74 percent.
The structure tells a clear story. A tight base around 0.92 to 0.95 absorbed selling, then two large green candles cleared overhead supply in quick succession. Since the peak, candles have turned small and compressed, suggesting buyers are holding ground while momentum cools. Volume has faded from its spike, and the moving averages on the volume panel are curling lower, a sign the initial rush is exhausting.
Resistance sits at 1.12, the session high. Initial support is near 1.04, where an earlier consolidation formed, with the deeper base at 0.92 as the line that matters for trend integrity.
The bullish case needs a clean close above 1.12 backed by renewed volume. The bearish case begins if 1.04 gives way, opening a retest of the breakout zone.
Takeaway: the move is real, but the next volume reaction decides whether this is continuation or a pause before retracement. Manage risk accordingly.
GoPro (bStocks) against USDT has changed character in a single session. After grinding sideways near the 0.92 floor on the 15-minute chart, price broke upward on a burst of heavy volume and tagged 1.12 before settling at 1.09, up 14.74 percent.
The structure tells a clear story. A tight base around 0.92 to 0.95 absorbed selling, then two large green candles cleared overhead supply in quick succession. Since the peak, candles have turned small and compressed, suggesting buyers are holding ground while momentum cools. Volume has faded from its spike, and the moving averages on the volume panel are curling lower, a sign the initial rush is exhausting.
Resistance sits at 1.12, the session high. Initial support is near 1.04, where an earlier consolidation formed, with the deeper base at 0.92 as the line that matters for trend integrity.
The bullish case needs a clean close above 1.12 backed by renewed volume. The bearish case begins if 1.04 gives way, opening a retest of the breakout zone.
Takeaway: the move is real, but the next volume reaction decides whether this is continuation or a pause before retracement. Manage risk accordingly.
1
174
Binance Square Spotlight: Sophon ($SOPH ) Tests the 0.00181 Ceiling After a 27.86% Surge
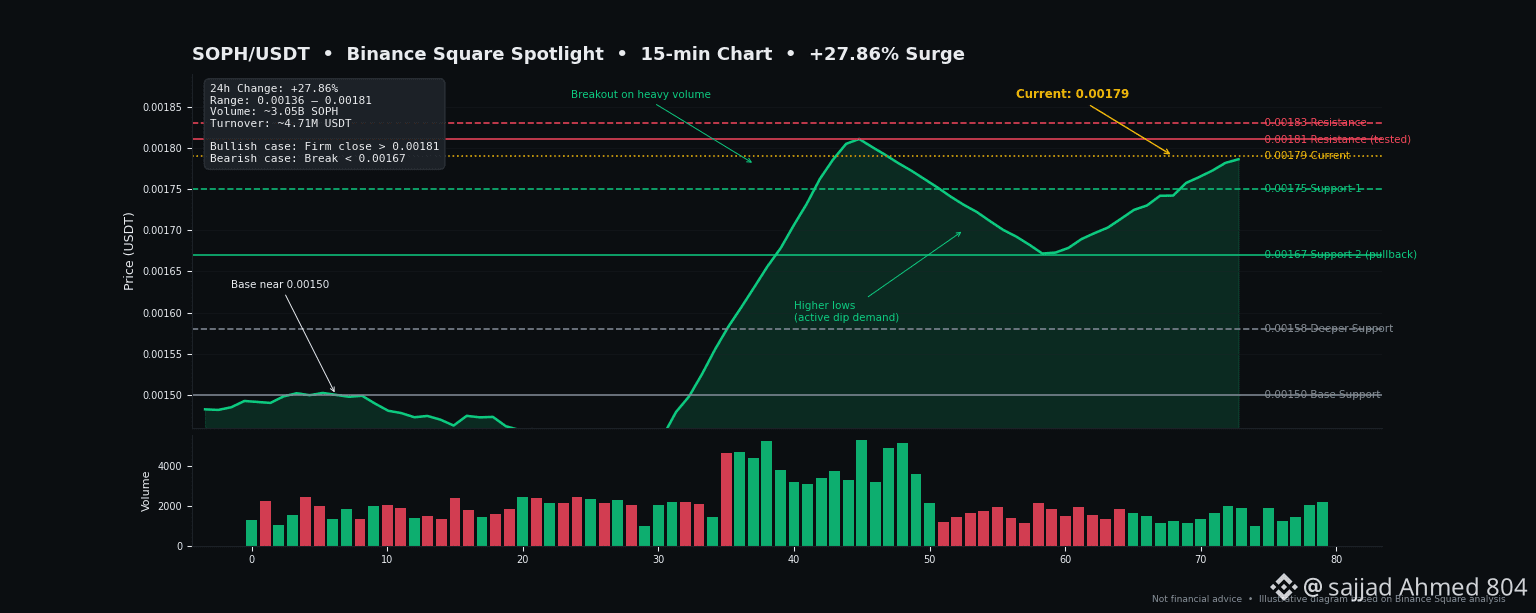
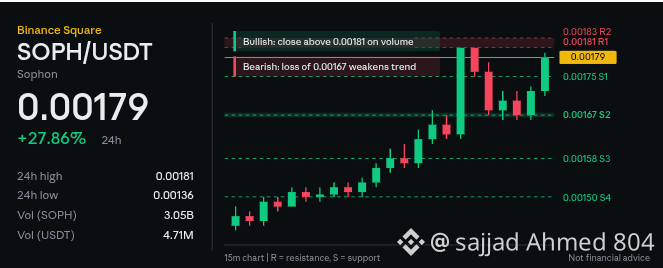
Binance Square readers, Sophon (SOPH/USDT) is trading at 0.00179 after a sharp 24-hour climb, with a range between 0.00136 and 0.00181. Binance data shows roughly 3.05B SOPH changing hands, about 4.71M USDT in turnover.
On the 15-minute chart, price built a base near 0.00150, broke out on heavy volume, tagged 0.00181, then cooled toward 0.00167 before buyers returned. A sequence of higher lows during that pullback points to active dip demand.
Resistance: 0.00181, then 0.00183. Support: 0.00175 first, followed by 0.00167, with 0.00158 and 0.00150 as deeper floors.
Bullish case: a firm close above 0.00181 on expanding volume could open room for another leg higher. Bearish case: a break below 0.00167 would damage the structure and bring lower supports into play. Volume has softened since the peak, so any breakout needs confirmation.
Takeaway: strong momentum rewards discipline, not impulse. Let 0.00181 resolve first and size risk carefully. This is not financial advice.
Binance Square Spotlight: Sophon ($SOPH ) Tests the 0.00181 Ceiling After a 27.86% Surge
Binance Square readers, Sophon (SOPH/USDT) is trading at 0.00179 after a sharp 24-hour climb, with a range between 0.00136 and 0.00181. Binance data shows roughly 3.05B SOPH changing hands, about 4.71M USDT in turnover.
On the 15-minute chart, price built a base near 0.00150, broke out on heavy volume, tagged 0.00181, then cooled toward 0.00167 before buyers returned. A sequence of higher lows during that pullback points to active dip demand.
Resistance: 0.00181, then 0.00183. Support: 0.00175 first, followed by 0.00167, with 0.00158 and 0.00150 as deeper floors.
Bullish case: a firm close above 0.00181 on expanding volume could open room for another leg higher. Bearish case: a break below 0.00167 would damage the structure and bring lower supports into play. Volume has softened since the peak, so any breakout needs confirmation.
Takeaway: strong momentum rewards discipline, not impulse. Let 0.00181 resolve first and size risk carefully. This is not financial advice.
Binance Square readers, Sophon (SOPH/USDT) is trading at 0.00179 after a sharp 24-hour climb, with a range between 0.00136 and 0.00181. Binance data shows roughly 3.05B SOPH changing hands, about 4.71M USDT in turnover.
On the 15-minute chart, price built a base near 0.00150, broke out on heavy volume, tagged 0.00181, then cooled toward 0.00167 before buyers returned. A sequence of higher lows during that pullback points to active dip demand.
Resistance: 0.00181, then 0.00183. Support: 0.00175 first, followed by 0.00167, with 0.00158 and 0.00150 as deeper floors.
Bullish case: a firm close above 0.00181 on expanding volume could open room for another leg higher. Bearish case: a break below 0.00167 would damage the structure and bring lower supports into play. Volume has softened since the peak, so any breakout needs confirmation.
Takeaway: strong momentum rewards discipline, not impulse. Let 0.00181 resolve first and size risk carefully. This is not financial advice.
1
202
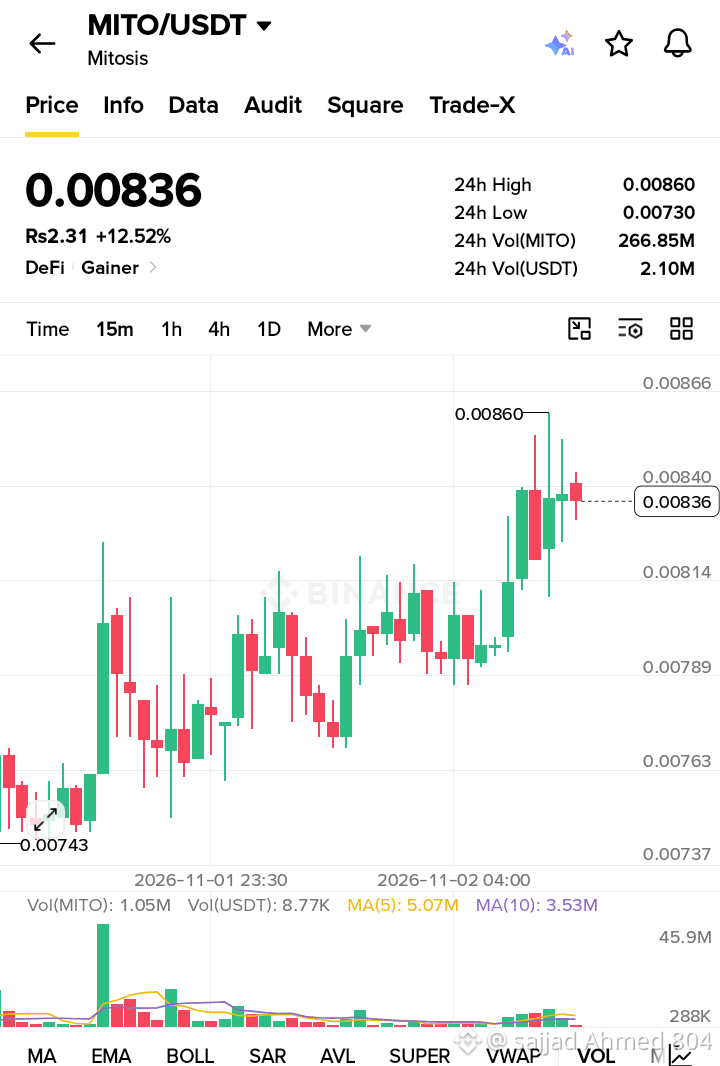
$MITO Pushes Into Fresh Territory as Buyers Defend the Mid-Range
Mitosis is trading at 0.00836 USDT, up 12.52% on the day, after a steady climb from a 24h low of 0.00730. The 15-minute chart shows a clear staircase pattern: a sharp volume-backed spike earlier in the session, a period of consolidation around 0.0076 to 0.0079, then a second leg higher that carried price to a 24h high of 0.00860.
That peak was quickly rejected, leaving long upper wicks, which signals sellers are active near 0.0085 to 0.0086. Immediate support sits around 0.00814, where the latest pullback found buyers, with deeper support near 0.00789 and the 0.0073 to 0.0074 base.
Volume is worth watching. Roughly 266.85M MITO changed hands in 24 hours, yet recent candles show cooling participation compared with the earlier surge.
Bullish case: a firm 15-minute close above 0.00860 on rising volume would open room for further extension. Bearish case: losing 0.00814 could invite a retest of 0.00789.
$MITO Pushes Into Fresh Territory as Buyers Defend the Mid-Range
Mitosis is trading at 0.00836 USDT, up 12.52% on the day, after a steady climb from a 24h low of 0.00730. The 15-minute chart shows a clear staircase pattern: a sharp volume-backed spike earlier in the session, a period of consolidation around 0.0076 to 0.0079, then a second leg higher that carried price to a 24h high of 0.00860.
That peak was quickly rejected, leaving long upper wicks, which signals sellers are active near 0.0085 to 0.0086. Immediate support sits around 0.00814, where the latest pullback found buyers, with deeper support near 0.00789 and the 0.0073 to 0.0074 base.
Volume is worth watching. Roughly 266.85M MITO changed hands in 24 hours, yet recent candles show cooling participation compared with the earlier surge.
Bullish case: a firm 15-minute close above 0.00860 on rising volume would open room for further extension. Bearish case: losing 0.00814 could invite a retest of 0.00789.
Mitosis is trading at 0.00836 USDT, up 12.52% on the day, after a steady climb from a 24h low of 0.00730. The 15-minute chart shows a clear staircase pattern: a sharp volume-backed spike earlier in the session, a period of consolidation around 0.0076 to 0.0079, then a second leg higher that carried price to a 24h high of 0.00860.
That peak was quickly rejected, leaving long upper wicks, which signals sellers are active near 0.0085 to 0.0086. Immediate support sits around 0.00814, where the latest pullback found buyers, with deeper support near 0.00789 and the 0.0073 to 0.0074 base.
Volume is worth watching. Roughly 266.85M MITO changed hands in 24 hours, yet recent candles show cooling participation compared with the earlier surge.
Bullish case: a firm 15-minute close above 0.00860 on rising volume would open room for further extension. Bearish case: losing 0.00814 could invite a retest of 0.00789.
2
403
සත්යායනය කළ
Binance Update: Token Recovery Has Begun
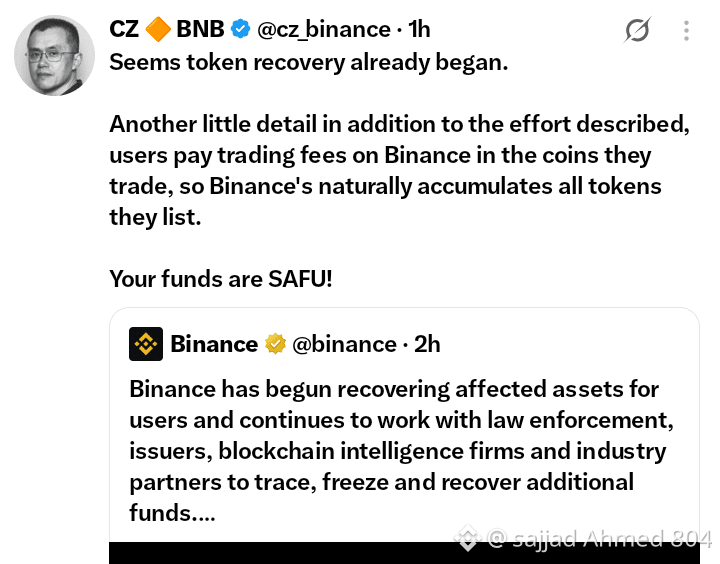
Good news for the crypto community. Binance has officially announced that it has begun recovering affected assets for users. The exchange is continuing to work closely with law enforcement agencies, token issuers, blockchain intelligence firms, and industry partners to trace, freeze, and recover additional funds.
CZ also shared that token recovery seems to have already started. He pointed out another important detail: since users pay trading fees in the coins they trade, Binance naturally accumulates every token it lists. This gives the exchange additional support in the recovery effort.
The process is ongoing, and more updates are expected as the team makes progress. As CZ put it, your funds are SAFU!
Stay informed and always rely on official sources for updates.
$BNB
#Binance #CZ #safu #crypto #bnb
Binance Update: Token Recovery Has Begun
Good news for the crypto community. Binance has officially announced that it has begun recovering affected assets for users. The exchange is continuing to work closely with law enforcement agencies, token issuers, blockchain intelligence firms, and industry partners to trace, freeze, and recover additional funds.
CZ also shared that token recovery seems to have already started. He pointed out another important detail: since users pay trading fees in the coins they trade, Binance naturally accumulates every token it lists. This gives the exchange additional support in the recovery effort.
The process is ongoing, and more updates are expected as the team makes progress. As CZ put it, your funds are SAFU!
Stay informed and always rely on official sources for updates.
$BNB
#Binance #CZ #safu #crypto #bnb
Good news for the crypto community. Binance has officially announced that it has begun recovering affected assets for users. The exchange is continuing to work closely with law enforcement agencies, token issuers, blockchain intelligence firms, and industry partners to trace, freeze, and recover additional funds.
CZ also shared that token recovery seems to have already started. He pointed out another important detail: since users pay trading fees in the coins they trade, Binance naturally accumulates every token it lists. This gives the exchange additional support in the recovery effort.
The process is ongoing, and more updates are expected as the team makes progress. As CZ put it, your funds are SAFU!
Stay informed and always rely on official sources for updates.
$BNB
#Binance #CZ #safu #crypto #bnb

1
1.4k
⁉️ Was Binance hacked?
Information is actively spreading online that a Binance hot wallet may have been attacked.
There is no official confirmation yet, but the amount in question is $2.7B.
Withdrawals from the exchange are reportedly paused, and the entire crypto market is reacting with a drop. 📉
$BNB USDT
Perp
701.19
-6.98%
P.S. The withdrawal amount has exceeded $3.5B
{spot}(BNBUSDT)
⁉️ Was Binance hacked?
Information is actively spreading online that a Binance hot wallet may have been attacked.
There is no official confirmation yet, but the amount in question is $2.7B.
Withdrawals from the exchange are reportedly paused, and the entire crypto market is reacting with a drop. 📉
$BNB USDT
Perp
701.19
-6.98%
P.S. The withdrawal amount has exceeded $3.5B
Information is actively spreading online that a Binance hot wallet may have been attacked.
There is no official confirmation yet, but the amount in question is $2.7B.
Withdrawals from the exchange are reportedly paused, and the entire crypto market is reacting with a drop. 📉
$BNB USDT
Perp
701.19
-6.98%
P.S. The withdrawal amount has exceeded $3.5B

102
සත්යායනය කළ
Ripple $XRP : A Major Step Toward the Future of Finance!
Ripple’s move toward becoming a U.S. national trust bank could mark a major milestone for the crypto industry. This development could strengthen Ripple’s position in the traditional financial system and create new opportunities for digital asset custody under federal supervision.
What This Could Mean for XRP:
✅ Greater Regulatory Credibility: Stronger regulatory oversight could boost Ripple’s reputation.
Institutional Confidence: Banks and financial institutions may become more comfortable working with Ripple.
Potential XRP Adoption: Greater integration with traditional finance could open new opportunities for XRP.
Long-Term Growth Potential: Positive regulatory developments could strengthen market sentiment toward XRP.
Important: A national trust bank is not the same as a full commercial bank, and regulatory approval does not guarantee that XRP’s price will rise.
The Bigger Picture: Crypto and traditional finance are moving closer together. If Ripple continues making progress, XRP could benefit from future opportunities in the evolving financial landscape.
Stay informed, think long-term, and always manage your risk!
Ripple $XRP : A Major Step Toward the Future of Finance!
Ripple’s move toward becoming a U.S. national trust bank could mark a major milestone for the crypto industry. This development could strengthen Ripple’s position in the traditional financial system and create new opportunities for digital asset custody under federal supervision.
What This Could Mean for XRP:
✅ Greater Regulatory Credibility: Stronger regulatory oversight could boost Ripple’s reputation.
Institutional Confidence: Banks and financial institutions may become more comfortable working with Ripple.
Potential XRP Adoption: Greater integration with traditional finance could open new opportunities for XRP.
Long-Term Growth Potential: Positive regulatory developments could strengthen market sentiment toward XRP.
Important: A national trust bank is not the same as a full commercial bank, and regulatory approval does not guarantee that XRP’s price will rise.
The Bigger Picture: Crypto and traditional finance are moving closer together. If Ripple continues making progress, XRP could benefit from future opportunities in the evolving financial landscape.
Stay informed, think long-term, and always manage your risk!
Ripple’s move toward becoming a U.S. national trust bank could mark a major milestone for the crypto industry. This development could strengthen Ripple’s position in the traditional financial system and create new opportunities for digital asset custody under federal supervision.
What This Could Mean for XRP:
✅ Greater Regulatory Credibility: Stronger regulatory oversight could boost Ripple’s reputation.
Institutional Confidence: Banks and financial institutions may become more comfortable working with Ripple.
Potential XRP Adoption: Greater integration with traditional finance could open new opportunities for XRP.
Long-Term Growth Potential: Positive regulatory developments could strengthen market sentiment toward XRP.
Important: A national trust bank is not the same as a full commercial bank, and regulatory approval does not guarantee that XRP’s price will rise.
The Bigger Picture: Crypto and traditional finance are moving closer together. If Ripple continues making progress, XRP could benefit from future opportunities in the evolving financial landscape.
Stay informed, think long-term, and always manage your risk!

1
721
BREAKING: IRAN SIGNALS POSSIBLE END TO THE WAR
Iranian Supreme Leader Mojtaba Khamenei has indicated that the conflict could end if Tehran’s conditions are met. Iran demands protection of its rights, the lifting of US sanctions and the naval blockade, and respect for its security concerns.
Diplomatic efforts are intensifying, raising hopes for a possible breakthrough. However, no peace agreement has been confirmed, and major disagreements remain unresolved.
The possibility of peace is gaining attention, but negotiations will determine whether a deal becomes reality.
Global markets are watching closely. Oil prices, cryptocurrencies, and financial assets could experience significant volatility as developments unfold.
BREAKING: IRAN SIGNALS POSSIBLE END TO THE WAR
Iranian Supreme Leader Mojtaba Khamenei has indicated that the conflict could end if Tehran’s conditions are met. Iran demands protection of its rights, the lifting of US sanctions and the naval blockade, and respect for its security concerns.
Diplomatic efforts are intensifying, raising hopes for a possible breakthrough. However, no peace agreement has been confirmed, and major disagreements remain unresolved.
The possibility of peace is gaining attention, but negotiations will determine whether a deal becomes reality.
Global markets are watching closely. Oil prices, cryptocurrencies, and financial assets could experience significant volatility as developments unfold.
Iranian Supreme Leader Mojtaba Khamenei has indicated that the conflict could end if Tehran’s conditions are met. Iran demands protection of its rights, the lifting of US sanctions and the naval blockade, and respect for its security concerns.
Diplomatic efforts are intensifying, raising hopes for a possible breakthrough. However, no peace agreement has been confirmed, and major disagreements remain unresolved.
The possibility of peace is gaining attention, but negotiations will determine whether a deal becomes reality.
Global markets are watching closely. Oil prices, cryptocurrencies, and financial assets could experience significant volatility as developments unfold.


1
1
257
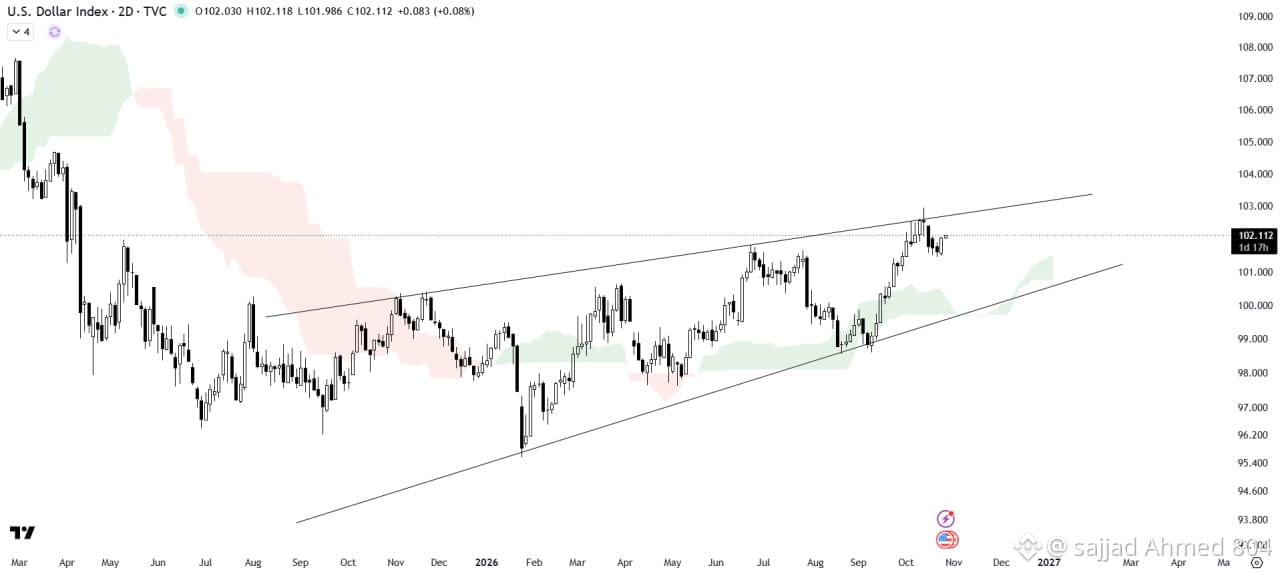
DOLLAR ($DXYZ.US ) ANALYSIS
The US Dollar is facing rejection from the upper resistance trendline of a rising wedge pattern, while the Ichimoku Cloud is acting as a key support zone.
A breakdown below the wedge support could increase selling pressure and trigger further downside in DXY.
On the other hand, a strong breakout above the wedge resistance would invalidate the bearish formation and could signal further upside.
Key Levels to Watch:
Bearish Scenario: A breakdown below wedge support could push DXY lower.
Bullish Scenario: A breakout above wedge resistance could signal renewed strength in the US Dollar.
Critical Support: The Ichimoku Cloud remains an important zone to monitor.
Since the US Dollar Index generally moves inversely to the crypto market, a significant move in DXY could influence Bitcoin and overall crypto market direction.
Watch for a confirmed breakout or breakdown before anticipating the next major move.
DOLLAR ($DXYZ.US ) ANALYSIS
The US Dollar is facing rejection from the upper resistance trendline of a rising wedge pattern, while the Ichimoku Cloud is acting as a key support zone.
A breakdown below the wedge support could increase selling pressure and trigger further downside in DXY.
On the other hand, a strong breakout above the wedge resistance would invalidate the bearish formation and could signal further upside.
Key Levels to Watch:
Bearish Scenario: A breakdown below wedge support could push DXY lower.
Bullish Scenario: A breakout above wedge resistance could signal renewed strength in the US Dollar.
Critical Support: The Ichimoku Cloud remains an important zone to monitor.
Since the US Dollar Index generally moves inversely to the crypto market, a significant move in DXY could influence Bitcoin and overall crypto market direction.
Watch for a confirmed breakout or breakdown before anticipating the next major move.
The US Dollar is facing rejection from the upper resistance trendline of a rising wedge pattern, while the Ichimoku Cloud is acting as a key support zone.
A breakdown below the wedge support could increase selling pressure and trigger further downside in DXY.
On the other hand, a strong breakout above the wedge resistance would invalidate the bearish formation and could signal further upside.
Key Levels to Watch:
Bearish Scenario: A breakdown below wedge support could push DXY lower.
Bullish Scenario: A breakout above wedge resistance could signal renewed strength in the US Dollar.
Critical Support: The Ichimoku Cloud remains an important zone to monitor.
Since the US Dollar Index generally moves inversely to the crypto market, a significant move in DXY could influence Bitcoin and overall crypto market direction.
Watch for a confirmed breakout or breakdown before anticipating the next major move.
DXYZUS-2.69%
1
168
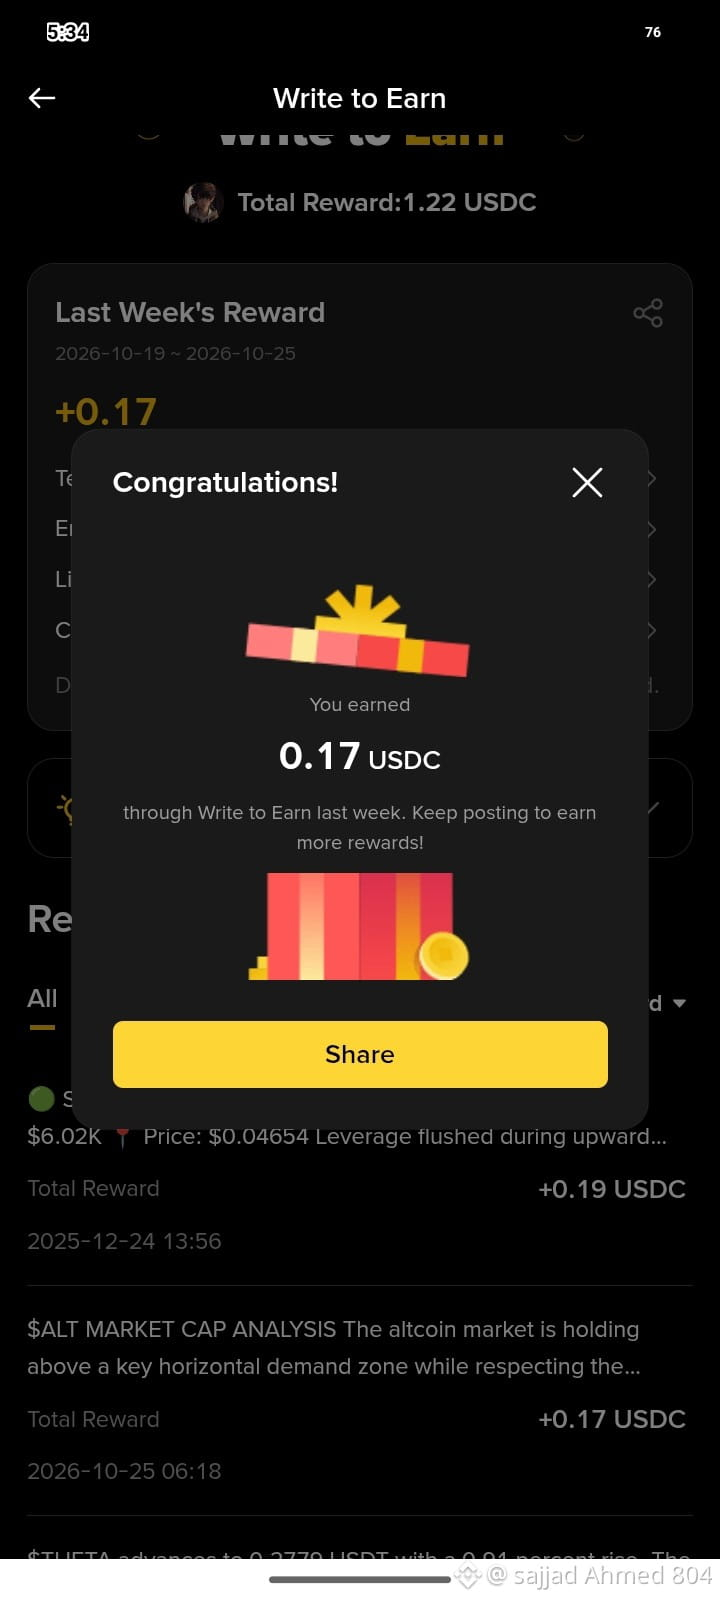
🎉 My Write to Earn Rewards Update! 💰🚀
🥳 Happy to share that I earned 0.17 USDC through Write to Earn last week! 💵✨
📝 Every post is a step forward. Consistency, creativity, and valuable content help us grow and earn rewards together! 📈🔥
🚀 I’ll keep sharing crypto market insights, trading updates, and valuable content with the community. 🌍💎
💛 Small Steps, Consistent Efforts, Better Rewards! 🏆
🤝 Thank you for being part of this journey. Let’s keep posting, keep learning, and keep growing together! 🚀🌟
💰 Keep Posting | 📈 Keep Growing | 🏆 Keep Earning
$BTC $ETH
🎉 My Write to Earn Rewards Update! 💰🚀
🥳 Happy to share that I earned 0.17 USDC through Write to Earn last week! 💵✨
📝 Every post is a step forward. Consistency, creativity, and valuable content help us grow and earn rewards together! 📈🔥
🚀 I’ll keep sharing crypto market insights, trading updates, and valuable content with the community. 🌍💎
💛 Small Steps, Consistent Efforts, Better Rewards! 🏆
🤝 Thank you for being part of this journey. Let’s keep posting, keep learning, and keep growing together! 🚀🌟
💰 Keep Posting | 📈 Keep Growing | 🏆 Keep Earning
$BTC $ETH
🥳 Happy to share that I earned 0.17 USDC through Write to Earn last week! 💵✨
📝 Every post is a step forward. Consistency, creativity, and valuable content help us grow and earn rewards together! 📈🔥
🚀 I’ll keep sharing crypto market insights, trading updates, and valuable content with the community. 🌍💎
💛 Small Steps, Consistent Efforts, Better Rewards! 🏆
🤝 Thank you for being part of this journey. Let’s keep posting, keep learning, and keep growing together! 🚀🌟
💰 Keep Posting | 📈 Keep Growing | 🏆 Keep Earning
$BTC $ETH
1
251
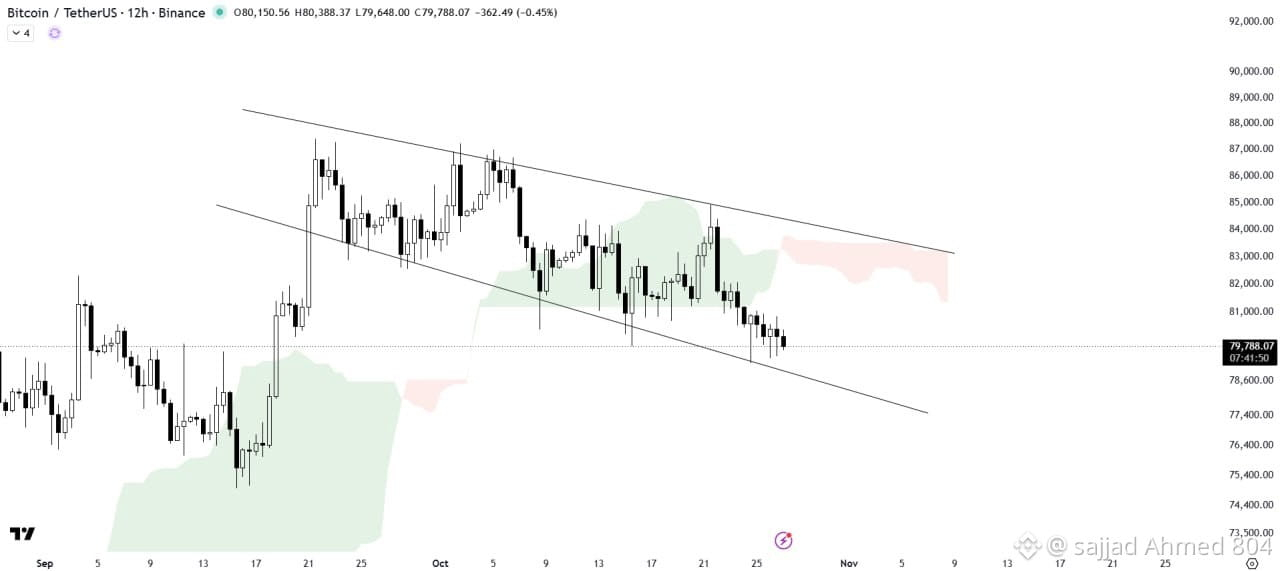
$BTC /USDT ANALYSIS
Bitcoin is currently consolidating within a descending broadening wedge pattern, with price holding above the lower support trendline. This structure keeps the possibility of a bullish rebound in focus as buyers attempt to defend this critical support zone.
The Ichimoku cloud is acting as a significant resistance barrier, limiting upward movement and preventing BTC from establishing stronger bullish momentum. A successful breakout above the cloud could improve market sentiment and open the door for a potential recovery toward higher resistance levels.
If Bitcoin continues to respect the wedge support, buyers may gain confidence and push the price upward. However, a confirmed breakout above the resistance zone is necessary to strengthen the bullish outlook.
On the downside, a decisive breakdown below the lower trendline could invalidate the current rebound scenario and trigger further correction.
Traders should closely monitor price action around these key technical levels and wait for clear confirmation before making any trading decisions.
$BTC /USDT ANALYSIS
Bitcoin is currently consolidating within a descending broadening wedge pattern, with price holding above the lower support trendline. This structure keeps the possibility of a bullish rebound in focus as buyers attempt to defend this critical support zone.
The Ichimoku cloud is acting as a significant resistance barrier, limiting upward movement and preventing BTC from establishing stronger bullish momentum. A successful breakout above the cloud could improve market sentiment and open the door for a potential recovery toward higher resistance levels.
If Bitcoin continues to respect the wedge support, buyers may gain confidence and push the price upward. However, a confirmed breakout above the resistance zone is necessary to strengthen the bullish outlook.
On the downside, a decisive breakdown below the lower trendline could invalidate the current rebound scenario and trigger further correction.
Traders should closely monitor price action around these key technical levels and wait for clear confirmation before making any trading decisions.
Bitcoin is currently consolidating within a descending broadening wedge pattern, with price holding above the lower support trendline. This structure keeps the possibility of a bullish rebound in focus as buyers attempt to defend this critical support zone.
The Ichimoku cloud is acting as a significant resistance barrier, limiting upward movement and preventing BTC from establishing stronger bullish momentum. A successful breakout above the cloud could improve market sentiment and open the door for a potential recovery toward higher resistance levels.
If Bitcoin continues to respect the wedge support, buyers may gain confidence and push the price upward. However, a confirmed breakout above the resistance zone is necessary to strengthen the bullish outlook.
On the downside, a decisive breakdown below the lower trendline could invalidate the current rebound scenario and trigger further correction.
Traders should closely monitor price action around these key technical levels and wait for clear confirmation before making any trading decisions.
163
·
--
උසබ තත්ත්වය
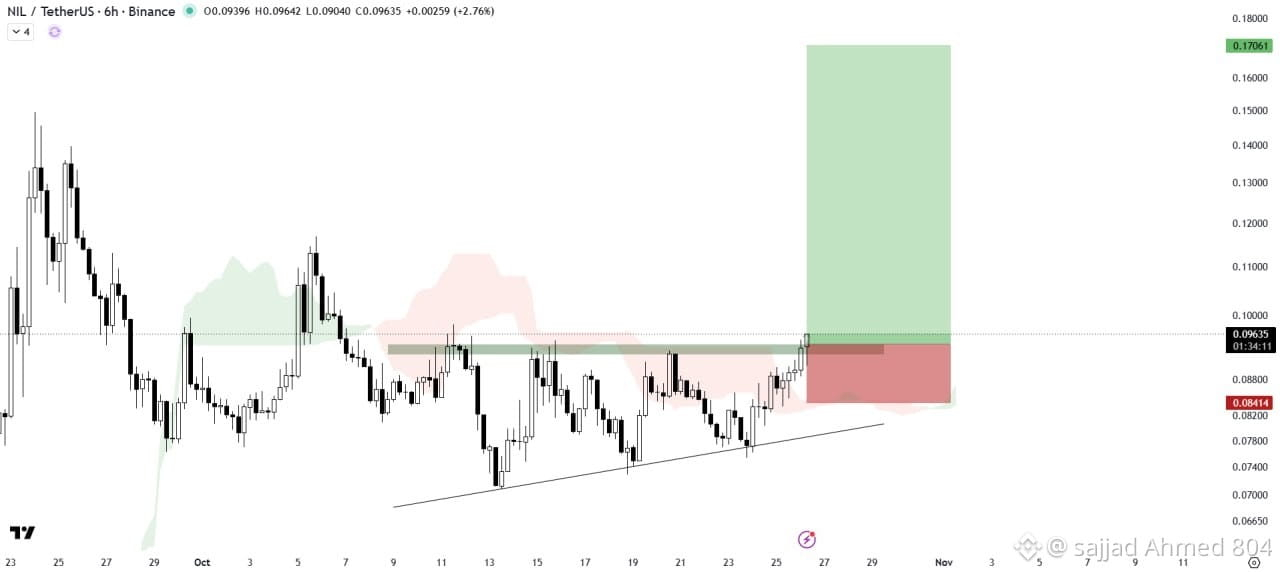
$NIL /USDT BUY SETUP
NIL has successfully broken out of the ascending triangle pattern with strong trading volume, indicating increasing buying pressure and strengthening bullish momentum.
The Ichimoku cloud is acting as a key support zone, providing additional strength to the current market structure and supporting the bullish outlook.
If NIL continues to maintain its momentum and holds above the breakout zone, the price could move higher and potentially initiate a strong bullish rally.
Traders should closely monitor price action and volume for further confirmation before expecting a sustained upward move.
$NIL /USDT BUY SETUP
NIL has successfully broken out of the ascending triangle pattern with strong trading volume, indicating increasing buying pressure and strengthening bullish momentum.
The Ichimoku cloud is acting as a key support zone, providing additional strength to the current market structure and supporting the bullish outlook.
If NIL continues to maintain its momentum and holds above the breakout zone, the price could move higher and potentially initiate a strong bullish rally.
Traders should closely monitor price action and volume for further confirmation before expecting a sustained upward move.
NIL has successfully broken out of the ascending triangle pattern with strong trading volume, indicating increasing buying pressure and strengthening bullish momentum.
The Ichimoku cloud is acting as a key support zone, providing additional strength to the current market structure and supporting the bullish outlook.
If NIL continues to maintain its momentum and holds above the breakout zone, the price could move higher and potentially initiate a strong bullish rally.
Traders should closely monitor price action and volume for further confirmation before expecting a sustained upward move.
139
·
--
උසබ තත්ත්වය
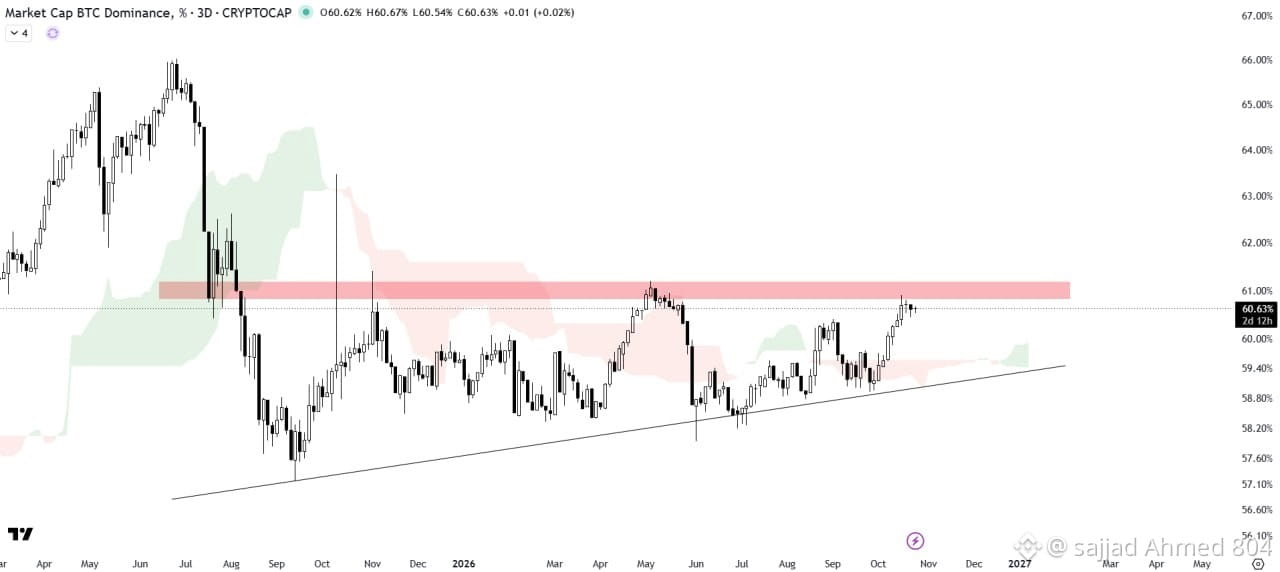
$BTC DOMINANCE ANALYSIS
BTC Dominance is facing resistance at the horizontal supply zone of the ascending triangle pattern, while the Ichimoku cloud continues to act as an important support area.
A confirmed breakout above the supply zone could push BTC.D higher, potentially putting additional pressure on altcoins. However, if the price breaks below the Ichimoku cloud, it could signal weakening momentum and open the door for further downside.
For now, the market is at a crucial decision point, and we need confirmation before anticipating the next major move. Keep watching the key resistance and support levels closely.
Remember, BTC Dominance often moves inversely to the altcoin market cap, so any significant move in BTC.D could influence the overall altcoin market direction.
$BTC DOMINANCE ANALYSIS
BTC Dominance is facing resistance at the horizontal supply zone of the ascending triangle pattern, while the Ichimoku cloud continues to act as an important support area.
A confirmed breakout above the supply zone could push BTC.D higher, potentially putting additional pressure on altcoins. However, if the price breaks below the Ichimoku cloud, it could signal weakening momentum and open the door for further downside.
For now, the market is at a crucial decision point, and we need confirmation before anticipating the next major move. Keep watching the key resistance and support levels closely.
Remember, BTC Dominance often moves inversely to the altcoin market cap, so any significant move in BTC.D could influence the overall altcoin market direction.
BTC Dominance is facing resistance at the horizontal supply zone of the ascending triangle pattern, while the Ichimoku cloud continues to act as an important support area.
A confirmed breakout above the supply zone could push BTC.D higher, potentially putting additional pressure on altcoins. However, if the price breaks below the Ichimoku cloud, it could signal weakening momentum and open the door for further downside.
For now, the market is at a crucial decision point, and we need confirmation before anticipating the next major move. Keep watching the key resistance and support levels closely.
Remember, BTC Dominance often moves inversely to the altcoin market cap, so any significant move in BTC.D could influence the overall altcoin market direction.
1
90
·
--
උසබ තත්ත්වය
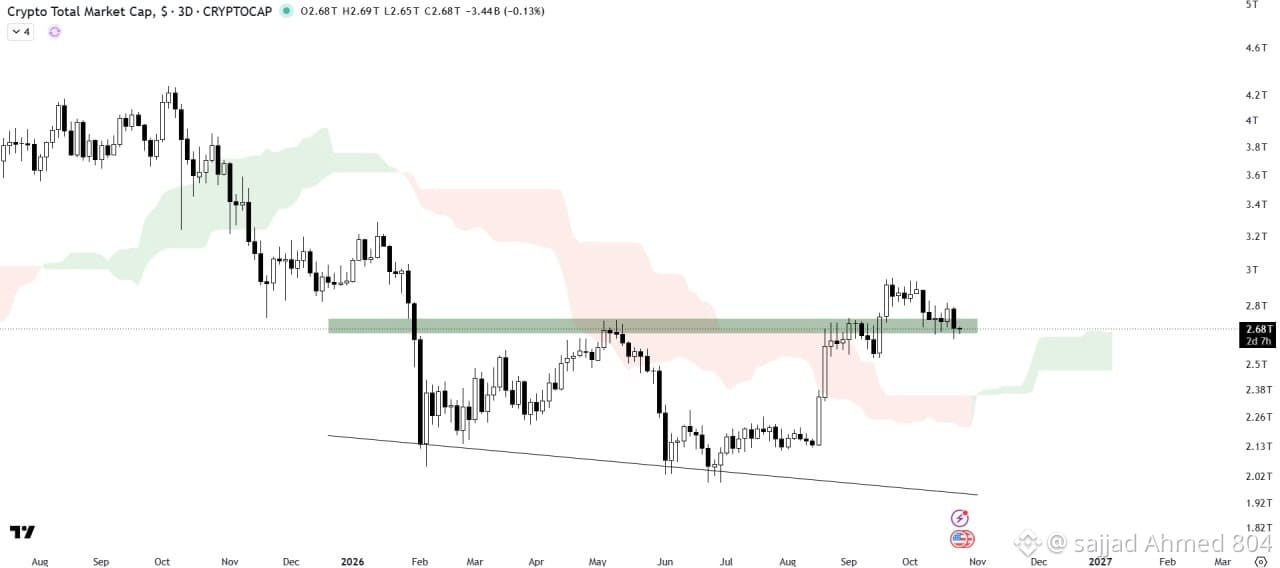
$TOTL.ETF MARKET CAP ANALYSIS
The Total Market Cap is retesting a key horizontal S/R level, while the Ichimoku cloud continues to act as an important support zone. This structure keeps the possibility of a bullish recovery in focus.
If buyers successfully defend this level and maintain upward momentum, the market could see a strong rally, potentially boosting confidence across the entire crypto market.
However, a failed retest and breakdown below this support could shift momentum toward the bears and open the door to further downside. The next price movement will be crucial in determining market direction.
Traders should closely monitor the support level, Ichimoku cloud, and breakout confirmation before making any decisions.
$TOTL.ETF MARKET CAP ANALYSIS
The Total Market Cap is retesting a key horizontal S/R level, while the Ichimoku cloud continues to act as an important support zone. This structure keeps the possibility of a bullish recovery in focus.
If buyers successfully defend this level and maintain upward momentum, the market could see a strong rally, potentially boosting confidence across the entire crypto market.
However, a failed retest and breakdown below this support could shift momentum toward the bears and open the door to further downside. The next price movement will be crucial in determining market direction.
Traders should closely monitor the support level, Ichimoku cloud, and breakout confirmation before making any decisions.
The Total Market Cap is retesting a key horizontal S/R level, while the Ichimoku cloud continues to act as an important support zone. This structure keeps the possibility of a bullish recovery in focus.
If buyers successfully defend this level and maintain upward momentum, the market could see a strong rally, potentially boosting confidence across the entire crypto market.
However, a failed retest and breakdown below this support could shift momentum toward the bears and open the door to further downside. The next price movement will be crucial in determining market direction.
Traders should closely monitor the support level, Ichimoku cloud, and breakout confirmation before making any decisions.
TOTLETF-0.60%
103
·
--
බෙයාරිෂ්
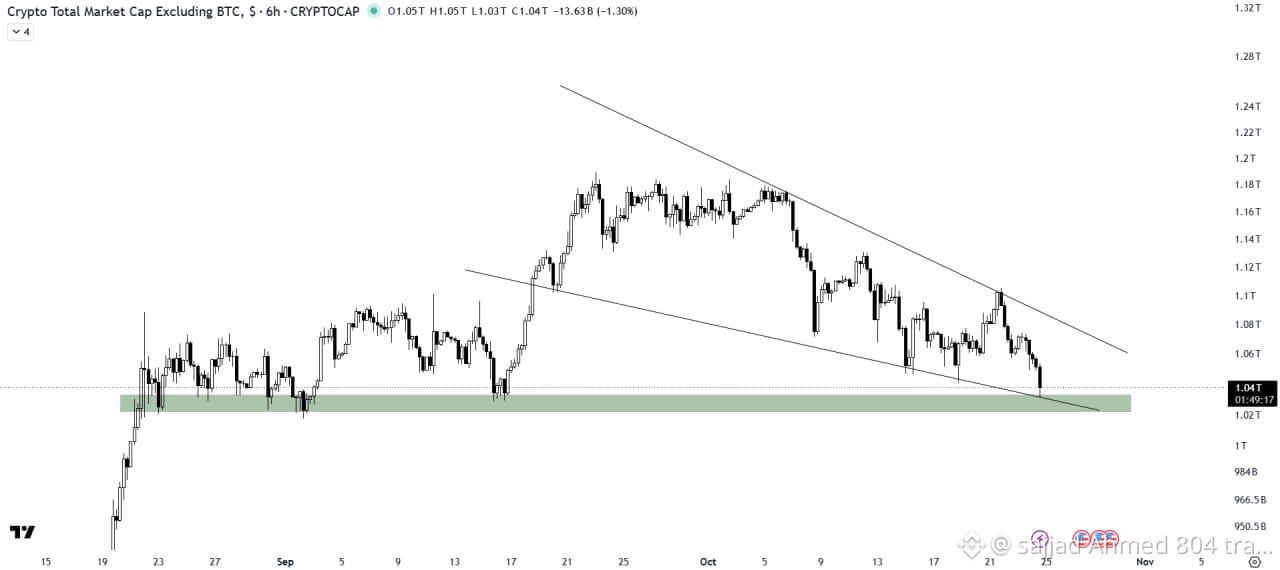
$ALT MARKET CAP ANALYSIS
The altcoin market is holding above a key horizontal demand zone while respecting the support trendline of the falling wedge pattern.
If buyers continue to defend these critical support levels, the market could see a potential recovery and renewed bullish momentum.
A confirmed breakout above the wedge resistance would strengthen the bullish outlook and could open the door for a broader rally across altcoins.
The next move will be crucial in determining whether altcoins are ready for a stronger recovery or need more time to consolidate.
Altcoins | CryptoMarket | Altseason
$ALT MARKET CAP ANALYSIS
The altcoin market is holding above a key horizontal demand zone while respecting the support trendline of the falling wedge pattern.
If buyers continue to defend these critical support levels, the market could see a potential recovery and renewed bullish momentum.
A confirmed breakout above the wedge resistance would strengthen the bullish outlook and could open the door for a broader rally across altcoins.
The next move will be crucial in determining whether altcoins are ready for a stronger recovery or need more time to consolidate.
Altcoins | CryptoMarket | Altseason
The altcoin market is holding above a key horizontal demand zone while respecting the support trendline of the falling wedge pattern.
If buyers continue to defend these critical support levels, the market could see a potential recovery and renewed bullish momentum.
A confirmed breakout above the wedge resistance would strengthen the bullish outlook and could open the door for a broader rally across altcoins.
The next move will be crucial in determining whether altcoins are ready for a stronger recovery or need more time to consolidate.
Altcoins | CryptoMarket | Altseason
1
980
·
--
උසබ තත්ත්වය
I’ve been around long enough to remember when the internet felt a bit more random. You could start looking for one thing, click a few links, and suddenly find yourself somewhere completely unexpected. There was something exciting about not knowing what you might discover next.
That’s honestly how I ended up reading about Dusk Network while jumping between blockchain and AI projects.
At first, I saw it described as a privacy blockchain for financial applications. Then I learned it’s a layer-1 blockchain behind the Confidential Security Contract, or $BMT , standard, with support for confidential smart contracts. I found that interesting, but I probably would have moved on if something else hadn’t caught my eye.
I kept reading and came across the idea of Dusk as decentralized infrastructure for hosting, running inference on, and verifying AI models at scale. I’m still trying to wrap my head around all of it, so I won’t pretend I have it figured out.
But the thought of open intelligence took me back to the early internet. Openness and accessibility felt important back then. Maybe that’s why this idea stuck with me. I’m not convinced of anything yet, but I’m genuinely curious enough to keep digging.
I’ve been around long enough to remember when the internet felt a bit more random. You could start looking for one thing, click a few links, and suddenly find yourself somewhere completely unexpected. There was something exciting about not knowing what you might discover next.
That’s honestly how I ended up reading about Dusk Network while jumping between blockchain and AI projects.
At first, I saw it described as a privacy blockchain for financial applications. Then I learned it’s a layer-1 blockchain behind the Confidential Security Contract, or $BMT , standard, with support for confidential smart contracts. I found that interesting, but I probably would have moved on if something else hadn’t caught my eye.
I kept reading and came across the idea of Dusk as decentralized infrastructure for hosting, running inference on, and verifying AI models at scale. I’m still trying to wrap my head around all of it, so I won’t pretend I have it figured out.
But the thought of open intelligence took me back to the early internet. Openness and accessibility felt important back then. Maybe that’s why this idea stuck with me. I’m not convinced of anything yet, but I’m genuinely curious enough to keep digging.
That’s honestly how I ended up reading about Dusk Network while jumping between blockchain and AI projects.
At first, I saw it described as a privacy blockchain for financial applications. Then I learned it’s a layer-1 blockchain behind the Confidential Security Contract, or $BMT , standard, with support for confidential smart contracts. I found that interesting, but I probably would have moved on if something else hadn’t caught my eye.
I kept reading and came across the idea of Dusk as decentralized infrastructure for hosting, running inference on, and verifying AI models at scale. I’m still trying to wrap my head around all of it, so I won’t pretend I have it figured out.
But the thought of open intelligence took me back to the early internet. Openness and accessibility felt important back then. Maybe that’s why this idea stuck with me. I’m not convinced of anything yet, but I’m genuinely curious enough to keep digging.

82
තවත් අන්තර්ගතයන් ගවේෂණය කිරීමට ඇතුල් වන්න
Binance චතුරශ්රය හි ගෝලීය ක්රිප්ටෝ පරිශීලකයින් හා එක්වන්න
⚡️ ක්රිප්ටෝ පිළිබඳ නවතම සහ ප්රයෝජනවත් තොරතුරු ලබා ගන්න.
💬 ලොව විශාලතම ක්රිප්ටෝ හුවමාරුව මගින් විශ්වාස කෙරේ.
👍 සත්යායනය කරන ලද නිර්මාණකරුවන්ගෙන් සැබෑ විදසුන් සොයා ගන්න.
විද්යුත් තැපෑල / දුරකථන අංකය
නැගී එන මාතෘකා
HuangExitNvidiaStrategyInFocus
105,515 නැරඹීම්
1,152 සාකච්ඡා කරමින්
STOCKS | Nvidia’s Jensen Huang Resigns, Colette Kress Named as Interim CEO
Binance News
·30 කැමත්ත දැක්වීම්
·37.7k නැරඹීම්
AnthropicRejectsIPODelayValuationinQuestion
713,631 නැරඹීම්
5,373 සාකච්ඡා කරමින්
HedgeFundsCMEBitcoinNetShortsFall89%
458 නැරඹීම්
27 සාකච්ඡා කරමින්