
Crypto Inferno
3.6k පෝස්ටු
Crypto Inferno
වාර්තා කරන්න
පරිශීලක අවහිර කරන්න
විවෘත වෙළෙඳාම
නිතර වෙළෙන්දා
{වේලාව} වසර
161 හඹා යමින්
768 හඹා යන්නන්
6.2K+ කැමති විය
පෝස්ටු
ආයෝජන කළඹ
සියල්ල
උපුටා දැක්වීම්
වීඩියෝ
·
--
උසබ තත්ත්වය
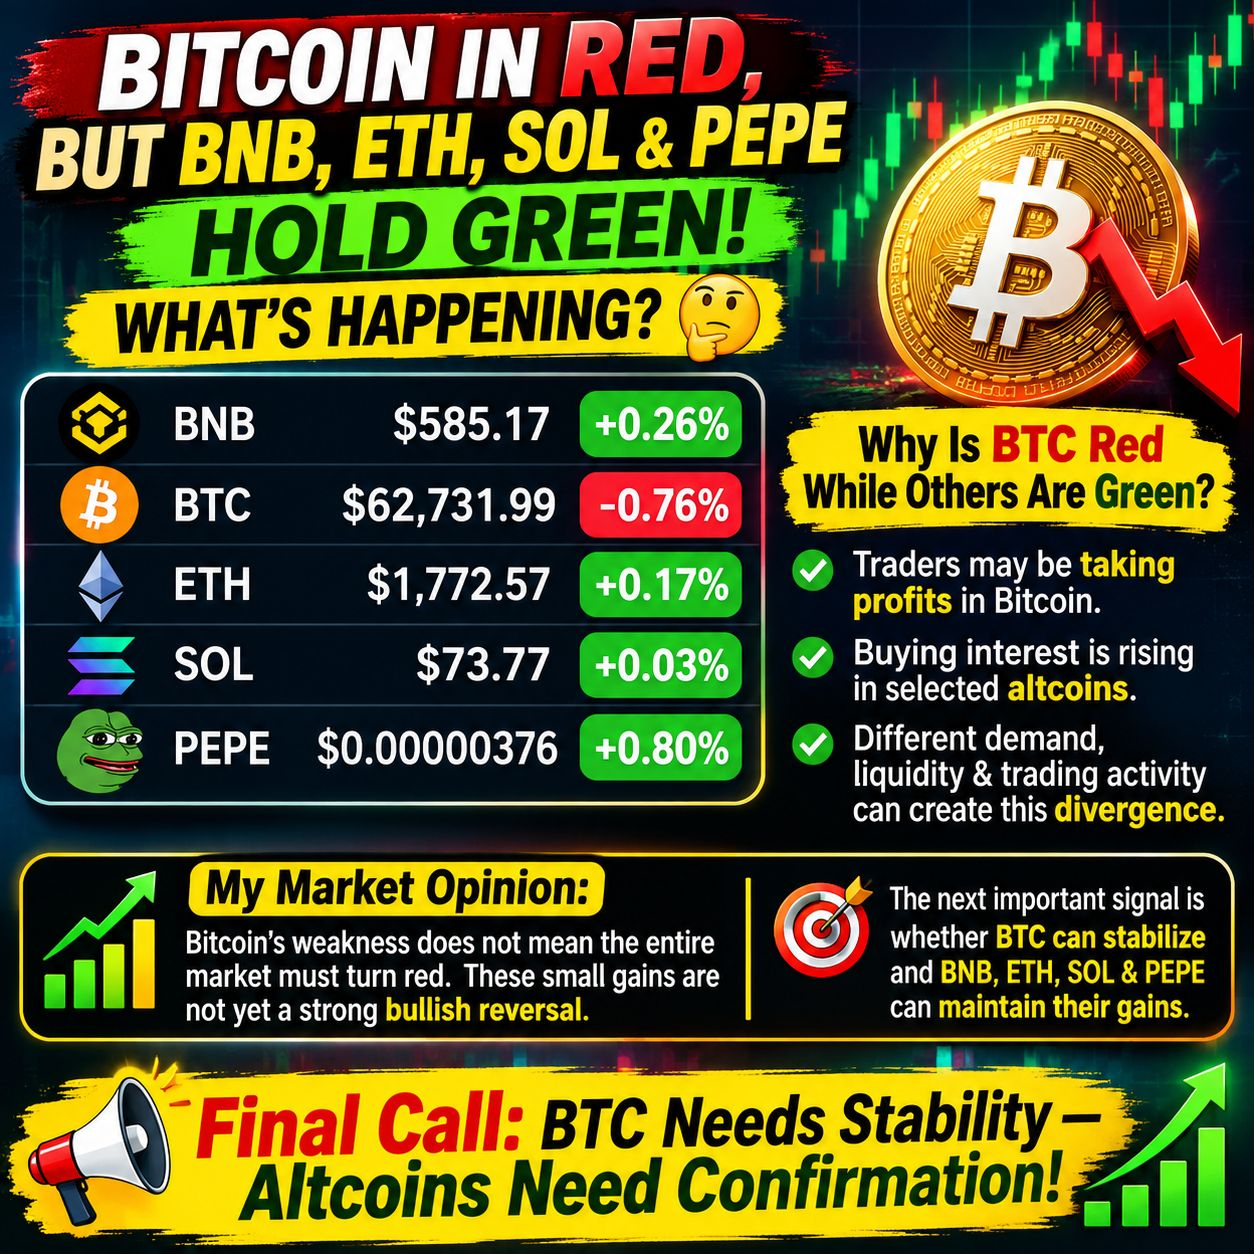
🚨 BITCOIN IN RED, BUT BNB, ETH, SOL & PEPE HOLD GREEN! WHAT'S HAPPENING? 📊🔥
The crypto market is showing an interesting difference in momentum. While Bitcoin ($BTC) is down 0.76% at $62,731.99, several major altcoins are maintaining positive territory.
📊 Market Snapshot:
🟢 BNB: $585.17 (+0.26%) — Showing relative strength.
🔴 BTC: $62,731.99 (-0.76%) — Facing short-term selling pressure.
🟢 ETH: $1,772.57 (+0.17%) — Holding slightly positive momentum.
🟢 SOL: $73.77 (+0.03%) — Near flat, but still green.
🟢 PEPE: $0.00000376 (+0.80%) — Leading this group in percentage gains.
🔍 Why Is BTC Red While Others Are Green?
This can happen when traders take profits in Bitcoin while buying opportunities emerge in selected altcoins. Different tokens also have independent demand, liquidity and trading activity. Short-term capital rotation can create this kind of market divergence.
🎯 My Market Opinion:
Bitcoin's weakness does not automatically mean the entire crypto market must turn red. However, these small gains are not yet confirmation of a strong bullish reversal.
The next important signal is whether #BTC can stabilize and whether #BNB , #ETH , #SOL and #PEPE can maintain their positive momentum.
🔥 Final Call: BTC Needs Stability — Altcoins Need Confirmation!
{spot}(BTCUSDT)
{spot}(ETHUSDT)
{spot}(BNBUSDT)
🚨 BITCOIN IN RED, BUT BNB, ETH, SOL & PEPE HOLD GREEN! WHAT'S HAPPENING? 📊🔥
The crypto market is showing an interesting difference in momentum. While Bitcoin ($BTC) is down 0.76% at $62,731.99, several major altcoins are maintaining positive territory.
📊 Market Snapshot:
🟢 BNB: $585.17 (+0.26%) — Showing relative strength.
🔴 BTC: $62,731.99 (-0.76%) — Facing short-term selling pressure.
🟢 ETH: $1,772.57 (+0.17%) — Holding slightly positive momentum.
🟢 SOL: $73.77 (+0.03%) — Near flat, but still green.
🟢 PEPE: $0.00000376 (+0.80%) — Leading this group in percentage gains.
🔍 Why Is BTC Red While Others Are Green?
This can happen when traders take profits in Bitcoin while buying opportunities emerge in selected altcoins. Different tokens also have independent demand, liquidity and trading activity. Short-term capital rotation can create this kind of market divergence.
🎯 My Market Opinion:
Bitcoin's weakness does not automatically mean the entire crypto market must turn red. However, these small gains are not yet confirmation of a strong bullish reversal.
The next important signal is whether #BTC can stabilize and whether #BNB , #ETH , #SOL and #PEPE can maintain their positive momentum.
🔥 Final Call: BTC Needs Stability — Altcoins Need Confirmation!
The crypto market is showing an interesting difference in momentum. While Bitcoin ($BTC) is down 0.76% at $62,731.99, several major altcoins are maintaining positive territory.
📊 Market Snapshot:
🟢 BNB: $585.17 (+0.26%) — Showing relative strength.
🔴 BTC: $62,731.99 (-0.76%) — Facing short-term selling pressure.
🟢 ETH: $1,772.57 (+0.17%) — Holding slightly positive momentum.
🟢 SOL: $73.77 (+0.03%) — Near flat, but still green.
🟢 PEPE: $0.00000376 (+0.80%) — Leading this group in percentage gains.
🔍 Why Is BTC Red While Others Are Green?
This can happen when traders take profits in Bitcoin while buying opportunities emerge in selected altcoins. Different tokens also have independent demand, liquidity and trading activity. Short-term capital rotation can create this kind of market divergence.
🎯 My Market Opinion:
Bitcoin's weakness does not automatically mean the entire crypto market must turn red. However, these small gains are not yet confirmation of a strong bullish reversal.
The next important signal is whether #BTC can stabilize and whether #BNB , #ETH , #SOL and #PEPE can maintain their positive momentum.
🔥 Final Call: BTC Needs Stability — Altcoins Need Confirmation!
112
·
--
උසබ තත්ත්වය
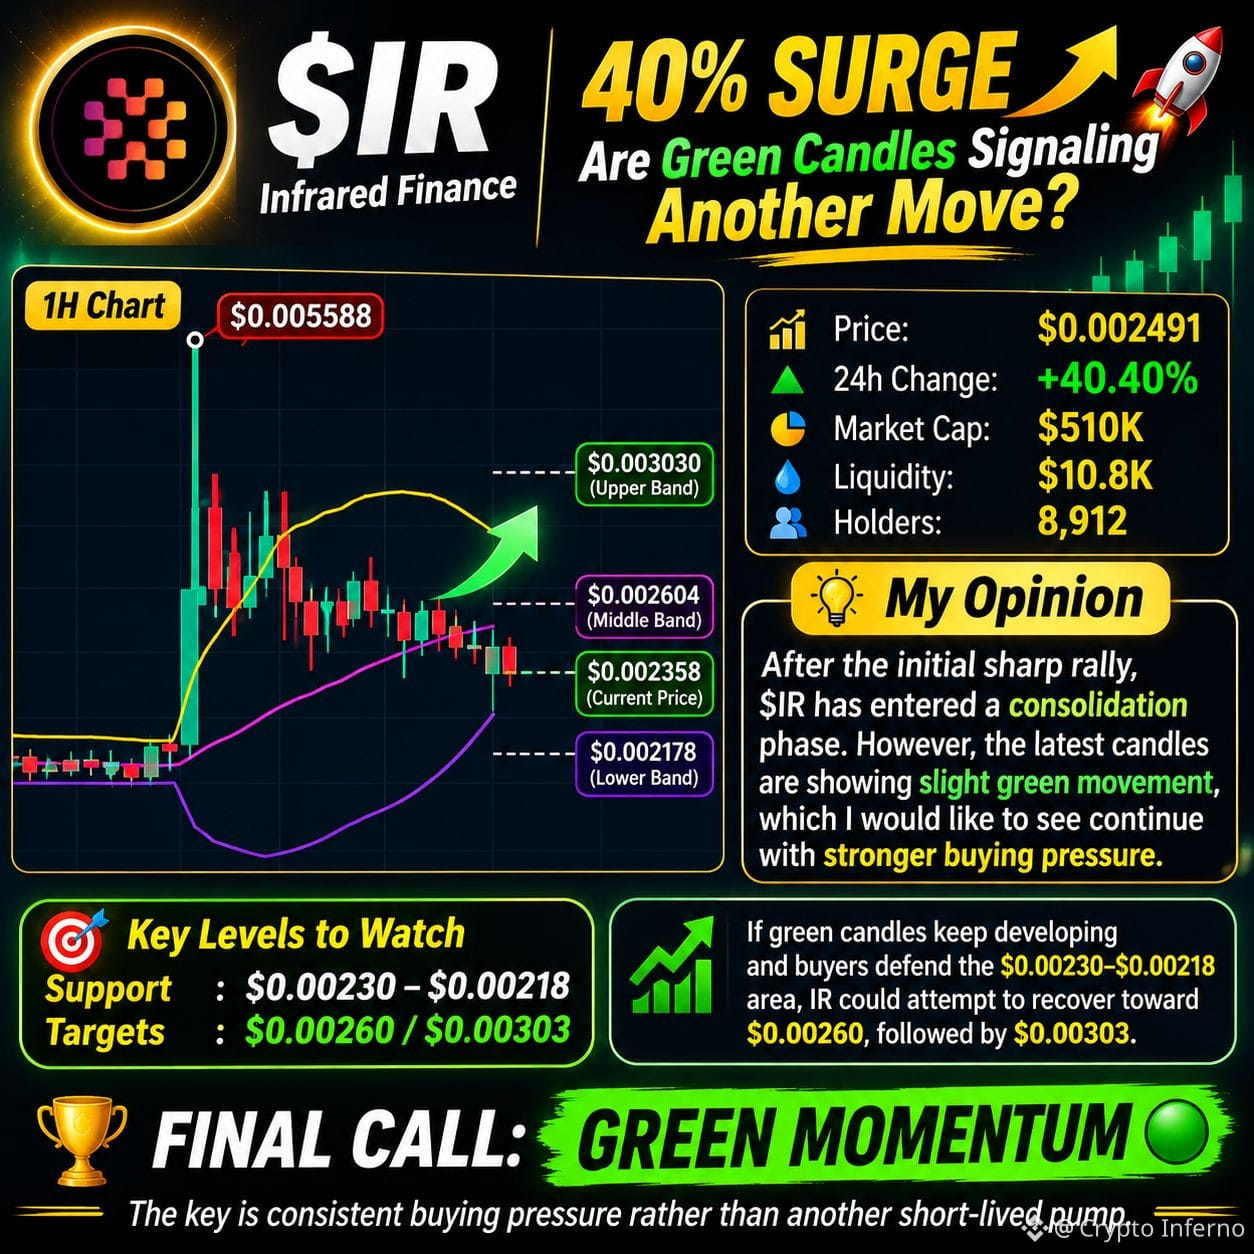
🔥 $IR: 40% SURGE — ARE GREEN CANDLES SIGNALING ANOTHER MOVE? 🚀
Infrared Finance ($IR ) is showing strong momentum, gaining 40.40% and reaching a displayed price of $0.002491, with a market cap of approximately $510K.
📊 1H Chart Analysis:
🚀 Previous high: $0.005588
📍 Current chart level: $0.002358
🟢 Upper Bollinger Band: $0.003030
🎯 Middle Band: $0.002604
🛡️ Lower Band: $0.002178
👥 Holders: 8,912
💧 Liquidity: $10.8K
🔥 My Personal Opinion:
After the initial sharp rally, $IR has entered a consolidation phase. However, the latest candles are showing slight green movement, which I would like to see continue with gradually stronger buying pressure.
If green candles keep developing and buyers defend the $0.00230–$0.00218 area, IR could attempt to recover toward $0.00260, followed by $0.00303.
The key is consistent buying pressure rather than another short-lived pump.
🎯 FINAL CALL: GREEN MOMENTUM 🟢
#IranIsraelConflict #infraredfinance #CryptoMarket #BinanceSquareTips
🔥 $IR : 40% SURGE — ARE GREEN CANDLES SIGNALING ANOTHER MOVE? 🚀
Infrared Finance ($IR ) is showing strong momentum, gaining 40.40% and reaching a displayed price of $0.002491, with a market cap of approximately $510K.
📊 1H Chart Analysis:
🚀 Previous high: $0.005588
📍 Current chart level: $0.002358
🟢 Upper Bollinger Band: $0.003030
🎯 Middle Band: $0.002604
🛡️ Lower Band: $0.002178
👥 Holders: 8,912
💧 Liquidity: $10.8K
🔥 My Personal Opinion:
After the initial sharp rally, $IR has entered a consolidation phase. However, the latest candles are showing slight green movement, which I would like to see continue with gradually stronger buying pressure.
If green candles keep developing and buyers defend the $0.00230–$0.00218 area, IR could attempt to recover toward $0.00260, followed by $0.00303.
The key is consistent buying pressure rather than another short-lived pump.
🎯 FINAL CALL: GREEN MOMENTUM 🟢
#IranIsraelConflict #infraredfinance #CryptoMarket #BinanceSquareTips
Infrared Finance ($IR ) is showing strong momentum, gaining 40.40% and reaching a displayed price of $0.002491, with a market cap of approximately $510K.
📊 1H Chart Analysis:
🚀 Previous high: $0.005588
📍 Current chart level: $0.002358
🟢 Upper Bollinger Band: $0.003030
🎯 Middle Band: $0.002604
🛡️ Lower Band: $0.002178
👥 Holders: 8,912
💧 Liquidity: $10.8K
🔥 My Personal Opinion:
After the initial sharp rally, $IR has entered a consolidation phase. However, the latest candles are showing slight green movement, which I would like to see continue with gradually stronger buying pressure.
If green candles keep developing and buyers defend the $0.00230–$0.00218 area, IR could attempt to recover toward $0.00260, followed by $0.00303.
The key is consistent buying pressure rather than another short-lived pump.
🎯 FINAL CALL: GREEN MOMENTUM 🟢
#IranIsraelConflict #infraredfinance #CryptoMarket #BinanceSquareTips
302
·
--
උසබ තත්ත්වය
🚀🔥 FUTURE COIN WATCHLIST: ARE THESE THE NEXT MARKET BREAKOUT STARS?
The market is showing some serious momentum, and four names are attracting attention with impressive moves! 👀
📊 Coins on Our Radar:
🥇 $BITO (+96.90%) – Leading the rally with an almost 100% surge. Can momentum continue?
🥈 $NAOR (+49.00%) – Strong upside movement. Worth watching for sustained buying pressure.
🥉 $ICNT (+32.85%) – Showing growing market strength and attracting attention.
🔥 $YB (+30.01%) – Another impressive mover that deserves a place on the watchlist.
🎯 What We Care About Next:
Sustainable volume growth 📈
Strong support levels 🛡️
Continued buyer interest 🐂
Real utility and ecosystem development 🌐
💡 The Big Picture: Today's biggest gainers are not automatically tomorrow's winners. The real opportunity lies in identifying projects that can maintain momentum beyond the initial pump.
👀 Which of these four could become the next breakout star?
#CryptoMarket #BinanceSquare #BITO #NAOR #ICNT #YB
{future}(BITOUSDT)
{future}(NAORISUSDT)
{alpha}(84530xe0cd4cacddcbf4f36e845407ce53e87717b6601d)
🚀🔥 FUTURE COIN WATCHLIST: ARE THESE THE NEXT MARKET BREAKOUT STARS?
The market is showing some serious momentum, and four names are attracting attention with impressive moves! 👀
📊 Coins on Our Radar:
🥇 $BITO (+96.90%) – Leading the rally with an almost 100% surge. Can momentum continue?
🥈 $NAOR (+49.00%) – Strong upside movement. Worth watching for sustained buying pressure.
🥉 $ICNT (+32.85%) – Showing growing market strength and attracting attention.
🔥 $YB (+30.01%) – Another impressive mover that deserves a place on the watchlist.
🎯 What We Care About Next:
Sustainable volume growth 📈
Strong support levels 🛡️
Continued buyer interest 🐂
Real utility and ecosystem development 🌐
💡 The Big Picture: Today's biggest gainers are not automatically tomorrow's winners. The real opportunity lies in identifying projects that can maintain momentum beyond the initial pump.
👀 Which of these four could become the next breakout star?
#CryptoMarket #BinanceSquare #BITO #NAOR #ICNT #YB
The market is showing some serious momentum, and four names are attracting attention with impressive moves! 👀
📊 Coins on Our Radar:
🥇 $BITO (+96.90%) – Leading the rally with an almost 100% surge. Can momentum continue?
🥈 $NAOR (+49.00%) – Strong upside movement. Worth watching for sustained buying pressure.
🥉 $ICNT (+32.85%) – Showing growing market strength and attracting attention.
🔥 $YB (+30.01%) – Another impressive mover that deserves a place on the watchlist.
🎯 What We Care About Next:
Sustainable volume growth 📈
Strong support levels 🛡️
Continued buyer interest 🐂
Real utility and ecosystem development 🌐
💡 The Big Picture: Today's biggest gainers are not automatically tomorrow's winners. The real opportunity lies in identifying projects that can maintain momentum beyond the initial pump.
👀 Which of these four could become the next breakout star?
#CryptoMarket #BinanceSquare #BITO #NAOR #ICNT #YB
$BITO: Bullish Leader 🚀
$NAOR: Momentum Rising 🔥
$ICNT: Breakout Watch 👀
$YB: Bullish Potential 📈
5 පැයක්(පැය) ඉතිරිව ඇත
1.6k
·
--
උසබ තත්ත්වය
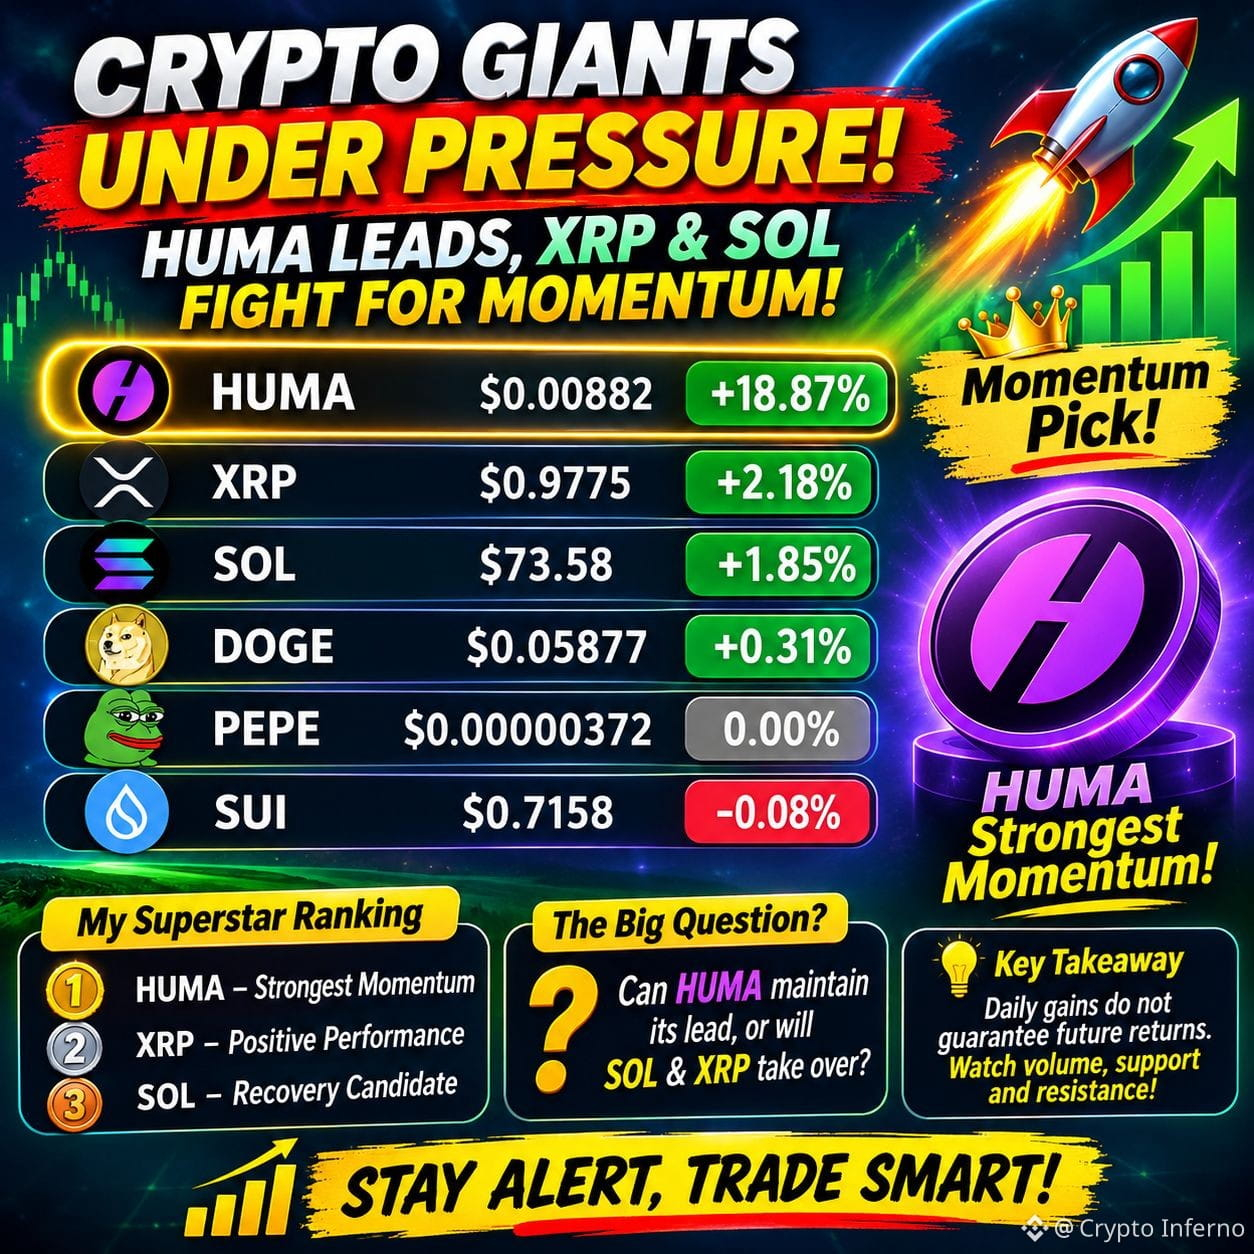
🔥 CRYPTO GIANTS UNDER PRESSURE! HUMA LEADS, XRP & SOL FIGHT FOR MOMENTUM! 🚀
The market is showing mixed signals, but some familiar names are attracting attention. Here's today's snapshot of six major tokens:
📊 Market Performance:
🚀 $HUMA: $0.00882 | +18.87% — The strongest performer in this group, showing impressive momentum.
⚡ $XRP: $0.9775 | +2.18% — Holding positive momentum.
🌐 $SOL: $73.58 | +1.85% — Solana continues to attract market attention.
🐕 $DOGE: $0.05877 | +0.31% — Slightly positive, but needs stronger buying pressure.
🐸 $PEPE: $0.00000372 | 0.00% — Waiting for a fresh momentum trigger.
💧 $SUI: $0.7158 | -0.08% — Nearly flat, with buyers still needing to prove strength.
🏆 MY MOMENTUM PICK: $HUMA
HUMA leads this snapshot by a clear margin. However, SOL and XRP remain important names to watch for a stronger recovery.
🔥 The big question for traders: Can HUMA maintain its lead, or will SOL and XRP take over?
⚠️ Daily gains do not guarantee future returns. Watch volume, support and resistance before entering a trade.
{spot}(HUMAUSDT)
{spot}(XRPUSDT)
{spot}(SOLUSDT)
#
🔥 CRYPTO GIANTS UNDER PRESSURE! HUMA LEADS, XRP & SOL FIGHT FOR MOMENTUM! 🚀
The market is showing mixed signals, but some familiar names are attracting attention. Here's today's snapshot of six major tokens:
📊 Market Performance:
🚀 $HUMA: $0.00882 | +18.87% — The strongest performer in this group, showing impressive momentum.
⚡ $XRP: $0.9775 | +2.18% — Holding positive momentum.
🌐 $SOL: $73.58 | +1.85% — Solana continues to attract market attention.
🐕 $DOGE: $0.05877 | +0.31% — Slightly positive, but needs stronger buying pressure.
🐸 $PEPE: $0.00000372 | 0.00% — Waiting for a fresh momentum trigger.
💧 $SUI: $0.7158 | -0.08% — Nearly flat, with buyers still needing to prove strength.
🏆 MY MOMENTUM PICK: $HUMA
HUMA leads this snapshot by a clear margin. However, SOL and XRP remain important names to watch for a stronger recovery.
🔥 The big question for traders: Can HUMA maintain its lead, or will SOL and XRP take over?
⚠️ Daily gains do not guarantee future returns. Watch volume, support and resistance before entering a trade.
#
The market is showing mixed signals, but some familiar names are attracting attention. Here's today's snapshot of six major tokens:
📊 Market Performance:
🚀 $HUMA: $0.00882 | +18.87% — The strongest performer in this group, showing impressive momentum.
⚡ $XRP: $0.9775 | +2.18% — Holding positive momentum.
🌐 $SOL: $73.58 | +1.85% — Solana continues to attract market attention.
🐕 $DOGE: $0.05877 | +0.31% — Slightly positive, but needs stronger buying pressure.
🐸 $PEPE: $0.00000372 | 0.00% — Waiting for a fresh momentum trigger.
💧 $SUI: $0.7158 | -0.08% — Nearly flat, with buyers still needing to prove strength.
🏆 MY MOMENTUM PICK: $HUMA
HUMA leads this snapshot by a clear margin. However, SOL and XRP remain important names to watch for a stronger recovery.
🔥 The big question for traders: Can HUMA maintain its lead, or will SOL and XRP take over?
⚠️ Daily gains do not guarantee future returns. Watch volume, support and resistance before entering a trade.
#
2
1
803
·
--
උසබ තත්ත්වය
🔥FOUR COINS EXPLODE! WHICH ONE COULD BECOME THE NEXT SUPERSTAR? 🚀
The market is showing powerful momentum, with four tokens delivering impressive gains. But one name is clearly standing out!
📊 **Today's Top Performers:**
- 🚀$MMT (Momentum): $0.2434 | +73.36% — Leading the rally with the strongest momentum.
- 🔥$PIEVERSE : $3.2655 | +58.83% — Strong buying interest and impressive performance.
- ☁️ $ICNT : $0.3207 | +40.23% — A promising move from Impossible Cloud Network.
- ⚡ #PHAROS : $0.6310 | +25.55% — Joining the rally with solid gains.
🏆 **MY SUPERSTAR PICK: $MMT**
Among these four, MMT gets my attention because it currently leads with the highest percentage gain. If momentum continues and trading volume supports the rally, it could attract further market attention.
⚠️ Remember: A strong daily gain doesn't guarantee another rally. Watch volume, resistance and potential profit-taking.
**Which coin will dominate the next market move?** 👀
{spot}(MMTUSDT)
{alpha}(560x0e63b9c287e32a05e6b9ab8ee8df88a2760225a9)
{alpha}(84530xe0cd4cacddcbf4f36e845407ce53e87717b6601d)
🔥FOUR COINS EXPLODE! WHICH ONE COULD BECOME THE NEXT SUPERSTAR? 🚀
The market is showing powerful momentum, with four tokens delivering impressive gains. But one name is clearly standing out!
📊 **Today's Top Performers:**
- 🚀$MMT (Momentum): $0.2434 | +73.36% — Leading the rally with the strongest momentum.
- 🔥$PIEVERSE : $3.2655 | +58.83% — Strong buying interest and impressive performance.
- ☁️ $ICNT : $0.3207 | +40.23% — A promising move from Impossible Cloud Network.
- ⚡ #PHAROS : $0.6310 | +25.55% — Joining the rally with solid gains.
🏆 **MY SUPERSTAR PICK: $MMT **
Among these four, MMT gets my attention because it currently leads with the highest percentage gain. If momentum continues and trading volume supports the rally, it could attract further market attention.
⚠️ Remember: A strong daily gain doesn't guarantee another rally. Watch volume, resistance and potential profit-taking.
**Which coin will dominate the next market move?** 👀
The market is showing powerful momentum, with four tokens delivering impressive gains. But one name is clearly standing out!
📊 **Today's Top Performers:**
- 🚀$MMT (Momentum): $0.2434 | +73.36% — Leading the rally with the strongest momentum.
- 🔥$PIEVERSE : $3.2655 | +58.83% — Strong buying interest and impressive performance.
- ☁️ $ICNT : $0.3207 | +40.23% — A promising move from Impossible Cloud Network.
- ⚡ #PHAROS : $0.6310 | +25.55% — Joining the rally with solid gains.
🏆 **MY SUPERSTAR PICK: $MMT **
Among these four, MMT gets my attention because it currently leads with the highest percentage gain. If momentum continues and trading volume supports the rally, it could attract further market attention.
⚠️ Remember: A strong daily gain doesn't guarantee another rally. Watch volume, resistance and potential profit-taking.
**Which coin will dominate the next market move?** 👀
MMT: 🚀 Momentum Beast
35%
PIEVERSE: 🔥 Breakout King
40%
ICNT: ☁️ Cloud Rocket
14%
PHAROS: ⚡ Rising Force
11%
73 ඡන්ද • ඡන්දය අවසන්
1
3.9k
·
--
උසබ තත්ත්වය
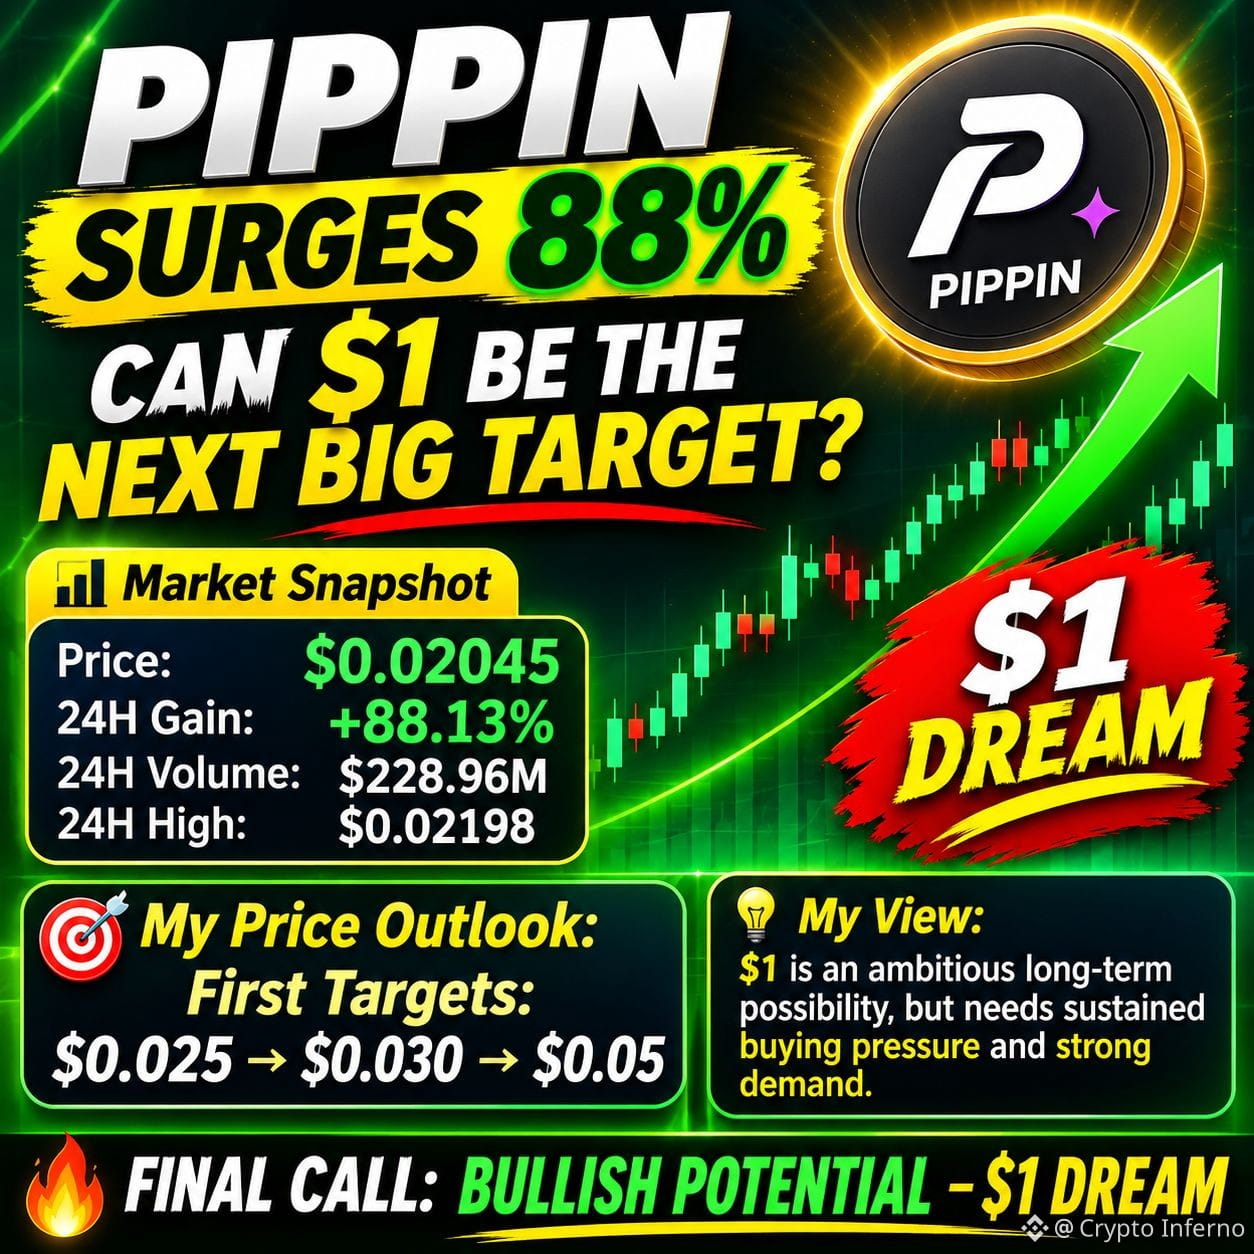
🚀🔥 PIPPIN JUST EXPLODED 88% — CAN PIPPIN HIT $1?
$PIPPIN is back on traders' radar after a powerful daily breakout! But is this the beginning of a much bigger rally, or just a temporary momentum spike? 👀
📊 PIPPIN/USDT — Market Breakdown
💰 Current Price: $0.02045
🚀 24H Gain: +88.13%
📈 24H High: $0.02198
📉 24H Low: $0.01080
🔥 24H Trading Volume: $228.96M
📊 Mark Price: $0.02052
Technical Picture:
PIPPIN has broken sharply above its previous trading range after an extended downtrend. The massive daily green candle and elevated trading volume indicate strong buying interest.
Important Levels to Watch:
Resistance: $0.02198, followed by $0.025 and $0.030.
Support: $0.0170, $0.0131 and $0.0108.
🎯 Can PIPPIN Reach $1?
In my opinion, $1 is an ambitious long-term target, not an immediate expectation. From $0.02045, PIPPIN would need approximately a 48.9x increase to reach that milestone.
My view: If buying pressure continues, the project maintains community interest, and the broader market supports another strong rally, PIPPIN could have further upside potential.
But traders should remember: one explosive candle does not confirm a sustainable bull run.
🔥 FINAL CALL: BREAKOUT WATCH — $1 DREAM
#PİPPİN #Crypto #BinanceSquare #Altcoins #CryptoAnalysis
🚀🔥 PIPPIN JUST EXPLODED 88% — CAN PIPPIN HIT $1?
$PIPPIN is back on traders' radar after a powerful daily breakout! But is this the beginning of a much bigger rally, or just a temporary momentum spike? 👀
📊 PIPPIN/USDT — Market Breakdown
💰 Current Price: $0.02045
🚀 24H Gain: +88.13%
📈 24H High: $0.02198
📉 24H Low: $0.01080
🔥 24H Trading Volume: $228.96M
📊 Mark Price: $0.02052
Technical Picture:
PIPPIN has broken sharply above its previous trading range after an extended downtrend. The massive daily green candle and elevated trading volume indicate strong buying interest.
Important Levels to Watch:
Resistance: $0.02198, followed by $0.025 and $0.030.
Support: $0.0170, $0.0131 and $0.0108.
🎯 Can PIPPIN Reach $1?
In my opinion, $1 is an ambitious long-term target, not an immediate expectation. From $0.02045, PIPPIN would need approximately a 48.9x increase to reach that milestone.
My view: If buying pressure continues, the project maintains community interest, and the broader market supports another strong rally, PIPPIN could have further upside potential.
But traders should remember: one explosive candle does not confirm a sustainable bull run.
🔥 FINAL CALL: BREAKOUT WATCH — $1 DREAM
#PİPPİN #Crypto #BinanceSquare #Altcoins #CryptoAnalysis
$PIPPIN is back on traders' radar after a powerful daily breakout! But is this the beginning of a much bigger rally, or just a temporary momentum spike? 👀
📊 PIPPIN/USDT — Market Breakdown
💰 Current Price: $0.02045
🚀 24H Gain: +88.13%
📈 24H High: $0.02198
📉 24H Low: $0.01080
🔥 24H Trading Volume: $228.96M
📊 Mark Price: $0.02052
Technical Picture:
PIPPIN has broken sharply above its previous trading range after an extended downtrend. The massive daily green candle and elevated trading volume indicate strong buying interest.
Important Levels to Watch:
Resistance: $0.02198, followed by $0.025 and $0.030.
Support: $0.0170, $0.0131 and $0.0108.
🎯 Can PIPPIN Reach $1?
In my opinion, $1 is an ambitious long-term target, not an immediate expectation. From $0.02045, PIPPIN would need approximately a 48.9x increase to reach that milestone.
My view: If buying pressure continues, the project maintains community interest, and the broader market supports another strong rally, PIPPIN could have further upside potential.
But traders should remember: one explosive candle does not confirm a sustainable bull run.
🔥 FINAL CALL: BREAKOUT WATCH — $1 DREAM
#PİPPİN #Crypto #BinanceSquare #Altcoins #CryptoAnalysis
661
🚀🔥 TOP 7 ALTCOIN MARKET HEATING UP! WHO IS LEADING THE NEXT MOMENTUM WAVE?
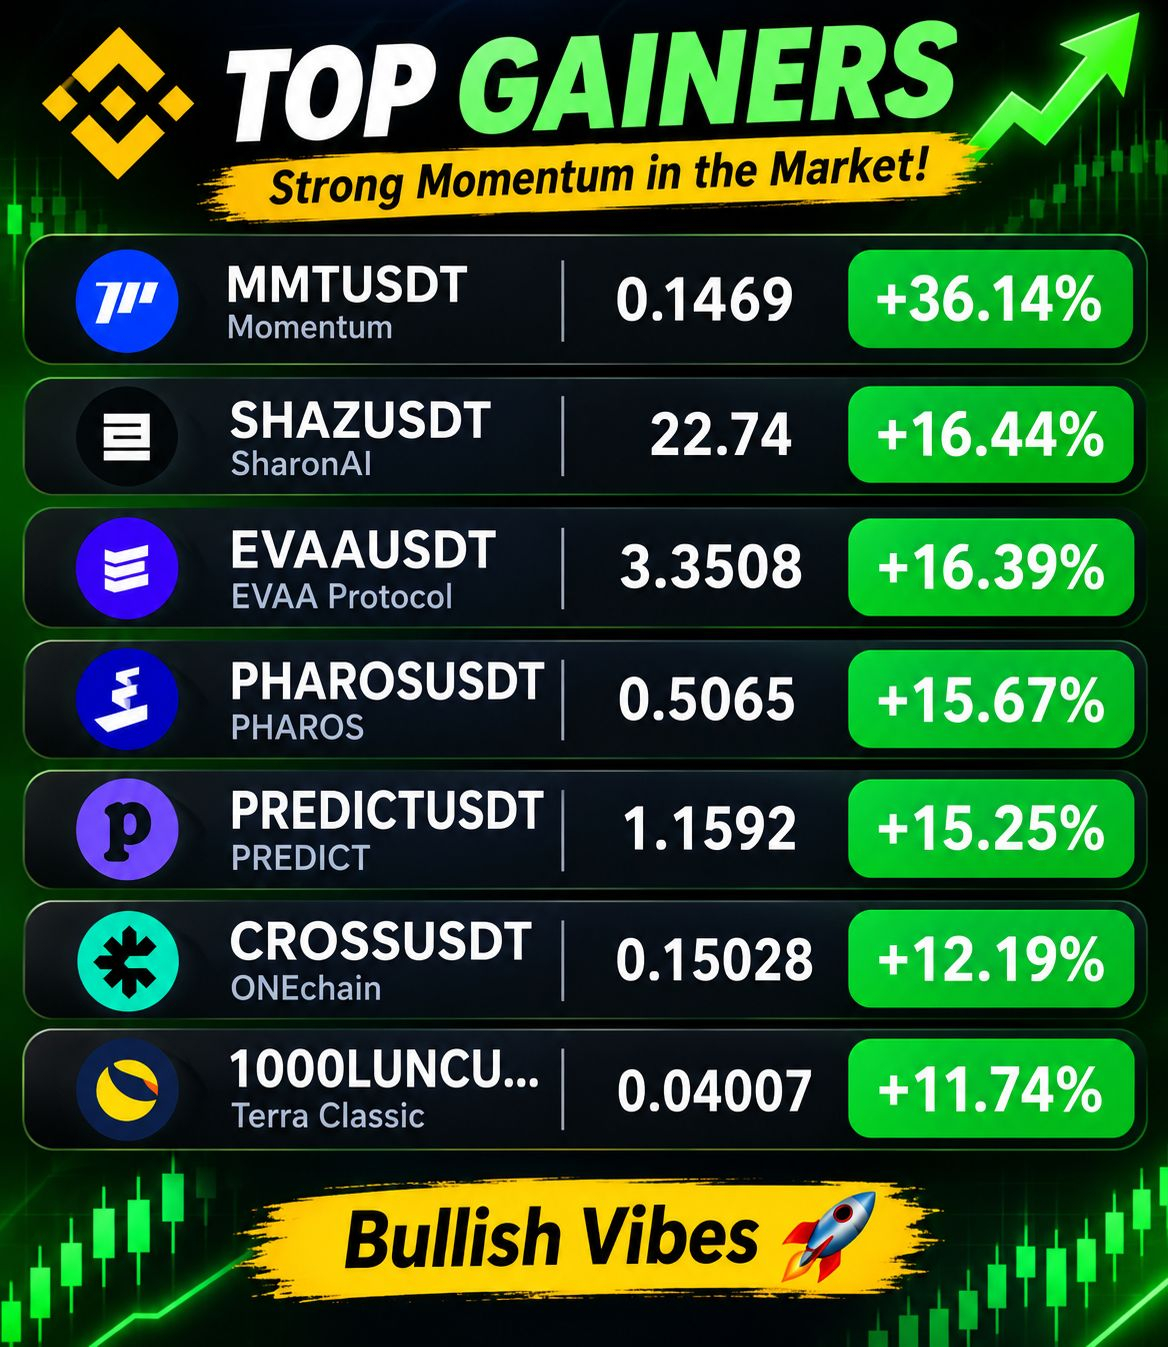
Look at these movers! 👀📈 Multiple altcoin perpetual contracts are showing impressive green moves. The interesting part is how different projects are participating in this rally.
🔵 MMT | MOMENTUM 📈 +36.14% | Price: 0.1469
⚫ SHAZ | SHARONAI 📈 +16.44% | Price: 22.74
🟣 EVAA | EVAA PROTOCOL 📈 +16.39% | Price: 3.3508
🔷 PHAROS 📈 +15.67% | Price: 0.5065
🟣 PREDICT 📈 +15.25% | Price: 1.1592
🟢 CROSS | ONECHAIN 📈 +12.19% | Price: 0.15028
🟡 TERRA CLASSIC | 1000LUNC 📈 +11.74% | Price: 0.04007
━━━━━━━━━━━━━━
🔍 THE BIGGER MARKET PICTURE
💡 1. Momentum concentration: MMT is significantly outperforming the other listed contracts. Such a move deserves attention, but also caution.
💡 2. Broader participation: Six other contracts are also showing double-digit gains. This could indicate increasing speculative interest across selected altcoins.
💡 3. Momentum versus sustainability: The real test is whether these coins can maintain their gains through healthy consolidation rather than giving everything back.
💡 4. Watch Bitcoin: If BTC remains stable, altcoin momentum may have room to continue. A sudden Bitcoin correction could quickly change the picture.
🎯 MY STRATEGY
✅ Follow volume confirmation.
✅ Watch support and resistance.
✅ Avoid FOMO entries after massive candles.
✅ Keep leverage under control.
✅ Wait for confirmation before taking positions.
🔥 MY CONCLUSION: The market is presenting opportunities, but smart traders focus on sustainability, not just percentage gains.
🐂 Is this the beginning of a stronger altcoin rotation, or are we looking at temporary speculative pumps?
💬 WHICH OF THESE 7 COINS WOULD YOU ADD TO YOUR WATCHLIST?
#Crypto #Altcoins #MMT #SHAZ #EVAA #Pharos #PREDICT #CROSS #LUNC #Bitcoin #Altseason #CryptoTrading #MarketAnalysis
{spot}(MMTUSDT)
{future}(SHAZUSDT)
{future}(EVAAUSDT)
🚀🔥 TOP 7 ALTCOIN MARKET HEATING UP! WHO IS LEADING THE NEXT MOMENTUM WAVE?
Look at these movers! 👀📈 Multiple altcoin perpetual contracts are showing impressive green moves. The interesting part is how different projects are participating in this rally.
🔵 MMT | MOMENTUM 📈 +36.14% | Price: 0.1469
⚫ SHAZ | SHARONAI 📈 +16.44% | Price: 22.74
🟣 EVAA | EVAA PROTOCOL 📈 +16.39% | Price: 3.3508
🔷 PHAROS 📈 +15.67% | Price: 0.5065
🟣 PREDICT 📈 +15.25% | Price: 1.1592
🟢 CROSS | ONECHAIN 📈 +12.19% | Price: 0.15028
🟡 TERRA CLASSIC | 1000LUNC 📈 +11.74% | Price: 0.04007
━━━━━━━━━━━━━━
🔍 THE BIGGER MARKET PICTURE
💡 1. Momentum concentration: MMT is significantly outperforming the other listed contracts. Such a move deserves attention, but also caution.
💡 2. Broader participation: Six other contracts are also showing double-digit gains. This could indicate increasing speculative interest across selected altcoins.
💡 3. Momentum versus sustainability: The real test is whether these coins can maintain their gains through healthy consolidation rather than giving everything back.
💡 4. Watch Bitcoin: If BTC remains stable, altcoin momentum may have room to continue. A sudden Bitcoin correction could quickly change the picture.
🎯 MY STRATEGY
✅ Follow volume confirmation.
✅ Watch support and resistance.
✅ Avoid FOMO entries after massive candles.
✅ Keep leverage under control.
✅ Wait for confirmation before taking positions.
🔥 MY CONCLUSION: The market is presenting opportunities, but smart traders focus on sustainability, not just percentage gains.
🐂 Is this the beginning of a stronger altcoin rotation, or are we looking at temporary speculative pumps?
💬 WHICH OF THESE 7 COINS WOULD YOU ADD TO YOUR WATCHLIST?
#Crypto #Altcoins #MMT #SHAZ #EVAA #Pharos #PREDICT #CROSS #LUNC #Bitcoin #Altseason #CryptoTrading #MarketAnalysis
Look at these movers! 👀📈 Multiple altcoin perpetual contracts are showing impressive green moves. The interesting part is how different projects are participating in this rally.
🔵 MMT | MOMENTUM 📈 +36.14% | Price: 0.1469
⚫ SHAZ | SHARONAI 📈 +16.44% | Price: 22.74
🟣 EVAA | EVAA PROTOCOL 📈 +16.39% | Price: 3.3508
🔷 PHAROS 📈 +15.67% | Price: 0.5065
🟣 PREDICT 📈 +15.25% | Price: 1.1592
🟢 CROSS | ONECHAIN 📈 +12.19% | Price: 0.15028
🟡 TERRA CLASSIC | 1000LUNC 📈 +11.74% | Price: 0.04007
━━━━━━━━━━━━━━
🔍 THE BIGGER MARKET PICTURE
💡 1. Momentum concentration: MMT is significantly outperforming the other listed contracts. Such a move deserves attention, but also caution.
💡 2. Broader participation: Six other contracts are also showing double-digit gains. This could indicate increasing speculative interest across selected altcoins.
💡 3. Momentum versus sustainability: The real test is whether these coins can maintain their gains through healthy consolidation rather than giving everything back.
💡 4. Watch Bitcoin: If BTC remains stable, altcoin momentum may have room to continue. A sudden Bitcoin correction could quickly change the picture.
🎯 MY STRATEGY
✅ Follow volume confirmation.
✅ Watch support and resistance.
✅ Avoid FOMO entries after massive candles.
✅ Keep leverage under control.
✅ Wait for confirmation before taking positions.
🔥 MY CONCLUSION: The market is presenting opportunities, but smart traders focus on sustainability, not just percentage gains.
🐂 Is this the beginning of a stronger altcoin rotation, or are we looking at temporary speculative pumps?
💬 WHICH OF THESE 7 COINS WOULD YOU ADD TO YOUR WATCHLIST?
#Crypto #Altcoins #MMT #SHAZ #EVAA #Pharos #PREDICT #CROSS #LUNC #Bitcoin #Altseason #CryptoTrading #MarketAnalysis
1
647
·
--
උසබ තත්ත්වය
🚀 BREVIS ($BREV ) – Technical Analysis
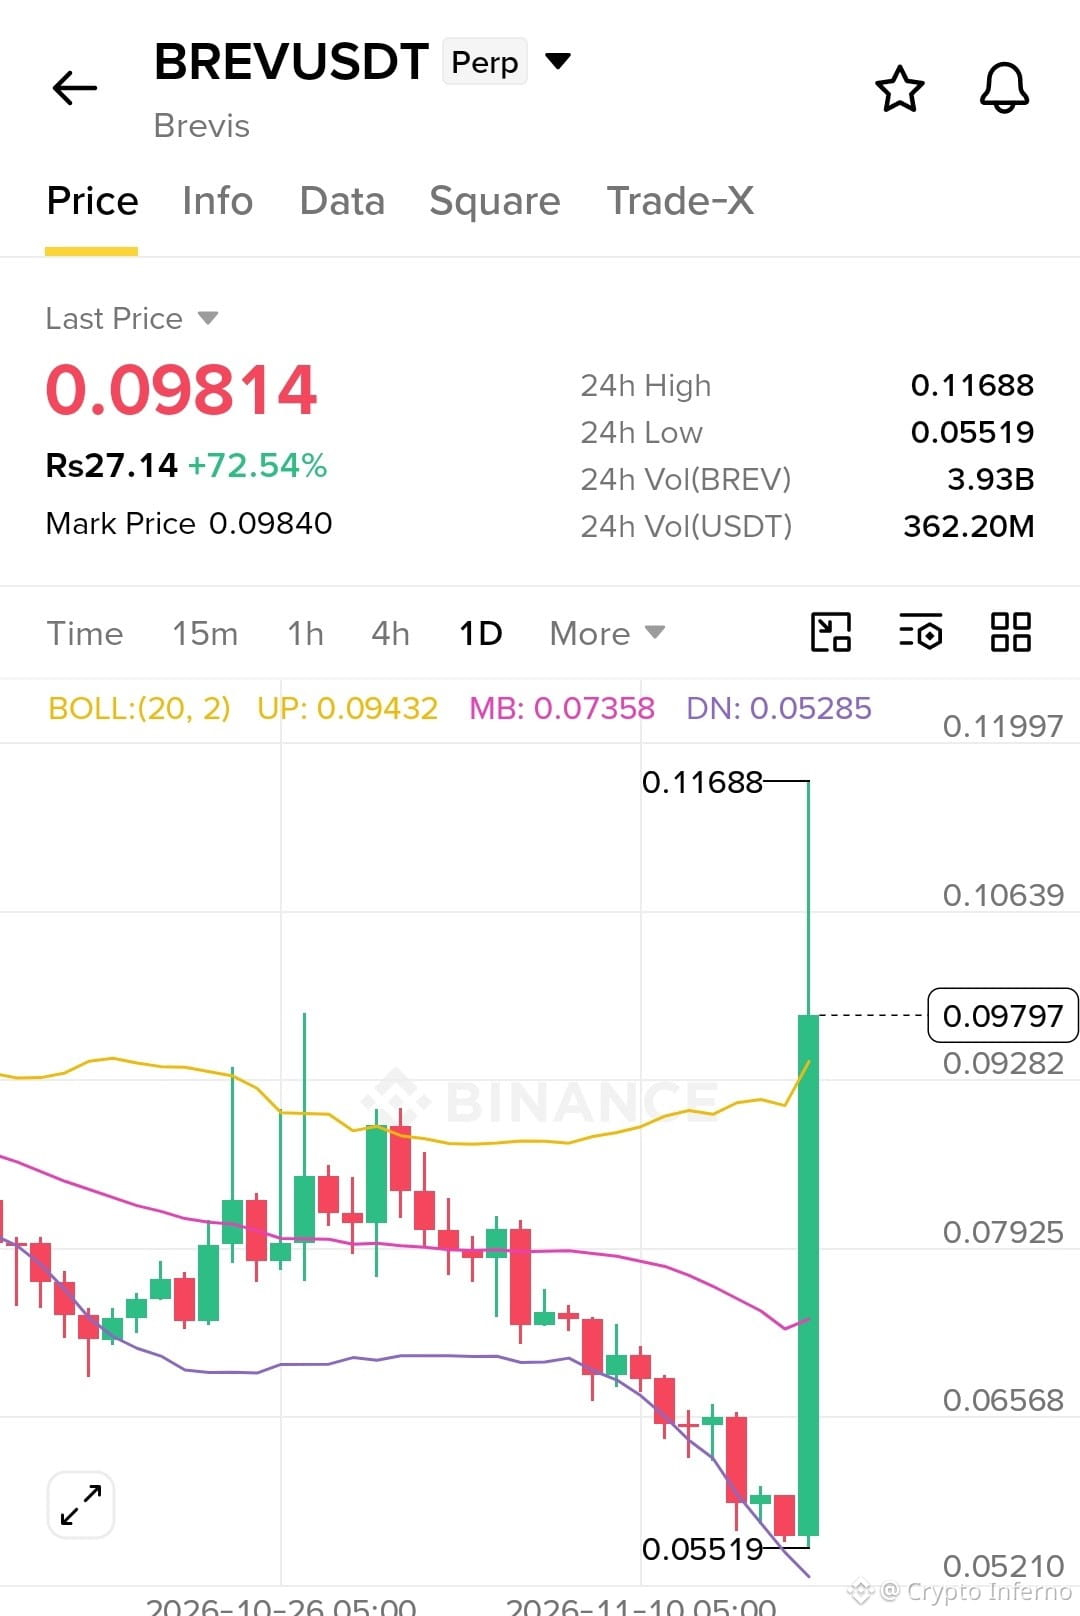
📊 Price Chart Analysis
- Current price: $0.09814
- 24-hour gain: +72.54% 🚀
- Daily low: $0.05519
- Daily high: $0.11688
- Strong bullish candle indicates aggressive buying pressure.
- Price is above the upper Bollinger Band ($0.09432), suggesting a possible short-term correction.
Important levels:
- 🟢 Support: $0.094 – $0.090
- 🟢 Strong support: $0.080 – $0.073
- 🎯 Resistance: $0.105 – $0.117
- 🚀 Breakout target: $0.130 – $0.150
📈 Fundamental Analysis
- Market cap: $43.74M
- Fully diluted valuation: $100.1M
- Trading volume: $128.19M
- Circulating supply: 436.97M BREV
- Maximum supply: 1 billion BREV
- Market cap ranking: #371
My observations:
- 💰 High trading volume indicates strong market activity.
- 📊 Volume/market cap of 293% shows unusually high turnover.
- ⚠️ FDV is more than twice the current market cap, so future token supply and unlocks deserve attention.
- 🔥 Small market cap means significant upside is possible, but volatility is also high.
## 🔮 BREV Future Price Prediction
Bullish scenario| Scenario | Possible price |
| --- | --- |
| Short-term target | $0.117 |
| Next target | $0.130–$0.150 |
| Strong bullish rally | $0.180–$0.200 |
| Extreme bull market | $0.250–$0.300 |
My verdict: 🚀 BREV has shown impressive momentum. If it holds above $0.090 and breaks $0.117 with strong volume, a move toward $0.15–$0.20 becomes possible.
⚠️ If it loses $0.090, a correction toward $0.080 or lower is possible.
Remember: These are speculative scenarios based on your screenshots, not guaranteed targets. Avoid chasing a +72% pump, especially with leveraged Perpetual Futures. Protect your capital! 🛡️
{spot}(BREVUSDT)
🚀 BREVIS ($BREV ) – Technical Analysis
📊 Price Chart Analysis
- Current price: $0.09814
- 24-hour gain: +72.54% 🚀
- Daily low: $0.05519
- Daily high: $0.11688
- Strong bullish candle indicates aggressive buying pressure.
- Price is above the upper Bollinger Band ($0.09432), suggesting a possible short-term correction.
Important levels:
- 🟢 Support: $0.094 – $0.090
- 🟢 Strong support: $0.080 – $0.073
- 🎯 Resistance: $0.105 – $0.117
- 🚀 Breakout target: $0.130 – $0.150
📈 Fundamental Analysis
- Market cap: $43.74M
- Fully diluted valuation: $100.1M
- Trading volume: $128.19M
- Circulating supply: 436.97M BREV
- Maximum supply: 1 billion BREV
- Market cap ranking: #371
My observations:
- 💰 High trading volume indicates strong market activity.
- 📊 Volume/market cap of 293% shows unusually high turnover.
- ⚠️ FDV is more than twice the current market cap, so future token supply and unlocks deserve attention.
- 🔥 Small market cap means significant upside is possible, but volatility is also high.
## 🔮 BREV Future Price Prediction
Bullish scenario| Scenario | Possible price |
| --- | --- |
| Short-term target | $0.117 |
| Next target | $0.130–$0.150 |
| Strong bullish rally | $0.180–$0.200 |
| Extreme bull market | $0.250–$0.300 |
My verdict: 🚀 BREV has shown impressive momentum. If it holds above $0.090 and breaks $0.117 with strong volume, a move toward $0.15–$0.20 becomes possible.
⚠️ If it loses $0.090, a correction toward $0.080 or lower is possible.
Remember: These are speculative scenarios based on your screenshots, not guaranteed targets. Avoid chasing a +72% pump, especially with leveraged Perpetual Futures. Protect your capital! 🛡️
📊 Price Chart Analysis
- Current price: $0.09814
- 24-hour gain: +72.54% 🚀
- Daily low: $0.05519
- Daily high: $0.11688
- Strong bullish candle indicates aggressive buying pressure.
- Price is above the upper Bollinger Band ($0.09432), suggesting a possible short-term correction.
Important levels:
- 🟢 Support: $0.094 – $0.090
- 🟢 Strong support: $0.080 – $0.073
- 🎯 Resistance: $0.105 – $0.117
- 🚀 Breakout target: $0.130 – $0.150
📈 Fundamental Analysis
- Market cap: $43.74M
- Fully diluted valuation: $100.1M
- Trading volume: $128.19M
- Circulating supply: 436.97M BREV
- Maximum supply: 1 billion BREV
- Market cap ranking: #371
My observations:
- 💰 High trading volume indicates strong market activity.
- 📊 Volume/market cap of 293% shows unusually high turnover.
- ⚠️ FDV is more than twice the current market cap, so future token supply and unlocks deserve attention.
- 🔥 Small market cap means significant upside is possible, but volatility is also high.
## 🔮 BREV Future Price Prediction
Bullish scenario| Scenario | Possible price |
| --- | --- |
| Short-term target | $0.117 |
| Next target | $0.130–$0.150 |
| Strong bullish rally | $0.180–$0.200 |
| Extreme bull market | $0.250–$0.300 |
My verdict: 🚀 BREV has shown impressive momentum. If it holds above $0.090 and breaks $0.117 with strong volume, a move toward $0.15–$0.20 becomes possible.
⚠️ If it loses $0.090, a correction toward $0.080 or lower is possible.
Remember: These are speculative scenarios based on your screenshots, not guaranteed targets. Avoid chasing a +72% pump, especially with leveraged Perpetual Futures. Protect your capital! 🛡️
406
·
--
උසබ තත්ත්වය
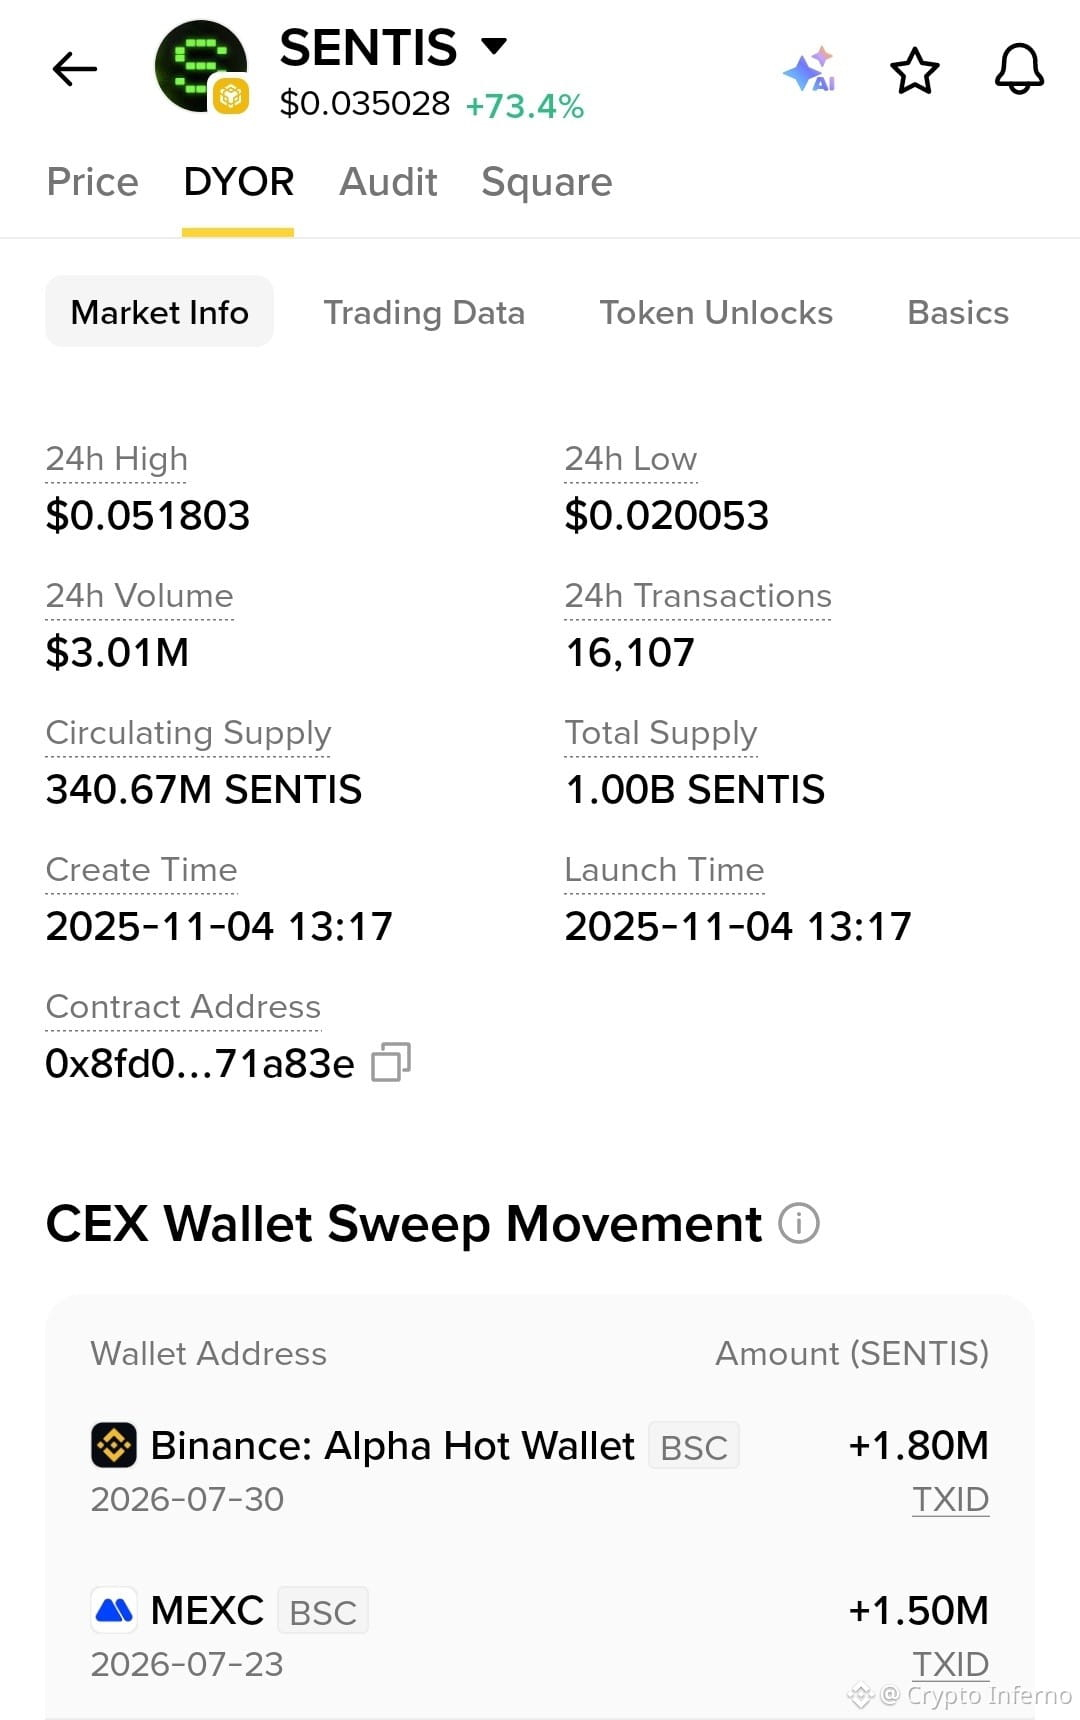
🚀 SENTIS ($SENTIS ) — A POWERFUL MOVE, BIG EXCHANGE ACTIVITY & A POTENTIAL TURNING POINT! 🔥
The latest SENTIS charts and market data are showing some interesting developments! 👀
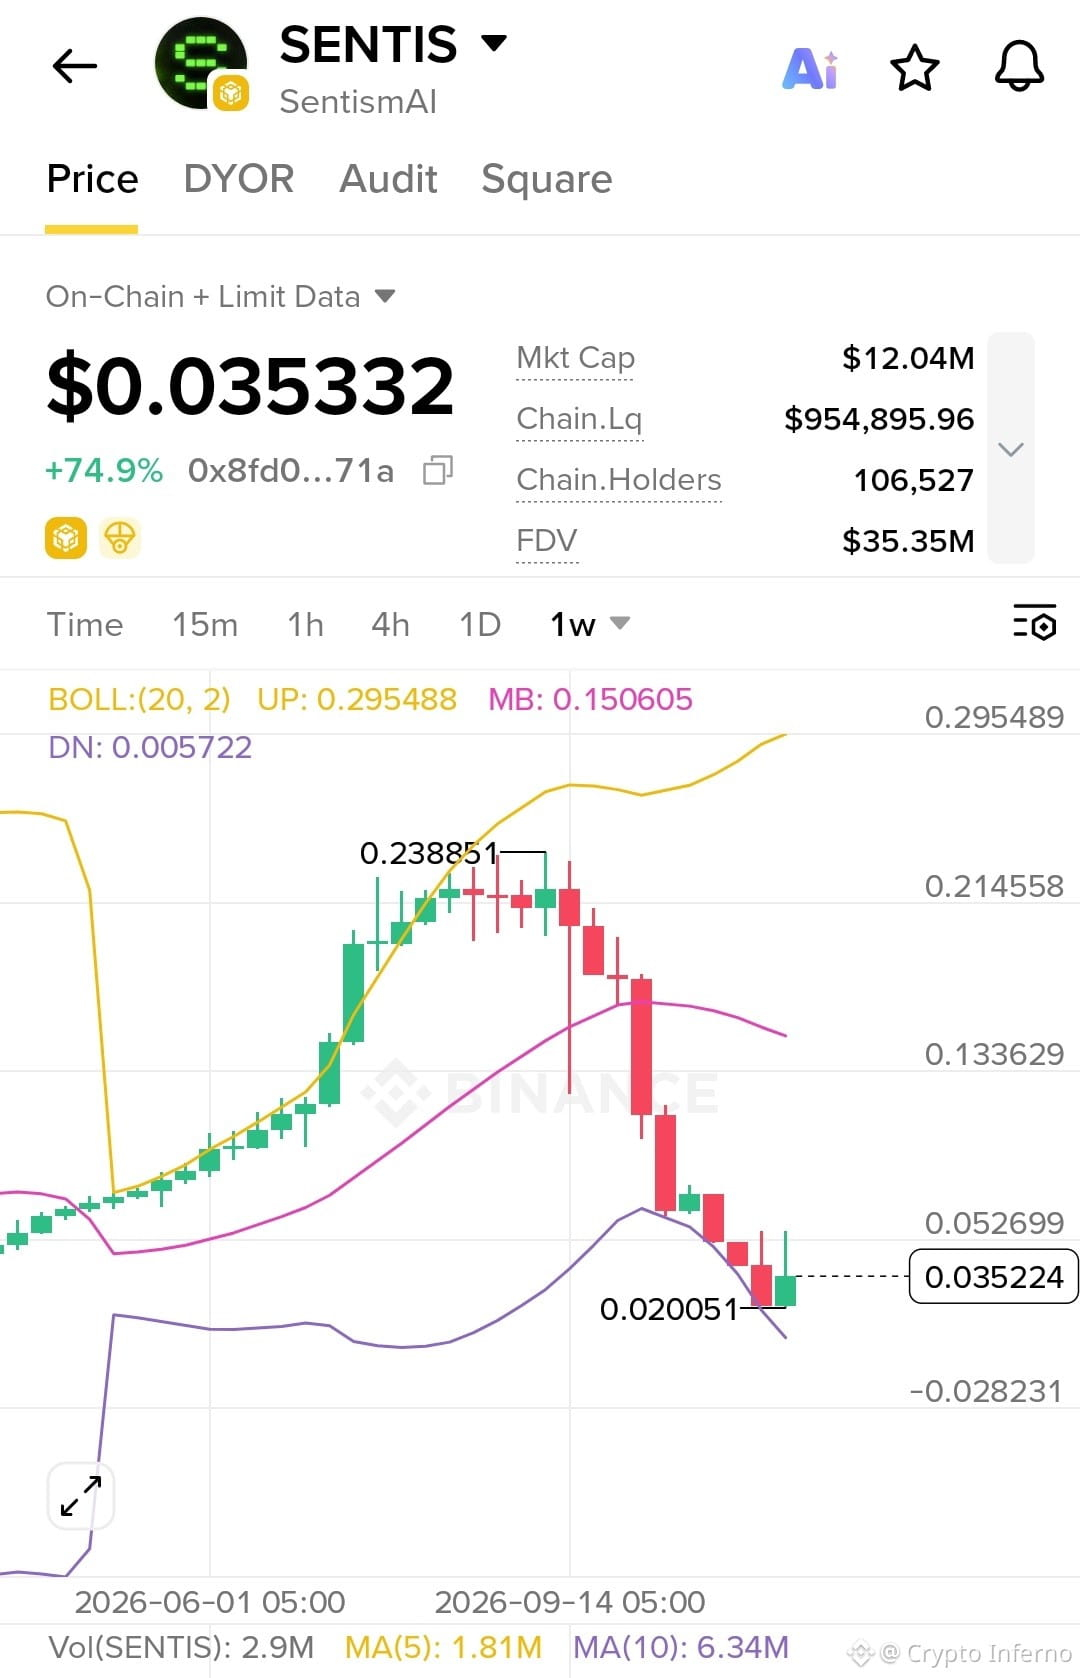
📊 MARKET OVERVIEW
💰 Current price: Around $0.0353
🟢 24H price increase: +73.4% to +74.9%
📈 24H high: $0.051803
📉 24H low: $0.020053
💵 Market cap: $12.04M
💧 On-chain liquidity: Approximately $954.9K
👥 Holders: 106,527
🔄 24H trading volume: $3.01M
⚡ 24H transactions: 16,107
🏦 MAJOR CEX WALLET MOVEMENTS!
The DYOR data highlights notable exchange wallet activity:
🔶 Binance Alpha Hot Wallet (BSC): +1.80M SENTIS — July 30, 2026
🔵 MEXC (BSC): +1.50M SENTIS — July 23, 2026
These movements are worth monitoring as exchange wallet activity can provide clues about token flows and market behavior. However, wallet movements alone do not confirm buying pressure or future price direction.
📉 WHAT DOES THE CHART TELL US?
On the 1W timeframe, SENTIS experienced a strong rally, reaching approximately $0.238851 before a significant correction.
The price has since fallen toward the $0.020053 low and is now showing a small rebound around $0.035.
This is a critical area to watch! 👀
🔥 THE BIG PICTURE
With over 106K holders, millions in reported daily volume, and visible CEX wallet activity, SENTIS is attracting attention.
But remember:
📈 Watch for sustained buying volume.
🧱 Monitor resistance and support levels.
🏦 Track exchange wallet movements.
🔍 Always DYOR before making decisions.
SENTIS is on the radar. The next move will be important! 🚀💎
Are we witnessing the beginning of a recovery, or just a temporary bounce?
👇 What is your opinion on SENTIS?
#SENTIS #SentismAI #Crypto #BSC #BinanceAlpha #MEXC #Altcoins #CryptoAnalysis #DYOR #Web3 #CryptoCommunity
{alpha}(560x8fd0d741e09a98e82256c63f25f90301ea71a83e)
🚀 SENTIS ($SENTIS ) — A POWERFUL MOVE, BIG EXCHANGE ACTIVITY & A POTENTIAL TURNING POINT! 🔥
The latest SENTIS charts and market data are showing some interesting developments! 👀
📊 MARKET OVERVIEW
💰 Current price: Around $0.0353
🟢 24H price increase: +73.4% to +74.9%
📈 24H high: $0.051803
📉 24H low: $0.020053
💵 Market cap: $12.04M
💧 On-chain liquidity: Approximately $954.9K
👥 Holders: 106,527
🔄 24H trading volume: $3.01M
⚡ 24H transactions: 16,107
🏦 MAJOR CEX WALLET MOVEMENTS!
The DYOR data highlights notable exchange wallet activity:
🔶 Binance Alpha Hot Wallet (BSC): +1.80M SENTIS — July 30, 2026
🔵 MEXC (BSC): +1.50M SENTIS — July 23, 2026
These movements are worth monitoring as exchange wallet activity can provide clues about token flows and market behavior. However, wallet movements alone do not confirm buying pressure or future price direction.
📉 WHAT DOES THE CHART TELL US?
On the 1W timeframe, SENTIS experienced a strong rally, reaching approximately $0.238851 before a significant correction.
The price has since fallen toward the $0.020053 low and is now showing a small rebound around $0.035.
This is a critical area to watch! 👀
🔥 THE BIG PICTURE
With over 106K holders, millions in reported daily volume, and visible CEX wallet activity, SENTIS is attracting attention.
But remember:
📈 Watch for sustained buying volume.
🧱 Monitor resistance and support levels.
🏦 Track exchange wallet movements.
🔍 Always DYOR before making decisions.
SENTIS is on the radar. The next move will be important! 🚀💎
Are we witnessing the beginning of a recovery, or just a temporary bounce?
👇 What is your opinion on SENTIS?
#SENTIS #SentismAI #Crypto #BSC #BinanceAlpha #MEXC #Altcoins #CryptoAnalysis #DYOR #Web3 #CryptoCommunity
The latest SENTIS charts and market data are showing some interesting developments! 👀
📊 MARKET OVERVIEW
💰 Current price: Around $0.0353
🟢 24H price increase: +73.4% to +74.9%
📈 24H high: $0.051803
📉 24H low: $0.020053
💵 Market cap: $12.04M
💧 On-chain liquidity: Approximately $954.9K
👥 Holders: 106,527
🔄 24H trading volume: $3.01M
⚡ 24H transactions: 16,107
🏦 MAJOR CEX WALLET MOVEMENTS!
The DYOR data highlights notable exchange wallet activity:
🔶 Binance Alpha Hot Wallet (BSC): +1.80M SENTIS — July 30, 2026
🔵 MEXC (BSC): +1.50M SENTIS — July 23, 2026
These movements are worth monitoring as exchange wallet activity can provide clues about token flows and market behavior. However, wallet movements alone do not confirm buying pressure or future price direction.
📉 WHAT DOES THE CHART TELL US?
On the 1W timeframe, SENTIS experienced a strong rally, reaching approximately $0.238851 before a significant correction.
The price has since fallen toward the $0.020053 low and is now showing a small rebound around $0.035.
This is a critical area to watch! 👀
🔥 THE BIG PICTURE
With over 106K holders, millions in reported daily volume, and visible CEX wallet activity, SENTIS is attracting attention.
But remember:
📈 Watch for sustained buying volume.
🧱 Monitor resistance and support levels.
🏦 Track exchange wallet movements.
🔍 Always DYOR before making decisions.
SENTIS is on the radar. The next move will be important! 🚀💎
Are we witnessing the beginning of a recovery, or just a temporary bounce?
👇 What is your opinion on SENTIS?
#SENTIS #SentismAI #Crypto #BSC #BinanceAlpha #MEXC #Altcoins #CryptoAnalysis #DYOR #Web3 #CryptoCommunity
1
337
🚀 BTTC: Is a Potential Reversal Around the Corner? 📈🔥
$BTTC is showing interesting market activity, trading near $0.00000031 despite a 2.47% daily decline. High trading volume suggests that market participants are still paying attention. 👀
📊 Key Levels to Watch:
🎯 Resistance: $0.00000032
📉 Current trend: Short-term bearish pressure
🔥 RSI: 11.32 (deeply oversold)
⏳ Confirmation: Hourly candle close above $0.00000032
💡 Trading Strategy: Patience is key! Watch for a confirmed hourly close above $0.00000032 before considering an entry. This could indicate improving buying pressure and a potential short-term reversal.
🐂 Social Sentiment:
🟢 69.99% Bullish
🔴 30% Bearish
💰 BTTC Earn Opportunity:
APR: +5.00%
Lock-up Period: 60 Days
Displayed Risk Level: Low
⚠️ Oversold conditions don't guarantee a reversal. Always DYOR and manage your risk before investing.
🔥 Is BTTC preparing for its next big move? Share your thoughts below! 👇
❤️ Follow me for more crypto updates, market insights, trading analysis, and potential opportunities! 🚀
🔔 Stay informed. Stay focused. Trade smart!
#BTTC #BitTorrent #Crypto #CryptoTrading #Altcoins #TechnicalAnalysis #CryptoMarket #Bullish #DYOR
🚀 BTTC: Is a Potential Reversal Around the Corner? 📈🔥
$BTTC is showing interesting market activity, trading near $0.00000031 despite a 2.47% daily decline. High trading volume suggests that market participants are still paying attention. 👀
📊 Key Levels to Watch:
🎯 Resistance: $0.00000032
📉 Current trend: Short-term bearish pressure
🔥 RSI: 11.32 (deeply oversold)
⏳ Confirmation: Hourly candle close above $0.00000032
💡 Trading Strategy: Patience is key! Watch for a confirmed hourly close above $0.00000032 before considering an entry. This could indicate improving buying pressure and a potential short-term reversal.
🐂 Social Sentiment:
🟢 69.99% Bullish
🔴 30% Bearish
💰 BTTC Earn Opportunity:
APR: +5.00%
Lock-up Period: 60 Days
Displayed Risk Level: Low
⚠️ Oversold conditions don't guarantee a reversal. Always DYOR and manage your risk before investing.
🔥 Is BTTC preparing for its next big move? Share your thoughts below! 👇
❤️ Follow me for more crypto updates, market insights, trading analysis, and potential opportunities! 🚀
🔔 Stay informed. Stay focused. Trade smart!
#BTTC #BitTorrent #Crypto #CryptoTrading #Altcoins #TechnicalAnalysis #CryptoMarket #Bullish #DYOR
$BTTC is showing interesting market activity, trading near $0.00000031 despite a 2.47% daily decline. High trading volume suggests that market participants are still paying attention. 👀
📊 Key Levels to Watch:
🎯 Resistance: $0.00000032
📉 Current trend: Short-term bearish pressure
🔥 RSI: 11.32 (deeply oversold)
⏳ Confirmation: Hourly candle close above $0.00000032
💡 Trading Strategy: Patience is key! Watch for a confirmed hourly close above $0.00000032 before considering an entry. This could indicate improving buying pressure and a potential short-term reversal.
🐂 Social Sentiment:
🟢 69.99% Bullish
🔴 30% Bearish
💰 BTTC Earn Opportunity:
APR: +5.00%
Lock-up Period: 60 Days
Displayed Risk Level: Low
⚠️ Oversold conditions don't guarantee a reversal. Always DYOR and manage your risk before investing.
🔥 Is BTTC preparing for its next big move? Share your thoughts below! 👇
❤️ Follow me for more crypto updates, market insights, trading analysis, and potential opportunities! 🚀
🔔 Stay informed. Stay focused. Trade smart!
#BTTC #BitTorrent #Crypto #CryptoTrading #Altcoins #TechnicalAnalysis #CryptoMarket #Bullish #DYOR

523
·
--
උසබ තත්ත්වය
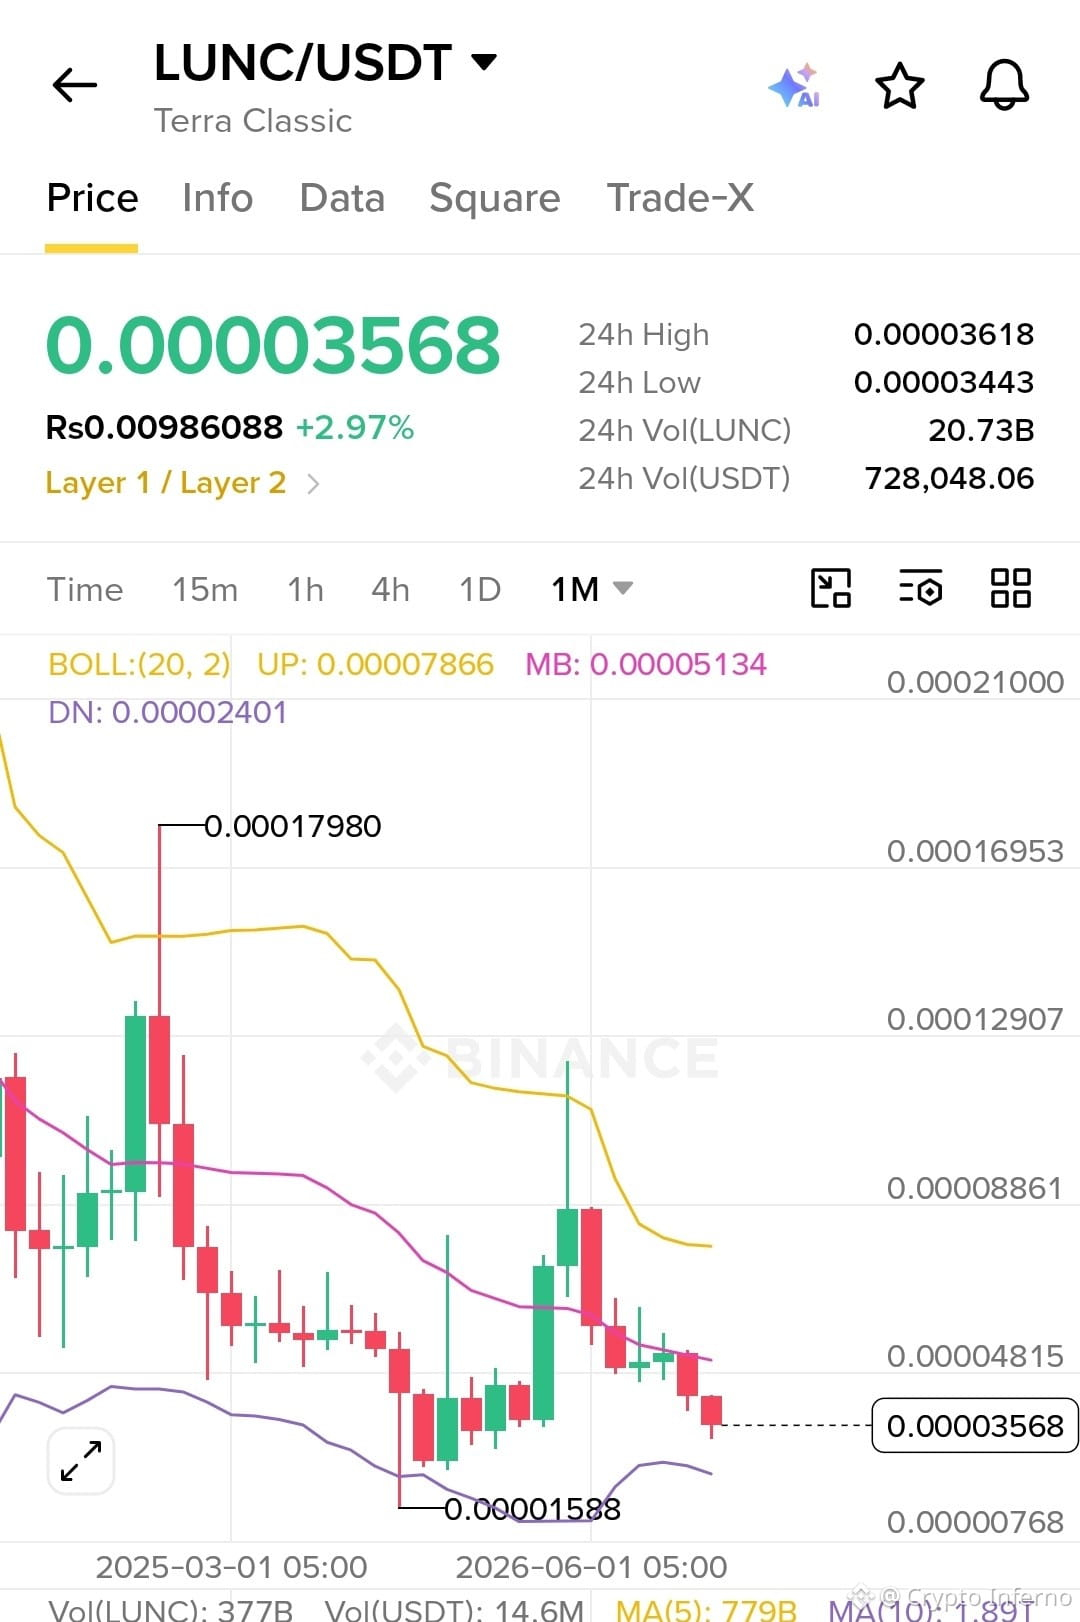
🚨 LUNC/USDT – TERRA CLASSIC: IS THE NEXT BIG MOVE COMING? 🚀🔥
📊 Let's talk about what the chart is telling us!
Terra Classic ($LUNC ) is currently trading around 0.00003568 USDT, showing a 24-hour gain of +2.97%. 🟢
Looking at the 1M (monthly) chart, we can identify some important technical signals:
🔻 1. Long-Term Downtrend The overall chart structure remains bearish, with lower price levels over time. The price is still trading below the middle Bollinger Band, suggesting that bullish momentum has not yet taken control.
📉 2. Bollinger Bands Analysis
Upper Band: 0.00007866
Middle Band: 0.00005134
Lower Band: 0.00002401
LUNC is trading below the middle band, indicating continued bearish pressure. However, the lower band could act as a potential support zone.
🟢 3. Important Support Zone The previous chart low is around 0.00001588. This is an important historical level to watch if selling pressure returns.
🚀 4. Key Resistance Levels
First resistance: 0.00004815
Major resistance: 0.00005134
Stronger resistance: 0.00007866
A sustained monthly move above the middle Bollinger Band could improve the bullish outlook.
🐂 5. What Could Happen Next?
If buyers step in and LUNC breaks above resistance with strong volume, we could see a recovery attempt toward higher levels.
However, if the price fails to hold its current support area, another downside move remains possible.
💎 MY TAKE: LUNC is showing a small positive 24-hour move, but the monthly chart still needs confirmation of a trend reversal. Patience, volume, and a strong breakout will be important.
🔥 Can Terra Classic surprise the market with another major rally?
👇 Are you BULLISH 🐂 or BEARISH 🐻 on LUNC?
#LUNC #TerraClassic #LUNCUSDT #Crypto #CryptoTrading #Binance #Altcoins #BullRun #CryptoAnalysis #TechnicalAnalysis
{spot}(LUNCUSDT)
🚨 LUNC/USDT – TERRA CLASSIC: IS THE NEXT BIG MOVE COMING? 🚀🔥
📊 Let's talk about what the chart is telling us!
Terra Classic ($LUNC ) is currently trading around 0.00003568 USDT, showing a 24-hour gain of +2.97%. 🟢
Looking at the 1M (monthly) chart, we can identify some important technical signals:
🔻 1. Long-Term Downtrend The overall chart structure remains bearish, with lower price levels over time. The price is still trading below the middle Bollinger Band, suggesting that bullish momentum has not yet taken control.
📉 2. Bollinger Bands Analysis
Upper Band: 0.00007866
Middle Band: 0.00005134
Lower Band: 0.00002401
LUNC is trading below the middle band, indicating continued bearish pressure. However, the lower band could act as a potential support zone.
🟢 3. Important Support Zone The previous chart low is around 0.00001588. This is an important historical level to watch if selling pressure returns.
🚀 4. Key Resistance Levels
First resistance: 0.00004815
Major resistance: 0.00005134
Stronger resistance: 0.00007866
A sustained monthly move above the middle Bollinger Band could improve the bullish outlook.
🐂 5. What Could Happen Next?
If buyers step in and LUNC breaks above resistance with strong volume, we could see a recovery attempt toward higher levels.
However, if the price fails to hold its current support area, another downside move remains possible.
💎 MY TAKE: LUNC is showing a small positive 24-hour move, but the monthly chart still needs confirmation of a trend reversal. Patience, volume, and a strong breakout will be important.
🔥 Can Terra Classic surprise the market with another major rally?
👇 Are you BULLISH 🐂 or BEARISH 🐻 on LUNC?
#LUNC #TerraClassic #LUNCUSDT #Crypto #CryptoTrading #Binance #Altcoins #BullRun #CryptoAnalysis #TechnicalAnalysis
📊 Let's talk about what the chart is telling us!
Terra Classic ($LUNC ) is currently trading around 0.00003568 USDT, showing a 24-hour gain of +2.97%. 🟢
Looking at the 1M (monthly) chart, we can identify some important technical signals:
🔻 1. Long-Term Downtrend The overall chart structure remains bearish, with lower price levels over time. The price is still trading below the middle Bollinger Band, suggesting that bullish momentum has not yet taken control.
📉 2. Bollinger Bands Analysis
Upper Band: 0.00007866
Middle Band: 0.00005134
Lower Band: 0.00002401
LUNC is trading below the middle band, indicating continued bearish pressure. However, the lower band could act as a potential support zone.
🟢 3. Important Support Zone The previous chart low is around 0.00001588. This is an important historical level to watch if selling pressure returns.
🚀 4. Key Resistance Levels
First resistance: 0.00004815
Major resistance: 0.00005134
Stronger resistance: 0.00007866
A sustained monthly move above the middle Bollinger Band could improve the bullish outlook.
🐂 5. What Could Happen Next?
If buyers step in and LUNC breaks above resistance with strong volume, we could see a recovery attempt toward higher levels.
However, if the price fails to hold its current support area, another downside move remains possible.
💎 MY TAKE: LUNC is showing a small positive 24-hour move, but the monthly chart still needs confirmation of a trend reversal. Patience, volume, and a strong breakout will be important.
🔥 Can Terra Classic surprise the market with another major rally?
👇 Are you BULLISH 🐂 or BEARISH 🐻 on LUNC?
#LUNC #TerraClassic #LUNCUSDT #Crypto #CryptoTrading #Binance #Altcoins #BullRun #CryptoAnalysis #TechnicalAnalysis
9
948
🚀🔥 TOP 4 CRYPTO FUTURES GAINERS TODAY 📈💰
The market is showing strong upward movements! Here are the top 4 trending Perpetual Futures pairs with their latest prices and percentage gains from the screenshot. 👇
🥇 1. BLESSUSDT (Bless) 💵 Price: 0.017837 📈 24h Change: +96.96% 🔥 Leading the list with the highest percentage gain!
🥈 2. RAREUSDT (SuperRare) 💵 Price: 0.01521 📈 24h Change: +77.48% 🚀 Strong upward momentum!
🥉 3. SPACEUSDT (SPACE) 💵 Price: 0.003598 📈 24h Change: +28.55% 💎 Moving higher with positive momentum!
🏅 4. EVAAUSDT (EVAA Protocol) 💵 Price: 3.3034 📈 24h Change: +26.45% 🚀 Another strong performer!
📊 MARKET HIGHLIGHTS 🔥 BLESS takes the top position. 🚀 RARE follows with a +77.48% gain. 💎 All four trading pairs are showing positive movements.
⚠️ Always manage your risk and do your own research before trading.
💬 Which of these four coins are you watching?
#CryptoGainers #CryptoMarket #FuturesTrading #BLESS #RARE #SPACE #EVAA #Altcoins #CryptoTrading #Binance
{alpha}(560x7c8217517ed4711fe2deccdfeffe8d906b9ae11f)
{future}(RAREUSDT)
{alpha}(560x87acfa3fd7a6e0d48677d070644d76905c2bdc00)
🚀🔥 TOP 4 CRYPTO FUTURES GAINERS TODAY 📈💰
The market is showing strong upward movements! Here are the top 4 trending Perpetual Futures pairs with their latest prices and percentage gains from the screenshot. 👇
🥇 1. BLESSUSDT (Bless) 💵 Price: 0.017837 📈 24h Change: +96.96% 🔥 Leading the list with the highest percentage gain!
🥈 2. RAREUSDT (SuperRare) 💵 Price: 0.01521 📈 24h Change: +77.48% 🚀 Strong upward momentum!
🥉 3. SPACEUSDT (SPACE) 💵 Price: 0.003598 📈 24h Change: +28.55% 💎 Moving higher with positive momentum!
🏅 4. EVAAUSDT (EVAA Protocol) 💵 Price: 3.3034 📈 24h Change: +26.45% 🚀 Another strong performer!
📊 MARKET HIGHLIGHTS 🔥 BLESS takes the top position. 🚀 RARE follows with a +77.48% gain. 💎 All four trading pairs are showing positive movements.
⚠️ Always manage your risk and do your own research before trading.
💬 Which of these four coins are you watching?
#CryptoGainers #CryptoMarket #FuturesTrading #BLESS #RARE #SPACE #EVAA #Altcoins #CryptoTrading #Binance
The market is showing strong upward movements! Here are the top 4 trending Perpetual Futures pairs with their latest prices and percentage gains from the screenshot. 👇
🥇 1. BLESSUSDT (Bless) 💵 Price: 0.017837 📈 24h Change: +96.96% 🔥 Leading the list with the highest percentage gain!
🥈 2. RAREUSDT (SuperRare) 💵 Price: 0.01521 📈 24h Change: +77.48% 🚀 Strong upward momentum!
🥉 3. SPACEUSDT (SPACE) 💵 Price: 0.003598 📈 24h Change: +28.55% 💎 Moving higher with positive momentum!
🏅 4. EVAAUSDT (EVAA Protocol) 💵 Price: 3.3034 📈 24h Change: +26.45% 🚀 Another strong performer!
📊 MARKET HIGHLIGHTS 🔥 BLESS takes the top position. 🚀 RARE follows with a +77.48% gain. 💎 All four trading pairs are showing positive movements.
⚠️ Always manage your risk and do your own research before trading.
💬 Which of these four coins are you watching?
#CryptoGainers #CryptoMarket #FuturesTrading #BLESS #RARE #SPACE #EVAA #Altcoins #CryptoTrading #Binance
BLESS: Strong Buy 🚀
72%
RARE: Bullish Momentum 🔥
11%
SPACE: Watch Closely 💎
17%
EVAA: Potential Growth 📈
0%
18 ඡන්ද • ඡන්දය අවසන්
1
1.9k
·
--
උසබ තත්ත්වය
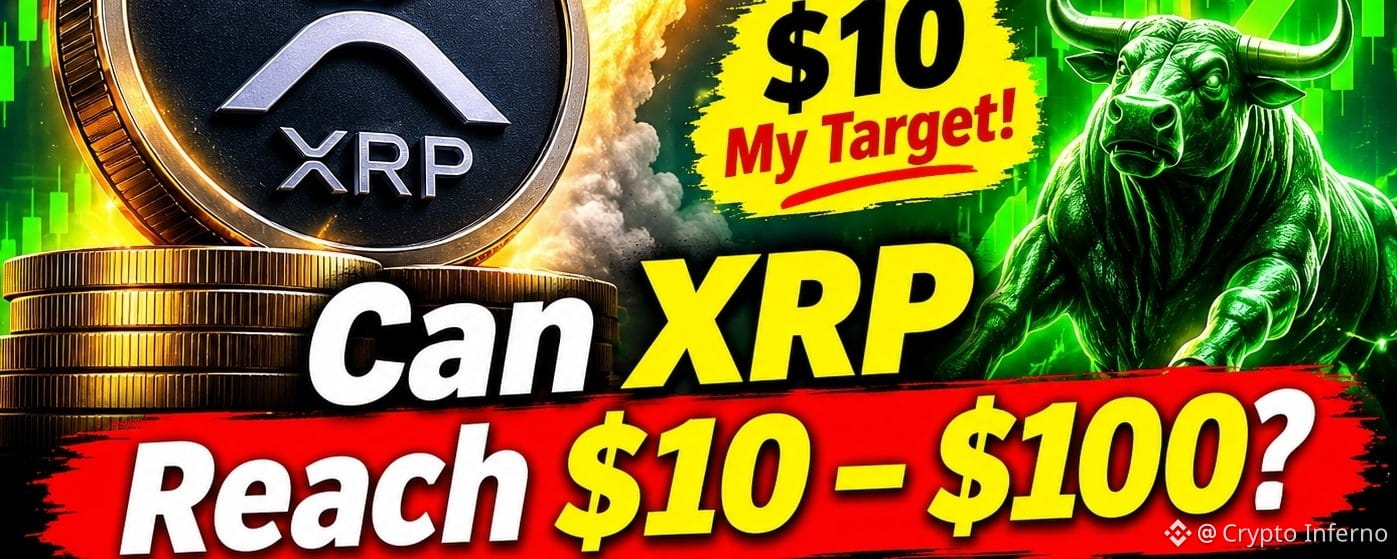
🚨 STOP THE XRP HYPE!
Every day, Binance Square is flooded with posts predicting XRP at $10, $50 or even $100. But where is the mathematics? 🤔
Let's look at the numbers:
💰 $10 XRP = ~$635 billion market cap
💰 $50 XRP = ~$3.17 trillion market cap
💰 $100 XRP = ~$6.35 trillion market cap
These aren't ordinary price targets. They require extraordinary global demand, adoption, and capital valuation.
📢 Why do people publish these predictions?
To gain followers and engagement.
To attract inexperienced investors.
To create FOMO.
To generate hype around their own holdings.
I'm not against XRP. I'm against misleading investors with unrealistic promises.
🔥 Being bullish is fine. Selling dreams without mathematics is not!
🤝 Follow me for regular crypto awareness, scam alerts, and protection against misleading XRP price predictions! 🚨
Let's build a smarter crypto community together. 🛡️📊
Follow for facts, not fake promises! 🔥
#XRP #CryptoSafety #ScamAlert #BinanceSquare
{spot}(XRPUSDT)
🚨 STOP THE XRP HYPE!
Every day, Binance Square is flooded with posts predicting XRP at $10, $50 or even $100. But where is the mathematics? 🤔
Let's look at the numbers:
💰 $10 XRP = ~$635 billion market cap
💰 $50 XRP = ~$3.17 trillion market cap
💰 $100 XRP = ~$6.35 trillion market cap
These aren't ordinary price targets. They require extraordinary global demand, adoption, and capital valuation.
📢 Why do people publish these predictions?
To gain followers and engagement.
To attract inexperienced investors.
To create FOMO.
To generate hype around their own holdings.
I'm not against XRP. I'm against misleading investors with unrealistic promises.
🔥 Being bullish is fine. Selling dreams without mathematics is not!
🤝 Follow me for regular crypto awareness, scam alerts, and protection against misleading XRP price predictions! 🚨
Let's build a smarter crypto community together. 🛡️📊
Follow for facts, not fake promises! 🔥
#XRP #CryptoSafety #ScamAlert #BinanceSquare
Every day, Binance Square is flooded with posts predicting XRP at $10, $50 or even $100. But where is the mathematics? 🤔
Let's look at the numbers:
💰 $10 XRP = ~$635 billion market cap
💰 $50 XRP = ~$3.17 trillion market cap
💰 $100 XRP = ~$6.35 trillion market cap
These aren't ordinary price targets. They require extraordinary global demand, adoption, and capital valuation.
📢 Why do people publish these predictions?
To gain followers and engagement.
To attract inexperienced investors.
To create FOMO.
To generate hype around their own holdings.
I'm not against XRP. I'm against misleading investors with unrealistic promises.
🔥 Being bullish is fine. Selling dreams without mathematics is not!
🤝 Follow me for regular crypto awareness, scam alerts, and protection against misleading XRP price predictions! 🚨
Let's build a smarter crypto community together. 🛡️📊
Follow for facts, not fake promises! 🔥
#XRP #CryptoSafety #ScamAlert #BinanceSquare
156
·
--
උසබ තත්ත්වය
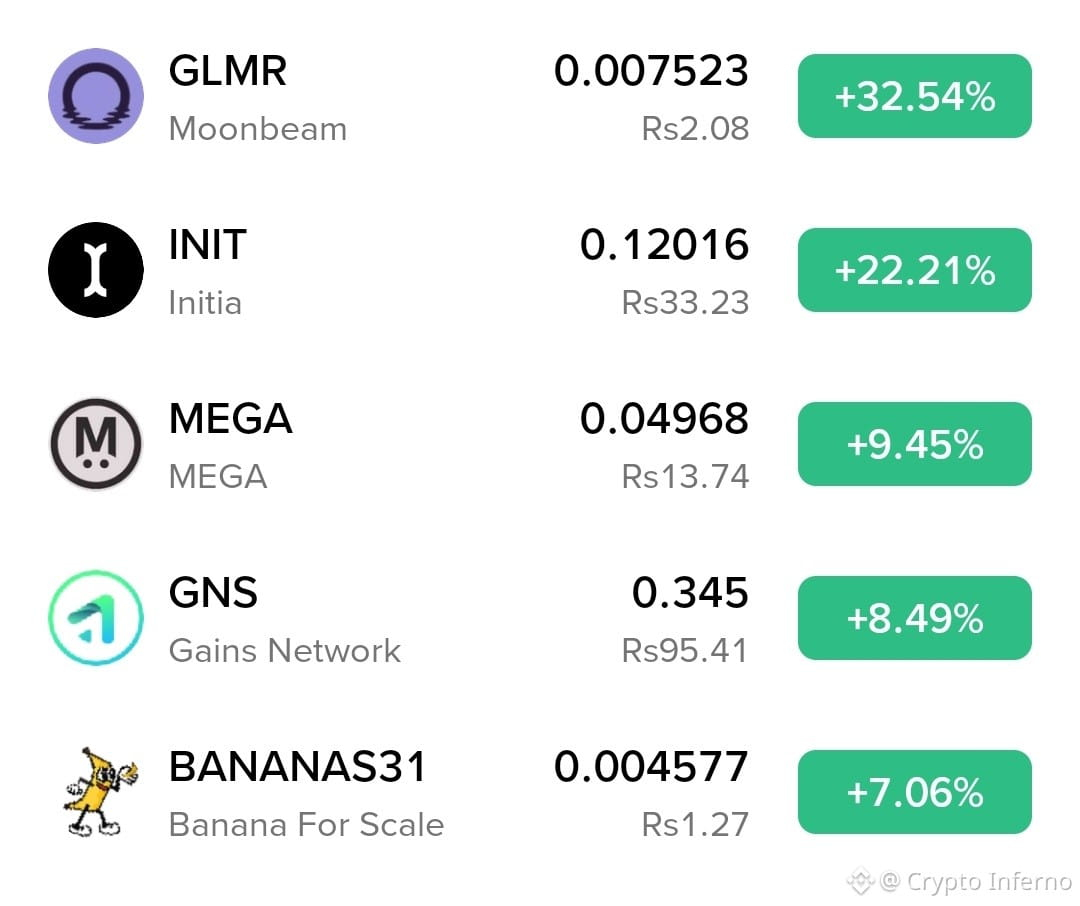
🚀 CRYPTO MARKET WATCH: 5 COINS IN THE GREEN! 📊🔥
Here’s a closer look at five cryptocurrencies showing positive percentage changes in the displayed snapshot:
🌙 1. GLMR (Moonbeam) 💰 Price: 0.007523 📈 Change: +32.54%
⚡ 2. INIT (Initia) 💰 Price: 0.12016 📈 Change: +22.21%
💎 3. MEGA (MEGA) 💰 Price: 0.04968 📈 Change: +9.45%
📈 4. GNS (Gains Network) 💰 Price: 0.345 📈 Change: +8.49%
🍌 5. BANANAS31 (Banana For Scale) 💰 Price: 0.004577 📈 Change: +7.06%
🏆 GLMR currently leads this list with the highest displayed gain of 32.54%, followed by INIT at 22.21%.
👀 Which of these five coins are you watching?
🔔 FOLLOW for more crypto price updates, market snapshots, and trending coin discussions!
Let's learn, share, and grow together! 🌍🚀
⚠️ Figures reflect the attached snapshot and may change with the market. This is not financial advice.
#Crypto #CryptoMarket #Altcoins #GLMR #Initia #MEGA #GNS #BANANAS31 #CryptoWatchlist
{spot}(GLMRUSDT)
{spot}(INITUSDT)
{spot}(GNSUSDT)
🚀 CRYPTO MARKET WATCH: 5 COINS IN THE GREEN! 📊🔥
Here’s a closer look at five cryptocurrencies showing positive percentage changes in the displayed snapshot:
🌙 1. GLMR (Moonbeam) 💰 Price: 0.007523 📈 Change: +32.54%
⚡ 2. INIT (Initia) 💰 Price: 0.12016 📈 Change: +22.21%
💎 3. MEGA (MEGA) 💰 Price: 0.04968 📈 Change: +9.45%
📈 4. GNS (Gains Network) 💰 Price: 0.345 📈 Change: +8.49%
🍌 5. BANANAS31 (Banana For Scale) 💰 Price: 0.004577 📈 Change: +7.06%
🏆 GLMR currently leads this list with the highest displayed gain of 32.54%, followed by INIT at 22.21%.
👀 Which of these five coins are you watching?
🔔 FOLLOW for more crypto price updates, market snapshots, and trending coin discussions!
Let's learn, share, and grow together! 🌍🚀
⚠️ Figures reflect the attached snapshot and may change with the market. This is not financial advice.
#Crypto #CryptoMarket #Altcoins #GLMR #Initia #MEGA #GNS #BANANAS31 #CryptoWatchlist
Here’s a closer look at five cryptocurrencies showing positive percentage changes in the displayed snapshot:
🌙 1. GLMR (Moonbeam) 💰 Price: 0.007523 📈 Change: +32.54%
⚡ 2. INIT (Initia) 💰 Price: 0.12016 📈 Change: +22.21%
💎 3. MEGA (MEGA) 💰 Price: 0.04968 📈 Change: +9.45%
📈 4. GNS (Gains Network) 💰 Price: 0.345 📈 Change: +8.49%
🍌 5. BANANAS31 (Banana For Scale) 💰 Price: 0.004577 📈 Change: +7.06%
🏆 GLMR currently leads this list with the highest displayed gain of 32.54%, followed by INIT at 22.21%.
👀 Which of these five coins are you watching?
🔔 FOLLOW for more crypto price updates, market snapshots, and trending coin discussions!
Let's learn, share, and grow together! 🌍🚀
⚠️ Figures reflect the attached snapshot and may change with the market. This is not financial advice.
#Crypto #CryptoMarket #Altcoins #GLMR #Initia #MEGA #GNS #BANANAS31 #CryptoWatchlist
2
755
·
--
උසබ තත්ත්වය
🚨🔥 FOUR ALTCOINS. FOUR GREEN EXPLOSIONS! 🟢🚀 WHO'S READY FOR THE NEXT LEG UP?
Look at these charts! 👀 Four different Altcoins projects, and all showing at these impressive 24-hour moves:
🌳 #FOREST : +40.58% — Leading the rally with powerful green momentum!
💧 #PIPE : +22.17% — Buyers stepping in and pushing higher!
🦅 #EGL1 : +16.84% — A powerful bounce from recent lows!
🧬 $DNA : +13.39% — Green candles showing renewed buying interest!
💚 Four projects, four impressive moves, and one powerful market story: BUYING PRESSURE!
⚠️ Green candles don't guarantee further gains. Always watch volume, resistance, and daily closes.
🏆 QUALITY CHARTS. MARKET INSIGHTS. REAL-TIME OBSERVATIONS.
My goal is to bring valuable market analysis and meaningful discoveries to the Binance community. Hoping to see this kind of research and contribution recognized by Binance! 💛
🐂 LET THE GREEN CANDLES DO THE TALKING!
👇 FOLLOW NOW & LET'S CATCH THE NEXT GREEN WAVE TOGETHER! 🐂🚀
Your support means a lot! ❤️
#Binance #BinanceSquare #Crypto #Altcoins #BullishMomentum #CryptoMarket 🚀
{alpha}(560x11cf6bf6d87cb0eb9c294fd6cbfec91ee3a1a7d0)
{alpha}(CT_5017s9MoSt7VV1J3jVNnw2AyocsQDBdCkPYz5apQDPKy9i5)
{alpha}(560xf4b385849f2e817e92bffbfb9aeb48f950ff4444)
🚨🔥 FOUR ALTCOINS. FOUR GREEN EXPLOSIONS! 🟢🚀 WHO'S READY FOR THE NEXT LEG UP?
Look at these charts! 👀 Four different Altcoins projects, and all showing at these impressive 24-hour moves:
🌳 #FOREST : +40.58% — Leading the rally with powerful green momentum!
💧 #PIPE : +22.17% — Buyers stepping in and pushing higher!
🦅 #EGL1 : +16.84% — A powerful bounce from recent lows!
🧬 $DNA : +13.39% — Green candles showing renewed buying interest!
💚 Four projects, four impressive moves, and one powerful market story: BUYING PRESSURE!
⚠️ Green candles don't guarantee further gains. Always watch volume, resistance, and daily closes.
🏆 QUALITY CHARTS. MARKET INSIGHTS. REAL-TIME OBSERVATIONS.
My goal is to bring valuable market analysis and meaningful discoveries to the Binance community. Hoping to see this kind of research and contribution recognized by Binance! 💛
🐂 LET THE GREEN CANDLES DO THE TALKING!
👇 FOLLOW NOW & LET'S CATCH THE NEXT GREEN WAVE TOGETHER! 🐂🚀
Your support means a lot! ❤️
#Binance #BinanceSquare #Crypto #Altcoins #BullishMomentum #CryptoMarket 🚀
Look at these charts! 👀 Four different Altcoins projects, and all showing at these impressive 24-hour moves:
🌳 #FOREST : +40.58% — Leading the rally with powerful green momentum!
💧 #PIPE : +22.17% — Buyers stepping in and pushing higher!
🦅 #EGL1 : +16.84% — A powerful bounce from recent lows!
🧬 $DNA : +13.39% — Green candles showing renewed buying interest!
💚 Four projects, four impressive moves, and one powerful market story: BUYING PRESSURE!
⚠️ Green candles don't guarantee further gains. Always watch volume, resistance, and daily closes.
🏆 QUALITY CHARTS. MARKET INSIGHTS. REAL-TIME OBSERVATIONS.
My goal is to bring valuable market analysis and meaningful discoveries to the Binance community. Hoping to see this kind of research and contribution recognized by Binance! 💛
🐂 LET THE GREEN CANDLES DO THE TALKING!
👇 FOLLOW NOW & LET'S CATCH THE NEXT GREEN WAVE TOGETHER! 🐂🚀
Your support means a lot! ❤️
#Binance #BinanceSquare #Crypto #Altcoins #BullishMomentum #CryptoMarket 🚀
🌳 FOREST — Green Monster 🐂
0%
💧 PIPE — Ready to Fly ⚡
20%
🦅 EGL1 — Bullish Power 🚀
0%
🧬 DNA — Explosive Potential🔥
80%
5 ඡන්ද • ඡන්දය අවසන්
1
903
·
--
උසබ තත්ත්වය
🚨 ALTCOINS ARE MAKING MOVES! WHO'S NEXT?
The perpetual market is heating up, and these four tokens are catching traders' attention.
🔥 DODOX — +15.35% 🔥 PIEVERSE — +8.87% 🔥 BLESS — +8.41% 🔥 DeAgentAI — +4.51%
DODOX is taking the lead, but PIEVERSE and BLESS aren't far behind in today's momentum watch.
Here's what matters now: Can these coins maintain their strength, or will the next move bring a reversal?
Don't chase green candles. Watch volume, track price action, and let the market confirm the trend.
ONE QUESTION: Which coin has the potential to surprise everyone next?
$DODOX | $PIEVERSE | $BLESS | $AI
#Crypto #Altcoins #CryptoTrading #Binance #MarketWatch
{future}(DODOXUSDT)
{alpha}(560x0e63b9c287e32a05e6b9ab8ee8df88a2760225a9)
{alpha}(560x7c8217517ed4711fe2deccdfeffe8d906b9ae11f)
🚨 ALTCOINS ARE MAKING MOVES! WHO'S NEXT?
The perpetual market is heating up, and these four tokens are catching traders' attention.
🔥 DODOX — +15.35% 🔥 PIEVERSE — +8.87% 🔥 BLESS — +8.41% 🔥 DeAgentAI — +4.51%
DODOX is taking the lead, but PIEVERSE and BLESS aren't far behind in today's momentum watch.
Here's what matters now: Can these coins maintain their strength, or will the next move bring a reversal?
Don't chase green candles. Watch volume, track price action, and let the market confirm the trend.
ONE QUESTION: Which coin has the potential to surprise everyone next?
$DODOX | $PIEVERSE | $BLESS | $AI
#Crypto #Altcoins #CryptoTrading #Binance #MarketWatch
The perpetual market is heating up, and these four tokens are catching traders' attention.
🔥 DODOX — +15.35% 🔥 PIEVERSE — +8.87% 🔥 BLESS — +8.41% 🔥 DeAgentAI — +4.51%
DODOX is taking the lead, but PIEVERSE and BLESS aren't far behind in today's momentum watch.
Here's what matters now: Can these coins maintain their strength, or will the next move bring a reversal?
Don't chase green candles. Watch volume, track price action, and let the market confirm the trend.
ONE QUESTION: Which coin has the potential to surprise everyone next?
$DODOX | $PIEVERSE | $BLESS | $AI
#Crypto #Altcoins #CryptoTrading #Binance #MarketWatch
DODOX: Bullish Momentum
16%
PIEVERSE: Strong Recovery
24%
BLESS: Buyers Dominating
52%
AI: Positive Momentum
8%
25 ඡන්ද • ඡන්දය අවසන්
1
1.9k
·
--
උසබ තත්ත්වය
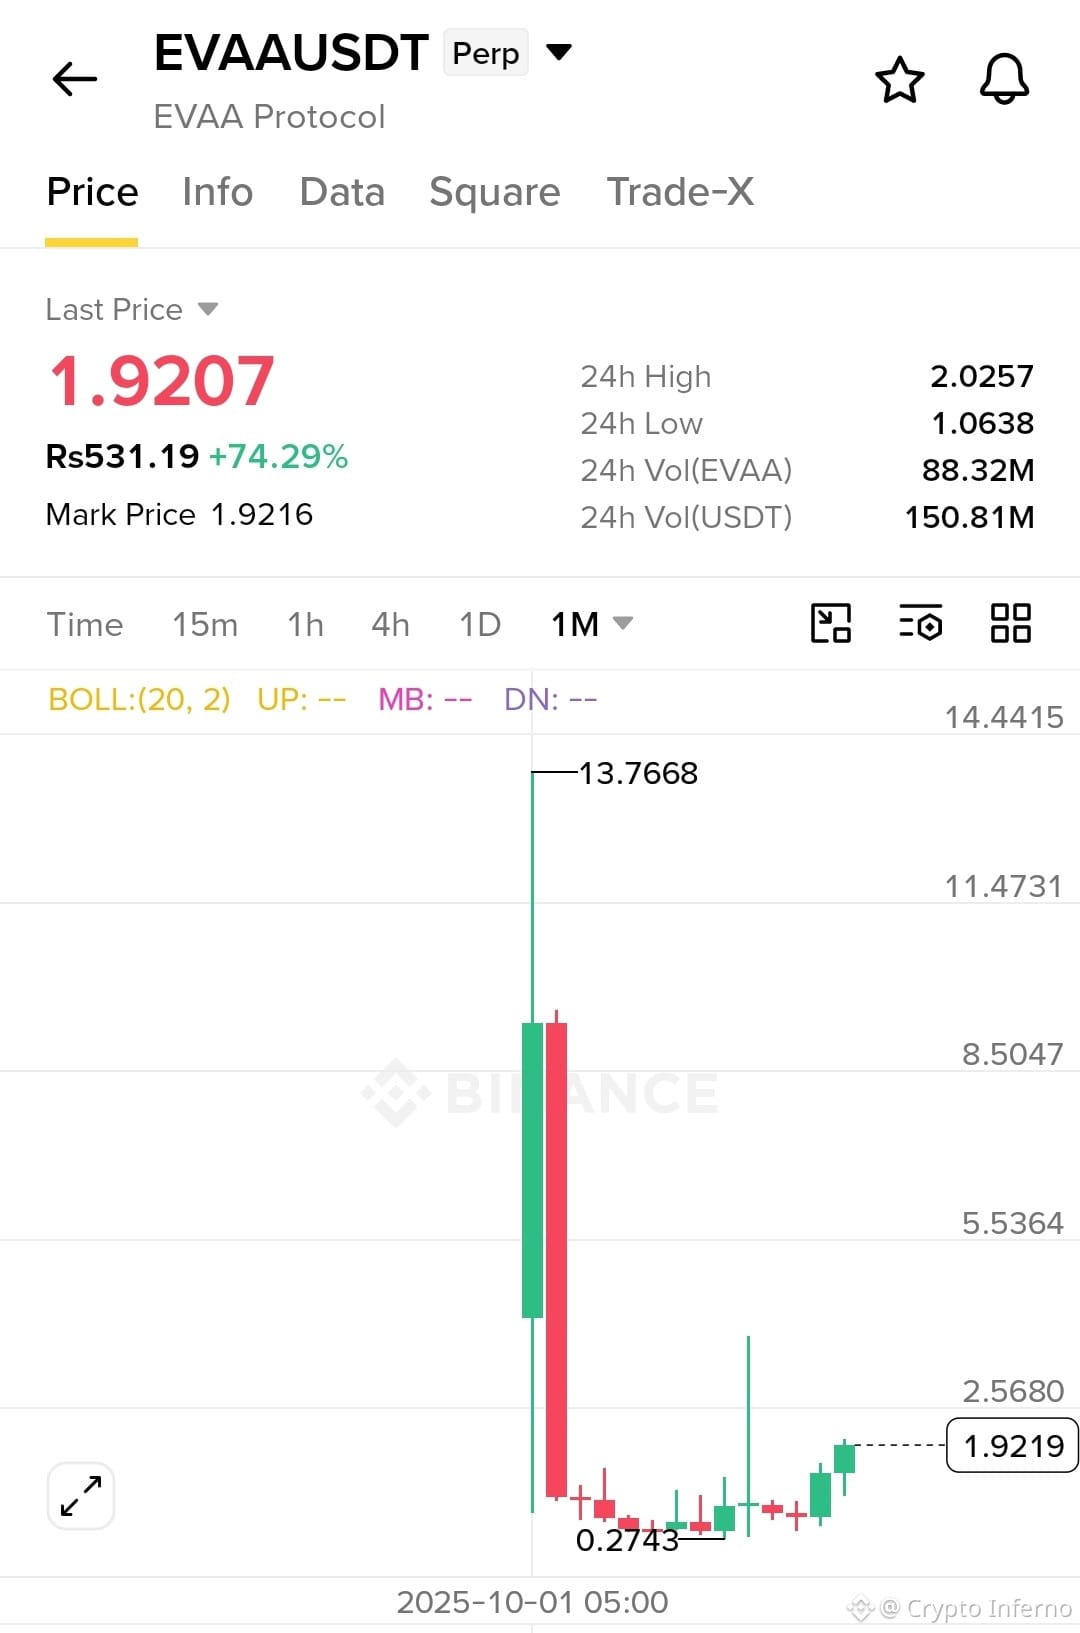
🚀 EVAA Protocol ($EVAA ) — A Potential Comeback Story?
The EVAAUSDT chart shows a dramatic price movement, with a displayed 24-hour change of +74.29% and price around 1.9207 USDT.
After a massive initial spike and a sharp correction, price action appears to be stabilizing, with buyers attempting to regain momentum.
🔥 What makes this chart interesting?
Significant volatility.
A major initial price expansion.
A period of consolidation.
Renewed upward momentum.
Could this be the beginning of another major move, or just a temporary bounce?
One thing is certain: this is the kind of chart that deserves attention.
#EVAA #Crypto #Altcoins #Binance #CryptoTrading #MarketWatch
{alpha}(560xaa036928c9c0df07d525b55ea8ee690bb5a628c1)
🚀 EVAA Protocol ($EVAA ) — A Potential Comeback Story?
The EVAAUSDT chart shows a dramatic price movement, with a displayed 24-hour change of +74.29% and price around 1.9207 USDT.
After a massive initial spike and a sharp correction, price action appears to be stabilizing, with buyers attempting to regain momentum.
🔥 What makes this chart interesting?
Significant volatility.
A major initial price expansion.
A period of consolidation.
Renewed upward momentum.
Could this be the beginning of another major move, or just a temporary bounce?
One thing is certain: this is the kind of chart that deserves attention.
#EVAA #Crypto #Altcoins #Binance #CryptoTrading #MarketWatch
The EVAAUSDT chart shows a dramatic price movement, with a displayed 24-hour change of +74.29% and price around 1.9207 USDT.
After a massive initial spike and a sharp correction, price action appears to be stabilizing, with buyers attempting to regain momentum.
🔥 What makes this chart interesting?
Significant volatility.
A major initial price expansion.
A period of consolidation.
Renewed upward momentum.
Could this be the beginning of another major move, or just a temporary bounce?
One thing is certain: this is the kind of chart that deserves attention.
#EVAA #Crypto #Altcoins #Binance #CryptoTrading #MarketWatch
1
603
·
--
උසබ තත්ත්වය
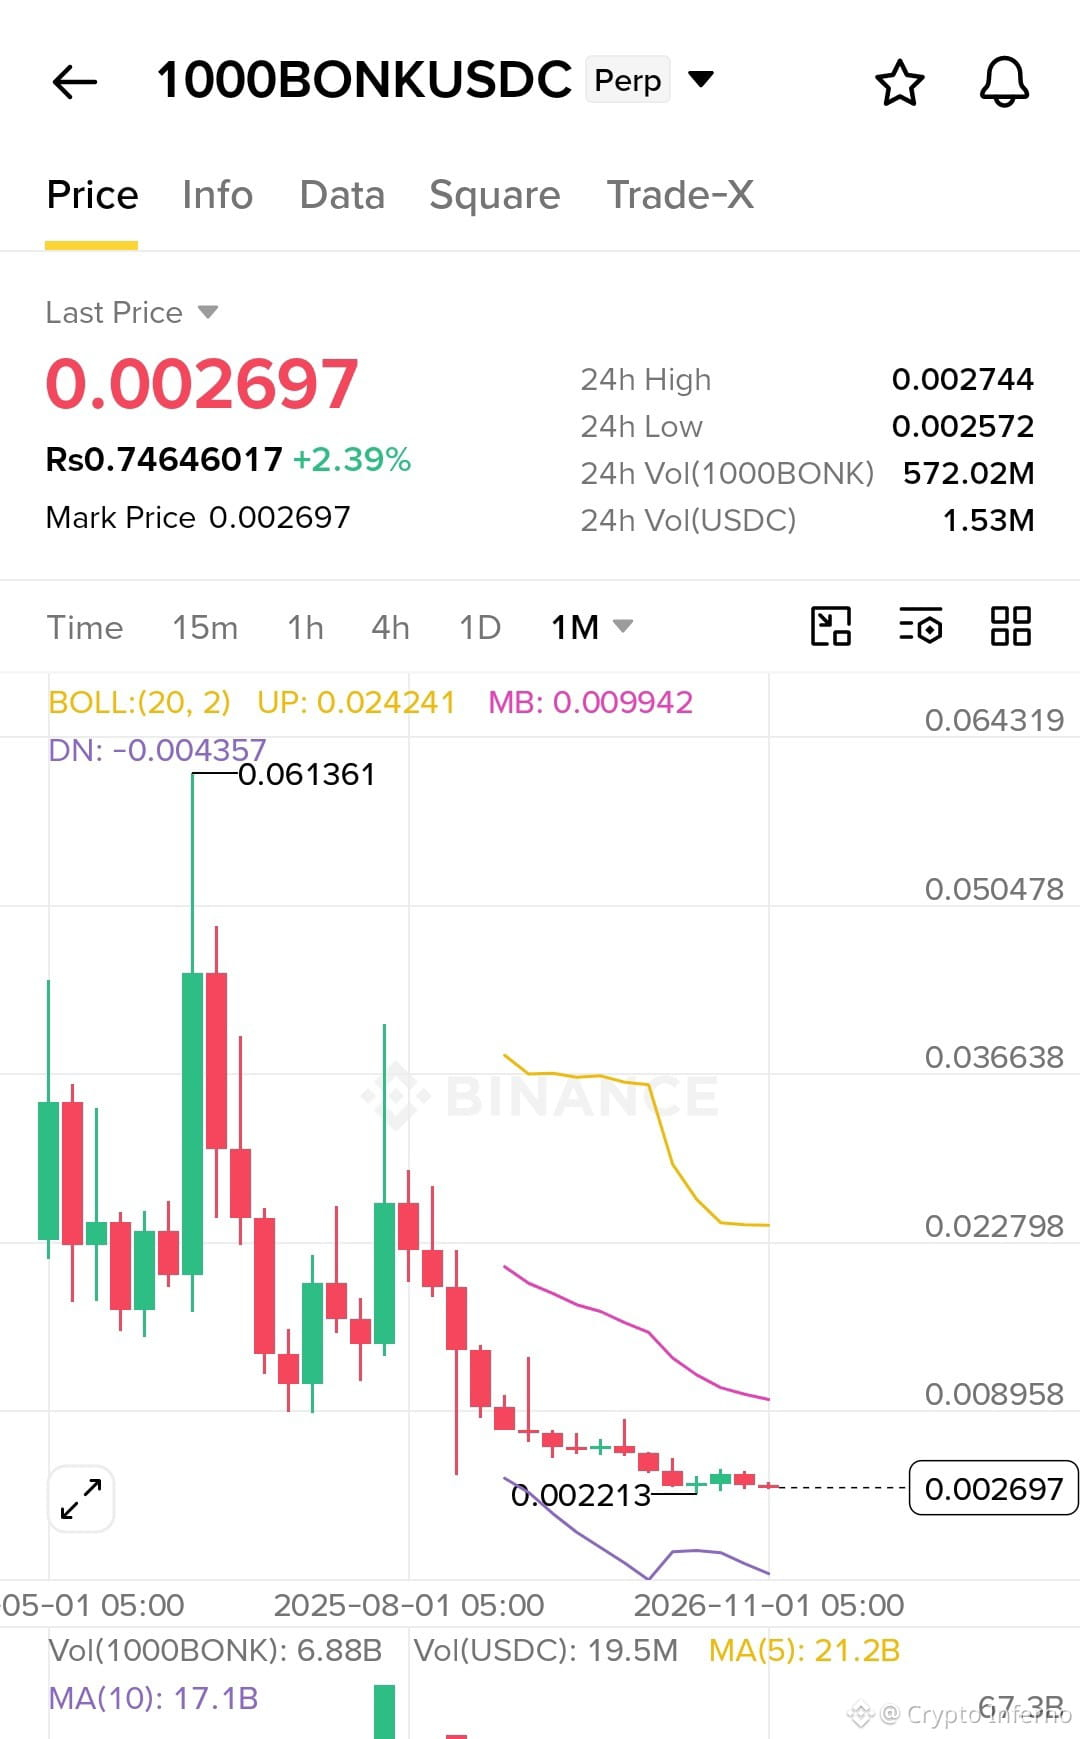
🚨 1000BONK – A Massive Comeback Opportunity or a Risky Bottom?
$1000BONK/USDC is currently trading around $0.002697, showing a 2.39% gain in the last 24 hours.
📊 What the chart tells us:
Price is attempting to stabilize after a prolonged downtrend.
A strong historical decline has pushed the price significantly lower.
Recent candles suggest consolidation around the $0.0025–$0.0027 zone.
The Bollinger Bands indicate that volatility and price compression deserve close attention.
🎯 Key levels to watch:
Support: $0.00257
Immediate resistance: $0.00274
A breakout above resistance could attract fresh buying interest.
Losing support could bring further downside pressure.
🔥 My take: After such a significant correction, 1000BONK is approaching an interesting zone to watch. However, a confirmed trend reversal is still needed before calling it a bullish comeback.
Patience is key. Watch volume, market structure, and confirmation before making a move.
💬 What do you think? Is $1000BONK preparing for a strong recovery, or is another dip coming?
#1000BONK #BONK #Crypto #Binance #Altcoins #CryptoTrading #TechnicalAnalysis #USDC
🚨 1000BONK – A Massive Comeback Opportunity or a Risky Bottom?
$1000BONK/USDC is currently trading around $0.002697, showing a 2.39% gain in the last 24 hours.
📊 What the chart tells us:
Price is attempting to stabilize after a prolonged downtrend.
A strong historical decline has pushed the price significantly lower.
Recent candles suggest consolidation around the $0.0025–$0.0027 zone.
The Bollinger Bands indicate that volatility and price compression deserve close attention.
🎯 Key levels to watch:
Support: $0.00257
Immediate resistance: $0.00274
A breakout above resistance could attract fresh buying interest.
Losing support could bring further downside pressure.
🔥 My take: After such a significant correction, 1000BONK is approaching an interesting zone to watch. However, a confirmed trend reversal is still needed before calling it a bullish comeback.
Patience is key. Watch volume, market structure, and confirmation before making a move.
💬 What do you think? Is $1000BONK preparing for a strong recovery, or is another dip coming?
#1000BONK #BONK #Crypto #Binance #Altcoins #CryptoTrading #TechnicalAnalysis #USDC
$1000BONK/USDC is currently trading around $0.002697, showing a 2.39% gain in the last 24 hours.
📊 What the chart tells us:
Price is attempting to stabilize after a prolonged downtrend.
A strong historical decline has pushed the price significantly lower.
Recent candles suggest consolidation around the $0.0025–$0.0027 zone.
The Bollinger Bands indicate that volatility and price compression deserve close attention.
🎯 Key levels to watch:
Support: $0.00257
Immediate resistance: $0.00274
A breakout above resistance could attract fresh buying interest.
Losing support could bring further downside pressure.
🔥 My take: After such a significant correction, 1000BONK is approaching an interesting zone to watch. However, a confirmed trend reversal is still needed before calling it a bullish comeback.
Patience is key. Watch volume, market structure, and confirmation before making a move.
💬 What do you think? Is $1000BONK preparing for a strong recovery, or is another dip coming?
#1000BONK #BONK #Crypto #Binance #Altcoins #CryptoTrading #TechnicalAnalysis #USDC
1
336
·
--
උසබ තත්ත්වය
🚀 4 ALTCOINS, BIG MOVES! WHAT'S YOUR NEXT PICK? HOW TO GROW FROM 370 to 1,000 FOLLOWERS 📈🔥
The crypto market is giving us some interesting movements! 👀
Look at these Binance charts:
🟢 ARIA — +24.36% 🔥 SOPH — +47.04% 🚀 BARD — +80.69% ⚡ AKE — +288.55%
Some impressive price action, but remember: big pumps also come with big risks. Always DYOR and manage your risk!
💬 Now I need your opinion, Binancians!
Which coin has the strongest potential?
Which one would you watch for the next move?
Are you buying, holding, or waiting for a correction?
🎯 My next goal is to grow this community from 370 followers to 1,000!
If you enjoy crypto discussions, market analysis, and sharing ideas, let's connect!
🤝 Follow me, drop your thoughts in the comments, and I'll support fellow genuine Binancians too!
Let's grow together, learn together, and win together! ❤️
#Binance #BinanceSquare #Crypto #Altcoins #Trading #ARIA #SOPH #BARD #AKE #CryptoCommunity
{alpha}(560x2c3a8ee94ddd97244a93bc48298f97d2c412f7db)
{future}(BARDUSDT)
{spot}(SOPHUSDT)
🚀 4 ALTCOINS, BIG MOVES! WHAT'S YOUR NEXT PICK? HOW TO GROW FROM 370 to 1,000 FOLLOWERS 📈🔥
The crypto market is giving us some interesting movements! 👀
Look at these Binance charts:
🟢 ARIA — +24.36% 🔥 SOPH — +47.04% 🚀 BARD — +80.69% ⚡ AKE — +288.55%
Some impressive price action, but remember: big pumps also come with big risks. Always DYOR and manage your risk!
💬 Now I need your opinion, Binancians!
Which coin has the strongest potential?
Which one would you watch for the next move?
Are you buying, holding, or waiting for a correction?
🎯 My next goal is to grow this community from 370 followers to 1,000!
If you enjoy crypto discussions, market analysis, and sharing ideas, let's connect!
🤝 Follow me, drop your thoughts in the comments, and I'll support fellow genuine Binancians too!
Let's grow together, learn together, and win together! ❤️
#Binance #BinanceSquare #Crypto #Altcoins #Trading #ARIA #SOPH #BARD #AKE #CryptoCommunity
The crypto market is giving us some interesting movements! 👀
Look at these Binance charts:
🟢 ARIA — +24.36% 🔥 SOPH — +47.04% 🚀 BARD — +80.69% ⚡ AKE — +288.55%
Some impressive price action, but remember: big pumps also come with big risks. Always DYOR and manage your risk!
💬 Now I need your opinion, Binancians!
Which coin has the strongest potential?
Which one would you watch for the next move?
Are you buying, holding, or waiting for a correction?
🎯 My next goal is to grow this community from 370 followers to 1,000!
If you enjoy crypto discussions, market analysis, and sharing ideas, let's connect!
🤝 Follow me, drop your thoughts in the comments, and I'll support fellow genuine Binancians too!
Let's grow together, learn together, and win together! ❤️
#Binance #BinanceSquare #Crypto #Altcoins #Trading #ARIA #SOPH #BARD #AKE #CryptoCommunity
AKE
76%
BARD
10%
SOPH
6%
ARIA
8%
62 ඡන්ද • ඡන්දය අවසන්
1
1.5k
·
--
උසබ තත්ත්වය
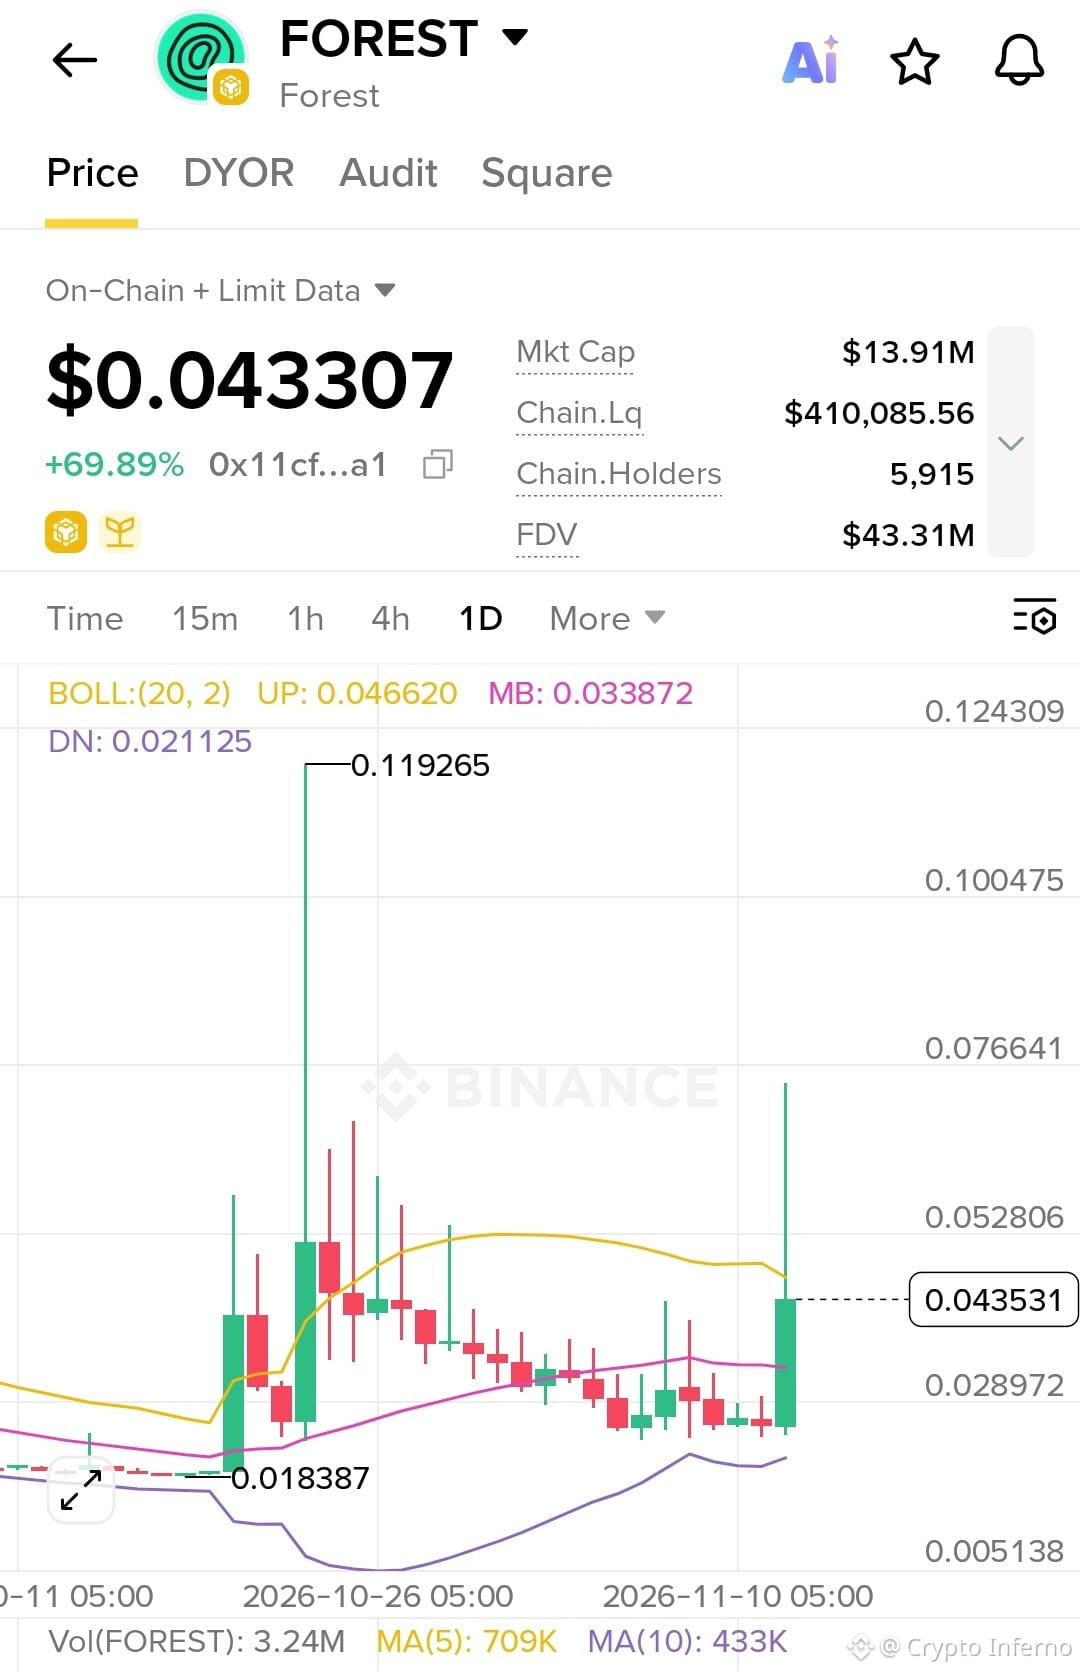
🌳 FOREST ($FOREST ) IS SHOWING SIGNS OF LIFE! 🚀💚
After a period of consolidation, FOREST is finally printing some beautiful green candles! 📈🔥
The latest daily candle is showing a potential bullish bounce, bringing fresh momentum and renewed attention to the chart. 👀
💚 Buyers are stepping back in. 📊 Bullish momentum may be building. 🚀 A potential recovery could be taking shape.
The key now is whether bulls can maintain this momentum and push toward the upper Bollinger Band.
Is this the beginning of the next big move? 👀
🌱 Stay alert. Watch the confirmation. Let the chart speak!
#FOREST #Crypto #Altcoins #BullishReversal #CryptoTrading #Binance #GreenCandles 🚀💚
{alpha}(560x11cf6bf6d87cb0eb9c294fd6cbfec91ee3a1a7d0)
🌳 FOREST ($FOREST ) IS SHOWING SIGNS OF LIFE! 🚀💚
After a period of consolidation, FOREST is finally printing some beautiful green candles! 📈🔥
The latest daily candle is showing a potential bullish bounce, bringing fresh momentum and renewed attention to the chart. 👀
💚 Buyers are stepping back in. 📊 Bullish momentum may be building. 🚀 A potential recovery could be taking shape.
The key now is whether bulls can maintain this momentum and push toward the upper Bollinger Band.
Is this the beginning of the next big move? 👀
🌱 Stay alert. Watch the confirmation. Let the chart speak!
#FOREST #Crypto #Altcoins #BullishReversal #CryptoTrading #Binance #GreenCandles 🚀💚
After a period of consolidation, FOREST is finally printing some beautiful green candles! 📈🔥
The latest daily candle is showing a potential bullish bounce, bringing fresh momentum and renewed attention to the chart. 👀
💚 Buyers are stepping back in. 📊 Bullish momentum may be building. 🚀 A potential recovery could be taking shape.
The key now is whether bulls can maintain this momentum and push toward the upper Bollinger Band.
Is this the beginning of the next big move? 👀
🌱 Stay alert. Watch the confirmation. Let the chart speak!
#FOREST #Crypto #Altcoins #BullishReversal #CryptoTrading #Binance #GreenCandles 🚀💚
214
තවත් අන්තර්ගතයන් ගවේෂණය කිරීමට ඇතුල් වන්න
Binance චතුරශ්රය හි ගෝලීය ක්රිප්ටෝ පරිශීලකයින් හා එක්වන්න
⚡️ ක්රිප්ටෝ පිළිබඳ නවතම සහ ප්රයෝජනවත් තොරතුරු ලබා ගන්න.
💬 ලොව විශාලතම ක්රිප්ටෝ හුවමාරුව මගින් විශ්වාස කෙරේ.
👍 සත්යායනය කරන ලද නිර්මාණකරුවන්ගෙන් සැබෑ විදසුන් සොයා ගන්න.
විද්යුත් තැපෑල / දුරකථන අංකය
නැගී එන මාතෘකා
IsAnthropic’s$1.5TMarketCapJustified?
62,775 නැරඹීම්
308 සාකච්ඡා කරමින්
Anthropic Set to Open at $105 in Record Nasdaq Debut
Binance News
·16 කැමත්ත දැක්වීම්
·18.7k නැරඹීම්
BTCBelow$62KAmidHikeFearsAndShiftToAnthropic
20,381 නැරඹීම්
112 සාකච්ඡා කරමින්
NvidiaBoardReportedlySplitOverHuang’sReturn
258,674 නැරඹීම්
2,025 සාකච්ඡා කරමින්