
AQA992
819 පෝස්ටු

AQA992
වාර්තා කරන්න
පරිශීලක අවහිර කරන්න
Crypto Analyst | Market Insights | Technical Analysis | Binance Square Creator 📈
විවෘත වෙළෙඳාම
ඉඳහිට වෙළෙන්දා
{වේලාව} වසර
18 හඹා යමින්
30 හඹා යන්නන්
129 කැමති විය
පෝස්ටු
ආයෝජන කළඹ
·
--
බෙයාරිෂ්
$XRP
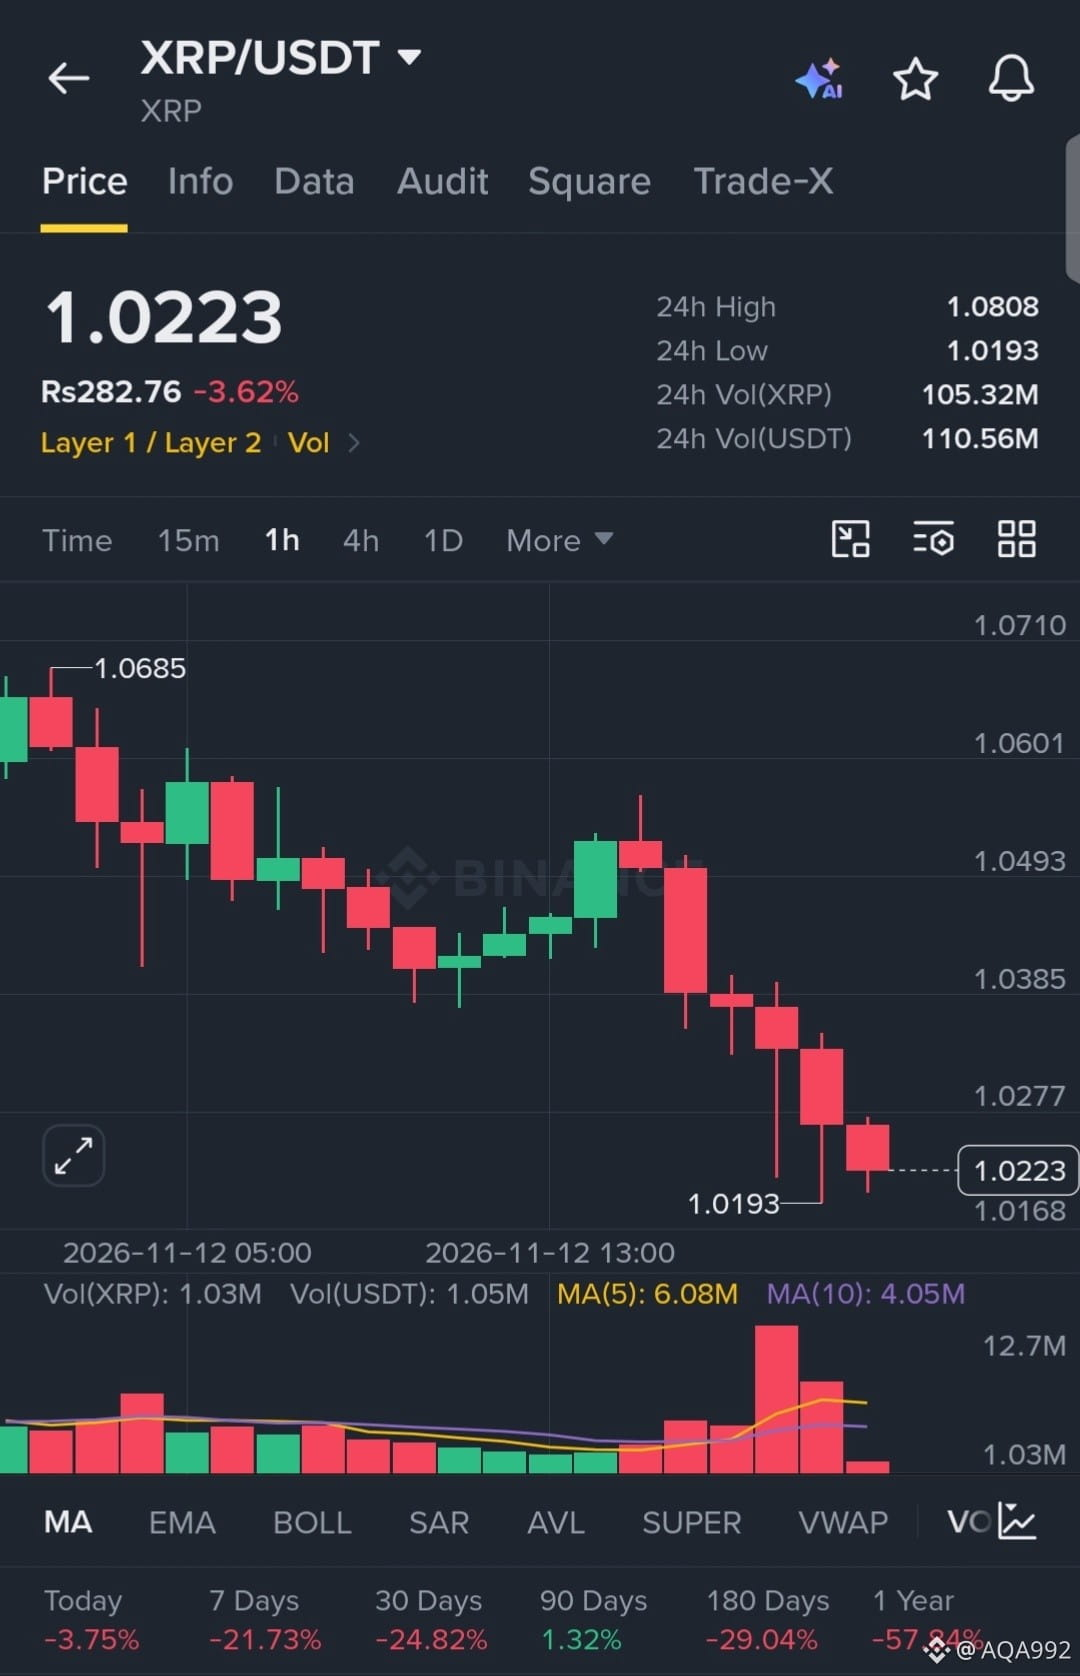
is in a severe downtrend, aggressively slicing through support levels with heavy, relentless sell volume. The 1H chart shows absolute seller dominance with zero signs of buyer absorption at the lows, indicating intense bearish momentum for a clean continuation short.
EP: 1.0223
TP: 1.0100, 0.9950, 0.9800
SL: 1.0450
$XRP
#HuangExitNvidiaStrategyInFocus
#AnthropicRejectsIPODelayValuationinQuestion
#CoreWeaveJumps10%On168%RevenueGrowth
#MSCIRemovalMayCurbStrategy’sBitcoinBuying
#USJoblessClaimsRise
{future}(XRPUSDT)
$XRP
is in a severe downtrend, aggressively slicing through support levels with heavy, relentless sell volume. The 1H chart shows absolute seller dominance with zero signs of buyer absorption at the lows, indicating intense bearish momentum for a clean continuation short.
EP: 1.0223
TP: 1.0100, 0.9950, 0.9800
SL: 1.0450
$XRP
#HuangExitNvidiaStrategyInFocus
#AnthropicRejectsIPODelayValuationinQuestion
#CoreWeaveJumps10%On168%RevenueGrowth
#MSCIRemovalMayCurbStrategy’sBitcoinBuying
#USJoblessClaimsRise
is in a severe downtrend, aggressively slicing through support levels with heavy, relentless sell volume. The 1H chart shows absolute seller dominance with zero signs of buyer absorption at the lows, indicating intense bearish momentum for a clean continuation short.
EP: 1.0223
TP: 1.0100, 0.9950, 0.9800
SL: 1.0450
$XRP
#HuangExitNvidiaStrategyInFocus
#AnthropicRejectsIPODelayValuationinQuestion
#CoreWeaveJumps10%On168%RevenueGrowth
#MSCIRemovalMayCurbStrategy’sBitcoinBuying
#USJoblessClaimsRise
8
·
--
බෙයාරිෂ්
දින 30 වෙළෙඳ $SOL 8.7 USDT
$SOL
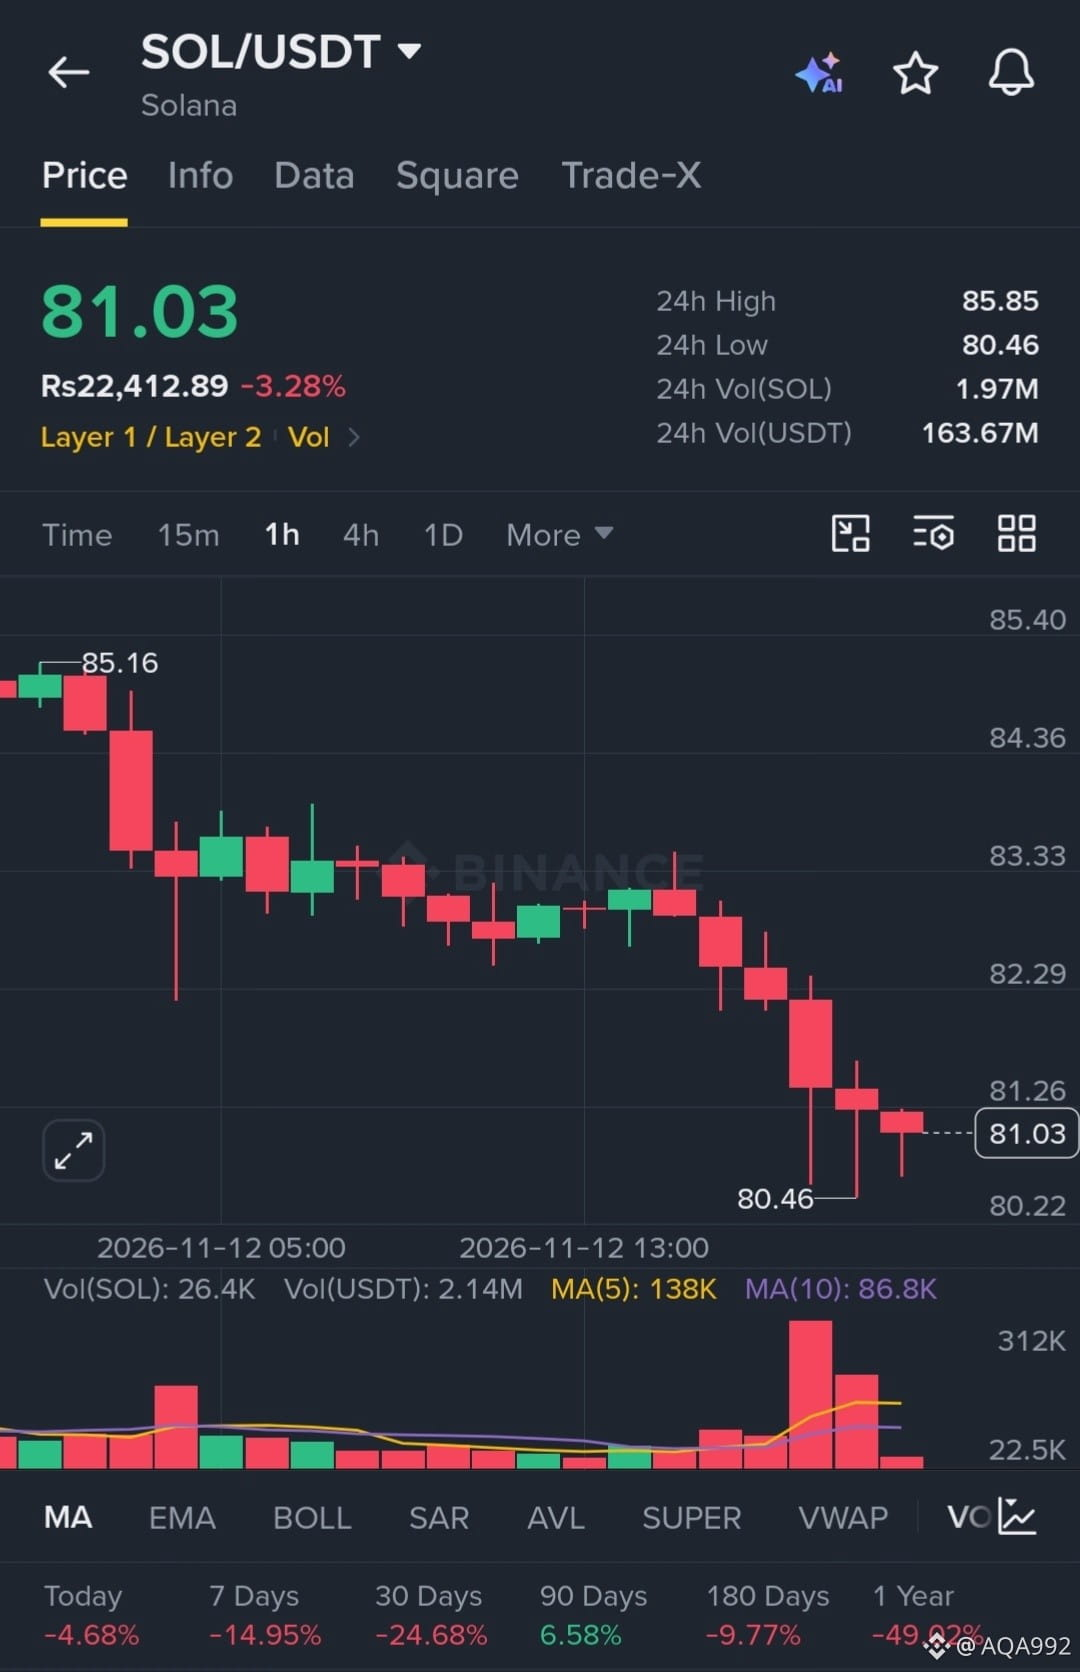
is in a heavy downtrend, aggressively printing lower highs and slicing through support levels with expanding sell volume. The 1H chart shows absolute seller control with no signs of buyer absorption at the lows, signaling intense bearish momentum for a continuation short.
EP: 81.03
TP: 79.00, 77.50, 75.00
SL: 83.50
$SOL
#HuangExitNvidiaStrategyInFocus
#AnthropicRejectsIPODelayValuationinQuestion
#CoreWeaveJumps10%On168%RevenueGrowth
#MSCIRemovalMayCurbStrategy’sBitcoinBuying
#TradFiForBeginners
{future}(SOLUSDT)
$SOL
is in a heavy downtrend, aggressively printing lower highs and slicing through support levels with expanding sell volume. The 1H chart shows absolute seller control with no signs of buyer absorption at the lows, signaling intense bearish momentum for a continuation short.
EP: 81.03
TP: 79.00, 77.50, 75.00
SL: 83.50
$SOL
#HuangExitNvidiaStrategyInFocus
#AnthropicRejectsIPODelayValuationinQuestion
#CoreWeaveJumps10%On168%RevenueGrowth
#MSCIRemovalMayCurbStrategy’sBitcoinBuying
#TradFiForBeginners
is in a heavy downtrend, aggressively printing lower highs and slicing through support levels with expanding sell volume. The 1H chart shows absolute seller control with no signs of buyer absorption at the lows, signaling intense bearish momentum for a continuation short.
EP: 81.03
TP: 79.00, 77.50, 75.00
SL: 83.50
$SOL
#HuangExitNvidiaStrategyInFocus
#AnthropicRejectsIPODelayValuationinQuestion
#CoreWeaveJumps10%On168%RevenueGrowth
#MSCIRemovalMayCurbStrategy’sBitcoinBuying
#TradFiForBeginners
8
·
--
බෙයාරිෂ්
$PEPE
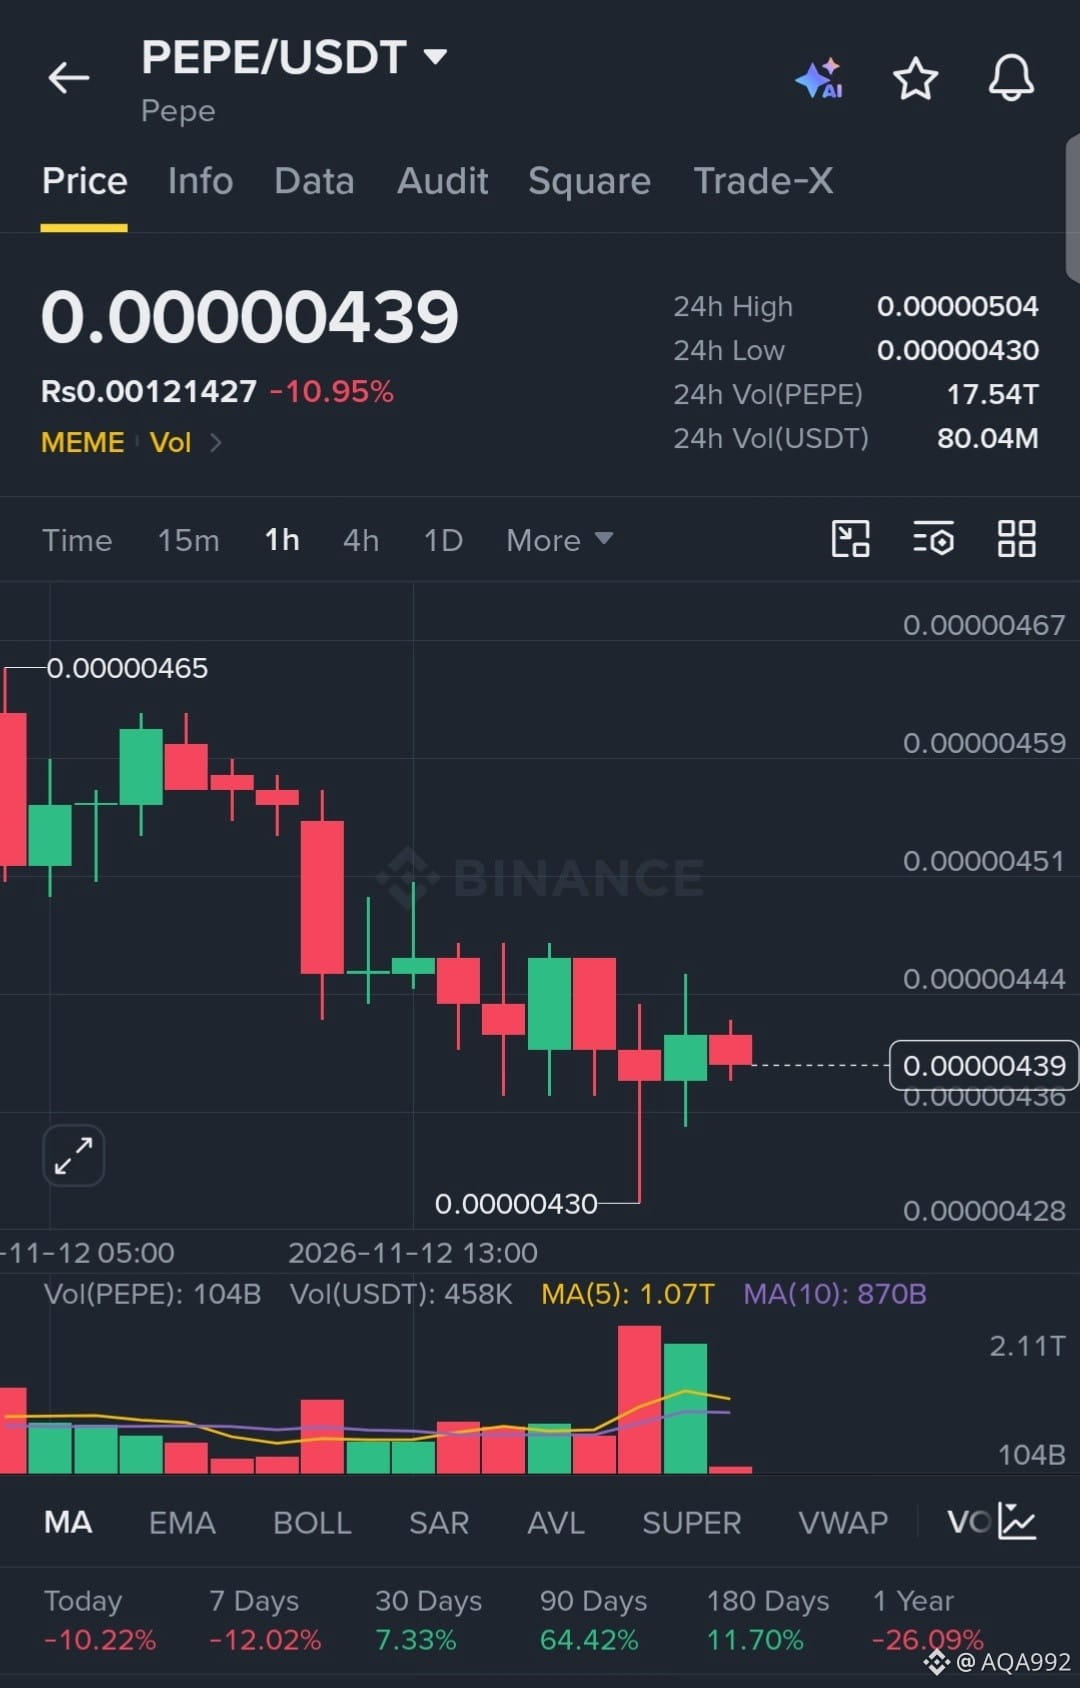
is bleeding aggressively, printing relentless lower highs as sellers smash through support. The 1H chart shows heavy distribution with zero buyer absorption, indicating intense bearish momentum driving a clean continuation short.
EP: 0.00000439
TP: 0.00000428, 0.00000415, 0.00000400
SL: 0.00000455
$PEPE
#HuangExitNvidiaStrategyInFocus
#AnthropicRejectsIPODelayValuationinQuestion
#CoreWeaveJumps10%On168%RevenueGrowth
#MSCIRemovalMayCurbStrategy’sBitcoinBuying
#TradFiForBeginners
{spot}(PEPEUSDT)
$PEPE
is bleeding aggressively, printing relentless lower highs as sellers smash through support. The 1H chart shows heavy distribution with zero buyer absorption, indicating intense bearish momentum driving a clean continuation short.
EP: 0.00000439
TP: 0.00000428, 0.00000415, 0.00000400
SL: 0.00000455
$PEPE
#HuangExitNvidiaStrategyInFocus
#AnthropicRejectsIPODelayValuationinQuestion
#CoreWeaveJumps10%On168%RevenueGrowth
#MSCIRemovalMayCurbStrategy’sBitcoinBuying
#TradFiForBeginners
is bleeding aggressively, printing relentless lower highs as sellers smash through support. The 1H chart shows heavy distribution with zero buyer absorption, indicating intense bearish momentum driving a clean continuation short.
EP: 0.00000439
TP: 0.00000428, 0.00000415, 0.00000400
SL: 0.00000455
$PEPE
#HuangExitNvidiaStrategyInFocus
#AnthropicRejectsIPODelayValuationinQuestion
#CoreWeaveJumps10%On168%RevenueGrowth
#MSCIRemovalMayCurbStrategy’sBitcoinBuying
#TradFiForBeginners
8
·
--
බෙයාරිෂ්
$MSFTB
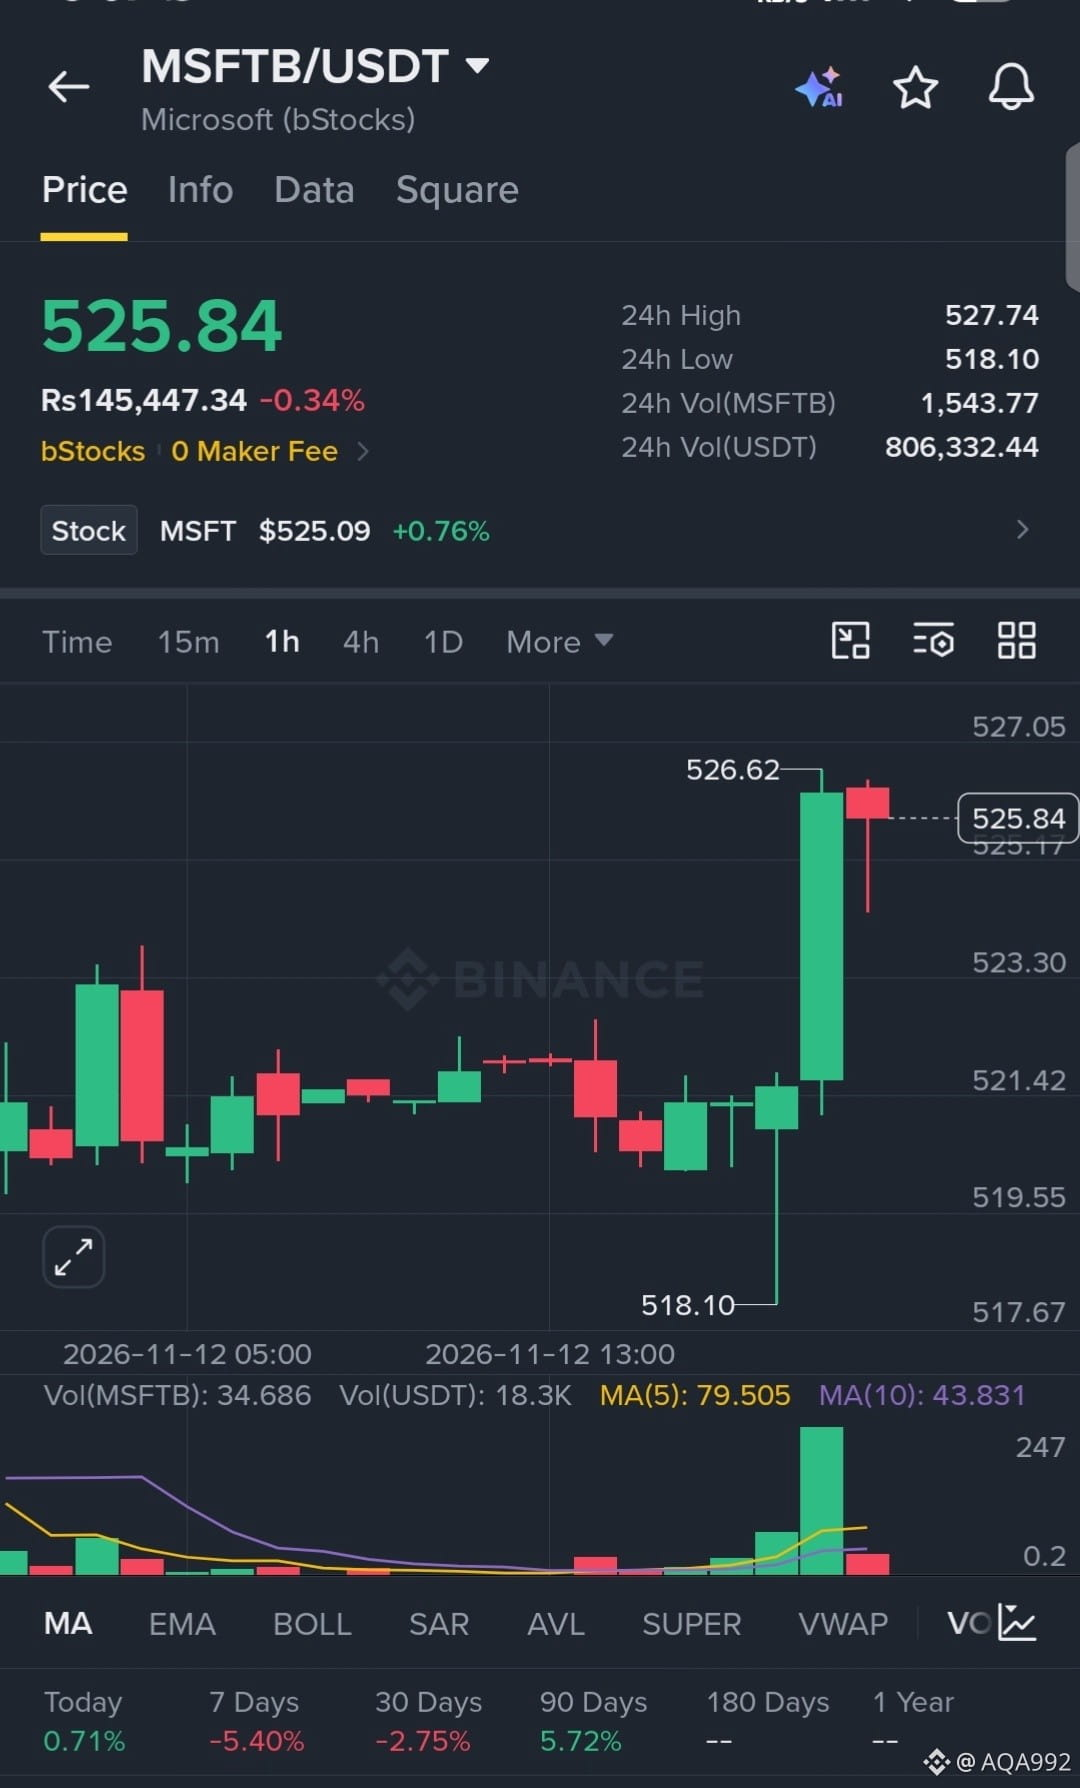
has aggressively swept downside liquidity, printing a sharp capitulation wick to 518.10 before staging a violent V-shaped reversal. The 1H chart shows a massive surge in buy volume reclaiming the local range, signaling heavy momentum for a swift continuation push toward the local high.
EP: 525.84
TP: 531.00, 538.50, 546.00
SL: 517.50
$MSFTB
#HuangExitNvidiaStrategyInFocus
#AnthropicRejectsIPODelayValuationinQuestion
#ChipStocksExtendLossesAfterNvidiaCEOChange
#MSCIRemovalMayCurbStrategy’sBitcoinBuying
#TradFiForBeginners
{spot}(MSFTBUSDT)
$MSFTB
has aggressively swept downside liquidity, printing a sharp capitulation wick to 518.10 before staging a violent V-shaped reversal. The 1H chart shows a massive surge in buy volume reclaiming the local range, signaling heavy momentum for a swift continuation push toward the local high.
EP: 525.84
TP: 531.00, 538.50, 546.00
SL: 517.50
$MSFTB
#HuangExitNvidiaStrategyInFocus
#AnthropicRejectsIPODelayValuationinQuestion
#ChipStocksExtendLossesAfterNvidiaCEOChange
#MSCIRemovalMayCurbStrategy’sBitcoinBuying
#TradFiForBeginners
has aggressively swept downside liquidity, printing a sharp capitulation wick to 518.10 before staging a violent V-shaped reversal. The 1H chart shows a massive surge in buy volume reclaiming the local range, signaling heavy momentum for a swift continuation push toward the local high.
EP: 525.84
TP: 531.00, 538.50, 546.00
SL: 517.50
$MSFTB
#HuangExitNvidiaStrategyInFocus
#AnthropicRejectsIPODelayValuationinQuestion
#ChipStocksExtendLossesAfterNvidiaCEOChange
#MSCIRemovalMayCurbStrategy’sBitcoinBuying
#TradFiForBeginners
5
·
--
උසබ තත්ත්වය
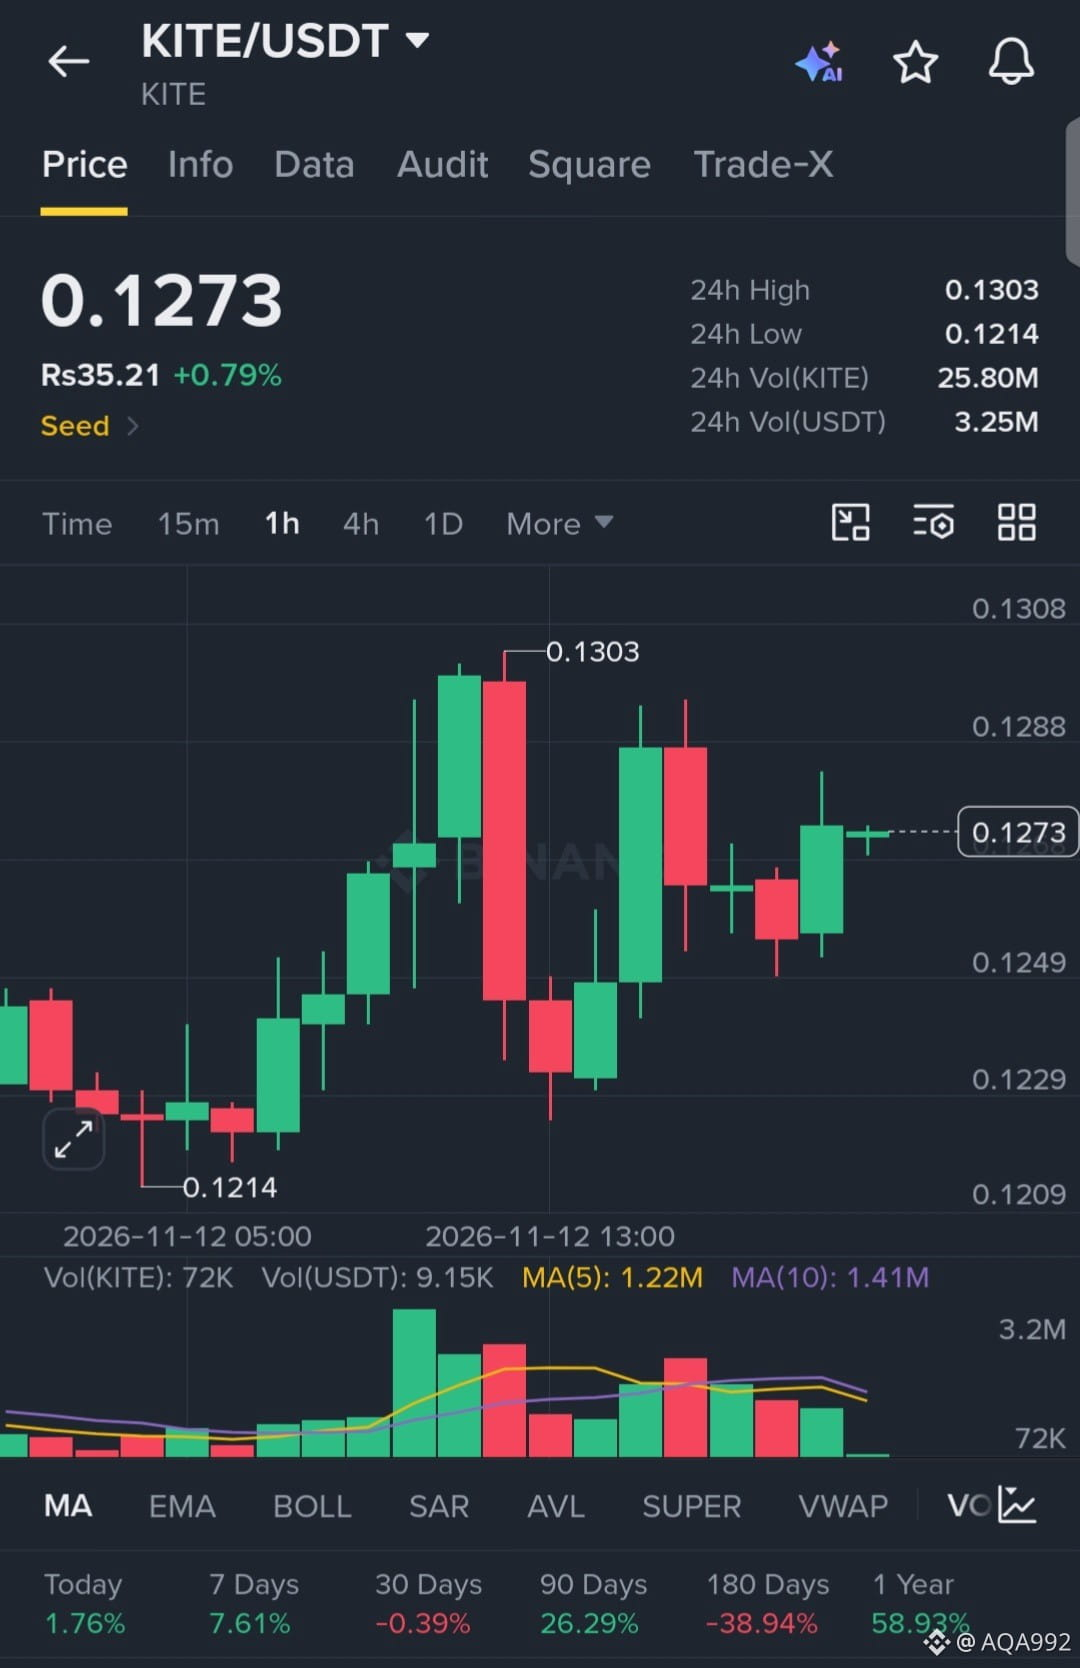
$KITE
is showing intense volatility and aggressive liquidity sweeps, violently rejecting the 0.1214 low to establish a higher-low structure. The 1H chart reveals heavy buyer absorption on dips with volume expanding, signaling coiled momentum ready to smash through local resistance.
EP: 0.1273
TP: 0.1305, 0.1340, 0.1390
SL: 0.1210
$KITE
#HuangExitNvidiaStrategyInFocus
#AnthropicRejectsIPODelayValuationinQuestion #ChipStocksExtendLossesAfterNvidiaCEOChange
#CoreWeaveJumps10%On168%RevenueGrowth
#TradFiForBeginners
{future}(KITEUSDT)
$KITE
is showing intense volatility and aggressive liquidity sweeps, violently rejecting the 0.1214 low to establish a higher-low structure. The 1H chart reveals heavy buyer absorption on dips with volume expanding, signaling coiled momentum ready to smash through local resistance.
EP: 0.1273
TP: 0.1305, 0.1340, 0.1390
SL: 0.1210
$KITE
#HuangExitNvidiaStrategyInFocus
#AnthropicRejectsIPODelayValuationinQuestion #ChipStocksExtendLossesAfterNvidiaCEOChange
#CoreWeaveJumps10%On168%RevenueGrowth
#TradFiForBeginners
is showing intense volatility and aggressive liquidity sweeps, violently rejecting the 0.1214 low to establish a higher-low structure. The 1H chart reveals heavy buyer absorption on dips with volume expanding, signaling coiled momentum ready to smash through local resistance.
EP: 0.1273
TP: 0.1305, 0.1340, 0.1390
SL: 0.1210
$KITE
#HuangExitNvidiaStrategyInFocus
#AnthropicRejectsIPODelayValuationinQuestion #ChipStocksExtendLossesAfterNvidiaCEOChange
#CoreWeaveJumps10%On168%RevenueGrowth
#TradFiForBeginners
3
·
--
බෙයාරිෂ්
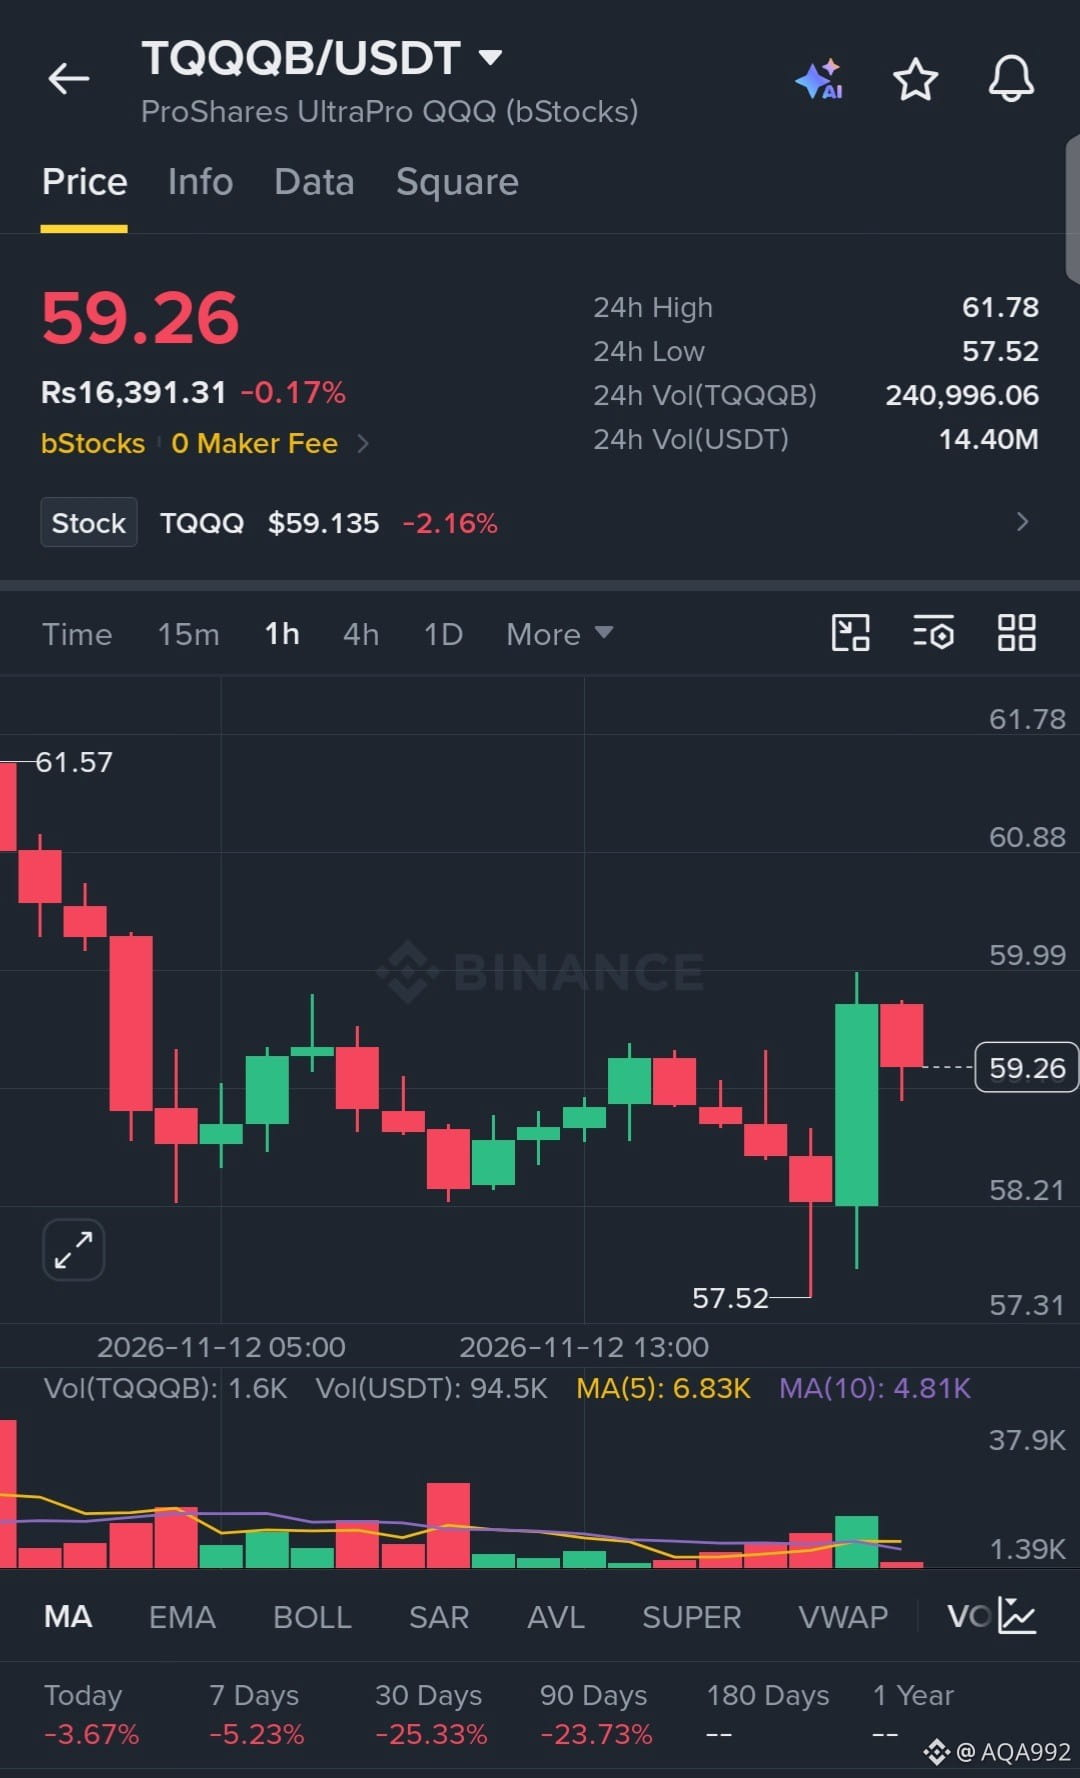
$TQQQB
has aggressively swept downside liquidity, printing a sharp capitulation wick to 57.52 before staging a violent V-shaped reversal. The 1H chart shows intense buyer absorption with volume expanding as the price reclaims the local range, signaling heavy momentum for a swift relief rally.
EP: 59.26
TP: 60.80, 61.80, 63.00
SL: 57.20
$TQQQB
#HuangExitNvidiaStrategyInFocus
#ChipStocksExtendLossesAfterNvidiaCEOChange
#AnthropicRejectsIPODelayValuationinQuestion
#CoreWeaveJumps10%On168%RevenueGrowth
#MSCIRemovalMayCurbStrategy’sBitcoinBuying
{spot}(TQQQBUSDT)
$TQQQB
has aggressively swept downside liquidity, printing a sharp capitulation wick to 57.52 before staging a violent V-shaped reversal. The 1H chart shows intense buyer absorption with volume expanding as the price reclaims the local range, signaling heavy momentum for a swift relief rally.
EP: 59.26
TP: 60.80, 61.80, 63.00
SL: 57.20
$TQQQB
#HuangExitNvidiaStrategyInFocus
#ChipStocksExtendLossesAfterNvidiaCEOChange
#AnthropicRejectsIPODelayValuationinQuestion
#CoreWeaveJumps10%On168%RevenueGrowth
#MSCIRemovalMayCurbStrategy’sBitcoinBuying
has aggressively swept downside liquidity, printing a sharp capitulation wick to 57.52 before staging a violent V-shaped reversal. The 1H chart shows intense buyer absorption with volume expanding as the price reclaims the local range, signaling heavy momentum for a swift relief rally.
EP: 59.26
TP: 60.80, 61.80, 63.00
SL: 57.20
$TQQQB
#HuangExitNvidiaStrategyInFocus
#ChipStocksExtendLossesAfterNvidiaCEOChange
#AnthropicRejectsIPODelayValuationinQuestion
#CoreWeaveJumps10%On168%RevenueGrowth
#MSCIRemovalMayCurbStrategy’sBitcoinBuying
2
·
--
බෙයාරිෂ්
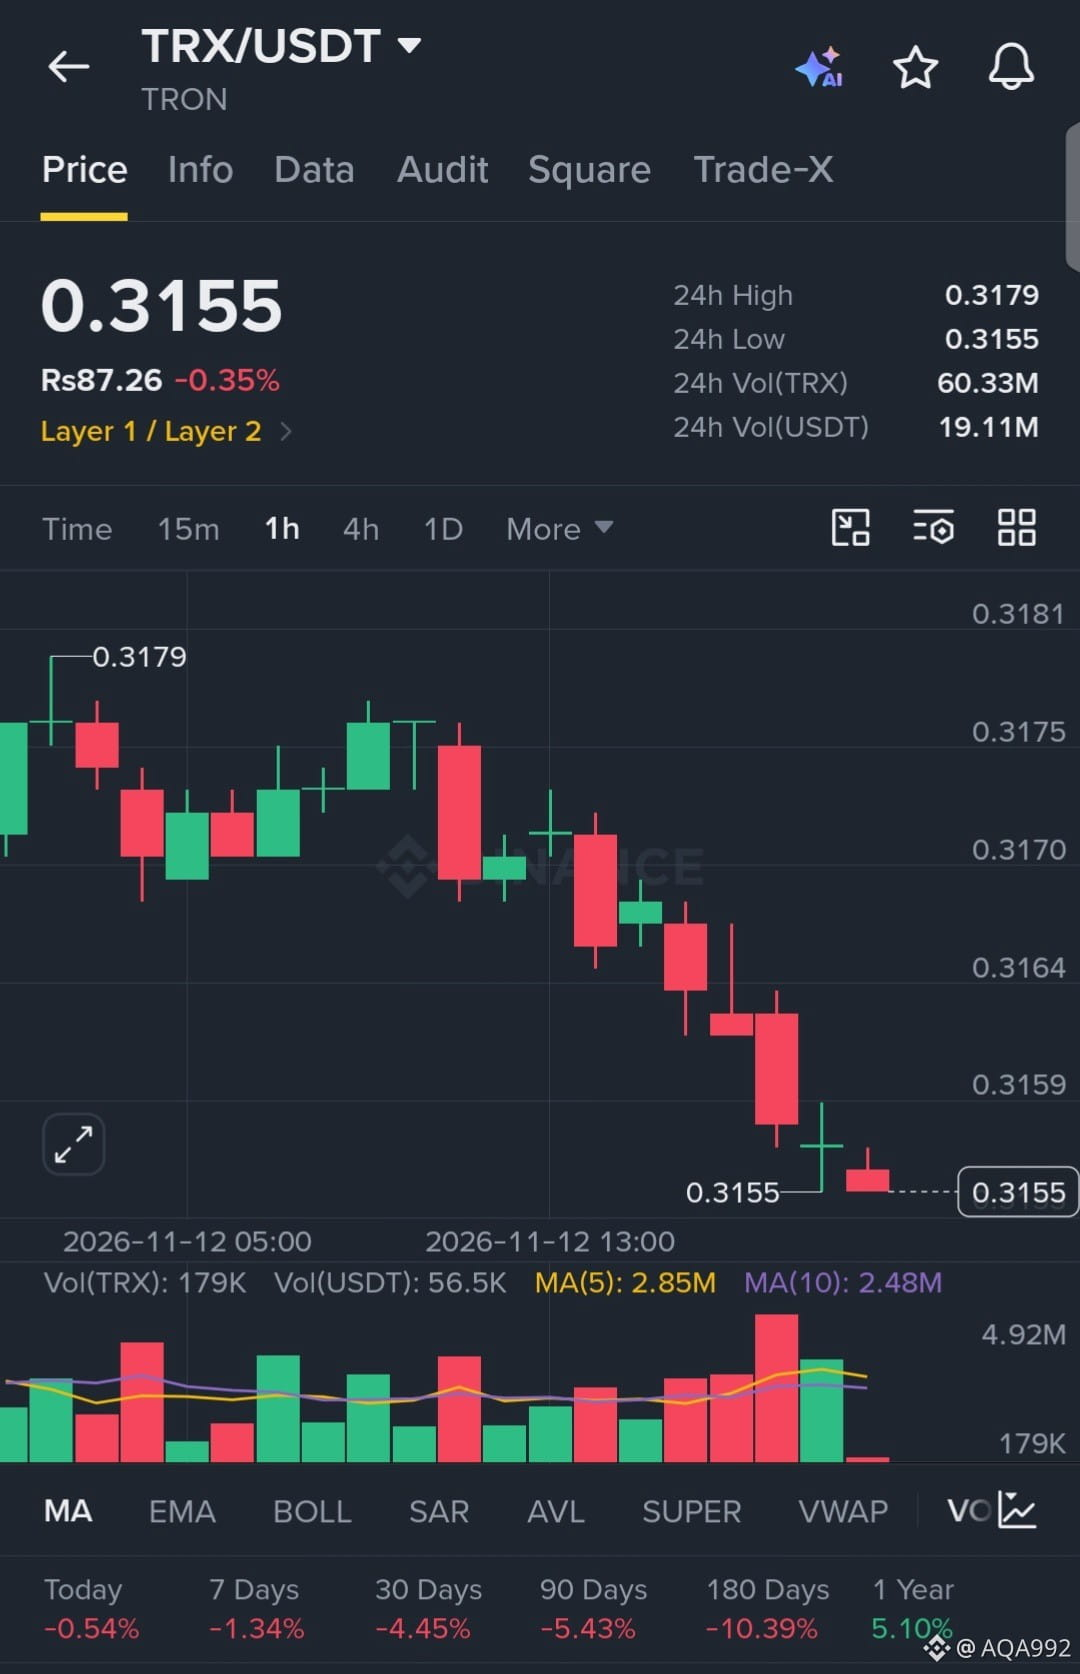
$TRX
is bleeding aggressively, printing relentless lower highs as sellers smash through local support. The 1H chart shows steady distribution with absolutely zero signs of buyer absorption, indicating heavy bearish momentum driving a clean continuation short.
EP: 0.3155
TP: 0.3130, 0.3105, 0.3080
SL: 0.3190
$TRX
#HuangExitNvidiaStrategyInFocus
#ChipStocksExtendLossesAfterNvidiaCEOChange
#AnthropicRejectsIPODelayValuationinQuestion
#MSCIRemovalMayCurbStrategy’sBitcoinBuying
#TradFiForBeginners
{future}(TRXUSDT)
$TRX
is bleeding aggressively, printing relentless lower highs as sellers smash through local support. The 1H chart shows steady distribution with absolutely zero signs of buyer absorption, indicating heavy bearish momentum driving a clean continuation short.
EP: 0.3155
TP: 0.3130, 0.3105, 0.3080
SL: 0.3190
$TRX
#HuangExitNvidiaStrategyInFocus
#ChipStocksExtendLossesAfterNvidiaCEOChange
#AnthropicRejectsIPODelayValuationinQuestion
#MSCIRemovalMayCurbStrategy’sBitcoinBuying
#TradFiForBeginners
is bleeding aggressively, printing relentless lower highs as sellers smash through local support. The 1H chart shows steady distribution with absolutely zero signs of buyer absorption, indicating heavy bearish momentum driving a clean continuation short.
EP: 0.3155
TP: 0.3130, 0.3105, 0.3080
SL: 0.3190
$TRX
#HuangExitNvidiaStrategyInFocus
#ChipStocksExtendLossesAfterNvidiaCEOChange
#AnthropicRejectsIPODelayValuationinQuestion
#MSCIRemovalMayCurbStrategy’sBitcoinBuying
#TradFiForBeginners
6
·
--
උසබ තත්ත්වය
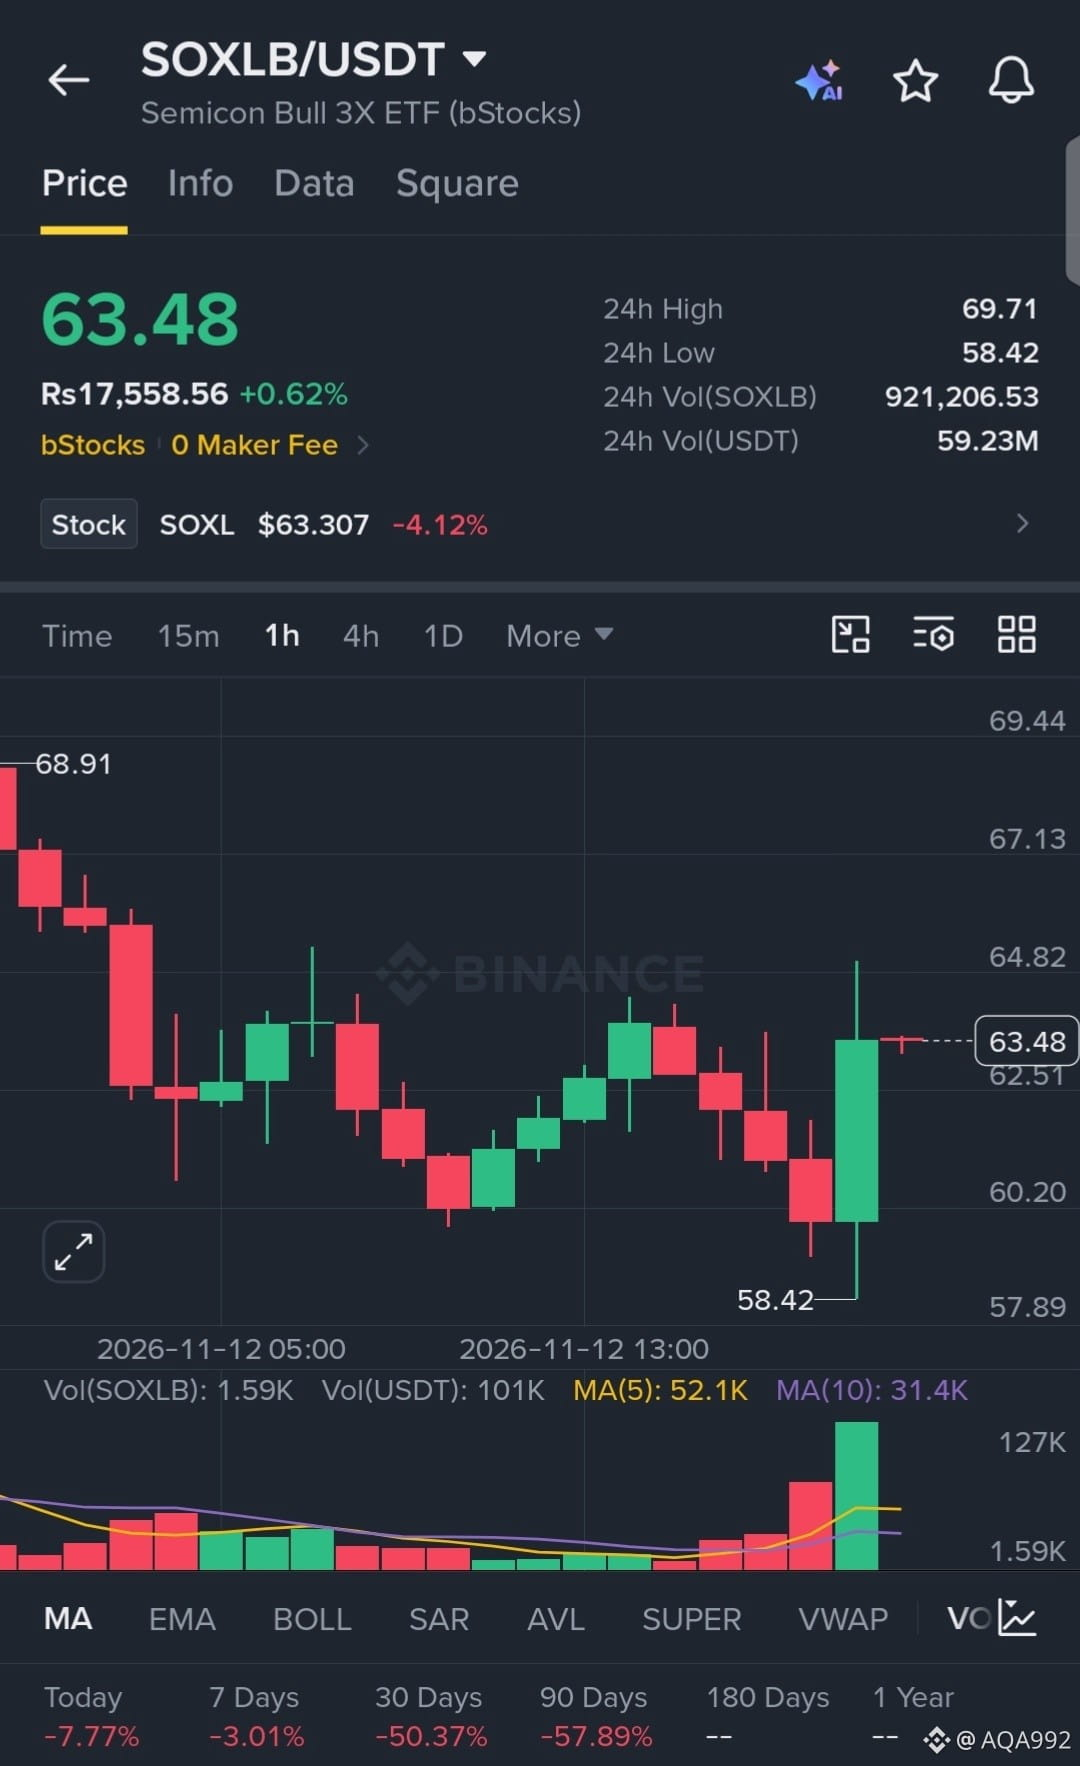
$SOXLB
has aggressively swept downside liquidity, printing a sharp capitulation wick to 58.42 before staging a violent V-shaped reversal. The 1H chart shows a massive surge in buy volume reclaiming the local range, signaling intense momentum for a swift relief rally.
EP: 63.48
TP: 65.50, 68.00, 70.50
SL: 58.00
$SOXLB
#HuangExitNvidiaStrategyInFocus
#ChipStocksExtendLossesAfterNvidiaCEOChange
#AnthropicRejectsIPODelayValuationinQuestion
#CoreWeaveJumps10%On168%RevenueGrowth
#MSCIRemovalMayCurbStrategy’sBitcoinBuying
{spot}(SOXLBUSDT)
$SOXLB
has aggressively swept downside liquidity, printing a sharp capitulation wick to 58.42 before staging a violent V-shaped reversal. The 1H chart shows a massive surge in buy volume reclaiming the local range, signaling intense momentum for a swift relief rally.
EP: 63.48
TP: 65.50, 68.00, 70.50
SL: 58.00
$SOXLB
#HuangExitNvidiaStrategyInFocus
#ChipStocksExtendLossesAfterNvidiaCEOChange
#AnthropicRejectsIPODelayValuationinQuestion
#CoreWeaveJumps10%On168%RevenueGrowth
#MSCIRemovalMayCurbStrategy’sBitcoinBuying
has aggressively swept downside liquidity, printing a sharp capitulation wick to 58.42 before staging a violent V-shaped reversal. The 1H chart shows a massive surge in buy volume reclaiming the local range, signaling intense momentum for a swift relief rally.
EP: 63.48
TP: 65.50, 68.00, 70.50
SL: 58.00
$SOXLB
#HuangExitNvidiaStrategyInFocus
#ChipStocksExtendLossesAfterNvidiaCEOChange
#AnthropicRejectsIPODelayValuationinQuestion
#CoreWeaveJumps10%On168%RevenueGrowth
#MSCIRemovalMayCurbStrategy’sBitcoinBuying
3
·
--
බෙයාරිෂ්
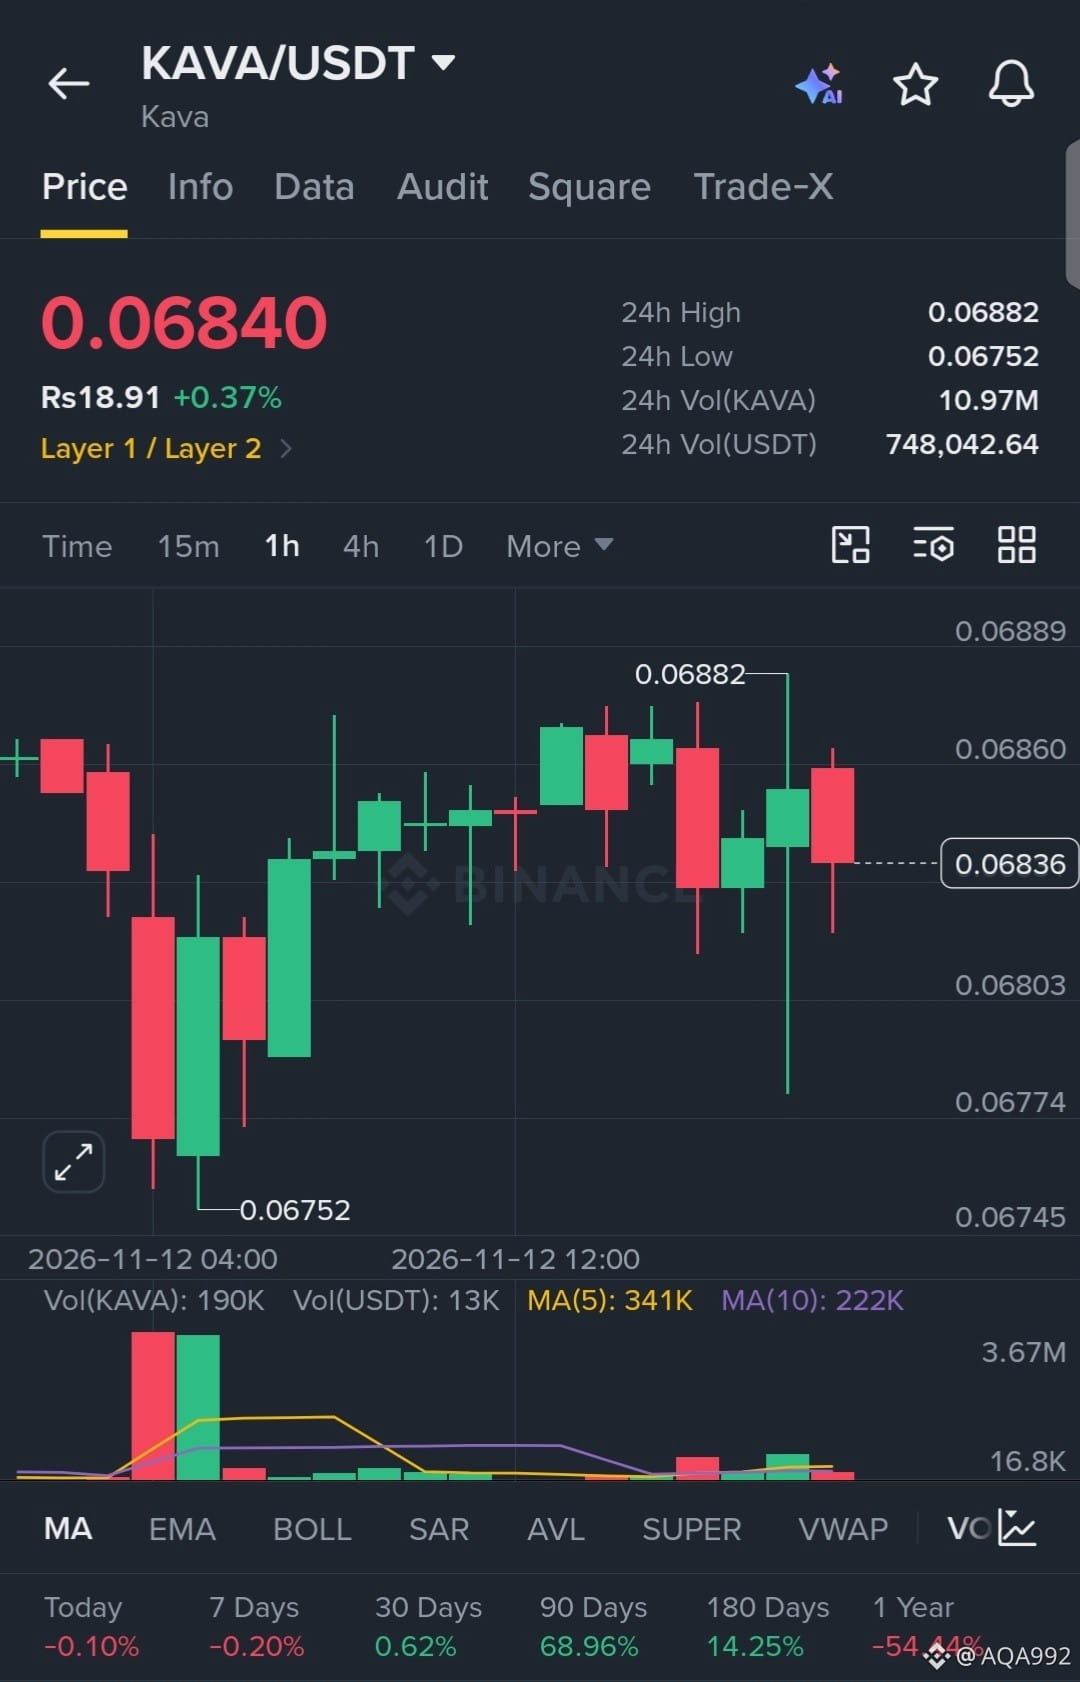
$KAVA
is compressing tightly near local highs, aggressively defending the 0.0680 support zone after a sharp liquidity sweep. The 1H chart reveals intense buyer absorption on every dip, signaling heavy accumulation and coiled momentum ready to break the 0.06882 resistance.
EP: 0.06840
TP: 0.06950, 0.07050, 0.07200
SL: 0.06720
$KAVA
#HuangExitNvidiaStrategyInFocus
#ChipStocksExtendLossesAfterNvidiaCEOChange
#AnthropicRejectsIPODelayValuationinQuestion
#CoreWeaveJumps10%On168%RevenueGrowth
#MSCIRemovalMayCurbStrategy’sBitcoinBuying
{future}(KAVAUSDT)
$KAVA
is compressing tightly near local highs, aggressively defending the 0.0680 support zone after a sharp liquidity sweep. The 1H chart reveals intense buyer absorption on every dip, signaling heavy accumulation and coiled momentum ready to break the 0.06882 resistance.
EP: 0.06840
TP: 0.06950, 0.07050, 0.07200
SL: 0.06720
$KAVA
#HuangExitNvidiaStrategyInFocus
#ChipStocksExtendLossesAfterNvidiaCEOChange
#AnthropicRejectsIPODelayValuationinQuestion
#CoreWeaveJumps10%On168%RevenueGrowth
#MSCIRemovalMayCurbStrategy’sBitcoinBuying
is compressing tightly near local highs, aggressively defending the 0.0680 support zone after a sharp liquidity sweep. The 1H chart reveals intense buyer absorption on every dip, signaling heavy accumulation and coiled momentum ready to break the 0.06882 resistance.
EP: 0.06840
TP: 0.06950, 0.07050, 0.07200
SL: 0.06720
$KAVA
#HuangExitNvidiaStrategyInFocus
#ChipStocksExtendLossesAfterNvidiaCEOChange
#AnthropicRejectsIPODelayValuationinQuestion
#CoreWeaveJumps10%On168%RevenueGrowth
#MSCIRemovalMayCurbStrategy’sBitcoinBuying
4
·
--
උසබ තත්ත්වය
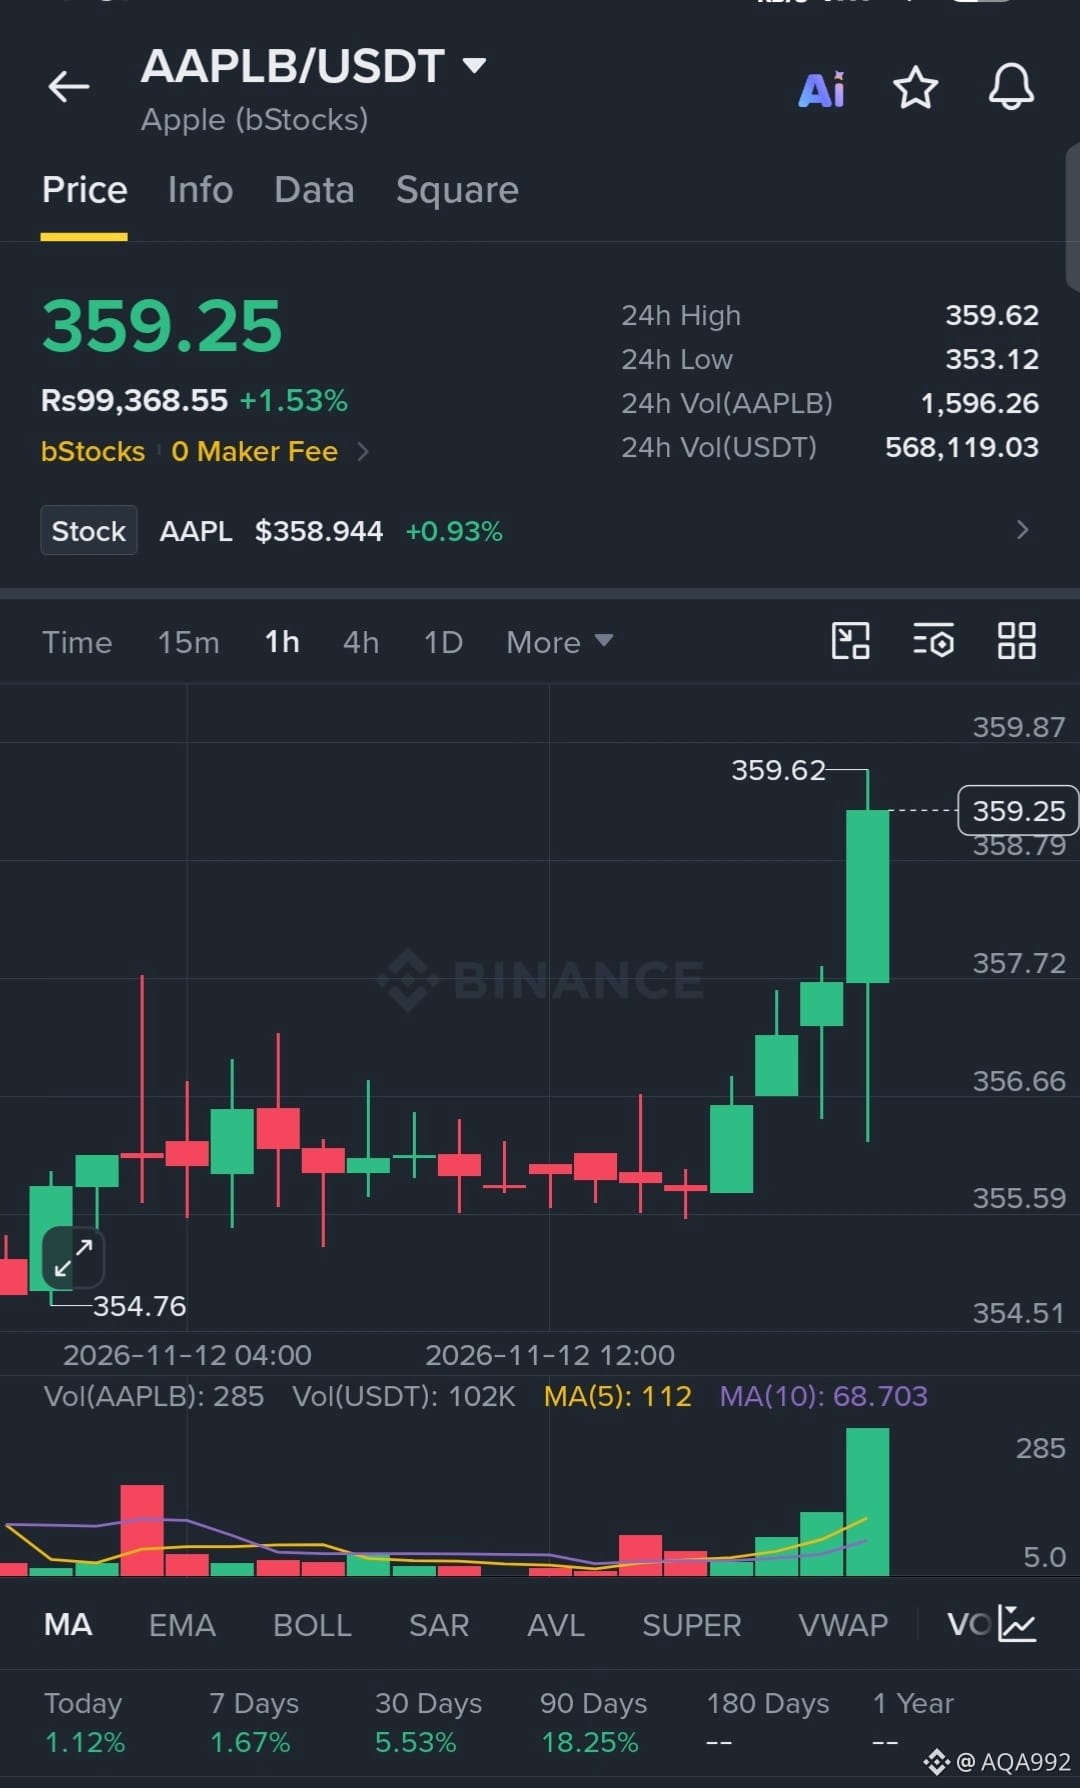
$AAPLB
is demonstrating textbook bullish continuation, establishing a strong sequence of higher lows and breaking local resistance with a surge in volume. The 1H chart shows aggressive buyer absorption on every dip, signaling intense momentum ready to shatter the immediate high at 359.62.
EP: 359.25
TP: 362.50, 366.00, 370.00
SL: 353.50
$AAPLB
#HuangExitNvidiaStrategyInFocus
#ChipStocksExtendLossesAfterNvidiaCEOChange
#AnthropicRejectsIPODelayValuationinQuestion
#CoreWeaveJumps10%On168%RevenueGrowth
#MSCIRemovalMayCurbStrategy’sBitcoinBuying
{spot}(AAPLBUSDT)
$AAPLB
is demonstrating textbook bullish continuation, establishing a strong sequence of higher lows and breaking local resistance with a surge in volume. The 1H chart shows aggressive buyer absorption on every dip, signaling intense momentum ready to shatter the immediate high at 359.62.
EP: 359.25
TP: 362.50, 366.00, 370.00
SL: 353.50
$AAPLB
#HuangExitNvidiaStrategyInFocus
#ChipStocksExtendLossesAfterNvidiaCEOChange
#AnthropicRejectsIPODelayValuationinQuestion
#CoreWeaveJumps10%On168%RevenueGrowth
#MSCIRemovalMayCurbStrategy’sBitcoinBuying
is demonstrating textbook bullish continuation, establishing a strong sequence of higher lows and breaking local resistance with a surge in volume. The 1H chart shows aggressive buyer absorption on every dip, signaling intense momentum ready to shatter the immediate high at 359.62.
EP: 359.25
TP: 362.50, 366.00, 370.00
SL: 353.50
$AAPLB
#HuangExitNvidiaStrategyInFocus
#ChipStocksExtendLossesAfterNvidiaCEOChange
#AnthropicRejectsIPODelayValuationinQuestion
#CoreWeaveJumps10%On168%RevenueGrowth
#MSCIRemovalMayCurbStrategy’sBitcoinBuying
5
·
--
උසබ තත්ත්වය
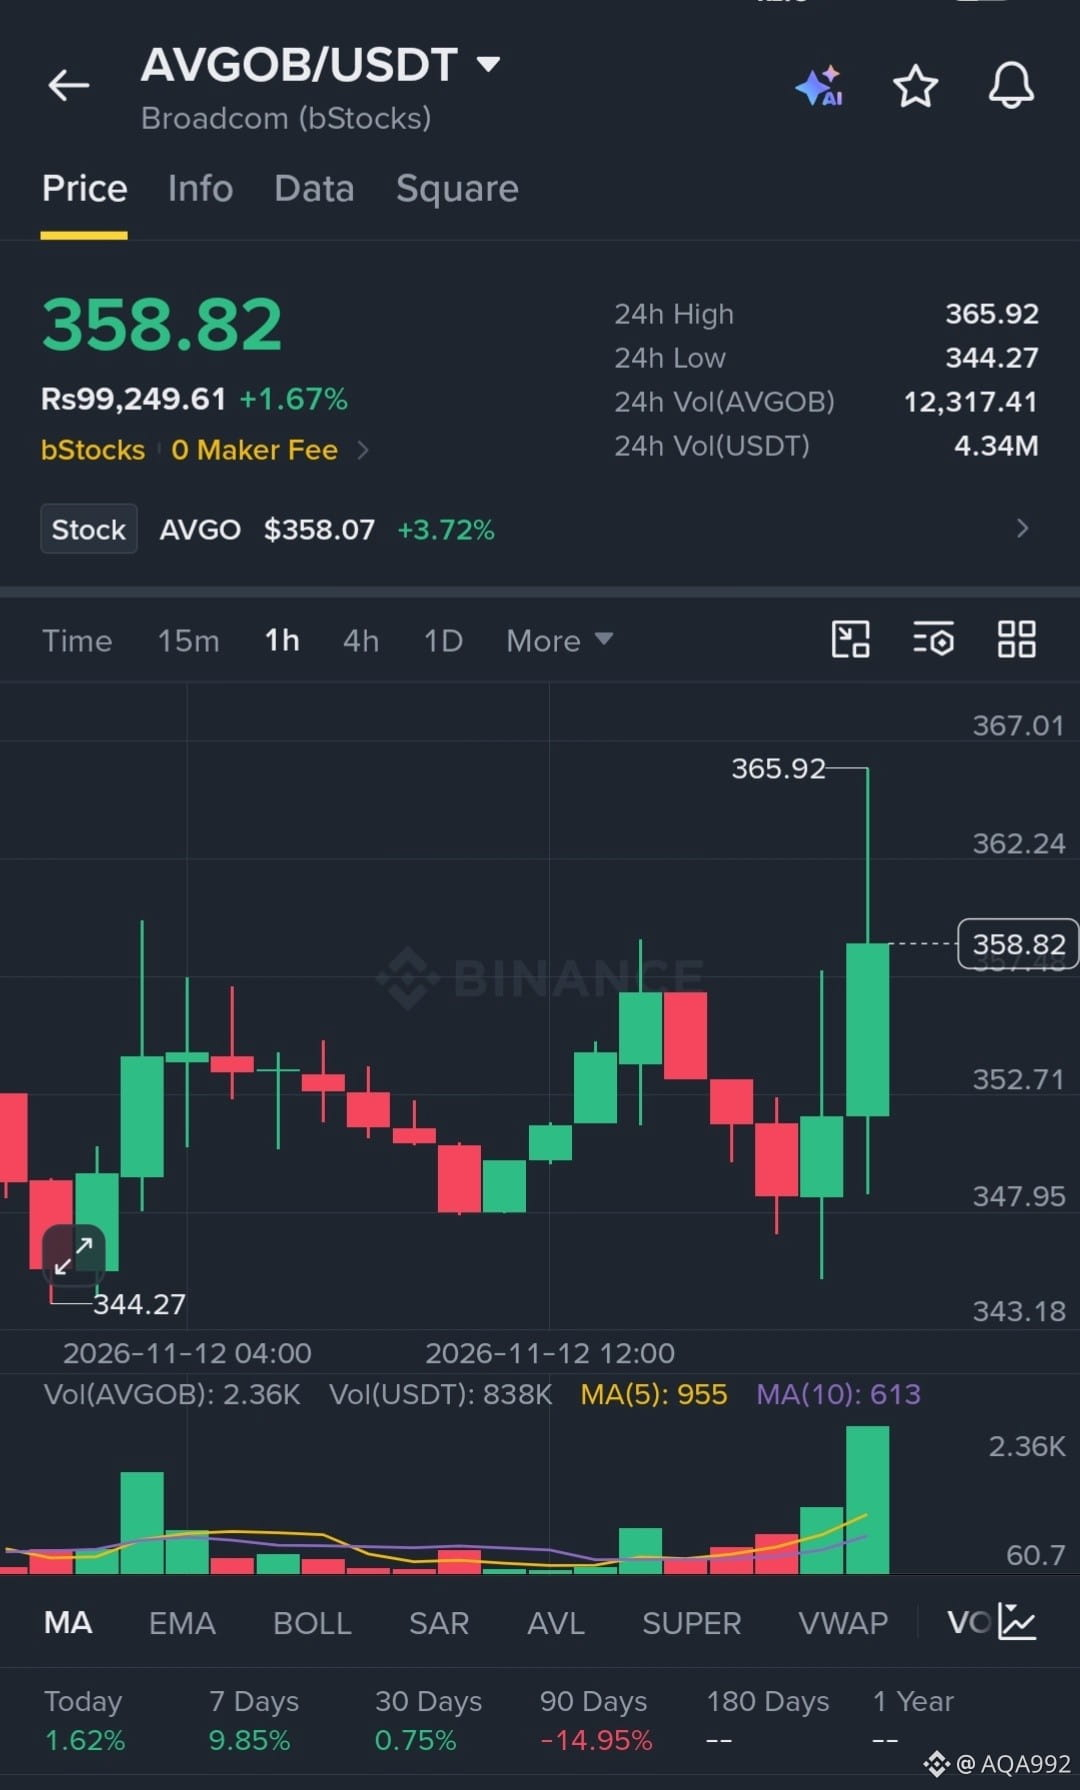
$AVGOB
is showing strong bullish structure, aggressively defending the recent breakout zone after a sharp liquidity sweep to 344.27. The 1H chart reveals heavy volume absorption on dips and a rejection of the local high at 365.92, signaling coiled momentum ready for a continuation breakout.
EP: 358.82
TP: 366.00, 374.50, 385.00
SL: 346.00
$AVGOB
#HuangExitNvidiaStrategyInFocus
#ChipStocksExtendLossesAfterNvidiaCEOChange
#AnthropicRejectsIPODelayValuationinQuestion
#MSCIRemovalMayCurbStrategy’sBitcoinBuying
#TradFiForBeginners
{spot}(AVGOBUSDT)
$AVGOB
is showing strong bullish structure, aggressively defending the recent breakout zone after a sharp liquidity sweep to 344.27. The 1H chart reveals heavy volume absorption on dips and a rejection of the local high at 365.92, signaling coiled momentum ready for a continuation breakout.
EP: 358.82
TP: 366.00, 374.50, 385.00
SL: 346.00
$AVGOB
#HuangExitNvidiaStrategyInFocus
#ChipStocksExtendLossesAfterNvidiaCEOChange
#AnthropicRejectsIPODelayValuationinQuestion
#MSCIRemovalMayCurbStrategy’sBitcoinBuying
#TradFiForBeginners
is showing strong bullish structure, aggressively defending the recent breakout zone after a sharp liquidity sweep to 344.27. The 1H chart reveals heavy volume absorption on dips and a rejection of the local high at 365.92, signaling coiled momentum ready for a continuation breakout.
EP: 358.82
TP: 366.00, 374.50, 385.00
SL: 346.00
$AVGOB
#HuangExitNvidiaStrategyInFocus
#ChipStocksExtendLossesAfterNvidiaCEOChange
#AnthropicRejectsIPODelayValuationinQuestion
#MSCIRemovalMayCurbStrategy’sBitcoinBuying
#TradFiForBeginners
3
·
--
උසබ තත්ත්වය
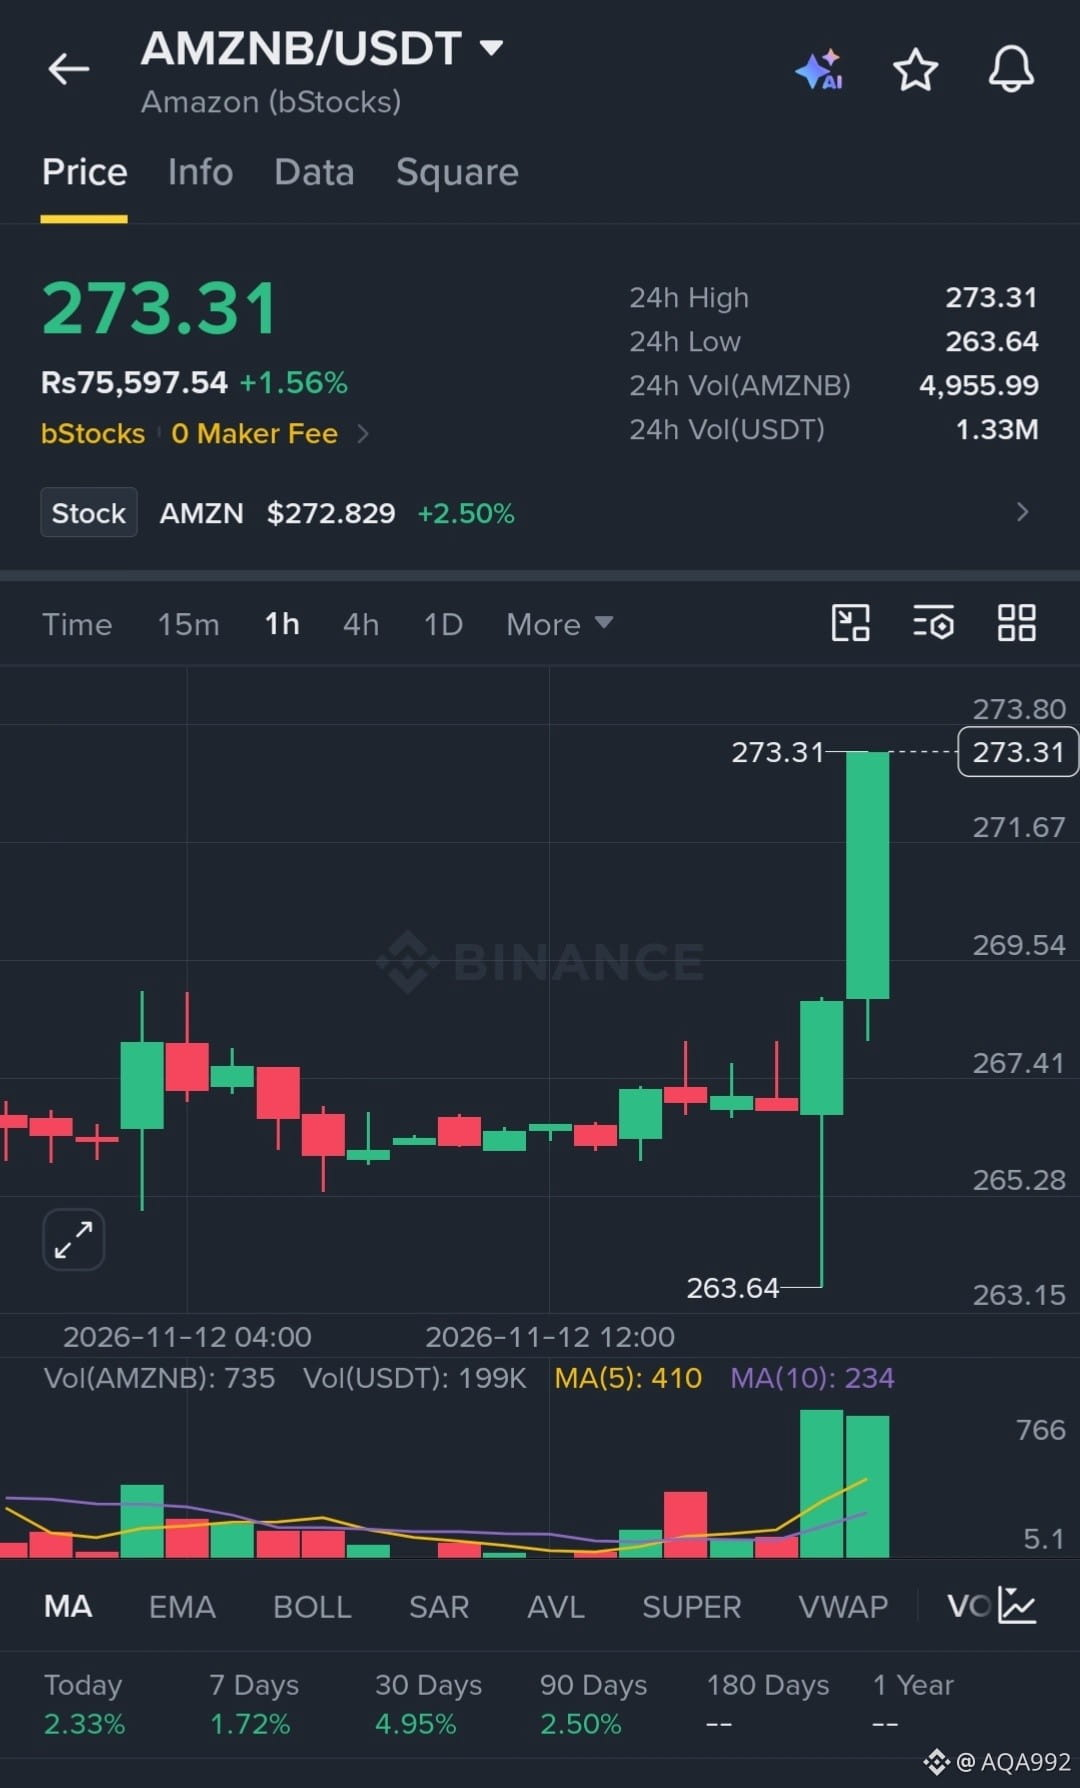
$AMZNB
has ignited a violent bullish breakout, aggressively clearing local resistance with a massive, high-conviction volume spike. The 1H chart shows absolute buyer dominance, establishing a sharp V-shaped recovery from the 263.64 low. Momentum is fully primed for immediate continuation into price discovery.
EP: 273.31
TP: 278.00, 284.50, 292.00
SL: 265.00
$AMZNB
#HuangExitNvidiaStrategyInFocus
#ChipStocksExtendLossesAfterNvidiaCEOChange
#AnthropicRejectsIPODelayValuationinQuestion
#CoreWeaveJumps10%On168%RevenueGrowth
#TradFiForBeginners
{spot}(AMZNBUSDT)
$AMZNB
has ignited a violent bullish breakout, aggressively clearing local resistance with a massive, high-conviction volume spike. The 1H chart shows absolute buyer dominance, establishing a sharp V-shaped recovery from the 263.64 low. Momentum is fully primed for immediate continuation into price discovery.
EP: 273.31
TP: 278.00, 284.50, 292.00
SL: 265.00
$AMZNB
#HuangExitNvidiaStrategyInFocus
#ChipStocksExtendLossesAfterNvidiaCEOChange
#AnthropicRejectsIPODelayValuationinQuestion
#CoreWeaveJumps10%On168%RevenueGrowth
#TradFiForBeginners
has ignited a violent bullish breakout, aggressively clearing local resistance with a massive, high-conviction volume spike. The 1H chart shows absolute buyer dominance, establishing a sharp V-shaped recovery from the 263.64 low. Momentum is fully primed for immediate continuation into price discovery.
EP: 273.31
TP: 278.00, 284.50, 292.00
SL: 265.00
$AMZNB
#HuangExitNvidiaStrategyInFocus
#ChipStocksExtendLossesAfterNvidiaCEOChange
#AnthropicRejectsIPODelayValuationinQuestion
#CoreWeaveJumps10%On168%RevenueGrowth
#TradFiForBeginners
4
·
--
උසබ තත්ත්වය
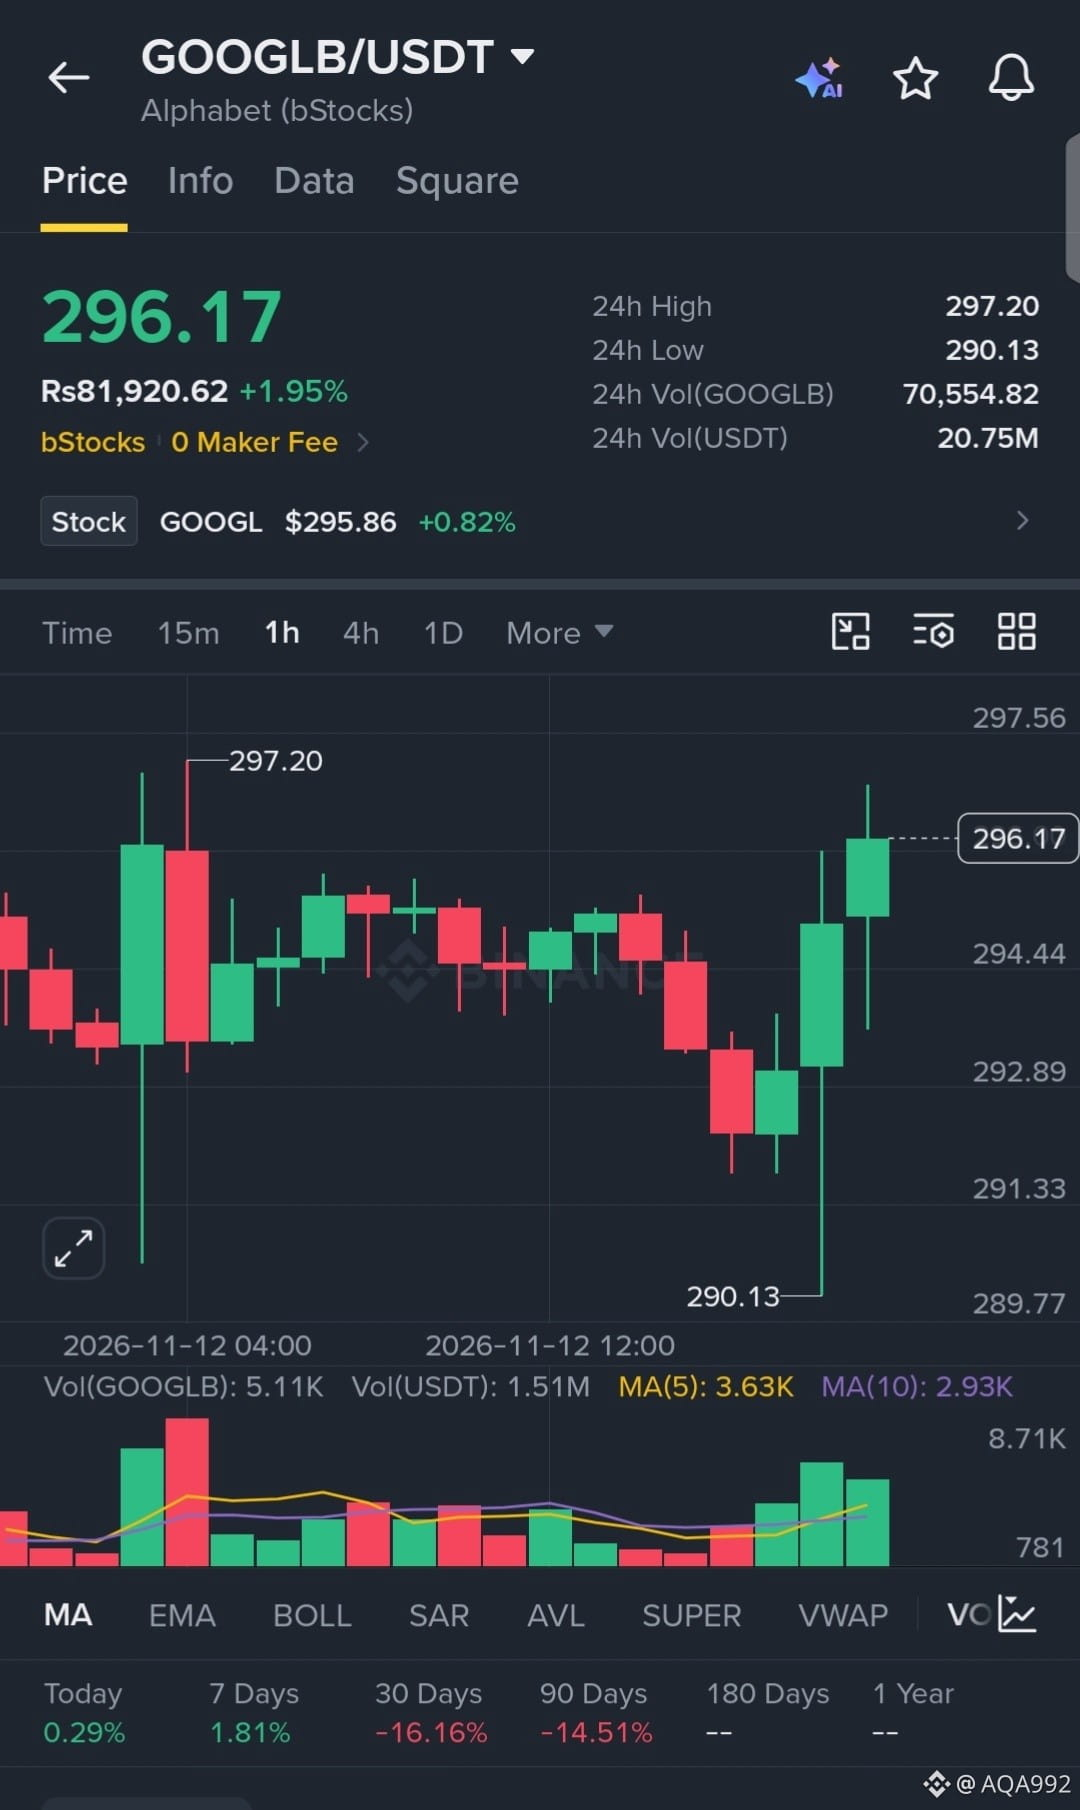
$GOOGLB
has aggressively swept downside liquidity, printing a sharp capitulation wick to 290.13 before staging a violent V-shaped reversal. The 1H chart shows immediate buyer absorption with a surge in volume reclaiming the local range, signaling intense momentum for a continuation push toward previous highs.
EP: 296.17
TP: 300.00, 305.50, 312.00
SL: 289.00
$GOOGLB
#HuangExitNvidiaStrategyInFocus
#ChipStocksExtendLossesAfterNvidiaCEOChange
#AnthropicRejectsIPODelayValuationinQuestion
#CoreWeaveJumps10%On168%RevenueGrowth
#MSCIRemovalMayCurbStrategy’sBitcoinBuying
{spot}(GOOGLBUSDT)
$GOOGLB
has aggressively swept downside liquidity, printing a sharp capitulation wick to 290.13 before staging a violent V-shaped reversal. The 1H chart shows immediate buyer absorption with a surge in volume reclaiming the local range, signaling intense momentum for a continuation push toward previous highs.
EP: 296.17
TP: 300.00, 305.50, 312.00
SL: 289.00
$GOOGLB
#HuangExitNvidiaStrategyInFocus
#ChipStocksExtendLossesAfterNvidiaCEOChange
#AnthropicRejectsIPODelayValuationinQuestion
#CoreWeaveJumps10%On168%RevenueGrowth
#MSCIRemovalMayCurbStrategy’sBitcoinBuying
has aggressively swept downside liquidity, printing a sharp capitulation wick to 290.13 before staging a violent V-shaped reversal. The 1H chart shows immediate buyer absorption with a surge in volume reclaiming the local range, signaling intense momentum for a continuation push toward previous highs.
EP: 296.17
TP: 300.00, 305.50, 312.00
SL: 289.00
$GOOGLB
#HuangExitNvidiaStrategyInFocus
#ChipStocksExtendLossesAfterNvidiaCEOChange
#AnthropicRejectsIPODelayValuationinQuestion
#CoreWeaveJumps10%On168%RevenueGrowth
#MSCIRemovalMayCurbStrategy’sBitcoinBuying
2
·
--
බෙයාරිෂ්
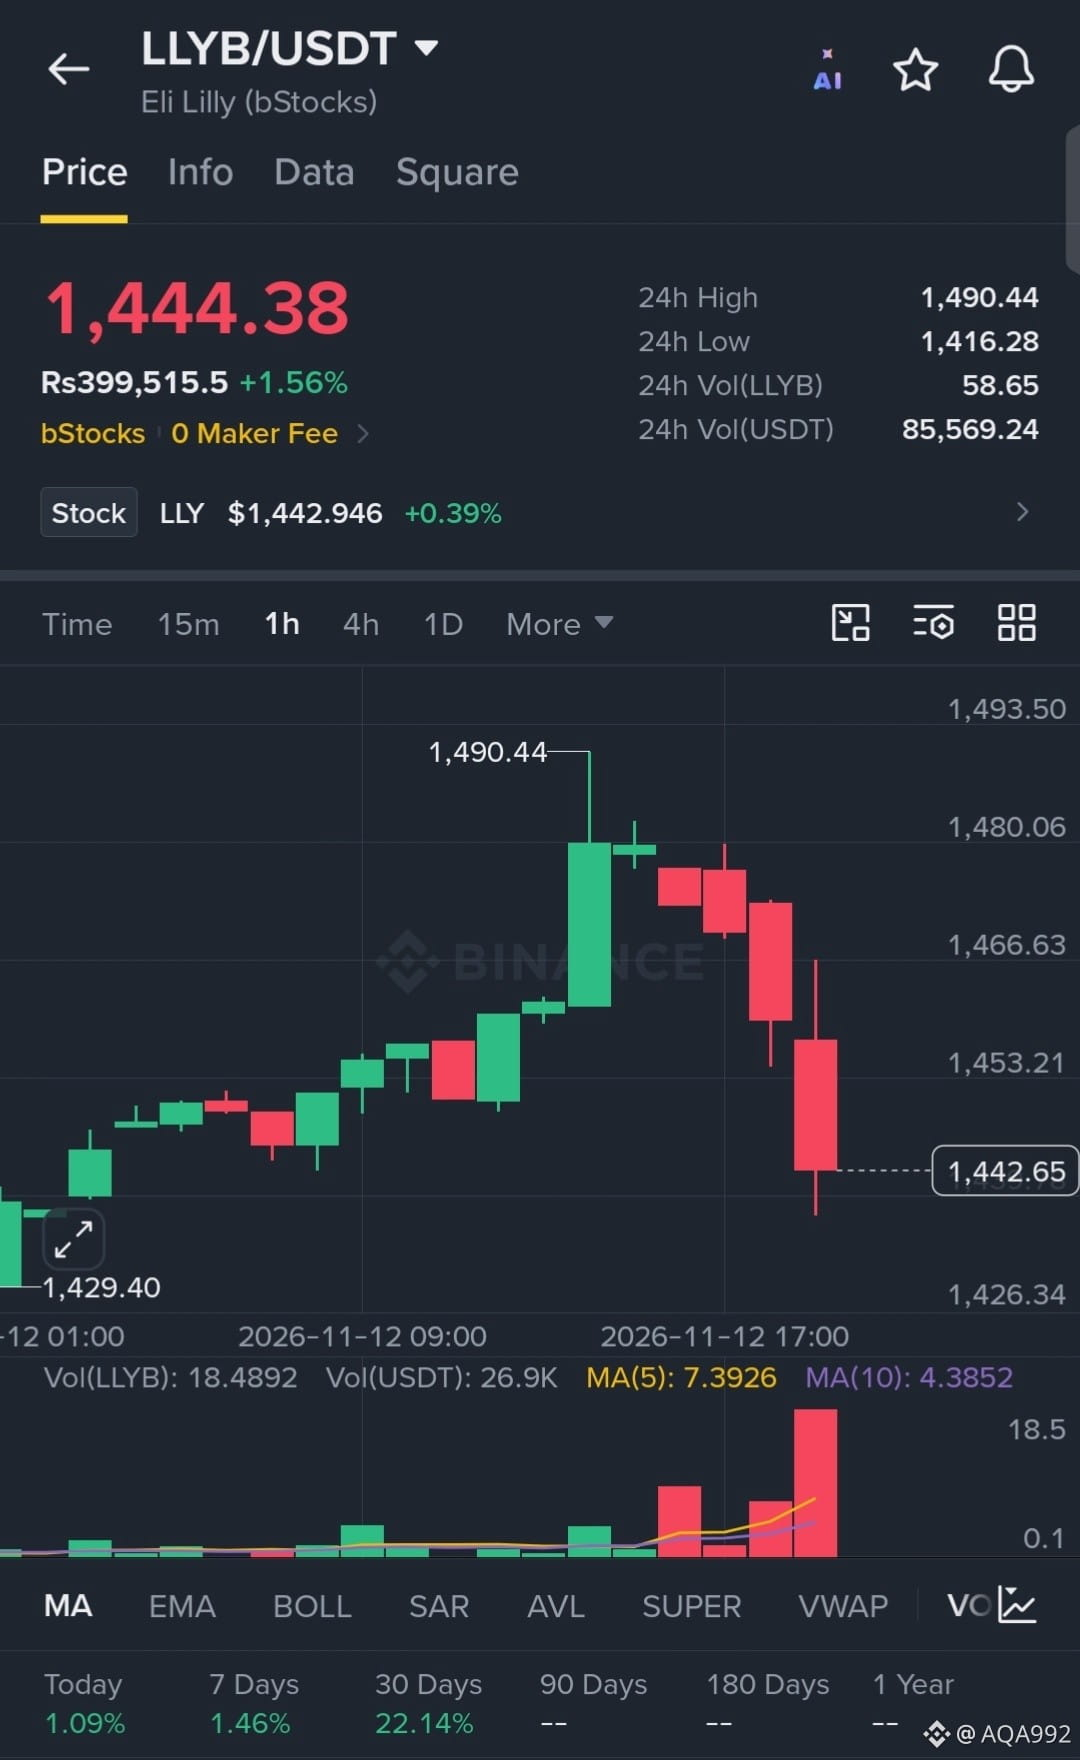
$LLYB
has aggressively rejected the 1,490 local high, triggering a sharp cascade of selling pressure with expanding volume. The 1H chart shows heavy distribution and a clear breakdown of market structure, signaling intense bearish momentum driving toward lower support levels.
EP: 1444.38
TP: 1425.00, 1410.00, 1395.00
SL: 1478.00
$LLYB
#HuangExitNvidiaStrategyInFocus
#ChipStocksExtendLossesAfterNvidiaCEOChange
#AnthropicRejectsIPODelayValuationinQuestion
#CoreWeaveJumps10%On168%RevenueGrowth
#MSCIRemovalMayCurbStrategy’sBitcoinBuying
{spot}(LLYBUSDT)
$LLYB
has aggressively rejected the 1,490 local high, triggering a sharp cascade of selling pressure with expanding volume. The 1H chart shows heavy distribution and a clear breakdown of market structure, signaling intense bearish momentum driving toward lower support levels.
EP: 1444.38
TP: 1425.00, 1410.00, 1395.00
SL: 1478.00
$LLYB
#HuangExitNvidiaStrategyInFocus
#ChipStocksExtendLossesAfterNvidiaCEOChange
#AnthropicRejectsIPODelayValuationinQuestion
#CoreWeaveJumps10%On168%RevenueGrowth
#MSCIRemovalMayCurbStrategy’sBitcoinBuying
has aggressively rejected the 1,490 local high, triggering a sharp cascade of selling pressure with expanding volume. The 1H chart shows heavy distribution and a clear breakdown of market structure, signaling intense bearish momentum driving toward lower support levels.
EP: 1444.38
TP: 1425.00, 1410.00, 1395.00
SL: 1478.00
$LLYB
#HuangExitNvidiaStrategyInFocus
#ChipStocksExtendLossesAfterNvidiaCEOChange
#AnthropicRejectsIPODelayValuationinQuestion
#CoreWeaveJumps10%On168%RevenueGrowth
#MSCIRemovalMayCurbStrategy’sBitcoinBuying
4
·
--
උසබ තත්ත්වය
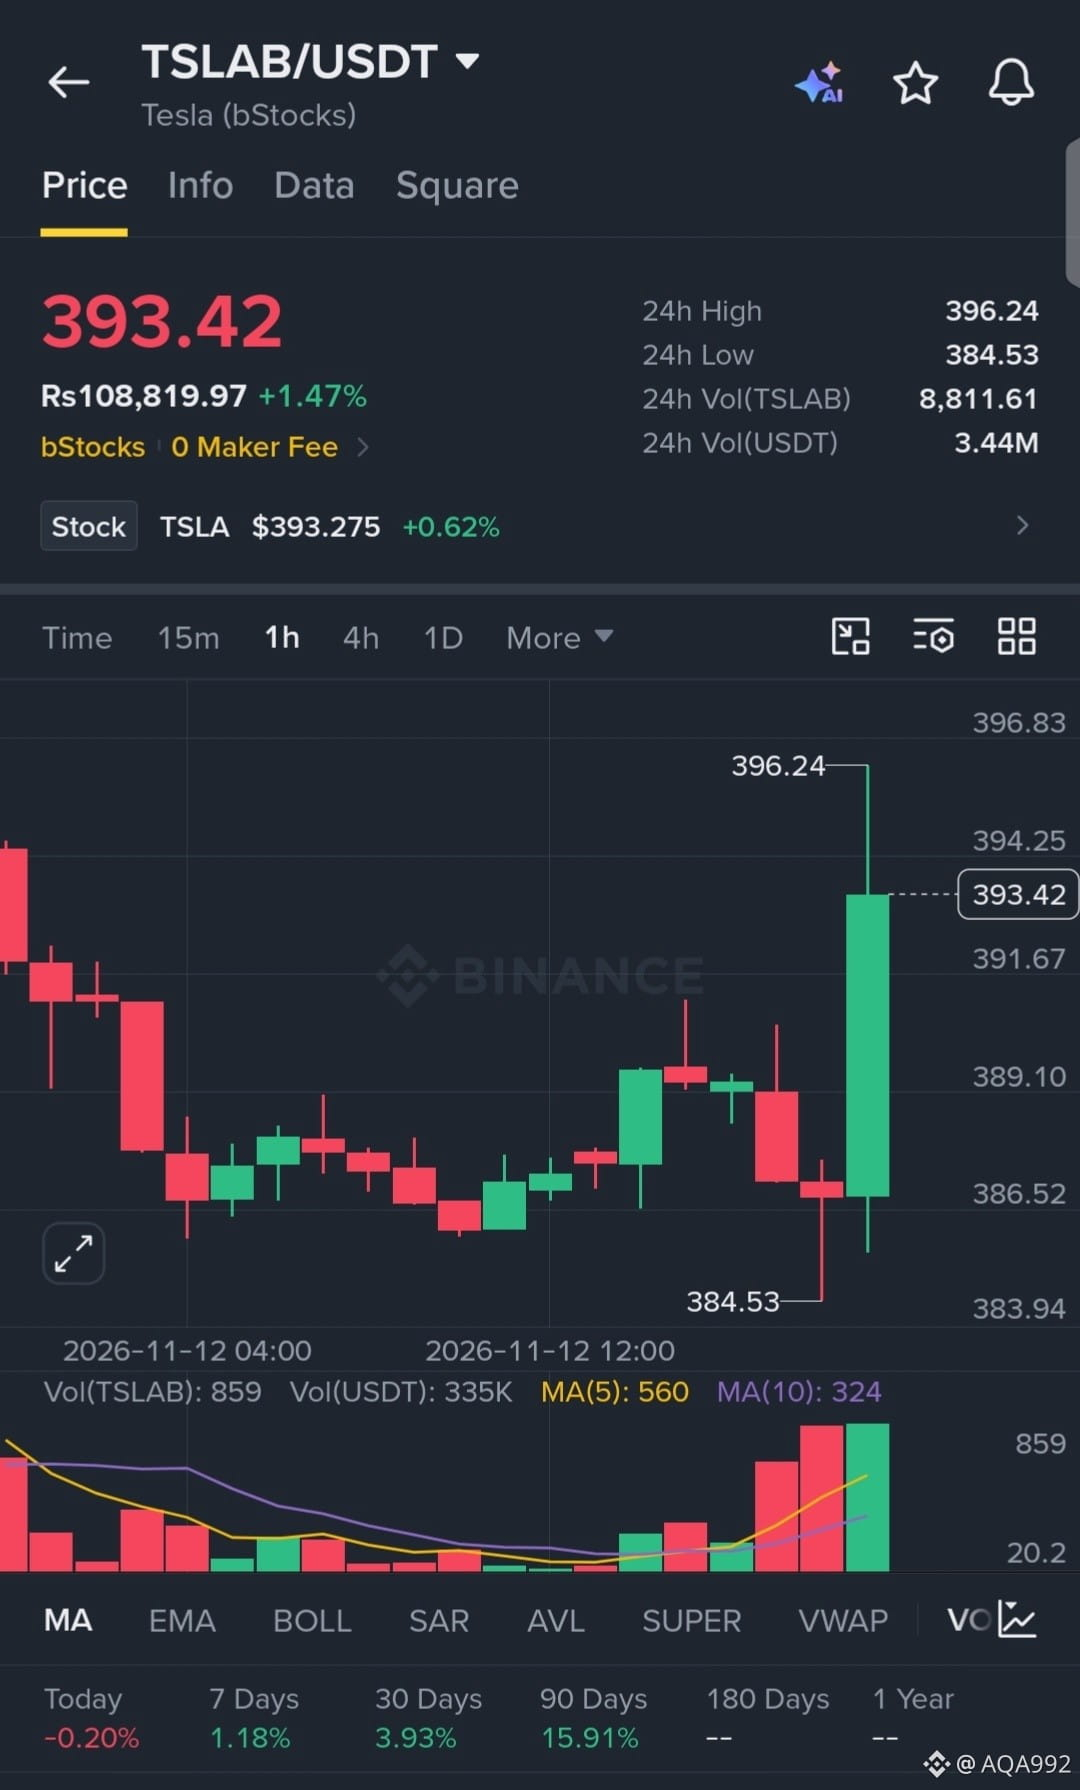
$TSLAB
has aggressively swept downside liquidity, printing a sharp capitulation wick to 384.53 before staging a violent V-shaped reversal. The 1H chart shows a massive surge in buy volume reclaiming the local range, signaling intense momentum for a swift continuation rally.
EP: 393.42
TP: 400.00, 407.50, 415.00
SL: 382.00
$TSLAB
#HuangExitNvidiaStrategyInFocus
#ChipStocksExtendLossesAfterNvidiaCEOChange
#AnthropicRejectsIPODelayValuationinQuestion
#CoreWeaveJumps10%On168%RevenueGrowth
#MSCIRemovalMayCurbStrategy’sBitcoinBuying
{spot}(TSLABUSDT)
$TSLAB
has aggressively swept downside liquidity, printing a sharp capitulation wick to 384.53 before staging a violent V-shaped reversal. The 1H chart shows a massive surge in buy volume reclaiming the local range, signaling intense momentum for a swift continuation rally.
EP: 393.42
TP: 400.00, 407.50, 415.00
SL: 382.00
$TSLAB
#HuangExitNvidiaStrategyInFocus
#ChipStocksExtendLossesAfterNvidiaCEOChange
#AnthropicRejectsIPODelayValuationinQuestion
#CoreWeaveJumps10%On168%RevenueGrowth
#MSCIRemovalMayCurbStrategy’sBitcoinBuying
has aggressively swept downside liquidity, printing a sharp capitulation wick to 384.53 before staging a violent V-shaped reversal. The 1H chart shows a massive surge in buy volume reclaiming the local range, signaling intense momentum for a swift continuation rally.
EP: 393.42
TP: 400.00, 407.50, 415.00
SL: 382.00
$TSLAB
#HuangExitNvidiaStrategyInFocus
#ChipStocksExtendLossesAfterNvidiaCEOChange
#AnthropicRejectsIPODelayValuationinQuestion
#CoreWeaveJumps10%On168%RevenueGrowth
#MSCIRemovalMayCurbStrategy’sBitcoinBuying
4
·
--
උසබ තත්ත්වය
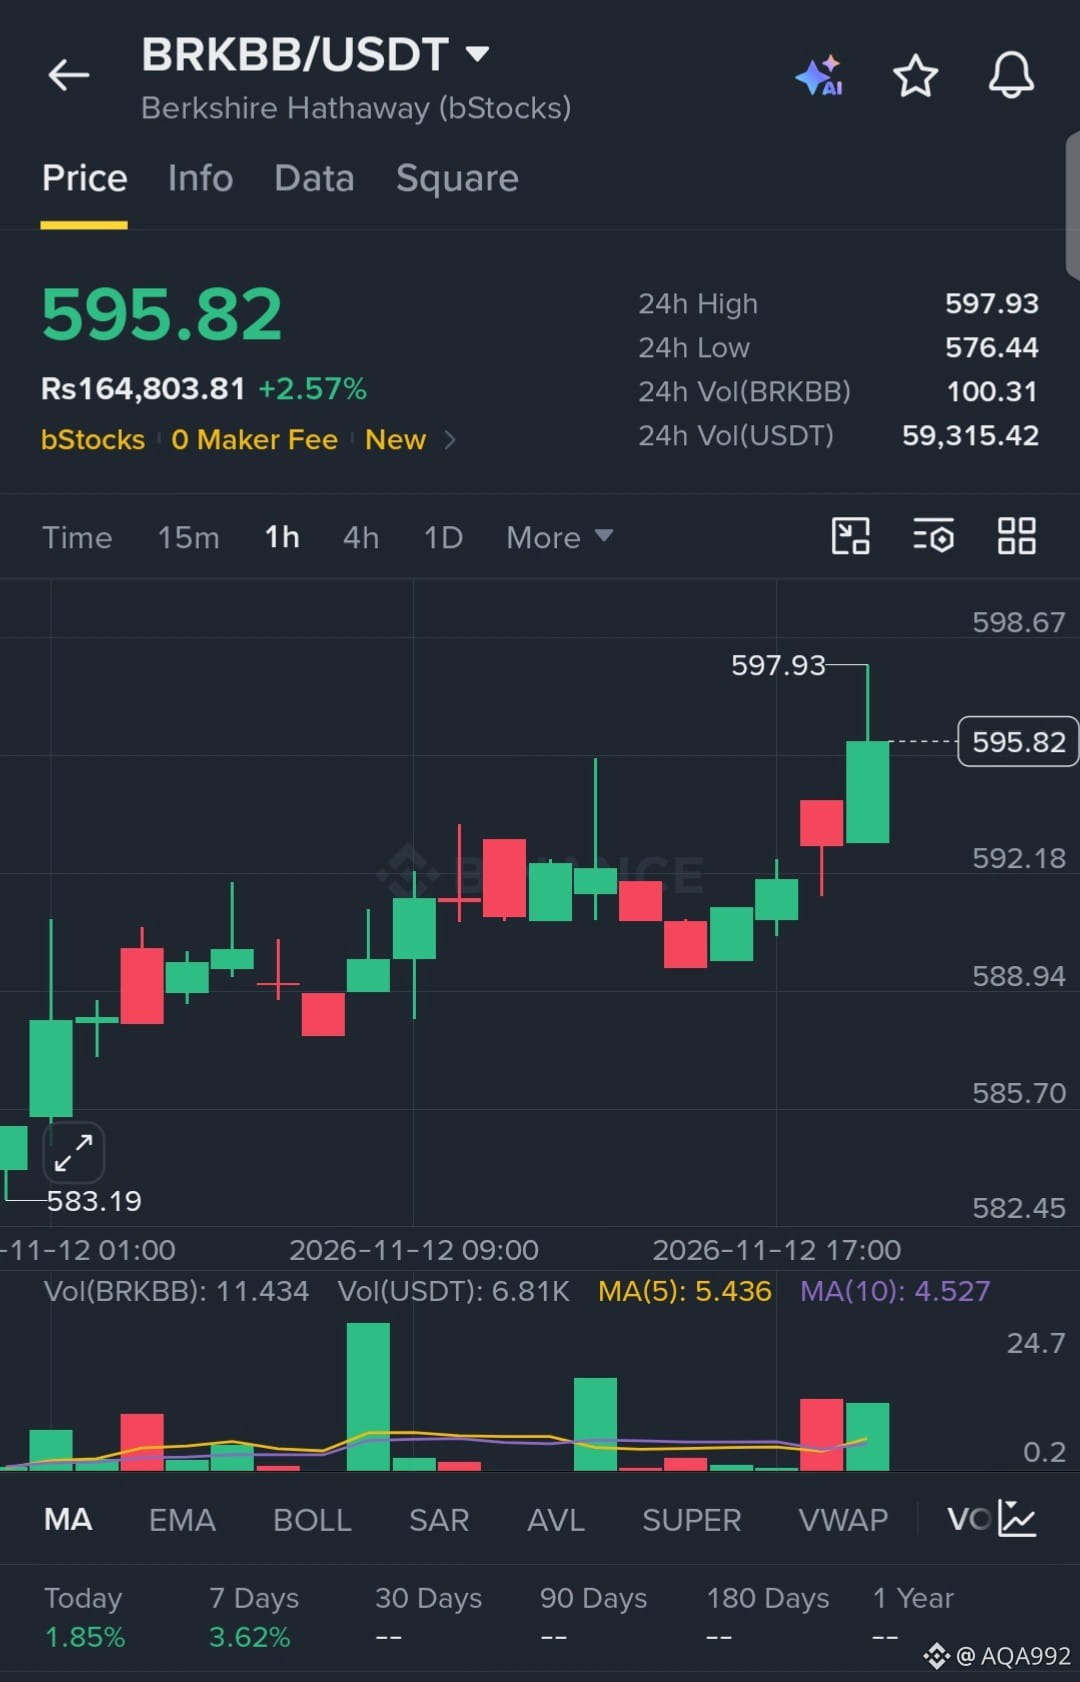
$BRKBB
is maintaining a relentless bullish structure, printing consecutive higher lows and pressing hard against local resistance at 597.93. The 1H chart shows steady volume accumulation with zero signs of heavy selling pressure, indicating a highly coiled setup ready for a breakout continuation.
EP: 595.82
TP: 602.00, 610.00, 620.00
SL: 584.00
$BRKBB
#HuangExitNvidiaStrategyInFocus
#ChipStocksExtendLossesAfterNvidiaCEOChange
#AnthropicRejectsIPODelayValuationinQuestion
#CoreWeaveJumps10%On168%RevenueGrowth
#MSCIRemovalMayCurbStrategy’sBitcoinBuying
{spot}(BRKBBUSDT)
$BRKBB
is maintaining a relentless bullish structure, printing consecutive higher lows and pressing hard against local resistance at 597.93. The 1H chart shows steady volume accumulation with zero signs of heavy selling pressure, indicating a highly coiled setup ready for a breakout continuation.
EP: 595.82
TP: 602.00, 610.00, 620.00
SL: 584.00
$BRKBB
#HuangExitNvidiaStrategyInFocus
#ChipStocksExtendLossesAfterNvidiaCEOChange
#AnthropicRejectsIPODelayValuationinQuestion
#CoreWeaveJumps10%On168%RevenueGrowth
#MSCIRemovalMayCurbStrategy’sBitcoinBuying
is maintaining a relentless bullish structure, printing consecutive higher lows and pressing hard against local resistance at 597.93. The 1H chart shows steady volume accumulation with zero signs of heavy selling pressure, indicating a highly coiled setup ready for a breakout continuation.
EP: 595.82
TP: 602.00, 610.00, 620.00
SL: 584.00
$BRKBB
#HuangExitNvidiaStrategyInFocus
#ChipStocksExtendLossesAfterNvidiaCEOChange
#AnthropicRejectsIPODelayValuationinQuestion
#CoreWeaveJumps10%On168%RevenueGrowth
#MSCIRemovalMayCurbStrategy’sBitcoinBuying
3
·
--
උසබ තත්ත්වය
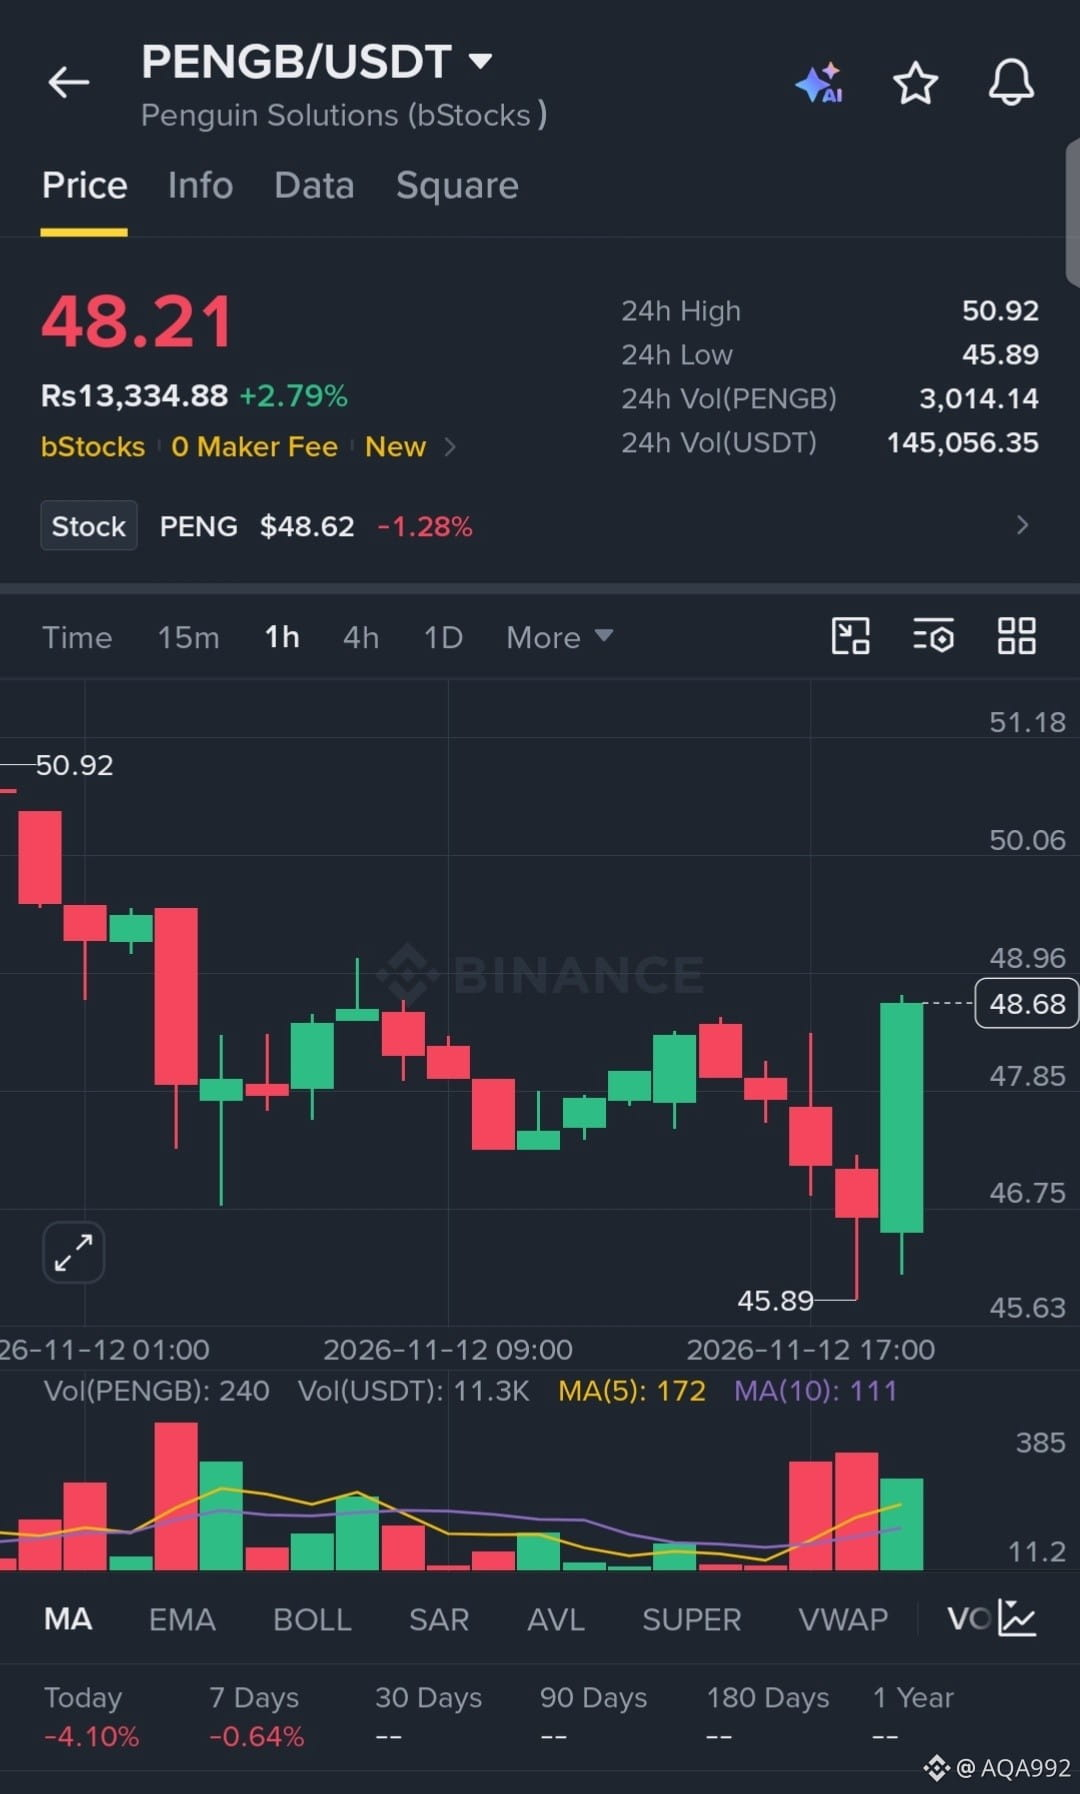
$PENGB
has aggressively swept downside liquidity, printing a sharp capitulation wick to 45.89 before staging a violent V-shaped reversal. The 1H chart shows a massive surge in buy volume reclaiming the local range, signaling intense momentum for a swift relief rally.
EP: 48.21
TP: 49.50, 50.90, 52.50
SL: 45.50
$PENGB
#HuangExitNvidiaStrategyInFocus
#ChipStocksExtendLossesAfterNvidiaCEOChange
#AnthropicRejectsIPODelayValuationinQuestion
#CoreWeaveJumps10%On168%RevenueGrowth
#MSCIRemovalMayCurbStrategy’sBitcoinBuying
{spot}(PENGBUSDT)
$PENGB
has aggressively swept downside liquidity, printing a sharp capitulation wick to 45.89 before staging a violent V-shaped reversal. The 1H chart shows a massive surge in buy volume reclaiming the local range, signaling intense momentum for a swift relief rally.
EP: 48.21
TP: 49.50, 50.90, 52.50
SL: 45.50
$PENGB
#HuangExitNvidiaStrategyInFocus
#ChipStocksExtendLossesAfterNvidiaCEOChange
#AnthropicRejectsIPODelayValuationinQuestion
#CoreWeaveJumps10%On168%RevenueGrowth
#MSCIRemovalMayCurbStrategy’sBitcoinBuying
has aggressively swept downside liquidity, printing a sharp capitulation wick to 45.89 before staging a violent V-shaped reversal. The 1H chart shows a massive surge in buy volume reclaiming the local range, signaling intense momentum for a swift relief rally.
EP: 48.21
TP: 49.50, 50.90, 52.50
SL: 45.50
$PENGB
#HuangExitNvidiaStrategyInFocus
#ChipStocksExtendLossesAfterNvidiaCEOChange
#AnthropicRejectsIPODelayValuationinQuestion
#CoreWeaveJumps10%On168%RevenueGrowth
#MSCIRemovalMayCurbStrategy’sBitcoinBuying
3
·
--
$AVGOB
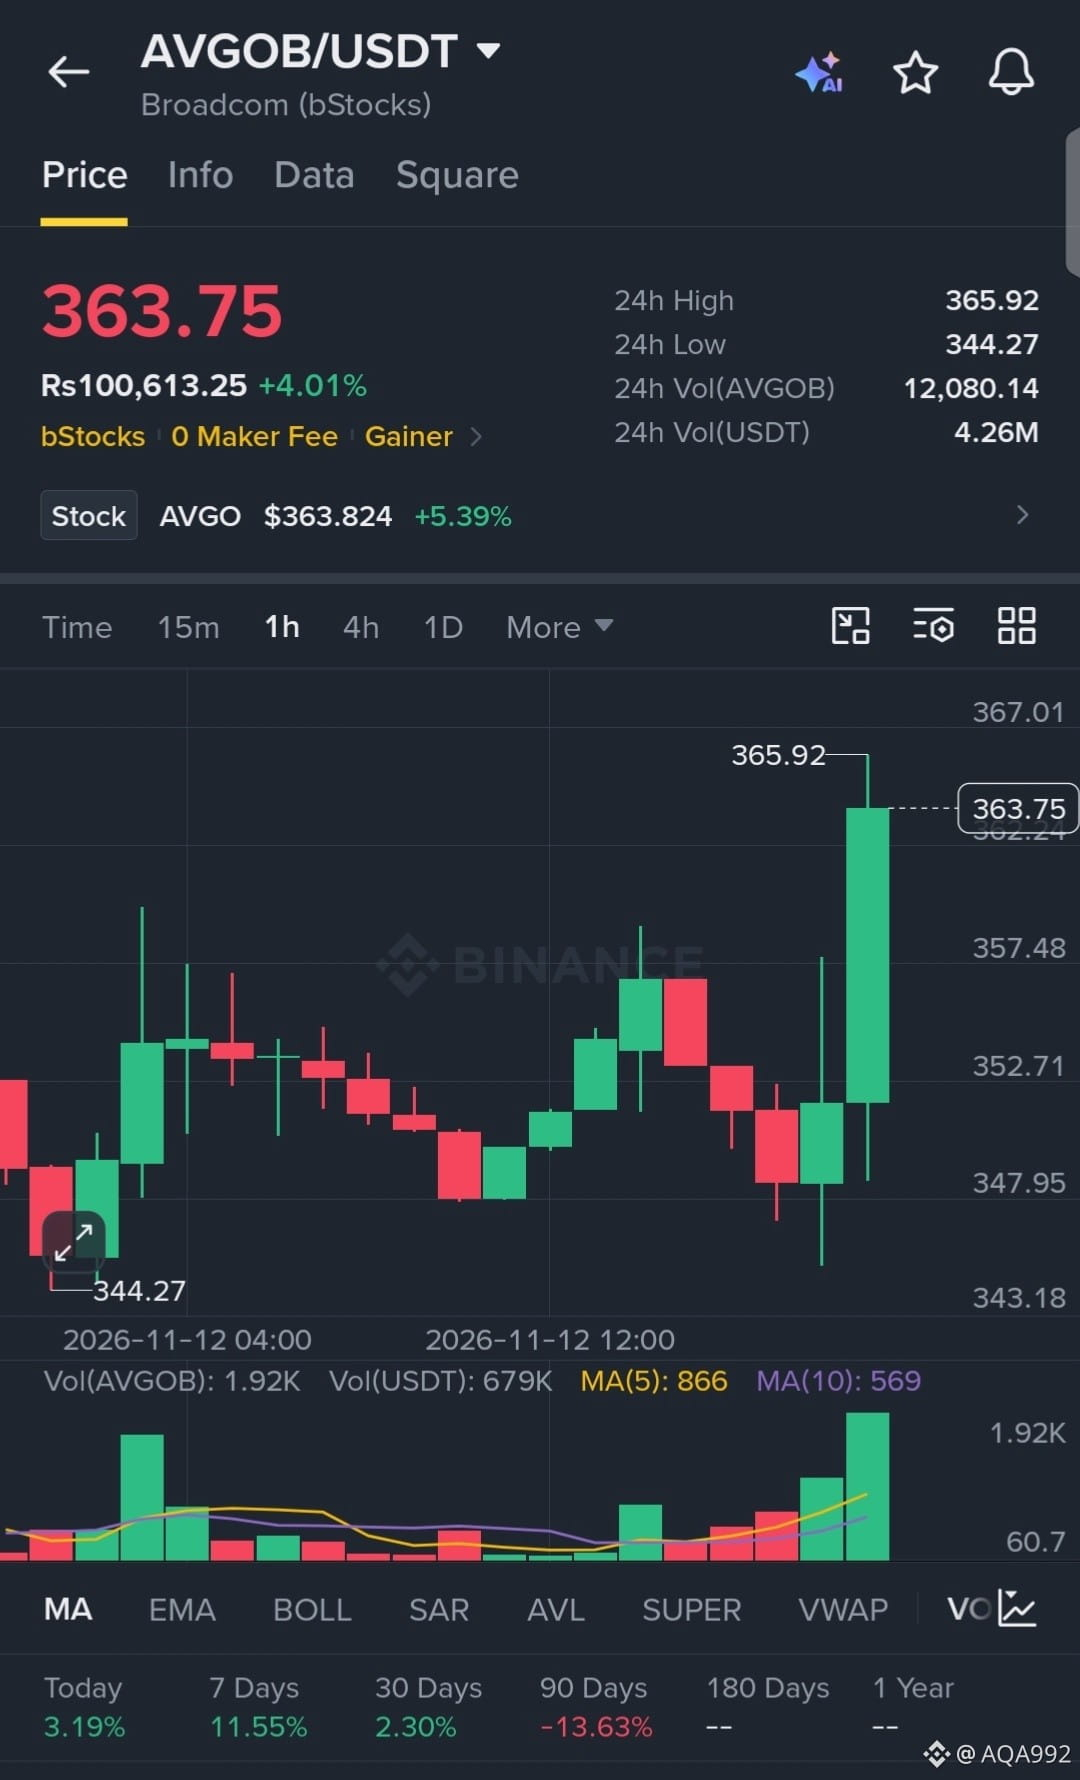
is displaying aggressive bullish momentum, blasting through local resistance with a massive volume expansion. The 1H chart reveals intense buyer absorption, establishing a strong higher-low structure. Momentum is heavily skewed to the upside, primed for a continuation push.
EP: 363.75
TP: 370.00, 378.50, 388.00
SL: 348.00
$AVGOB
#HuangExitNvidiaStrategyInFocus
#ChipStocksExtendLossesAfterNvidiaCEOChange
#AnthropicRejectsIPODelayValuationinQuestion
#CoreWeaveJumps10%On168%RevenueGrowth
#MSCIRemovalMayCurbStrategy’sBitcoinBuying
{spot}(AVGOBUSDT)
$AVGOB
is displaying aggressive bullish momentum, blasting through local resistance with a massive volume expansion. The 1H chart reveals intense buyer absorption, establishing a strong higher-low structure. Momentum is heavily skewed to the upside, primed for a continuation push.
EP: 363.75
TP: 370.00, 378.50, 388.00
SL: 348.00
$AVGOB
#HuangExitNvidiaStrategyInFocus
#ChipStocksExtendLossesAfterNvidiaCEOChange
#AnthropicRejectsIPODelayValuationinQuestion
#CoreWeaveJumps10%On168%RevenueGrowth
#MSCIRemovalMayCurbStrategy’sBitcoinBuying
is displaying aggressive bullish momentum, blasting through local resistance with a massive volume expansion. The 1H chart reveals intense buyer absorption, establishing a strong higher-low structure. Momentum is heavily skewed to the upside, primed for a continuation push.
EP: 363.75
TP: 370.00, 378.50, 388.00
SL: 348.00
$AVGOB
#HuangExitNvidiaStrategyInFocus
#ChipStocksExtendLossesAfterNvidiaCEOChange
#AnthropicRejectsIPODelayValuationinQuestion
#CoreWeaveJumps10%On168%RevenueGrowth
#MSCIRemovalMayCurbStrategy’sBitcoinBuying
2
·
--
උසබ තත්ත්වය
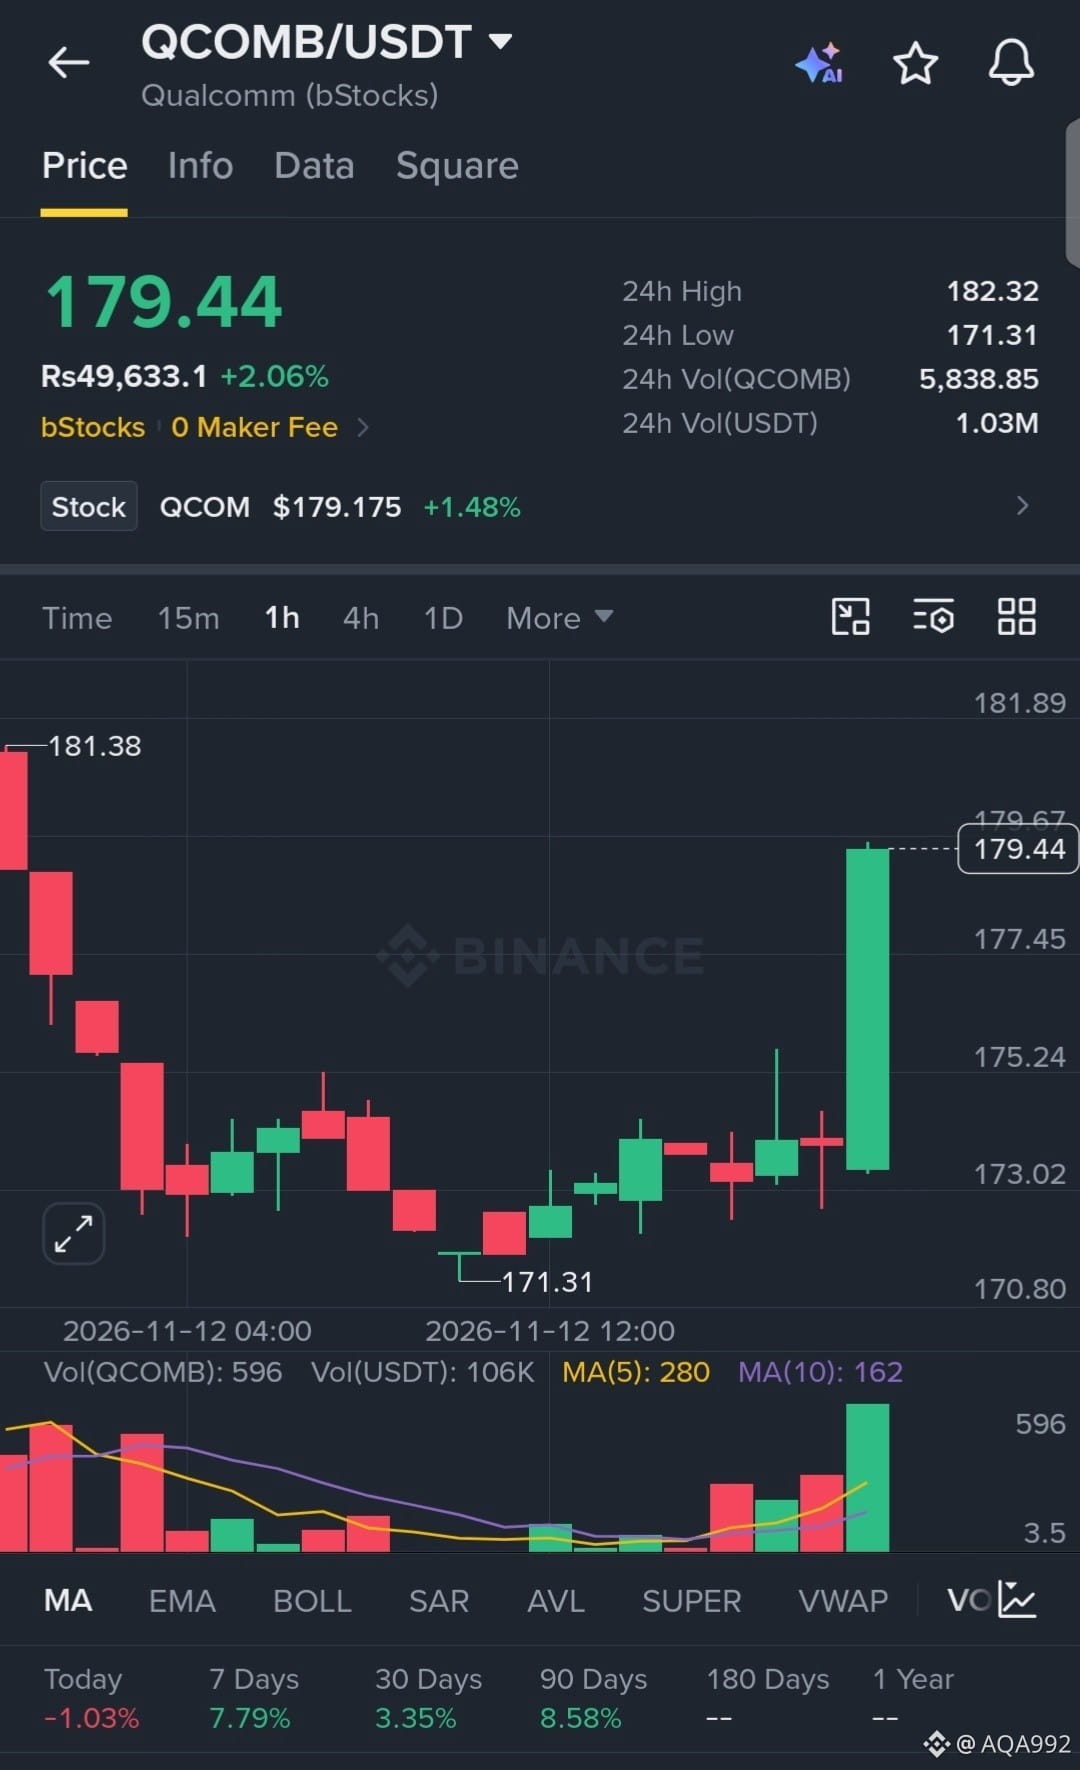
$QCOMB
has aggressively reversed from its local bottom at 171.31, igniting a massive volume expansion that slices straight through resistance. The 1H chart shows intense buyer absorption and a sudden surge in momentum, signaling a high-conviction breakout ready to reclaim previous highs.
EP: 179.44
TP: 182.50, 186.00, 190.00
SL: 172.00
$QCOMB
#HuangExitNvidiaStrategyInFocus
#ChipStocksExtendLossesAfterNvidiaCEOChange
#AnthropicRejectsIPODelayValuationinQuestion
#CoreWeaveJumps10%On168%RevenueGrowth
#MSCIRemovalMayCurbStrategy’sBitcoinBuying
{spot}(QCOMBUSDT)
$QCOMB
has aggressively reversed from its local bottom at 171.31, igniting a massive volume expansion that slices straight through resistance. The 1H chart shows intense buyer absorption and a sudden surge in momentum, signaling a high-conviction breakout ready to reclaim previous highs.
EP: 179.44
TP: 182.50, 186.00, 190.00
SL: 172.00
$QCOMB
#HuangExitNvidiaStrategyInFocus
#ChipStocksExtendLossesAfterNvidiaCEOChange
#AnthropicRejectsIPODelayValuationinQuestion
#CoreWeaveJumps10%On168%RevenueGrowth
#MSCIRemovalMayCurbStrategy’sBitcoinBuying
has aggressively reversed from its local bottom at 171.31, igniting a massive volume expansion that slices straight through resistance. The 1H chart shows intense buyer absorption and a sudden surge in momentum, signaling a high-conviction breakout ready to reclaim previous highs.
EP: 179.44
TP: 182.50, 186.00, 190.00
SL: 172.00
$QCOMB
#HuangExitNvidiaStrategyInFocus
#ChipStocksExtendLossesAfterNvidiaCEOChange
#AnthropicRejectsIPODelayValuationinQuestion
#CoreWeaveJumps10%On168%RevenueGrowth
#MSCIRemovalMayCurbStrategy’sBitcoinBuying
1
·
--
උසබ තත්ත්වය
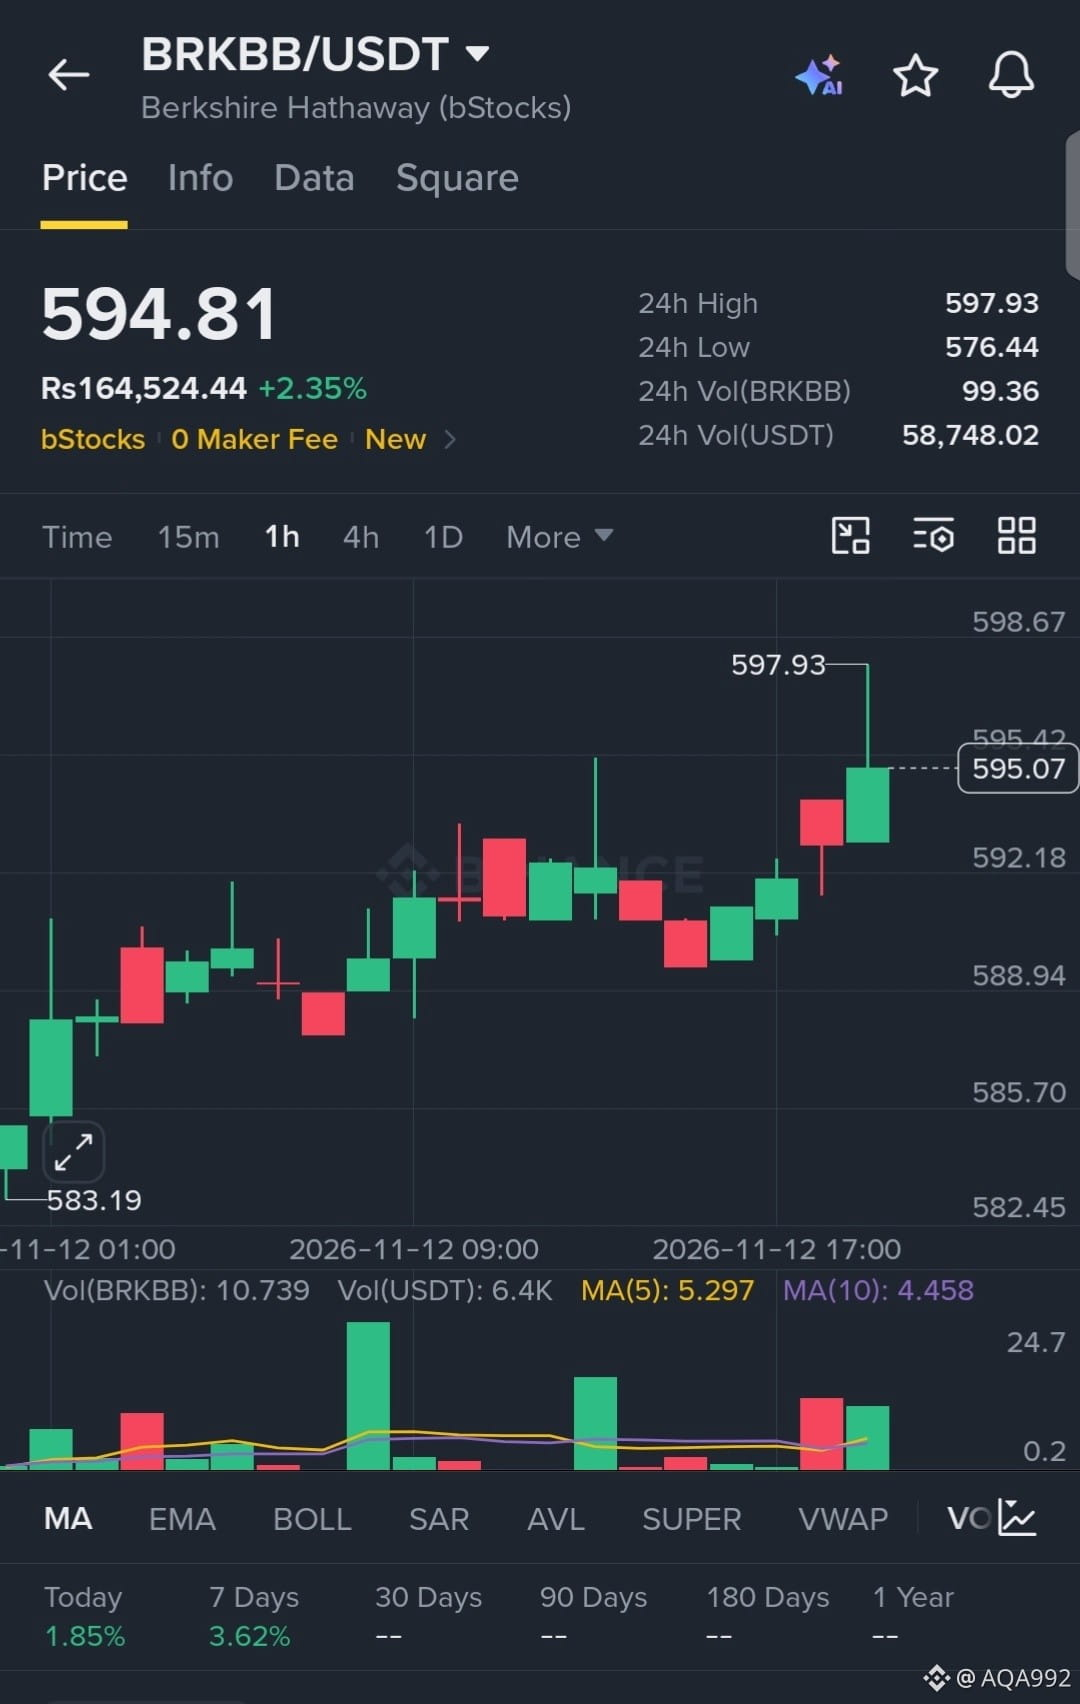
$BRKBB
is establishing a textbook bullish structure, printing clear higher highs and higher lows with steady volume support. The 1H chart shows aggressive buyer absorption on every minor pullback, signaling intense momentum ready to smash through the local high at 597.93.
EP: 594.81
TP: 600.00, 607.50, 615.00
SL: 582.00
$BRKBB
#HuangExitNvidiaStrategyInFocus
#ChipStocksExtendLossesAfterNvidiaCEOChange
#AnthropicRejectsIPODelayValuationinQuestion
#CoreWeaveJumps10%On168%RevenueGrowth
#MSCIRemovalMayCurbStrategy’sBitcoinBuying
{spot}(BRKBBUSDT)
$BRKBB
is establishing a textbook bullish structure, printing clear higher highs and higher lows with steady volume support. The 1H chart shows aggressive buyer absorption on every minor pullback, signaling intense momentum ready to smash through the local high at 597.93.
EP: 594.81
TP: 600.00, 607.50, 615.00
SL: 582.00
$BRKBB
#HuangExitNvidiaStrategyInFocus
#ChipStocksExtendLossesAfterNvidiaCEOChange
#AnthropicRejectsIPODelayValuationinQuestion
#CoreWeaveJumps10%On168%RevenueGrowth
#MSCIRemovalMayCurbStrategy’sBitcoinBuying
is establishing a textbook bullish structure, printing clear higher highs and higher lows with steady volume support. The 1H chart shows aggressive buyer absorption on every minor pullback, signaling intense momentum ready to smash through the local high at 597.93.
EP: 594.81
TP: 600.00, 607.50, 615.00
SL: 582.00
$BRKBB
#HuangExitNvidiaStrategyInFocus
#ChipStocksExtendLossesAfterNvidiaCEOChange
#AnthropicRejectsIPODelayValuationinQuestion
#CoreWeaveJumps10%On168%RevenueGrowth
#MSCIRemovalMayCurbStrategy’sBitcoinBuying
2
තවත් අන්තර්ගතයන් ගවේෂණය කිරීමට ඇතුල් වන්න
Binance චතුරශ්රය හි ගෝලීය ක්රිප්ටෝ පරිශීලකයින් හා එක්වන්න
⚡️ ක්රිප්ටෝ පිළිබඳ නවතම සහ ප්රයෝජනවත් තොරතුරු ලබා ගන්න.
💬 ලොව විශාලතම ක්රිප්ටෝ හුවමාරුව මගින් විශ්වාස කෙරේ.
👍 සත්යායනය කරන ලද නිර්මාණකරුවන්ගෙන් සැබෑ විදසුන් සොයා ගන්න.
විද්යුත් තැපෑල / දුරකථන අංකය
නැගී එන මාතෘකා
HuangExitNvidiaStrategyInFocus
20,356 නැරඹීම්
530 සාකච්ඡා කරමින්
STOCKS | Nvidia’s Jensen Huang Resigns, Colette Kress Named as Interim CEO
Binance News
·13 කැමත්ත දැක්වීම්
·15.1k නැරඹීම්
AnthropicRejectsIPODelayValuationinQuestion
589,551 නැරඹීම්
4,885 සාකච්ඡා කරමින්
BitMineReports$6.3BNetLossForFiscal2026
3,090 නැරඹීම්
77 සාකච්ඡා කරමින්