
Sir Ismail
114 පෝස්ටු

Sir Ismail
වාර්තා කරන්න
පරිශීලක අවහිර කරන්න
Web3 Investor | Writer | Crypto Class of 2020
25 හඹා යමින්
86 හඹා යන්නන්
105 කැමති විය
පෝස්ටු
සියල්ල
උපුටා දැක්වීම්
අමුණා ඇත
·
--
උසබ තත්ත්වය
පරිවර්තනය බලන්න
GM Legends
Good to see $BTC holding well
But the best for me is $DIA today
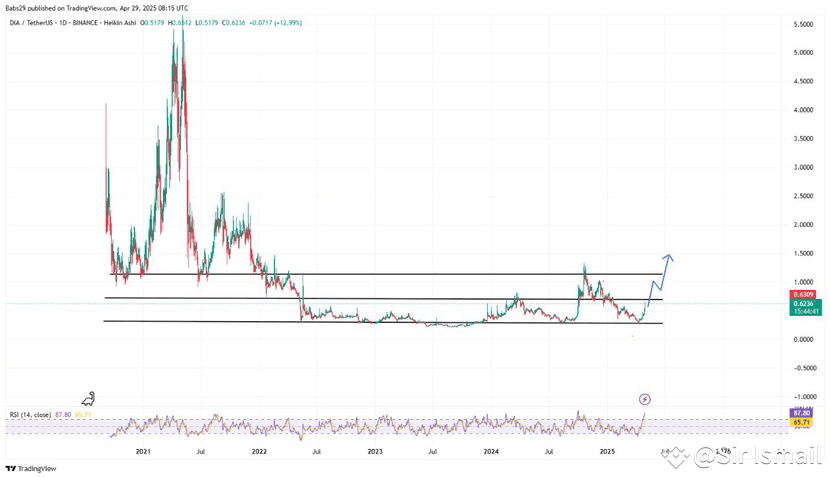
DIA just broke out hard — and this is only the beginning.
✅ RSI exploding
✅ Major resistance flipped
✅ Volume returning
✅ Structure: textbook reversal
RWA narratives are heating up, but DIA isn’t riding the wave — it’s powering it with fully verifiable on-chain data via Lasernet.
This chart is telling you what’s next:
📈 First stop: $1
📈 Then $1.50+ — with potential for full-on price discovery after
“The best time to buy was at support. The second best? When breakout confirms.”
We’re there now.
$DIA is awake.
GM Legends
Good to see $BTC holding well
But the best for me is $DIA today
DIA just broke out hard — and this is only the beginning.
✅ RSI exploding
✅ Major resistance flipped
✅ Volume returning
✅ Structure: textbook reversal
RWA narratives are heating up, but DIA isn’t riding the wave — it’s powering it with fully verifiable on-chain data via Lasernet.
This chart is telling you what’s next:
📈 First stop: $1
📈 Then $1.50+ — with potential for full-on price discovery after
“The best time to buy was at support. The second best? When breakout confirms.”
We’re there now.
$DIA is awake.
Good to see $BTC holding well
But the best for me is $DIA today
DIA just broke out hard — and this is only the beginning.
✅ RSI exploding
✅ Major resistance flipped
✅ Volume returning
✅ Structure: textbook reversal
RWA narratives are heating up, but DIA isn’t riding the wave — it’s powering it with fully verifiable on-chain data via Lasernet.
This chart is telling you what’s next:
📈 First stop: $1
📈 Then $1.50+ — with potential for full-on price discovery after
“The best time to buy was at support. The second best? When breakout confirms.”
We’re there now.
$DIA is awake.
1
2
280
අමුණා ඇත
·
--
පරිවර්තනය බලන්න
Good Morning Fams
Markets still in correction
Don’t Panick and Sell
Be Patient
$SRM $BTC $ETH $AGATA
Good Morning Fams
Markets still in correction
Don’t Panick and Sell
Be Patient
$SRM $BTC $ETH $AGATA
Markets still in correction
Don’t Panick and Sell
Be Patient
$SRM $BTC $ETH $AGATA
4
2.9k
·
--
ලිපිය
පරිවර්තනය බලන්න
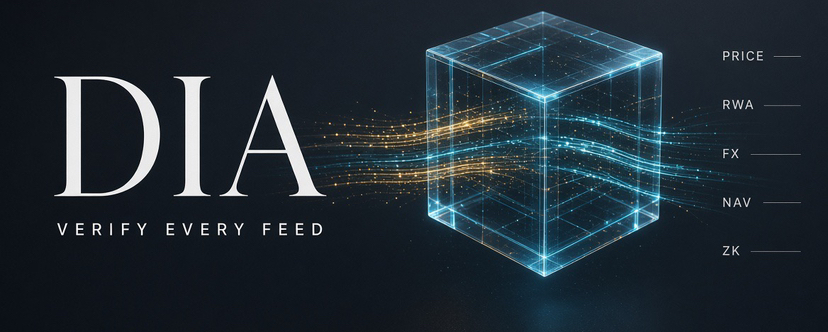
Why $DIA looks well placed for the next phase of onchain financeMost people still treat oracles as “what is BTC trading at?”
That is not the game anymore.
DeFi is expanding into RWAs, tokenized equities, stablecoins, vaults and institutional products. Those markets only work if the data layer is reliable.
That is the $DIA setup.
DIA is not just a price feed.
It covers:
• Crypto price feeds
• RWA data (stocks, FX, commodities, tokenized assets)
• Fundamental feeds for assets that cannot be priced from a thin spot market
• DIA ZK for verifiable offchain data like reserves and NAV
Tokenizing an asset is step one.
Pricing it, valuing it, and proving the numbers onchain is the hard part.
That part is already showing up in live integrations: • Twin Finance and DAMM Capital using DIA oracles for Latin American currencies onchain
• Vetro using DIA Fundamental Feeds to price VUSD and sVUSD
• ST0x using DIA for tokenized equity trading
• Broader DeFi names adding DIA feeds across lending and vault use cases
The simple thesis:
More assets move onchain → more protocols need verifiable data → demand for serious oracle infrastructure grows.
$DIA is sitting across DeFi, RWAs, stables, vaults, tokenized equities and institutional data. That is a bigger market than a single BTC/USD feed.
Execution still matters. Watch integrations, not slogans.
But if onchain finance keeps pulling real-world assets into lending, vaults and settlement, the data layer gets more valuable. DIA is one of the names built for that shift.
$DIA #RWA #DeFi #Oracle
Not financial advice. Do your own research.
Why $DIA looks well placed for the next phase of onchain finance
Most people still treat oracles as “what is BTC trading at?”
That is not the game anymore.
DeFi is expanding into RWAs, tokenized equities, stablecoins, vaults and institutional products. Those markets only work if the data layer is reliable.
That is the $DIA setup.
DIA is not just a price feed.
It covers:
• Crypto price feeds
• RWA data (stocks, FX, commodities, tokenized assets)
• Fundamental feeds for assets that cannot be priced from a thin spot market
• DIA ZK for verifiable offchain data like reserves and NAV
Tokenizing an asset is step one.
Pricing it, valuing it, and proving the numbers onchain is the hard part.
That part is already showing up in live integrations: • Twin Finance and DAMM Capital using DIA oracles for Latin American currencies onchain
• Vetro using DIA Fundamental Feeds to price VUSD and sVUSD
• ST0x using DIA for tokenized equity trading
• Broader DeFi names adding DIA feeds across lending and vault use cases
The simple thesis:
More assets move onchain → more protocols need verifiable data → demand for serious oracle infrastructure grows.
$DIA is sitting across DeFi, RWAs, stables, vaults, tokenized equities and institutional data. That is a bigger market than a single BTC/USD feed.
Execution still matters. Watch integrations, not slogans.
But if onchain finance keeps pulling real-world assets into lending, vaults and settlement, the data layer gets more valuable. DIA is one of the names built for that shift.
$DIA #RWA #DeFi #Oracle
Not financial advice. Do your own research.
That is not the game anymore.
DeFi is expanding into RWAs, tokenized equities, stablecoins, vaults and institutional products. Those markets only work if the data layer is reliable.
That is the $DIA setup.
DIA is not just a price feed.
It covers:
• Crypto price feeds
• RWA data (stocks, FX, commodities, tokenized assets)
• Fundamental feeds for assets that cannot be priced from a thin spot market
• DIA ZK for verifiable offchain data like reserves and NAV
Tokenizing an asset is step one.
Pricing it, valuing it, and proving the numbers onchain is the hard part.
That part is already showing up in live integrations: • Twin Finance and DAMM Capital using DIA oracles for Latin American currencies onchain
• Vetro using DIA Fundamental Feeds to price VUSD and sVUSD
• ST0x using DIA for tokenized equity trading
• Broader DeFi names adding DIA feeds across lending and vault use cases
The simple thesis:
More assets move onchain → more protocols need verifiable data → demand for serious oracle infrastructure grows.
$DIA is sitting across DeFi, RWAs, stables, vaults, tokenized equities and institutional data. That is a bigger market than a single BTC/USD feed.
Execution still matters. Watch integrations, not slogans.
But if onchain finance keeps pulling real-world assets into lending, vaults and settlement, the data layer gets more valuable. DIA is one of the names built for that shift.
$DIA #RWA #DeFi #Oracle
Not financial advice. Do your own research.
128
·
--
උසබ තත්ත්වය
පරිවර්තනය බලන්න
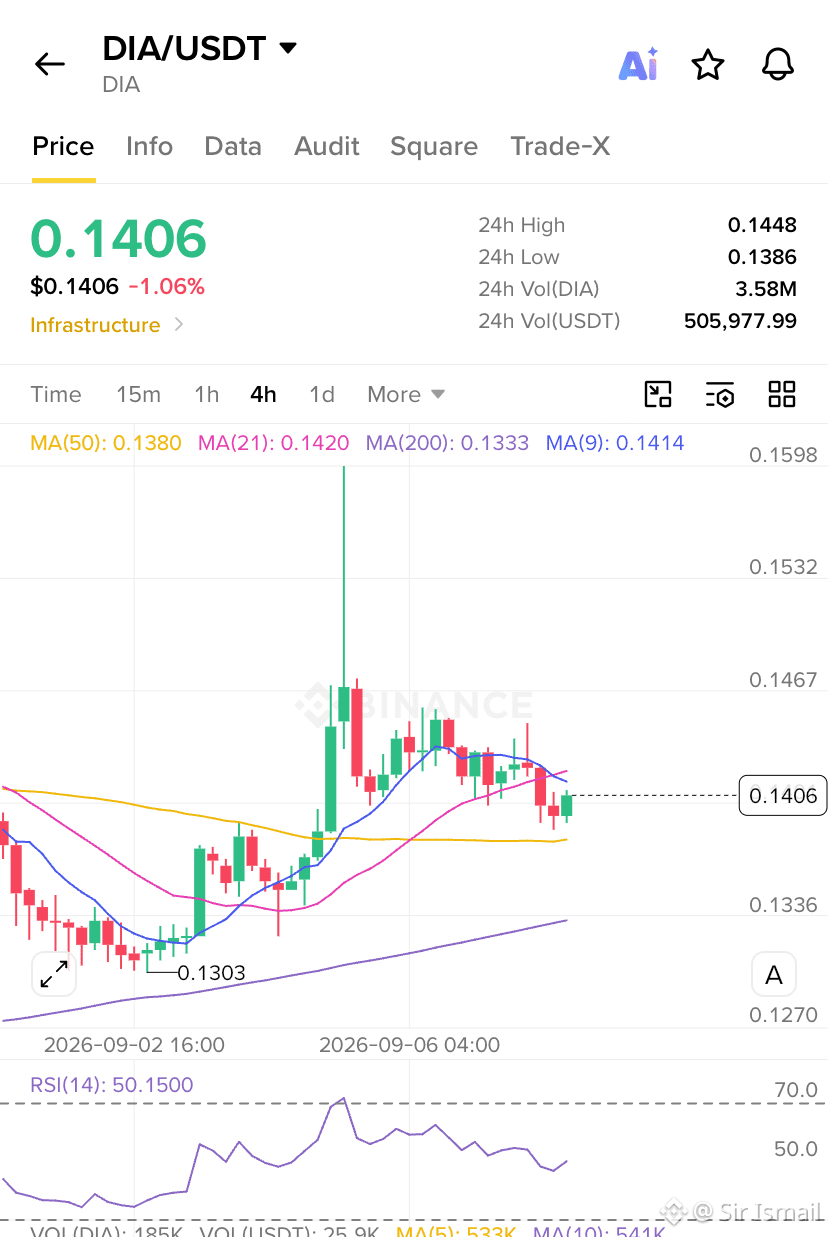
Here’s your $DIA 4H Update
Will keep it simple
Faded the wick and now sitting at $0.1406.
Still above MA50 ($0.1380). RSI reset at 50.
Bull Case: Hold $0.138 + reclaim $0.142–0.145 → $0.147 / wick high
Bear Case: Lose $0.138 → MA200 at $0.133, then $0.130
For now $0.138 is the level boyz.
Here’s your $DIA 4H Update
Will keep it simple
Faded the wick and now sitting at $0.1406.
Still above MA50 ($0.1380). RSI reset at 50.
Bull Case: Hold $0.138 + reclaim $0.142–0.145 → $0.147 / wick high
Bear Case: Lose $0.138 → MA200 at $0.133, then $0.130
For now $0.138 is the level boyz.
Will keep it simple
Faded the wick and now sitting at $0.1406.
Still above MA50 ($0.1380). RSI reset at 50.
Bull Case: Hold $0.138 + reclaim $0.142–0.145 → $0.147 / wick high
Bear Case: Lose $0.138 → MA200 at $0.133, then $0.130
For now $0.138 is the level boyz.
123
·
--
පරිවර්තනය බලන්න
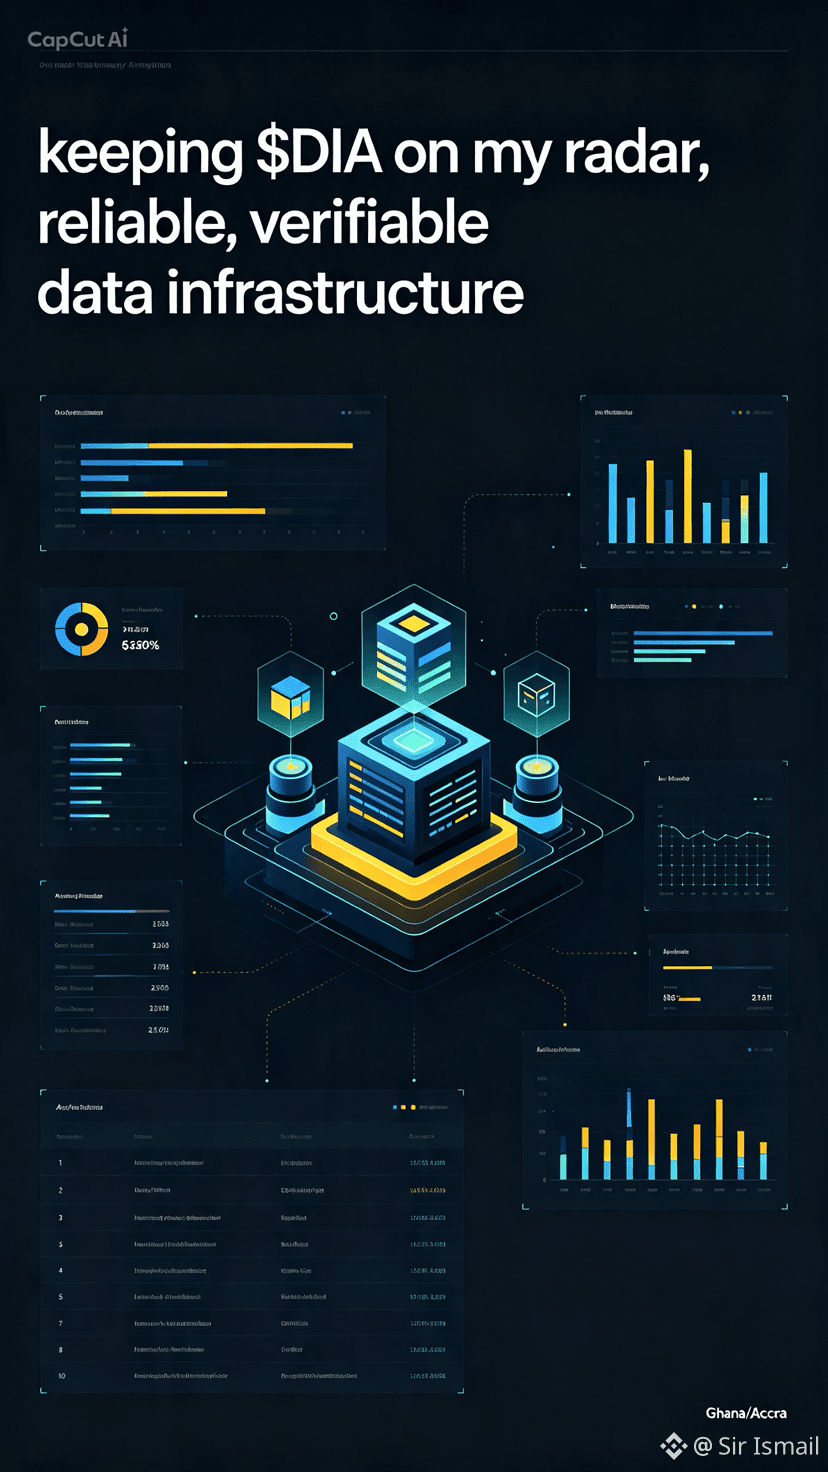
Most people still think of oracles as simple price feeds.
But as DeFi, RWAs and tokenized assets grow, the real opportunity is reliable, verifiable data infrastructure.
That’s where $DIA gets interesting.
From price feeds and fundamental data to RWA and institutional DeFi use cases, DIA is building infrastructure for a more data-driven onchain economy.
The recent integrations are a good reminder that this isn’t just a narrative — the infrastructure is being used.
I’m keeping $DIA on my radar. 👀
Most people still think of oracles as simple price feeds.
But as DeFi, RWAs and tokenized assets grow, the real opportunity is reliable, verifiable data infrastructure.
That’s where $DIA gets interesting.
From price feeds and fundamental data to RWA and institutional DeFi use cases, DIA is building infrastructure for a more data-driven onchain economy.
The recent integrations are a good reminder that this isn’t just a narrative — the infrastructure is being used.
I’m keeping $DIA on my radar. 👀
But as DeFi, RWAs and tokenized assets grow, the real opportunity is reliable, verifiable data infrastructure.
That’s where $DIA gets interesting.
From price feeds and fundamental data to RWA and institutional DeFi use cases, DIA is building infrastructure for a more data-driven onchain economy.
The recent integrations are a good reminder that this isn’t just a narrative — the infrastructure is being used.
I’m keeping $DIA on my radar. 👀
53
·
--
පරිවර්තනය බලන්න
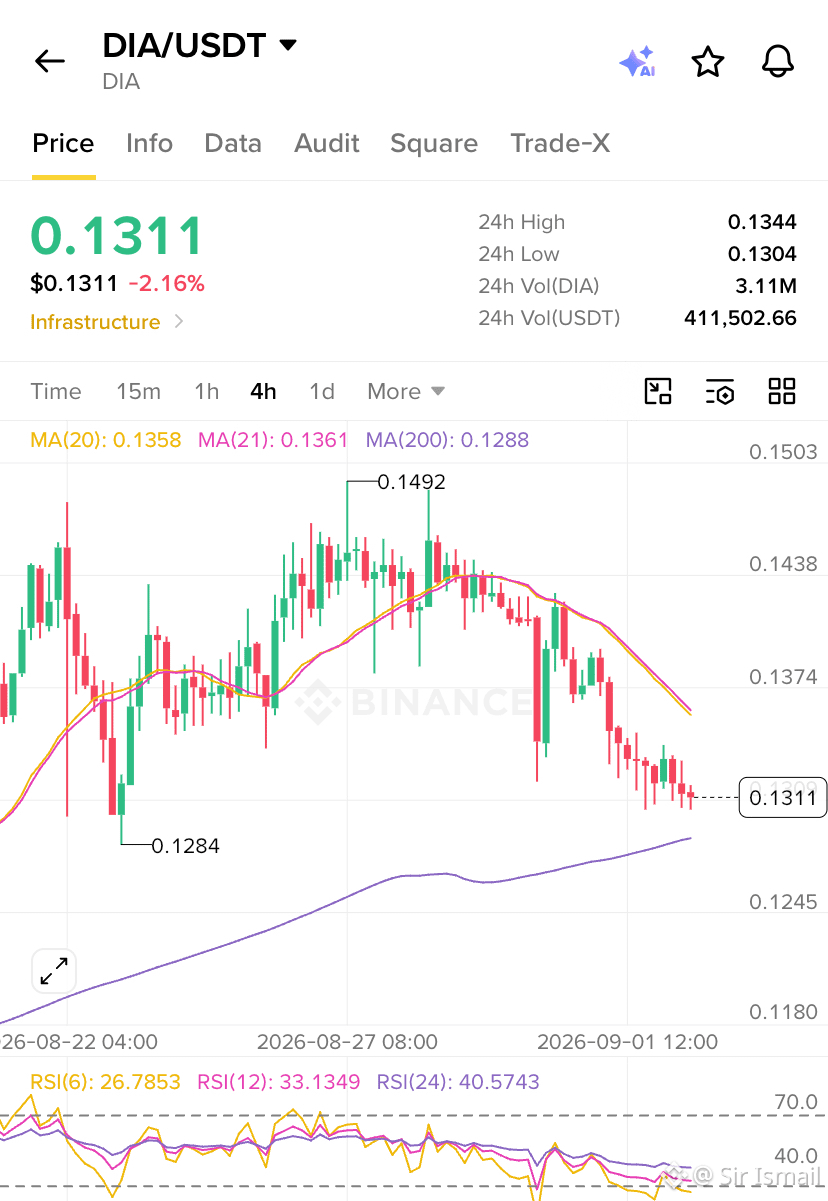
$DIA 4H Update
Will keep it simple
Pullback after the $0.147 rejection.
Holding ~$0.131, still above the prior base.
Bull Case: Hold $0.128–0.130 + reclaim $0.134 → $0.140 back in play
Bear Case: Lose $0.128 → risk of $0.125–0.122
We’re in range for now so $0.128 is the key.
$DIA 4H Update
Will keep it simple
Pullback after the $0.147 rejection.
Holding ~$0.131, still above the prior base.
Bull Case: Hold $0.128–0.130 + reclaim $0.134 → $0.140 back in play
Bear Case: Lose $0.128 → risk of $0.125–0.122
We’re in range for now so $0.128 is the key.
Will keep it simple
Pullback after the $0.147 rejection.
Holding ~$0.131, still above the prior base.
Bull Case: Hold $0.128–0.130 + reclaim $0.134 → $0.140 back in play
Bear Case: Lose $0.128 → risk of $0.125–0.122
We’re in range for now so $0.128 is the key.
105
·
--
උසබ තත්ත්වය
පරිවර්තනය බලන්න
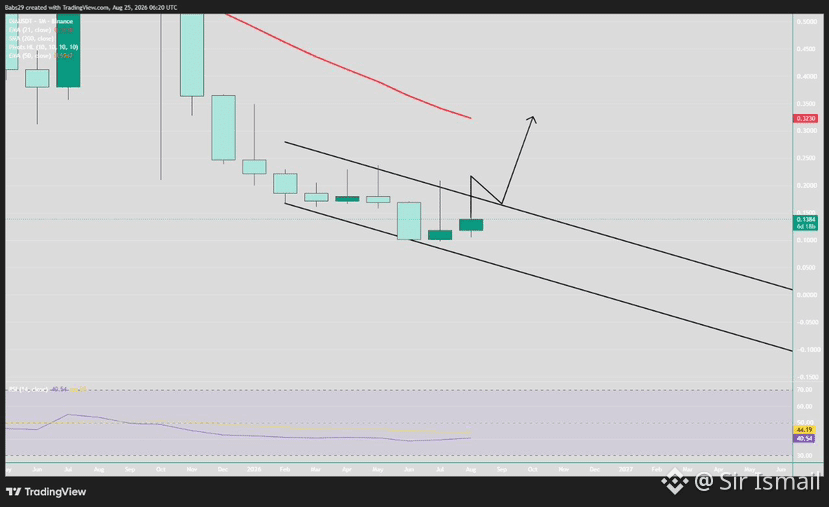
DIA Monthly TA 📈
$DIA is still inside a long-term descending channel but the latest candles show buyers starting to defend the lower area.
* Current: ~$0.138
* Support: $0.10–$0.12
* Resistance: $0.18–$0.20
* Major resistance: $0.323
* RSI: ~40.5 — recovering but not yet bullish.
🟢 Bull case: A breakout above $0.18–$0.20 could confirm a channel breakout and open the way toward $0.25–$0.32.
🔴 Bear case: Losing $0.10 would weaken the setup and could send price toward lower support.
Overall: The monthly chart is still bearish, but a breakout from this channel could create a major trend reversal. $0.18–$0.20 is the level to watch. 🚀
DIA Monthly TA 📈
$DIA is still inside a long-term descending channel but the latest candles show buyers starting to defend the lower area.
* Current: ~$0.138
* Support: $0.10–$0.12
* Resistance: $0.18–$0.20
* Major resistance: $0.323
* RSI: ~40.5 — recovering but not yet bullish.
🟢 Bull case: A breakout above $0.18–$0.20 could confirm a channel breakout and open the way toward $0.25–$0.32.
🔴 Bear case: Losing $0.10 would weaken the setup and could send price toward lower support.
Overall: The monthly chart is still bearish, but a breakout from this channel could create a major trend reversal. $0.18–$0.20 is the level to watch. 🚀
$DIA is still inside a long-term descending channel but the latest candles show buyers starting to defend the lower area.
* Current: ~$0.138
* Support: $0.10–$0.12
* Resistance: $0.18–$0.20
* Major resistance: $0.323
* RSI: ~40.5 — recovering but not yet bullish.
🟢 Bull case: A breakout above $0.18–$0.20 could confirm a channel breakout and open the way toward $0.25–$0.32.
🔴 Bear case: Losing $0.10 would weaken the setup and could send price toward lower support.
Overall: The monthly chart is still bearish, but a breakout from this channel could create a major trend reversal. $0.18–$0.20 is the level to watch. 🚀
89
·
--
උසබ තත්ත්වය
පරිවර්තනය බලන්න
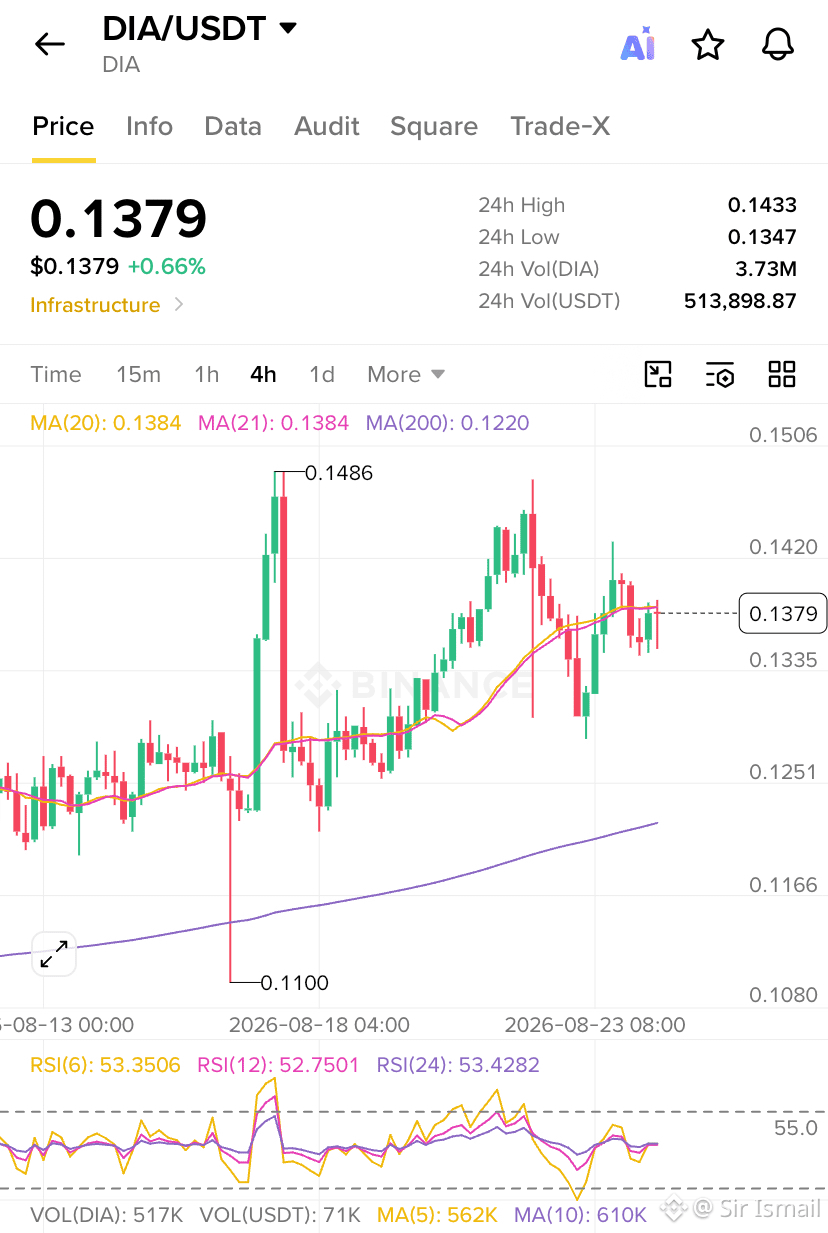
$DIA 4H Update
Still holding above the previous breakout zone ($0.128–0.132).
The 4H shows a mild consolidation after the strong weekly push higher.
Key Levels
• Resistance: 0.140–0.142, then 0.147–0.150
• Support: 0.132–0.134, then 0.125–0.128
Bullish Scenario
Hold above 0.132–0.134 and reclaim 0.140 → next leg toward 0.147–0.150+
Bearish Scenario
Break below 0.132 opens a retest of 0.125–0.128
Structure remains constructive on the higher timeframe.
Short-term it’s digesting gains.
The 0.132–0.134 zone is the key level to watch for continuation or deeper pullback
$DIA 4H Update
Still holding above the previous breakout zone ($0.128–0.132).
The 4H shows a mild consolidation after the strong weekly push higher.
Key Levels
• Resistance: 0.140–0.142, then 0.147–0.150
• Support: 0.132–0.134, then 0.125–0.128
Bullish Scenario
Hold above 0.132–0.134 and reclaim 0.140 → next leg toward 0.147–0.150+
Bearish Scenario
Break below 0.132 opens a retest of 0.125–0.128
Structure remains constructive on the higher timeframe.
Short-term it’s digesting gains.
The 0.132–0.134 zone is the key level to watch for continuation or deeper pullback
Still holding above the previous breakout zone ($0.128–0.132).
The 4H shows a mild consolidation after the strong weekly push higher.
Key Levels
• Resistance: 0.140–0.142, then 0.147–0.150
• Support: 0.132–0.134, then 0.125–0.128
Bullish Scenario
Hold above 0.132–0.134 and reclaim 0.140 → next leg toward 0.147–0.150+
Bearish Scenario
Break below 0.132 opens a retest of 0.125–0.128
Structure remains constructive on the higher timeframe.
Short-term it’s digesting gains.
The 0.132–0.134 zone is the key level to watch for continuation or deeper pullback
110
·
--
උසබ තත්ත්වය
පරිවර්තනය බලන්න
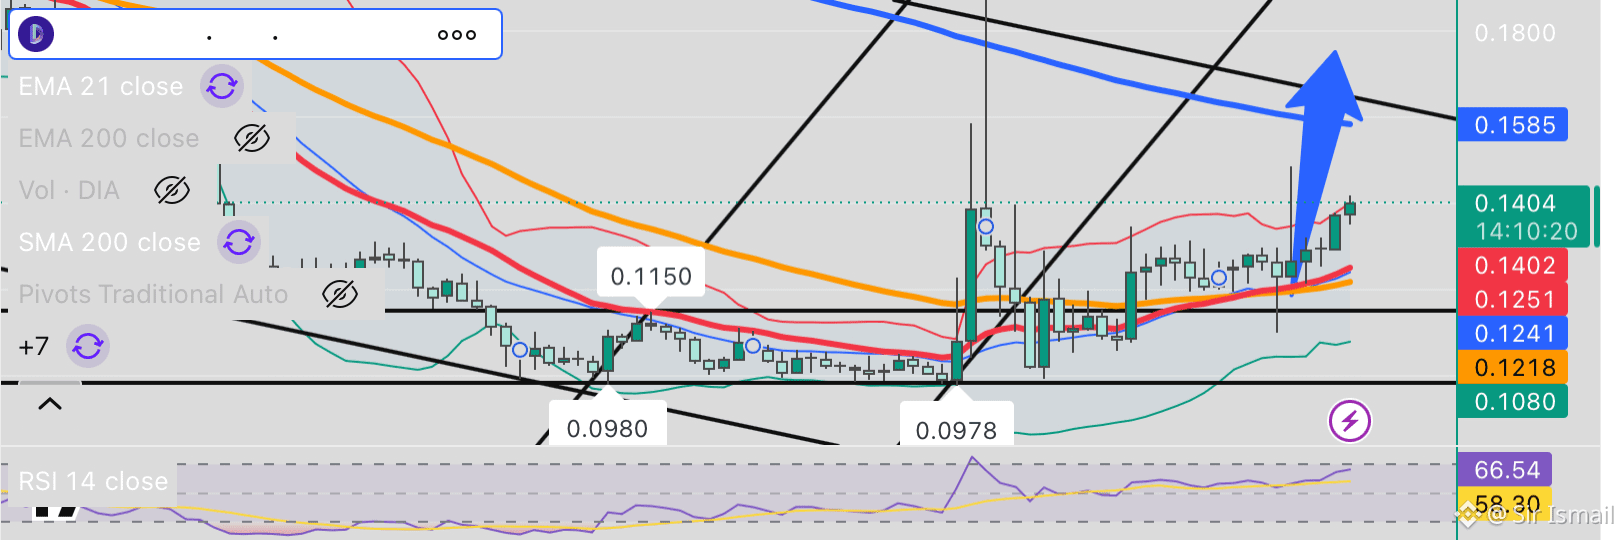
$DIA Daily Update
$DIA is showing a strong bullish structure on the daily chart.
Price is around $0.1404, trading above the 21 EMA (~$0.1402) and well above the 200 MA zone (~$0.124–$0.125).
Bull Case
* Holding above $0.140 keeps short-term momentum bullish.
* RSI is at 66.5 — strong momentum, but not yet deeply overbought.
* A clean break above $0.145–$0.150 could open the path toward $0.1585.
* Reclaiming $0.1585 would be a major breakout signal, potentially targeting $0.17–$0.18.
Bear Case
* Losing $0.140 could trigger a pullback toward $0.125–$0.124, where the major moving-average support sits.
* Below that, $0.1218 becomes the next important level.
Key Levels
Support: $0.140 → $0.125 → $0.1218
Resistance: $0.150 → $0.1585 → $0.170–$0.180
Verdict: 🟢 Bullish while above $0.140.
The trend has shifted significantly in favor of buyers, and the next major test is the $0.1585 resistance zone. A daily close above it could accelerate the move.
$DIA Daily Update
$DIA is showing a strong bullish structure on the daily chart.
Price is around $0.1404, trading above the 21 EMA (~$0.1402) and well above the 200 MA zone (~$0.124–$0.125).
Bull Case
* Holding above $0.140 keeps short-term momentum bullish.
* RSI is at 66.5 — strong momentum, but not yet deeply overbought.
* A clean break above $0.145–$0.150 could open the path toward $0.1585.
* Reclaiming $0.1585 would be a major breakout signal, potentially targeting $0.17–$0.18.
Bear Case
* Losing $0.140 could trigger a pullback toward $0.125–$0.124, where the major moving-average support sits.
* Below that, $0.1218 becomes the next important level.
Key Levels
Support: $0.140 → $0.125 → $0.1218
Resistance: $0.150 → $0.1585 → $0.170–$0.180
Verdict: 🟢 Bullish while above $0.140.
The trend has shifted significantly in favor of buyers, and the next major test is the $0.1585 resistance zone. A daily close above it could accelerate the move.
$DIA is showing a strong bullish structure on the daily chart.
Price is around $0.1404, trading above the 21 EMA (~$0.1402) and well above the 200 MA zone (~$0.124–$0.125).
Bull Case
* Holding above $0.140 keeps short-term momentum bullish.
* RSI is at 66.5 — strong momentum, but not yet deeply overbought.
* A clean break above $0.145–$0.150 could open the path toward $0.1585.
* Reclaiming $0.1585 would be a major breakout signal, potentially targeting $0.17–$0.18.
Bear Case
* Losing $0.140 could trigger a pullback toward $0.125–$0.124, where the major moving-average support sits.
* Below that, $0.1218 becomes the next important level.
Key Levels
Support: $0.140 → $0.125 → $0.1218
Resistance: $0.150 → $0.1585 → $0.170–$0.180
Verdict: 🟢 Bullish while above $0.140.
The trend has shifted significantly in favor of buyers, and the next major test is the $0.1585 resistance zone. A daily close above it could accelerate the move.
67
·
--
පරිවර්තනය බලන්න
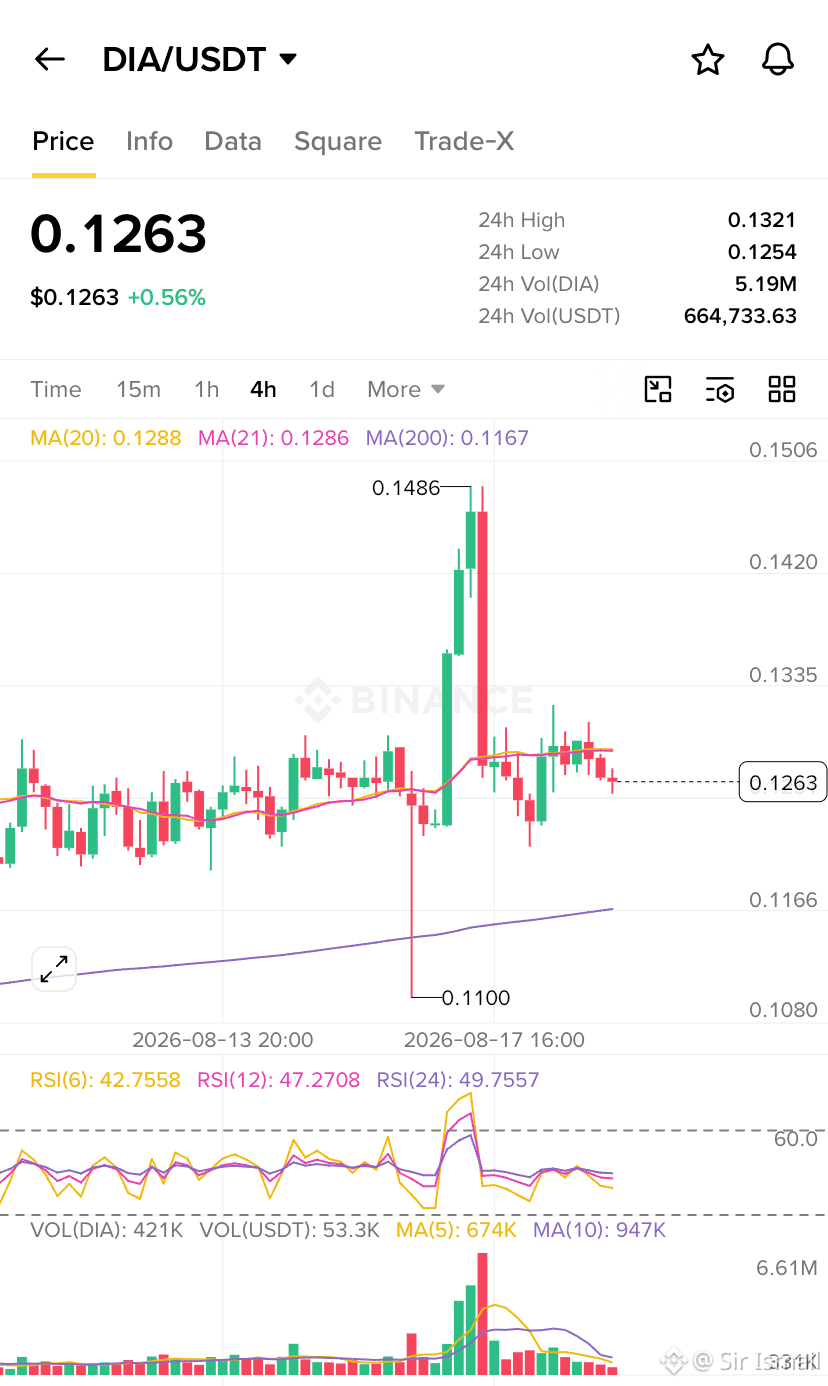
$DIA 4H Update
DIA is still moving inside the range but buyers continue defending the lower levels.
Price is around $0.127 after testing the $0.130–$0.131 area.
Bullish Scenario
Hold $0.123–$0.125 and break cleanly above $0.130.
That could open the path toward:
🎯 $0.135
🎯 $0.140+
🔴 Bearish Scenario
Lose $0.123 and the next area to watch becomes $0.118–$0.120.
What’s your bias?
$DIA 4H Update
DIA is still moving inside the range but buyers continue defending the lower levels.
Price is around $0.127 after testing the $0.130–$0.131 area.
Bullish Scenario
Hold $0.123–$0.125 and break cleanly above $0.130.
That could open the path toward:
🎯 $0.135
🎯 $0.140+
🔴 Bearish Scenario
Lose $0.123 and the next area to watch becomes $0.118–$0.120.
What’s your bias?
DIA is still moving inside the range but buyers continue defending the lower levels.
Price is around $0.127 after testing the $0.130–$0.131 area.
Bullish Scenario
Hold $0.123–$0.125 and break cleanly above $0.130.
That could open the path toward:
🎯 $0.135
🎯 $0.140+
🔴 Bearish Scenario
Lose $0.123 and the next area to watch becomes $0.118–$0.120.
What’s your bias?
77
·
--
උසබ තත්ත්වය
පරිවර්තනය බලන්න
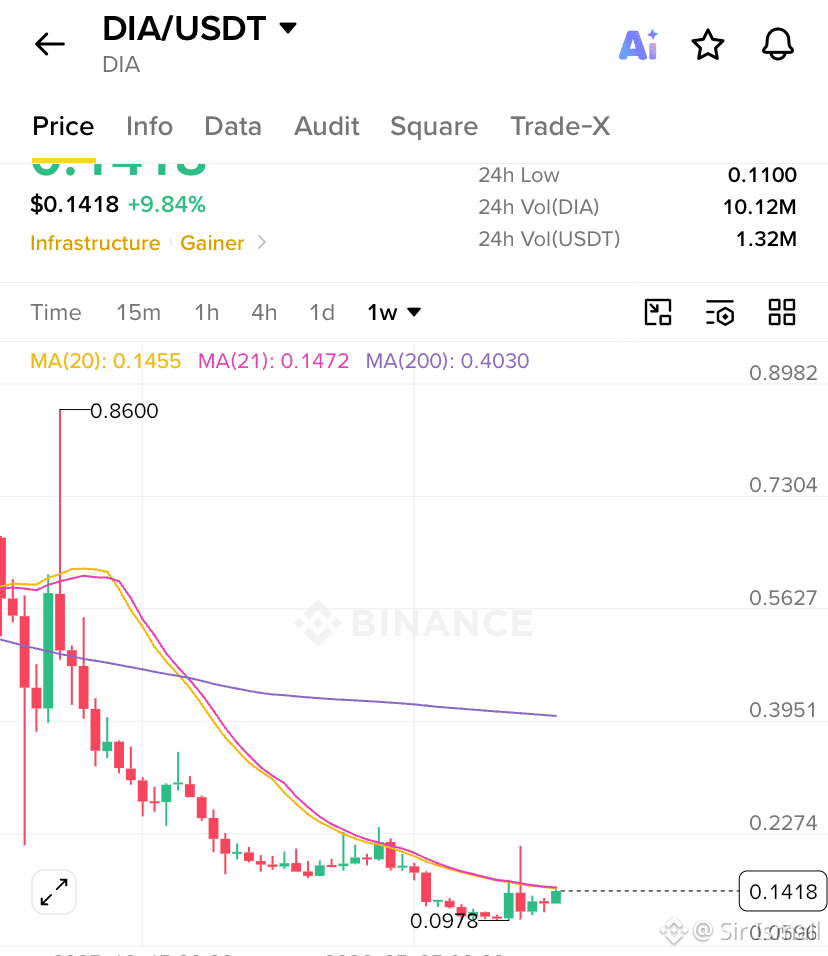
Here’s your $DIA weekly update
$DIA remains in a consolidation / recovery phase on the weekly timeframe.
After the sharp late-July spike and subsequent pullback, price bounced from the $0.105–0.110 zone and has been range-bound between roughly $0.118–0.130 for the past 1–2 weeks.
Current price sits around $0.123–0.125.
The weekly candle is showing indecision after the earlier recovery move.
Bullish Scenario
• Hold the 0.118–0.120 zone and reclaim 0.128–0.132 with conviction.
• Targets: 0.140 → 0.150+
• Sustained higher lows on the weekly would strengthen the recovery structure.
Bearish Scenario
• Failure at 0.128–0.132 followed by a break below 0.118–0.120.
• Targets: 0.110 → 0.100–0.105
• Loss of the current base would reopen downside toward the July lows.
Let’s see how this week plays out
Here’s your $DIA weekly update
$DIA remains in a consolidation / recovery phase on the weekly timeframe.
After the sharp late-July spike and subsequent pullback, price bounced from the $0.105–0.110 zone and has been range-bound between roughly $0.118–0.130 for the past 1–2 weeks.
Current price sits around $0.123–0.125.
The weekly candle is showing indecision after the earlier recovery move.
Bullish Scenario
• Hold the 0.118–0.120 zone and reclaim 0.128–0.132 with conviction.
• Targets: 0.140 → 0.150+
• Sustained higher lows on the weekly would strengthen the recovery structure.
Bearish Scenario
• Failure at 0.128–0.132 followed by a break below 0.118–0.120.
• Targets: 0.110 → 0.100–0.105
• Loss of the current base would reopen downside toward the July lows.
Let’s see how this week plays out
$DIA remains in a consolidation / recovery phase on the weekly timeframe.
After the sharp late-July spike and subsequent pullback, price bounced from the $0.105–0.110 zone and has been range-bound between roughly $0.118–0.130 for the past 1–2 weeks.
Current price sits around $0.123–0.125.
The weekly candle is showing indecision after the earlier recovery move.
Bullish Scenario
• Hold the 0.118–0.120 zone and reclaim 0.128–0.132 with conviction.
• Targets: 0.140 → 0.150+
• Sustained higher lows on the weekly would strengthen the recovery structure.
Bearish Scenario
• Failure at 0.128–0.132 followed by a break below 0.118–0.120.
• Targets: 0.110 → 0.100–0.105
• Loss of the current base would reopen downside toward the July lows.
Let’s see how this week plays out
103
·
--
උසබ තත්ත්වය
පරිවර්තනය බලන්න
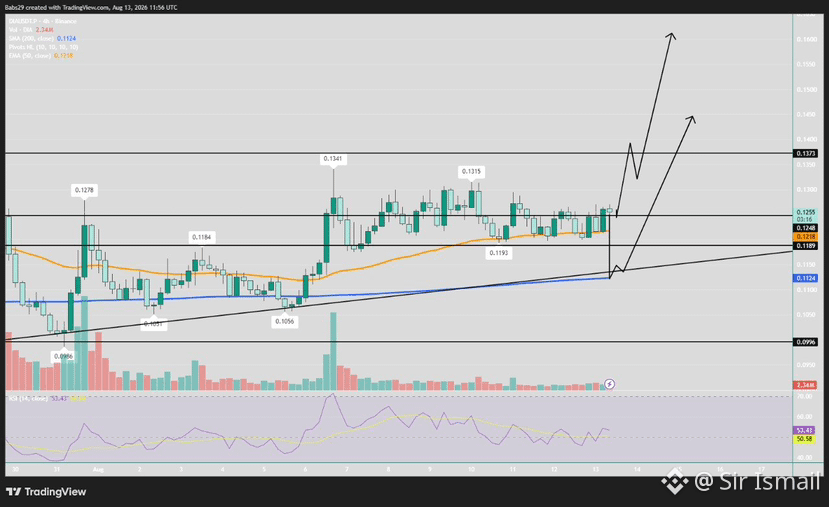
$DIA Update
DIA is quietly getting interesting.
Price is holding around $0.125, above both the 50 EMA ($0.1218) and 200 SMA ($0.1124), while RSI has pushed back above 50.
Momentum is starting to favor the bulls.
🟢 Bullish Case
Hold $0.1189–$0.1218 and reclaim $0.1373.
That could open the path toward:
🎯 $0.145
🎯 $0.160
🔴 Bearish Case
Lose $0.1189 and we could revisit $0.1124.
Below that, $0.0996 becomes the major support to watch.
For now, I’m cautiously bullish as long as DIA stays above $0.119.
But $0.1373 is the real level.
Break it cleanly and the chart gets a whole lot more interesting.
$DIA Update
DIA is quietly getting interesting.
Price is holding around $0.125, above both the 50 EMA ($0.1218) and 200 SMA ($0.1124), while RSI has pushed back above 50.
Momentum is starting to favor the bulls.
🟢 Bullish Case
Hold $0.1189–$0.1218 and reclaim $0.1373.
That could open the path toward:
🎯 $0.145
🎯 $0.160
🔴 Bearish Case
Lose $0.1189 and we could revisit $0.1124.
Below that, $0.0996 becomes the major support to watch.
For now, I’m cautiously bullish as long as DIA stays above $0.119.
But $0.1373 is the real level.
Break it cleanly and the chart gets a whole lot more interesting.
DIA is quietly getting interesting.
Price is holding around $0.125, above both the 50 EMA ($0.1218) and 200 SMA ($0.1124), while RSI has pushed back above 50.
Momentum is starting to favor the bulls.
🟢 Bullish Case
Hold $0.1189–$0.1218 and reclaim $0.1373.
That could open the path toward:
🎯 $0.145
🎯 $0.160
🔴 Bearish Case
Lose $0.1189 and we could revisit $0.1124.
Below that, $0.0996 becomes the major support to watch.
For now, I’m cautiously bullish as long as DIA stays above $0.119.
But $0.1373 is the real level.
Break it cleanly and the chart gets a whole lot more interesting.
87
·
--
උසබ තත්ත්වය
පරිවර්තනය බලන්න
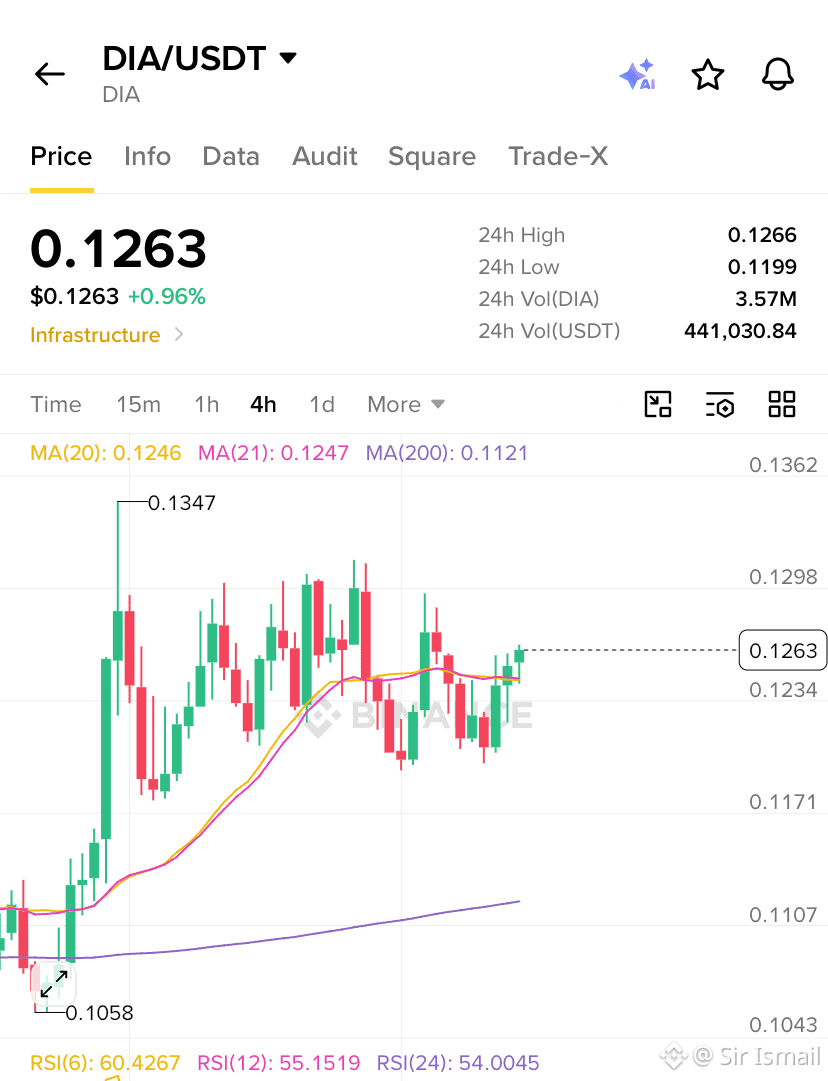
$DIA 4H Chart Update
The recent pump has cooled down, and DIA is now building a tight consolidation range.
Current battlefield:
🟢 Support: $0.118–$0.120
🔵 Pivot: $0.122–$0.125
🔴 Resistance: $0.128–$0.130
The setup is straightforward.
Hold support + reclaim resistance = $0.135 → $0.140+
Lose support = $0.112 → $0.105–$0.108
Volume has dropped during the consolidation, so I’m waiting for expansion before expecting the next major move.
The bulls still have a chance to continue the recovery.
Eyes on the breakout.
$DIA 4H Chart Update
The recent pump has cooled down, and DIA is now building a tight consolidation range.
Current battlefield:
🟢 Support: $0.118–$0.120
🔵 Pivot: $0.122–$0.125
🔴 Resistance: $0.128–$0.130
The setup is straightforward.
Hold support + reclaim resistance = $0.135 → $0.140+
Lose support = $0.112 → $0.105–$0.108
Volume has dropped during the consolidation, so I’m waiting for expansion before expecting the next major move.
The bulls still have a chance to continue the recovery.
Eyes on the breakout.
The recent pump has cooled down, and DIA is now building a tight consolidation range.
Current battlefield:
🟢 Support: $0.118–$0.120
🔵 Pivot: $0.122–$0.125
🔴 Resistance: $0.128–$0.130
The setup is straightforward.
Hold support + reclaim resistance = $0.135 → $0.140+
Lose support = $0.112 → $0.105–$0.108
Volume has dropped during the consolidation, so I’m waiting for expansion before expecting the next major move.
The bulls still have a chance to continue the recovery.
Eyes on the breakout.
156
·
--
උසබ තත්ත්වය
පරිවර්තනය බලන්න
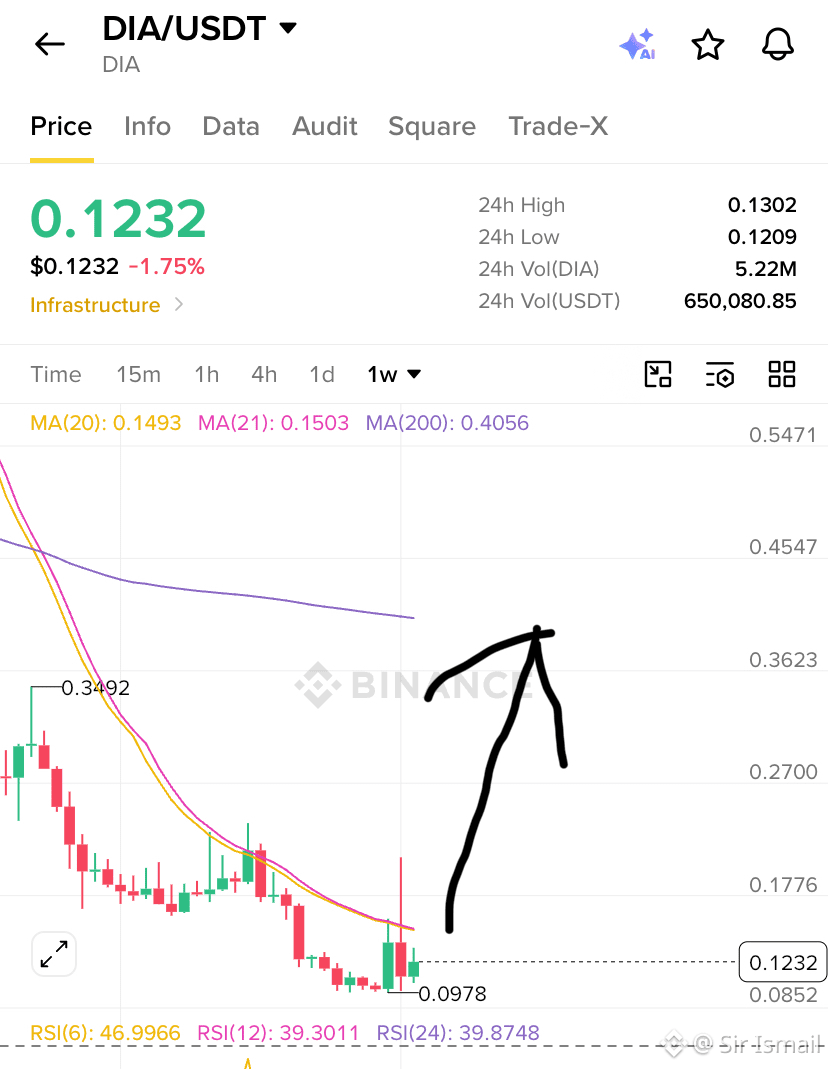
$DIA Weekly Chart Update
From $0.105 to the current $0.124–$0.126 range.
That’s a meaningful recovery imo.
Now we’re approaching first major hurdle at $0.128–$0.132.
Break above it → $0.140 → $0.150–$0.160
Hold $0.118–$0.120 → recovery structure remains intact
Lose $0.118 → $0.110 becomes the next area to watch
The bigger trend is still recovering so confirmation matters.
But if DIA keeps printing higher weekly lows and eventually reclaims $0.140+, this starts looking less like a relief bounce and more like a genuine trend shift.
Eyes on the next breakout. 👀🚀
$DIA Weekly Chart Update
From $0.105 to the current $0.124–$0.126 range.
That’s a meaningful recovery imo.
Now we’re approaching first major hurdle at $0.128–$0.132.
Break above it → $0.140 → $0.150–$0.160
Hold $0.118–$0.120 → recovery structure remains intact
Lose $0.118 → $0.110 becomes the next area to watch
The bigger trend is still recovering so confirmation matters.
But if DIA keeps printing higher weekly lows and eventually reclaims $0.140+, this starts looking less like a relief bounce and more like a genuine trend shift.
Eyes on the next breakout. 👀🚀
From $0.105 to the current $0.124–$0.126 range.
That’s a meaningful recovery imo.
Now we’re approaching first major hurdle at $0.128–$0.132.
Break above it → $0.140 → $0.150–$0.160
Hold $0.118–$0.120 → recovery structure remains intact
Lose $0.118 → $0.110 becomes the next area to watch
The bigger trend is still recovering so confirmation matters.
But if DIA keeps printing higher weekly lows and eventually reclaims $0.140+, this starts looking less like a relief bounce and more like a genuine trend shift.
Eyes on the next breakout. 👀🚀
475
·
--
පරිවර්තනය බලන්න
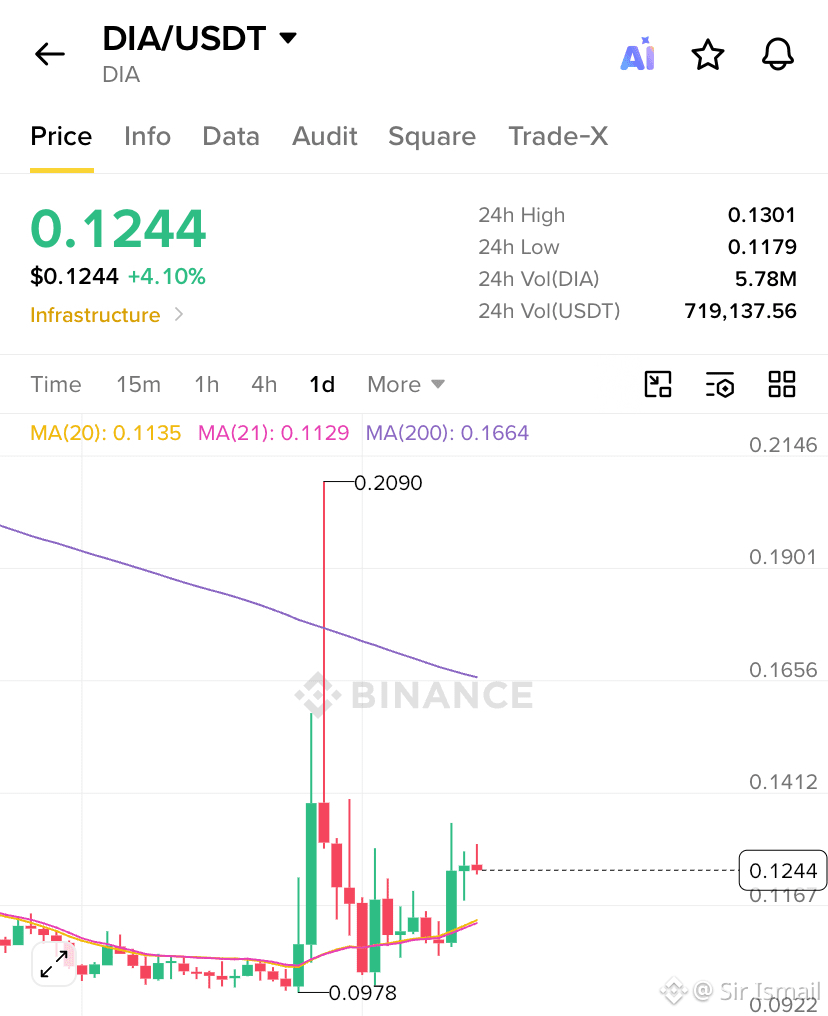
$DIA Daily Update
$DIA is showing a solid recovery after the post-July pump correction.
• Current price: ~$0.123–0.126
• Strong green candle on Aug 6 pushed price from ~0.108 up toward 0.133 before consolidating
• Holding above the recent base around 0.105–0.11
Key Levels
• Resistance: 0.128–0.132, then 0.140
• Support: 0.118–0.120, then 0.110–0.108
I’m Short-term bullish as long as price holds above 0.118–0.120.
A clean break above 0.128–0.132 would open room for another leg higher toward 0.140+.
Still well below the major longer-term moving averages so this remains a recovery bounce within the broader downtrend structure but momentum has clearly improved on the daily.
$DIA Daily Update
$DIA is showing a solid recovery after the post-July pump correction.
• Current price: ~$0.123–0.126
• Strong green candle on Aug 6 pushed price from ~0.108 up toward 0.133 before consolidating
• Holding above the recent base around 0.105–0.11
Key Levels
• Resistance: 0.128–0.132, then 0.140
• Support: 0.118–0.120, then 0.110–0.108
I’m Short-term bullish as long as price holds above 0.118–0.120.
A clean break above 0.128–0.132 would open room for another leg higher toward 0.140+.
Still well below the major longer-term moving averages so this remains a recovery bounce within the broader downtrend structure but momentum has clearly improved on the daily.
$DIA is showing a solid recovery after the post-July pump correction.
• Current price: ~$0.123–0.126
• Strong green candle on Aug 6 pushed price from ~0.108 up toward 0.133 before consolidating
• Holding above the recent base around 0.105–0.11
Key Levels
• Resistance: 0.128–0.132, then 0.140
• Support: 0.118–0.120, then 0.110–0.108
I’m Short-term bullish as long as price holds above 0.118–0.120.
A clean break above 0.128–0.132 would open room for another leg higher toward 0.140+.
Still well below the major longer-term moving averages so this remains a recovery bounce within the broader downtrend structure but momentum has clearly improved on the daily.
1
1
155
·
--
උසබ තත්ත්වය
පරිවර්තනය බලන්න
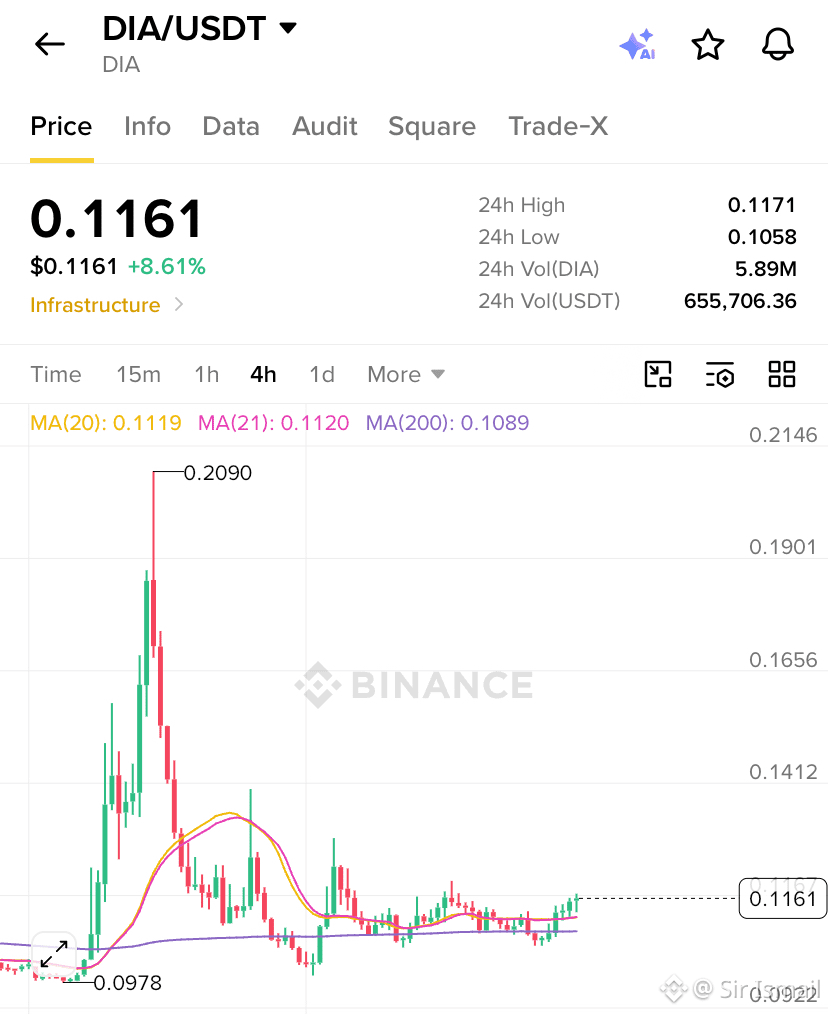
DIAUSDT 4H Update
$DIA continues to consolidate after the sharp late-July rally and subsequent correction. Price is currently trading in the $0.107–0.114 range, with a mild bounce off the recent lows near 0.106.
The 4H still shows a cooling phase — lower highs since the peak, but buyers are defending the 0.105–0.108 zone so far.
Bullish Scenario
• Hold above 0.105–0.108 and push through 0.114–0.116 with volume.
• Targets: 0.120 → 0.125–0.130
• A sustained reclaim of the 0.115 area would improve the short-term structure and open room for a recovery leg.
Bearish Scenario
• Rejection at 0.114–0.116 and loss of 0.105–0.108 support.
• Targets: 0.100 → 0.095–0.098
• Failure to hold the current base keeps the correction alive.
Bulls need a clean break above 0.114–0.116 for momentum to shift higher #otherwise, range-bound or lower remains the more likely path in the short term.
DIAUSDT 4H Update
$DIA continues to consolidate after the sharp late-July rally and subsequent correction. Price is currently trading in the $0.107–0.114 range, with a mild bounce off the recent lows near 0.106.
The 4H still shows a cooling phase — lower highs since the peak, but buyers are defending the 0.105–0.108 zone so far.
Bullish Scenario
• Hold above 0.105–0.108 and push through 0.114–0.116 with volume.
• Targets: 0.120 → 0.125–0.130
• A sustained reclaim of the 0.115 area would improve the short-term structure and open room for a recovery leg.
Bearish Scenario
• Rejection at 0.114–0.116 and loss of 0.105–0.108 support.
• Targets: 0.100 → 0.095–0.098
• Failure to hold the current base keeps the correction alive.
Bulls need a clean break above 0.114–0.116 for momentum to shift higher #otherwise, range-bound or lower remains the more likely path in the short term.
$DIA continues to consolidate after the sharp late-July rally and subsequent correction. Price is currently trading in the $0.107–0.114 range, with a mild bounce off the recent lows near 0.106.
The 4H still shows a cooling phase — lower highs since the peak, but buyers are defending the 0.105–0.108 zone so far.
Bullish Scenario
• Hold above 0.105–0.108 and push through 0.114–0.116 with volume.
• Targets: 0.120 → 0.125–0.130
• A sustained reclaim of the 0.115 area would improve the short-term structure and open room for a recovery leg.
Bearish Scenario
• Rejection at 0.114–0.116 and loss of 0.105–0.108 support.
• Targets: 0.100 → 0.095–0.098
• Failure to hold the current base keeps the correction alive.
Bulls need a clean break above 0.114–0.116 for momentum to shift higher #otherwise, range-bound or lower remains the more likely path in the short term.
154
·
--
උසබ තත්ත්වය
පරිවර්තනය බලන්න
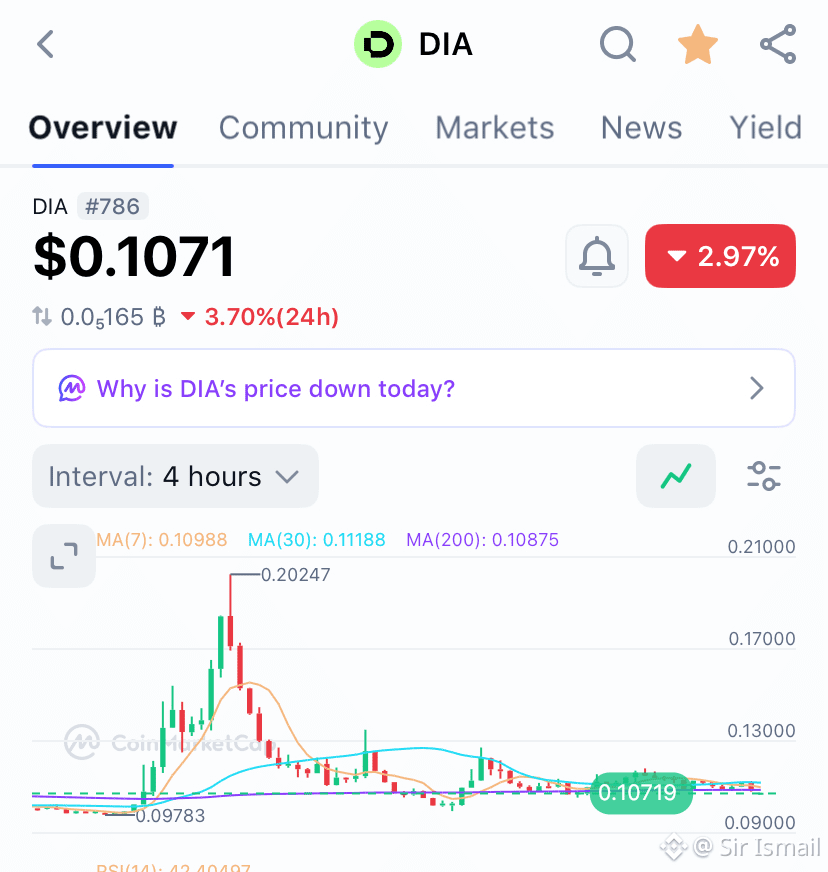
Here’s a quick $DIA update
After the strong late-July pump, price is cooling in the 0.106–0.115 range.
Bull Case: Hold 0.105–0.108 and reclaim 0.112–0.115 → targets 0.120 then 0.130+.
Bear Case: Break below 0.105 keeps pressure toward 0.100–0.098.
Still in correction mode so confirmation needed.
What’s your bias on $DIA? 👀
{future}(DIAUSDT)
Here’s a quick $DIA update
After the strong late-July pump, price is cooling in the 0.106–0.115 range.
Bull Case: Hold 0.105–0.108 and reclaim 0.112–0.115 → targets 0.120 then 0.130+.
Bear Case: Break below 0.105 keeps pressure toward 0.100–0.098.
Still in correction mode so confirmation needed.
What’s your bias on $DIA ? 👀
After the strong late-July pump, price is cooling in the 0.106–0.115 range.
Bull Case: Hold 0.105–0.108 and reclaim 0.112–0.115 → targets 0.120 then 0.130+.
Bear Case: Break below 0.105 keeps pressure toward 0.100–0.098.
Still in correction mode so confirmation needed.
What’s your bias on $DIA ? 👀
161
·
--
උසබ තත්ත්වය
පරිවර්තනය බලන්න
Taking a $BTC long within the range of $63000 ~ $61000 with probably 5X won’t be bad at this point.
The bulls looks ready to step again
Position accordingly
{future}(BTCUSDT)
Taking a $BTC long within the range of $63000 ~ $61000 with probably 5X won’t be bad at this point.
The bulls looks ready to step again
Position accordingly
The bulls looks ready to step again
Position accordingly
66
·
--
උසබ තත්ත්වය
පරිවර්තනය බලන්න
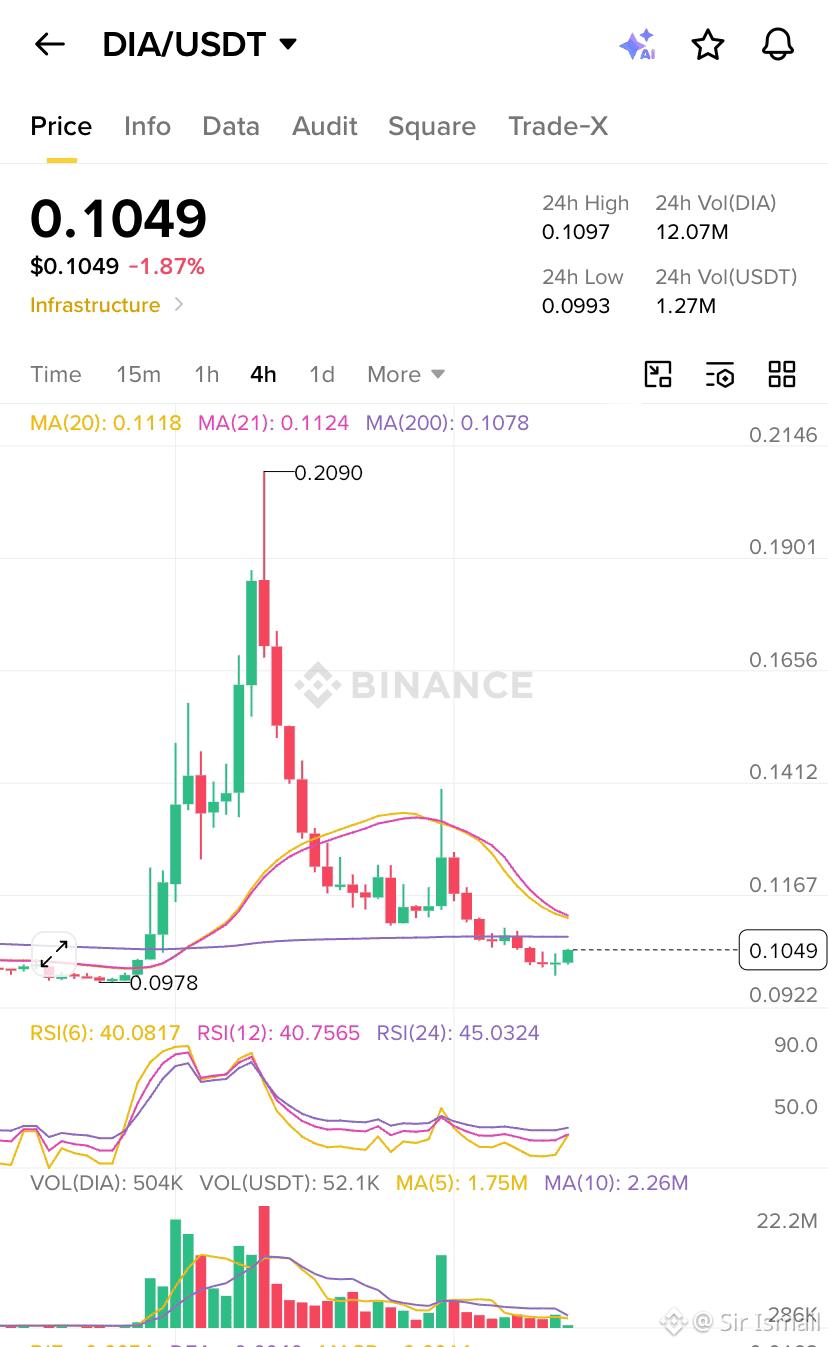
Price is temporary.
Infrastructure is forever.
That’s why I’m still bullish on $DIA
The team continues delivering exactly what institutional DeFi needs:
• Intrinsic pricing with DIA Value
• Verifiable reserves using ZK proofs
• Transparent oracle infrastructure
• Solutions for stablecoins and Real World Assets across multiple chains
The chart may look weak in the short term, but the fundamentals continue getting stronger.
To me, this looks more like an accumulation phase than a reason to lose conviction.
Long-term mindset wins. 📈🚀
Price is temporary.
Infrastructure is forever.
That’s why I’m still bullish on $DIA
The team continues delivering exactly what institutional DeFi needs:
• Intrinsic pricing with DIA Value
• Verifiable reserves using ZK proofs
• Transparent oracle infrastructure
• Solutions for stablecoins and Real World Assets across multiple chains
The chart may look weak in the short term, but the fundamentals continue getting stronger.
To me, this looks more like an accumulation phase than a reason to lose conviction.
Long-term mindset wins. 📈🚀
Infrastructure is forever.
That’s why I’m still bullish on $DIA
The team continues delivering exactly what institutional DeFi needs:
• Intrinsic pricing with DIA Value
• Verifiable reserves using ZK proofs
• Transparent oracle infrastructure
• Solutions for stablecoins and Real World Assets across multiple chains
The chart may look weak in the short term, but the fundamentals continue getting stronger.
To me, this looks more like an accumulation phase than a reason to lose conviction.
Long-term mindset wins. 📈🚀
1
206
·
--
උසබ තත්ත්වය
පරිවර්තනය බලන්න
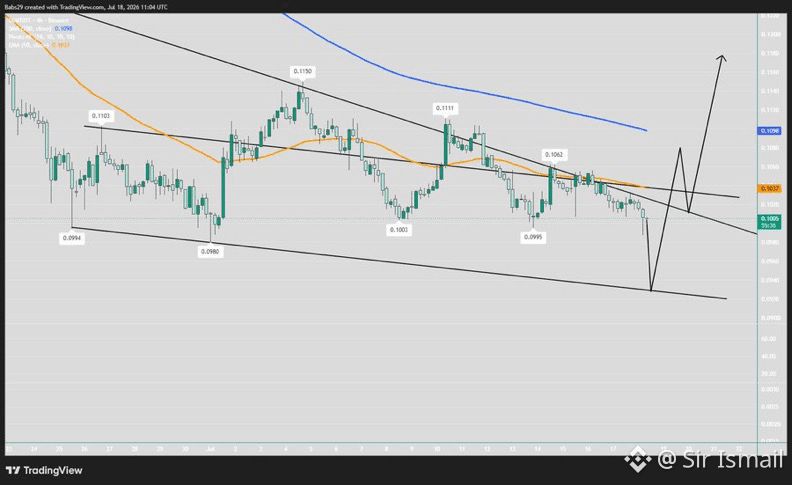
$DIA Weekly Outlook 👀
Nothing has changed structurally.
We’re still in a macro downtrend…
But we’re also entering a zone where markets often begin building long-term bottoms.
🟢 Bulls need to:
✅ Hold weekly support.
✅ Reclaim $0.10.
✅ Break the descending trendline.
Do that, and $0.11-$0.12 becomes the next destination, with $0.13-$0.15 following if momentum returns.
🔴 Lose support and the market could sweep lower before attracting stronger buyers.
My focus isn’t on predicting the bottom.
It’s on watching how price reacts at important levels.
Patience > Emotion
$DIA Weekly Outlook 👀
Nothing has changed structurally.
We’re still in a macro downtrend…
But we’re also entering a zone where markets often begin building long-term bottoms.
🟢 Bulls need to:
✅ Hold weekly support.
✅ Reclaim $0.10.
✅ Break the descending trendline.
Do that, and $0.11-$0.12 becomes the next destination, with $0.13-$0.15 following if momentum returns.
🔴 Lose support and the market could sweep lower before attracting stronger buyers.
My focus isn’t on predicting the bottom.
It’s on watching how price reacts at important levels.
Patience > Emotion
Nothing has changed structurally.
We’re still in a macro downtrend…
But we’re also entering a zone where markets often begin building long-term bottoms.
🟢 Bulls need to:
✅ Hold weekly support.
✅ Reclaim $0.10.
✅ Break the descending trendline.
Do that, and $0.11-$0.12 becomes the next destination, with $0.13-$0.15 following if momentum returns.
🔴 Lose support and the market could sweep lower before attracting stronger buyers.
My focus isn’t on predicting the bottom.
It’s on watching how price reacts at important levels.
Patience > Emotion
1
203
තවත් අන්තර්ගතයන් ගවේෂණය කිරීමට ඇතුල් වන්න
Binance චතුරශ්රය හි ගෝලීය ක්රිප්ටෝ පරිශීලකයින් හා එක්වන්න
⚡️ ක්රිප්ටෝ පිළිබඳ නවතම සහ ප්රයෝජනවත් තොරතුරු ලබා ගන්න.
💬 ලොව විශාලතම ක්රිප්ටෝ හුවමාරුව මගින් විශ්වාස කෙරේ.
👍 සත්යායනය කරන ලද නිර්මාණකරුවන්ගෙන් සැබෑ විදසුන් සොයා ගන්න.
විද්යුත් තැපෑල / දුරකථන අංකය
නැගී එන මාතෘකා
AppleDebutsFoldablePhone
4,593 views
120 සාකච්ඡා කරමින්
#appledebutsfoldablephone iPhone Duo ගැන මම අත තැබුවා—ඇපල් සමාගමේ පළමු නැමිය හැකි දුරකථනය. කැපී පෙනෙන්නේ මොනවාද
අතේ අල්ලට වගේ පමණක් තිබෙන දුරකථනය මෙතෙක් වසර ගණනාවකින් ඇපල් සමාගමෙන් දක්නට ලැබුණු විශාලතම ධෛර්යවත් අතුරුකරණයයි—අඟල් 5.4 ක ආවරණ තිරයක් සහ අඟල් 7.6 ක ප්රධාන තිරයක් සහිතයි. ඔක්තෝබර් මාසයේ නිකුත් වීමට පෙර Duo සමඟ මට ටික වේලාවක් ගනුදෙනු කරන්න ලැබුණා.
අවසානයේ මෙයයි: බදාදා ඇපල් සමාගම සිය පළමු නැමිය හැකි iPhone එක වන iPhone Duo නමින් එළිදැක්වුවා.
iPhone Duo නිර්මාණය සහ ඉදිකිරීම
iPhone Duo එක සංයුක්තයි—ගමන් ගමන් බලපත්ර ප්රමාණයට සමාන නිර්මාණයක්. ඇතුළත අඟල් 7.6 ක තිරයක් සහ පිටත අඟල් 5.4 ක තිරයක් තිබෙනවා. එය මගේ අතේ තදින්ම හරියටම ගැලපෙයි—සැම්සුන් Galaxy Z Fold 8 එකට සමාන මානයන් ඇති අතර, එහි ඇතුල් තිරය අඟල් 7.6ක් සහ ආවරණ තිරය අඟල් 5.5ක්.
ඇපල් පවසන්නේ, Duo විවෘත කරන විට මෙය මෙතෙක් නිෂ්පාදනය වූ සිහින්ම iPhone එක බවයි—මි.මී. 5.2 ක් ලෙස. වසා තැබූ විට ඝනකම මි.මී. 11.3 කි. ටයිටේනියම් රාමුවක් එය සැහැල්ලු කරයි—ග්රෑම් 254.
ඇපල් සහ සැම්සුන් දුරකථන අතර අත්දැකීමේ ප්රධාන වෙනසක් නම් iPhone Duo හි ඇතුළත තිරය මත matte, nano-textured ආවරණයක් තිබීමයි—මෙය දුරකථනයේ crease (නැමීමේ රේඛාව) අඩු කරමින්ම, පරාවර්තනද සීමා කරයි. තිරය ක්රියාත්මක වන විට crease එක ගිලිහී යනවා වගේම තෘප්තිමත් අත්දැකීමක් දෙනවා. Z Fold 8 එකේ anti-reflective තිරයක් තිබුණත්, එය අඩු දකින්න ලැබෙන ලෙසට මට පේන්නේ ඊටත් වඩා අඩුවෙන්.
$ONG $IMX $TAC
Isabella-I
·3 කැමත්ත දැක්වීම්
·703 views
US10YTreasuryYieldHitsHighestSinceNov2023
8,381 views
173 සාකච්ඡා කරමින්
USTreasuryToBuyBackUpTo$6BLongDatedDebt
9,599 views
129 සාකච්ඡා කරමින්