

Giannis Andreou
1.3k පෝස්ටු

Giannis Andreou
වාර්තා කරන්න
පරිශීලක අවහිර කරන්න
Crypto analyst. 2000 Video content on YouTube - Giannis Andreou | Bitmern Mining Founder & CEO | Author
1.4K+ හඹා යමින්
29.3K+ හඹා යන්නන්
19.9K+ කැමති විය
පෝස්ටු
සියල්ල
උපුටා දැක්වීම්
වීඩියෝ
සජීවි
අමුණා ඇත
🔥 Throwback to One of My Most Insightful Crypto Conversations! 🔥
Two years ago, I had the chance to sit down with CZ for a deep dive into the future of Web3, the challenges of global adoption, and the mindset behind building in a fast-moving crypto world.
From discussing Bitcoin’s resilience 🟧, to the rise of BNB 🚀, to exploring how stablecoins would reshape global finance 💴 → it was one of those conversations that sticks with you long after the cameras stop rolling.
If you missed it back then, now’s the perfect time to revisit it— the insights are still gold. ✨
$BTC $ETH $BNB
🔥 Throwback to One of My Most Insightful Crypto Conversations! 🔥
Two years ago, I had the chance to sit down with CZ for a deep dive into the future of Web3, the challenges of global adoption, and the mindset behind building in a fast-moving crypto world.
From discussing Bitcoin’s resilience 🟧, to the rise of BNB 🚀, to exploring how stablecoins would reshape global finance 💴 → it was one of those conversations that sticks with you long after the cameras stop rolling.
If you missed it back then, now’s the perfect time to revisit it— the insights are still gold. ✨
$BTC $ETH $BNB
Two years ago, I had the chance to sit down with CZ for a deep dive into the future of Web3, the challenges of global adoption, and the mindset behind building in a fast-moving crypto world.
From discussing Bitcoin’s resilience 🟧, to the rise of BNB 🚀, to exploring how stablecoins would reshape global finance 💴 → it was one of those conversations that sticks with you long after the cameras stop rolling.
If you missed it back then, now’s the perfect time to revisit it— the insights are still gold. ✨
$BTC $ETH $BNB
26
18
159
51.5k
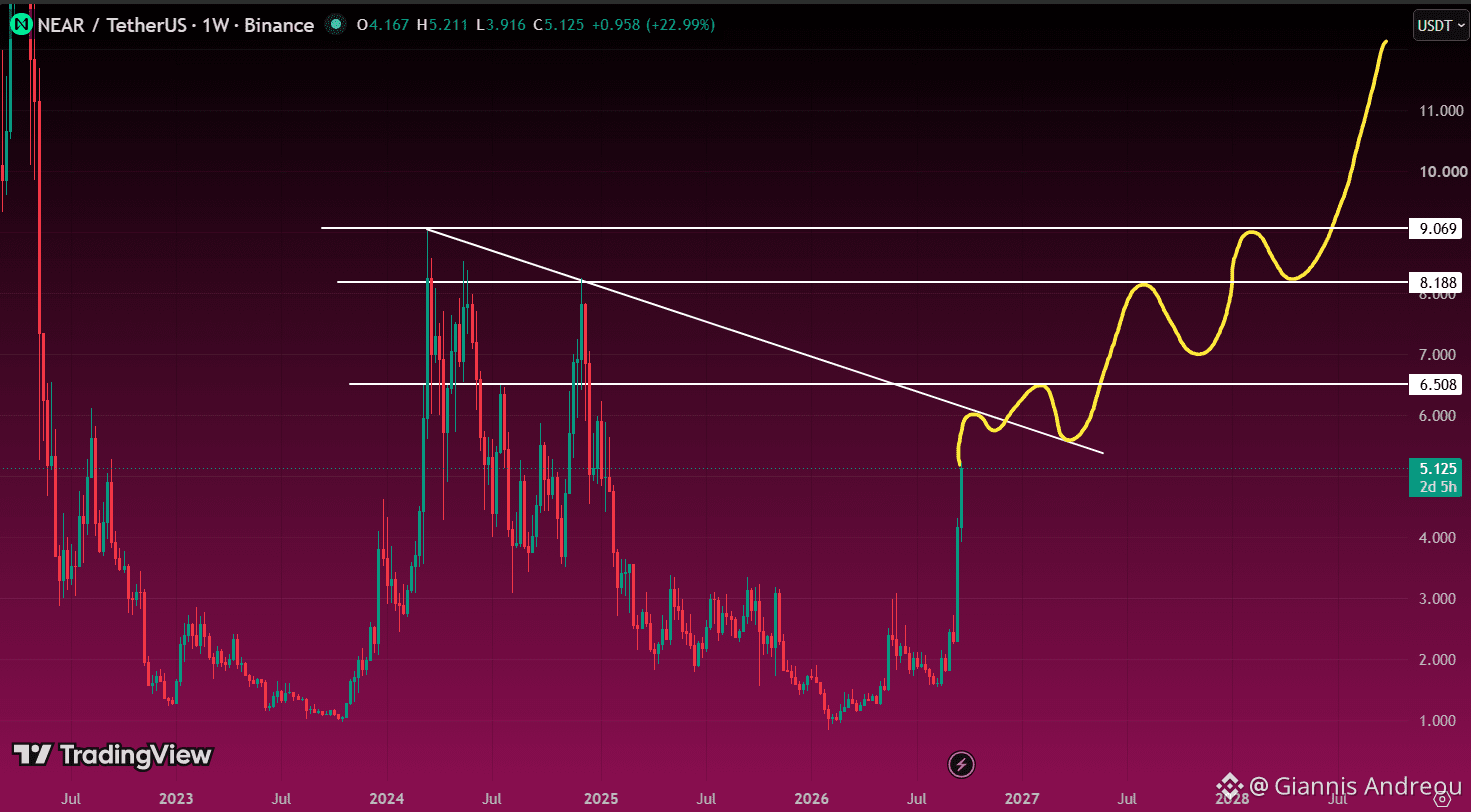
🌐 $NEAR IS GETTING VERY CLOSE TO A MAJOR BREAKOUT
$NEAR has already made a huge move, but the real test is still ahead.
Price is now approaching the long-term descending trendline that has capped every major rally since 2024.
If $NEAR breaks this trendline cleanly and holds above it, I think the move could accelerate fast.
The next levels on my chart are:
$6.50 → $8.20 → $9.00+
This is the breakout I’ve been waiting for.
If that trendline goes, $NEAR could really start flying.
🌐 $NEAR IS GETTING VERY CLOSE TO A MAJOR BREAKOUT
$NEAR has already made a huge move, but the real test is still ahead.
Price is now approaching the long-term descending trendline that has capped every major rally since 2024.
If $NEAR breaks this trendline cleanly and holds above it, I think the move could accelerate fast.
The next levels on my chart are:
$6.50 → $8.20 → $9.00+
This is the breakout I’ve been waiting for.
If that trendline goes, $NEAR could really start flying.
$NEAR has already made a huge move, but the real test is still ahead.
Price is now approaching the long-term descending trendline that has capped every major rally since 2024.
If $NEAR breaks this trendline cleanly and holds above it, I think the move could accelerate fast.
The next levels on my chart are:
$6.50 → $8.20 → $9.00+
This is the breakout I’ve been waiting for.
If that trendline goes, $NEAR could really start flying.
19
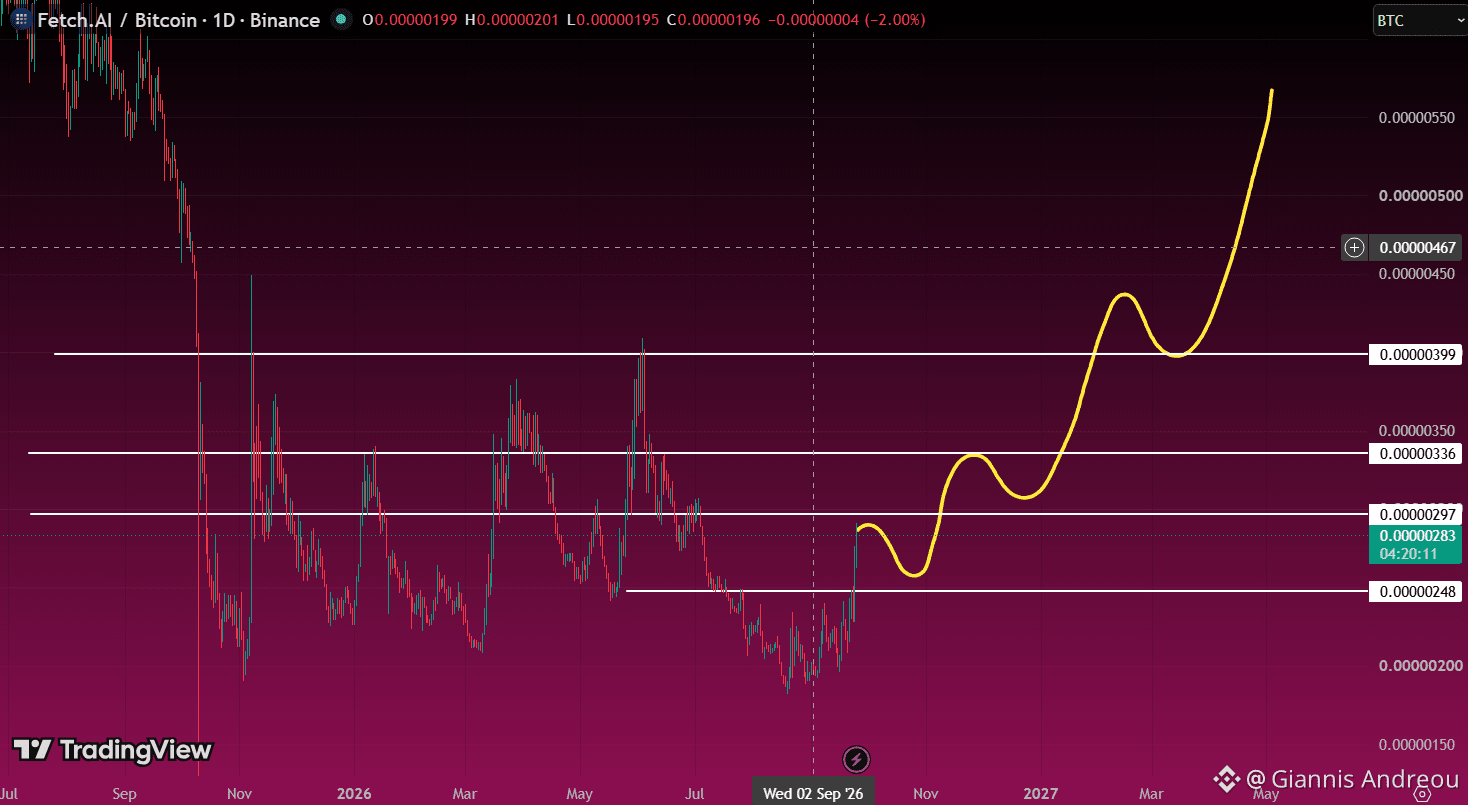
🤖 $FET/BTC IS APPROACHING A KEY BREAKOUT
$FET has bounced strongly against Bitcoin and is now pushing into the next resistance around 0.00000297 BTC.
If that level breaks and holds, the next areas I’m watching are:
0.00000336 → 0.00000399 → 0.00000467
The structure is starting to improve, but this first resistance is the level that matters most right now.
Break it, hold it, and $FET could start outperforming $BTC much more aggressively.
🤖 $FET/BTC IS APPROACHING A KEY BREAKOUT
$FET has bounced strongly against Bitcoin and is now pushing into the next resistance around 0.00000297 BTC.
If that level breaks and holds, the next areas I’m watching are:
0.00000336 → 0.00000399 → 0.00000467
The structure is starting to improve, but this first resistance is the level that matters most right now.
Break it, hold it, and $FET could start outperforming $BTC much more aggressively.
$FET has bounced strongly against Bitcoin and is now pushing into the next resistance around 0.00000297 BTC.
If that level breaks and holds, the next areas I’m watching are:
0.00000336 → 0.00000399 → 0.00000467
The structure is starting to improve, but this first resistance is the level that matters most right now.
Break it, hold it, and $FET could start outperforming $BTC much more aggressively.
75
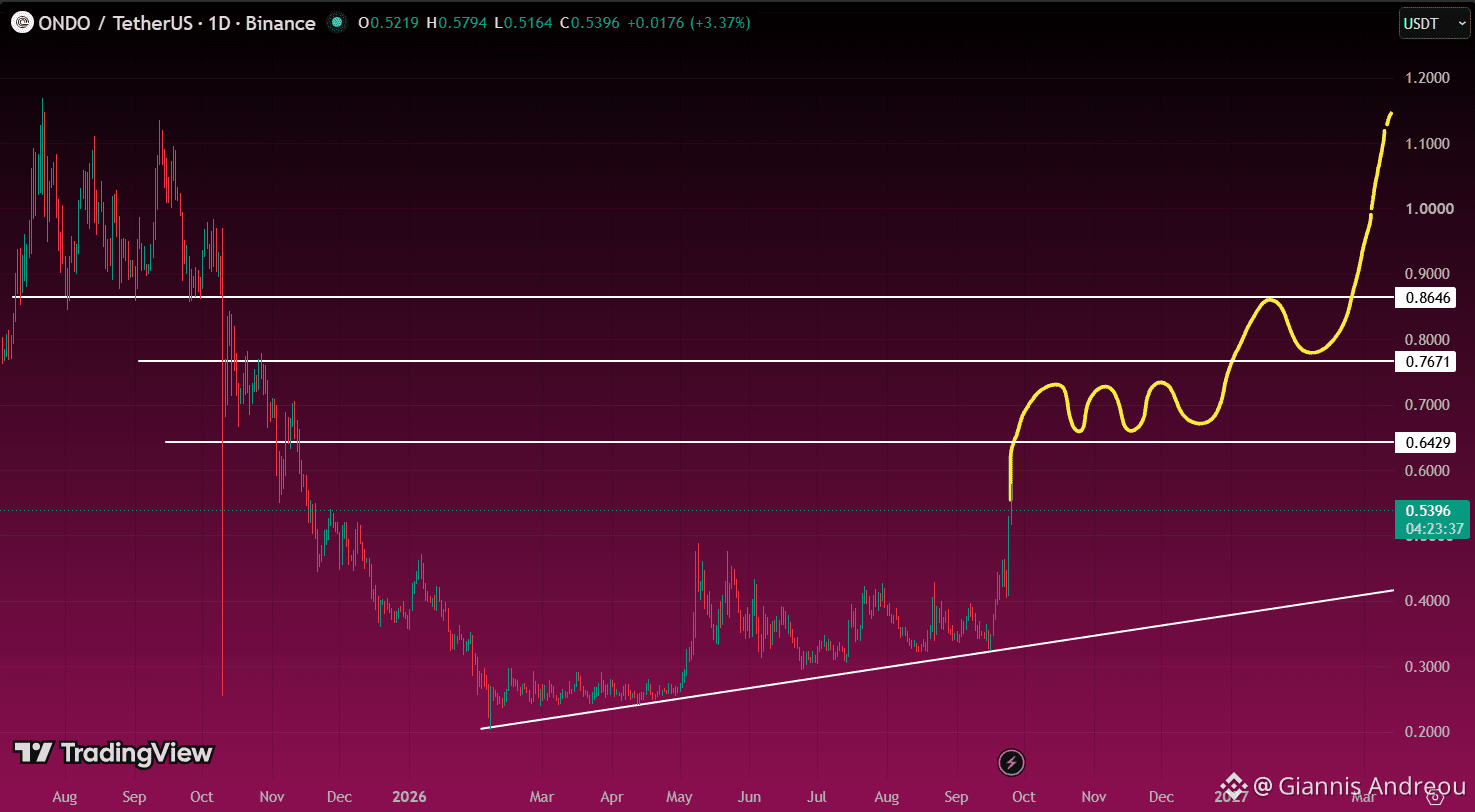
🟢 $ONDO IS BUILDING MOMENTUM
$ONDO has pushed higher again and the structure is starting to look much stronger.
The next resistance I’m watching is around $0.64.
If that breaks and holds, the next major levels on my chart are:
$0.77 → $0.86
Above $0.86, the move could start accelerating toward the $1+ area.
The rising trendline below is still supporting the bigger structure.
For now, the roadmap is simple:
Break $0.64. Hold it. Then attack the next resistance.
🟢 $ONDO IS BUILDING MOMENTUM
$ONDO has pushed higher again and the structure is starting to look much stronger.
The next resistance I’m watching is around $0.64.
If that breaks and holds, the next major levels on my chart are:
$0.77 → $0.86
Above $0.86, the move could start accelerating toward the $1+ area.
The rising trendline below is still supporting the bigger structure.
For now, the roadmap is simple:
Break $0.64. Hold it. Then attack the next resistance.
$ONDO has pushed higher again and the structure is starting to look much stronger.
The next resistance I’m watching is around $0.64.
If that breaks and holds, the next major levels on my chart are:
$0.77 → $0.86
Above $0.86, the move could start accelerating toward the $1+ area.
The rising trendline below is still supporting the bigger structure.
For now, the roadmap is simple:
Break $0.64. Hold it. Then attack the next resistance.
61
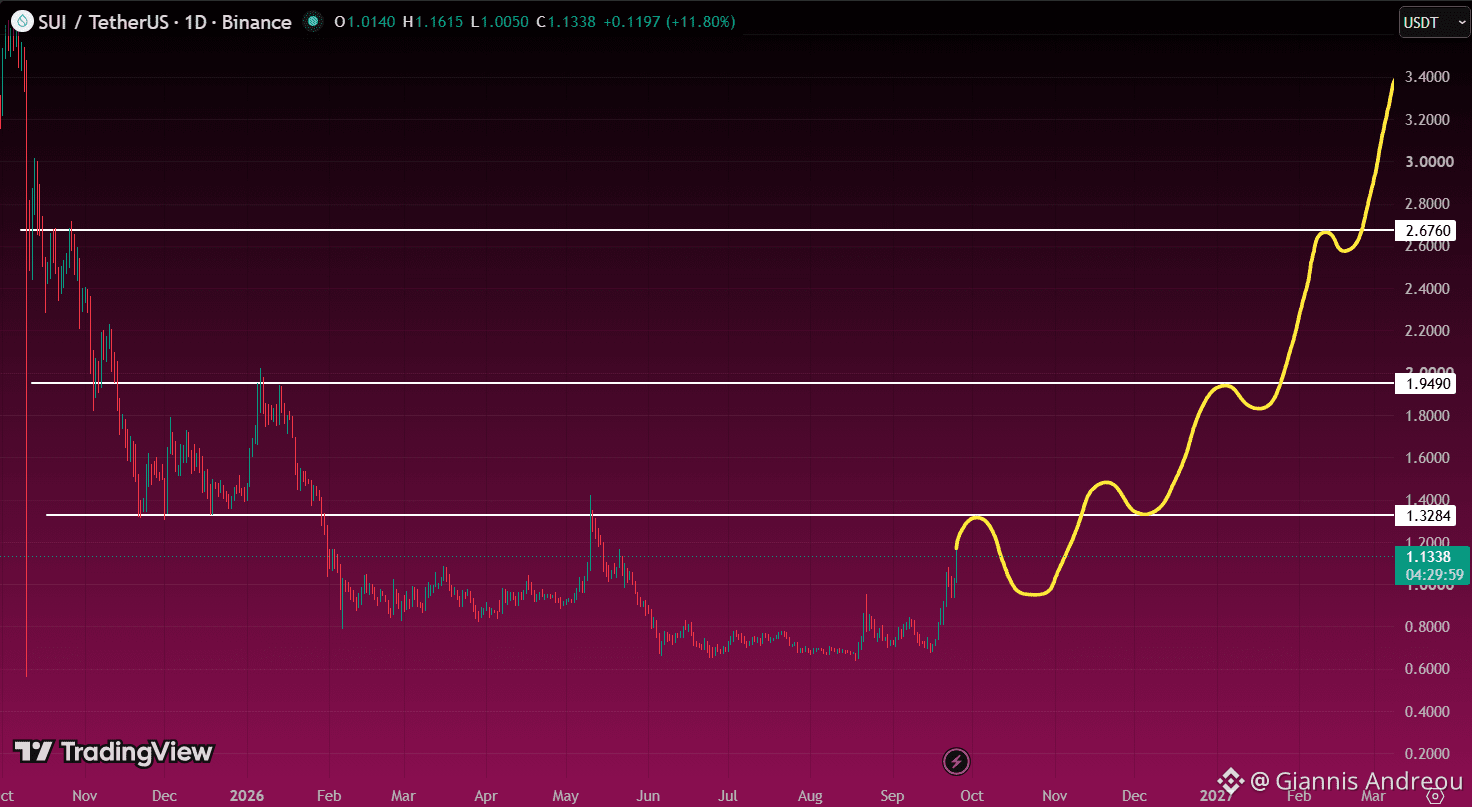
💧 $SUI IS APPROACHING ITS FIRST BIG TEST
$SUI has pushed higher, but the next move depends on how price reacts to these resistance levels.
The first level I’m watching is around $1.33.
If SUI breaks and holds above it, the next major areas on my chart are:
$1.95 → $2.67
Above $2.67, the structure could open up much more aggressively.
For now, the roadmap is simple:
Break resistance. Hold it. Move to the next level.
💧 $SUI IS APPROACHING ITS FIRST BIG TEST
$SUI has pushed higher, but the next move depends on how price reacts to these resistance levels.
The first level I’m watching is around $1.33.
If SUI breaks and holds above it, the next major areas on my chart are:
$1.95 → $2.67
Above $2.67, the structure could open up much more aggressively.
For now, the roadmap is simple:
Break resistance. Hold it. Move to the next level.
$SUI has pushed higher, but the next move depends on how price reacts to these resistance levels.
The first level I’m watching is around $1.33.
If SUI breaks and holds above it, the next major areas on my chart are:
$1.95 → $2.67
Above $2.67, the structure could open up much more aggressively.
For now, the roadmap is simple:
Break resistance. Hold it. Move to the next level.
128
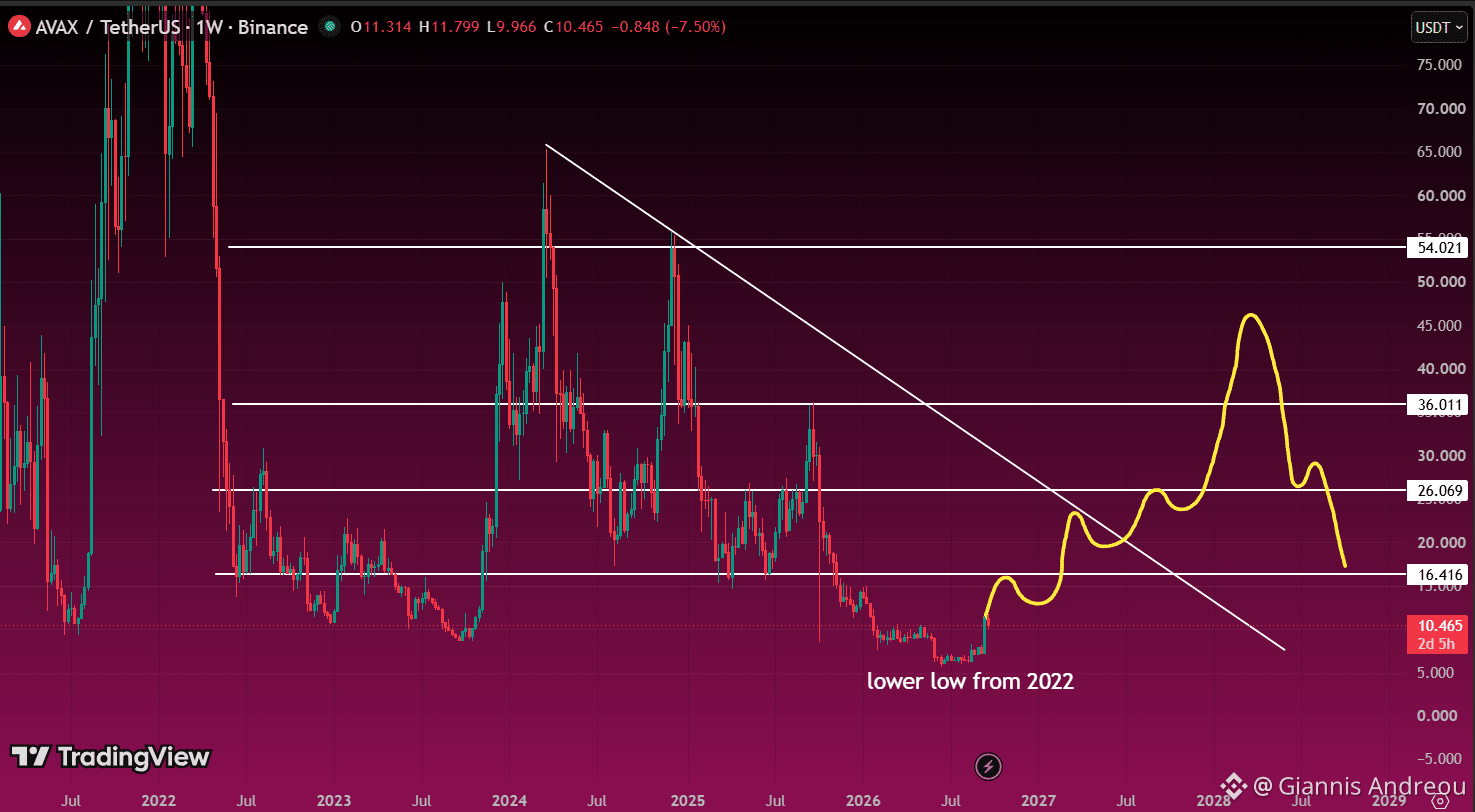
🔺 $AVAX: I’M NOT BUYING THE NEW-HIGH NARRATIVE YET
A lot of people are turning bullish on $AVAX after the recent move and expecting it to eventually trade above its 2024 high.
I see it differently.
AVAX has already printed a lower low compared with 2022, while the long-term descending trendline is still intact.
The levels I’m watching are:
$16.4 → $26 → $36
I can absolutely see a strong recovery, even a move into the $40-$45 area.
But unless $AVAX can reclaim the long-term trendline and eventually break above the $54 region, I would still treat that move as a macro lower high, not the start of a new ATH trend.
Sometimes a big rally is still just a rally.
🔺 $AVAX: I’M NOT BUYING THE NEW-HIGH NARRATIVE YET
A lot of people are turning bullish on $AVAX after the recent move and expecting it to eventually trade above its 2024 high.
I see it differently.
AVAX has already printed a lower low compared with 2022, while the long-term descending trendline is still intact.
The levels I’m watching are:
$16.4 → $26 → $36
I can absolutely see a strong recovery, even a move into the $40-$45 area.
But unless $AVAX can reclaim the long-term trendline and eventually break above the $54 region, I would still treat that move as a macro lower high, not the start of a new ATH trend.
Sometimes a big rally is still just a rally.
A lot of people are turning bullish on $AVAX after the recent move and expecting it to eventually trade above its 2024 high.
I see it differently.
AVAX has already printed a lower low compared with 2022, while the long-term descending trendline is still intact.
The levels I’m watching are:
$16.4 → $26 → $36
I can absolutely see a strong recovery, even a move into the $40-$45 area.
But unless $AVAX can reclaim the long-term trendline and eventually break above the $54 region, I would still treat that move as a macro lower high, not the start of a new ATH trend.
Sometimes a big rally is still just a rally.
1
87
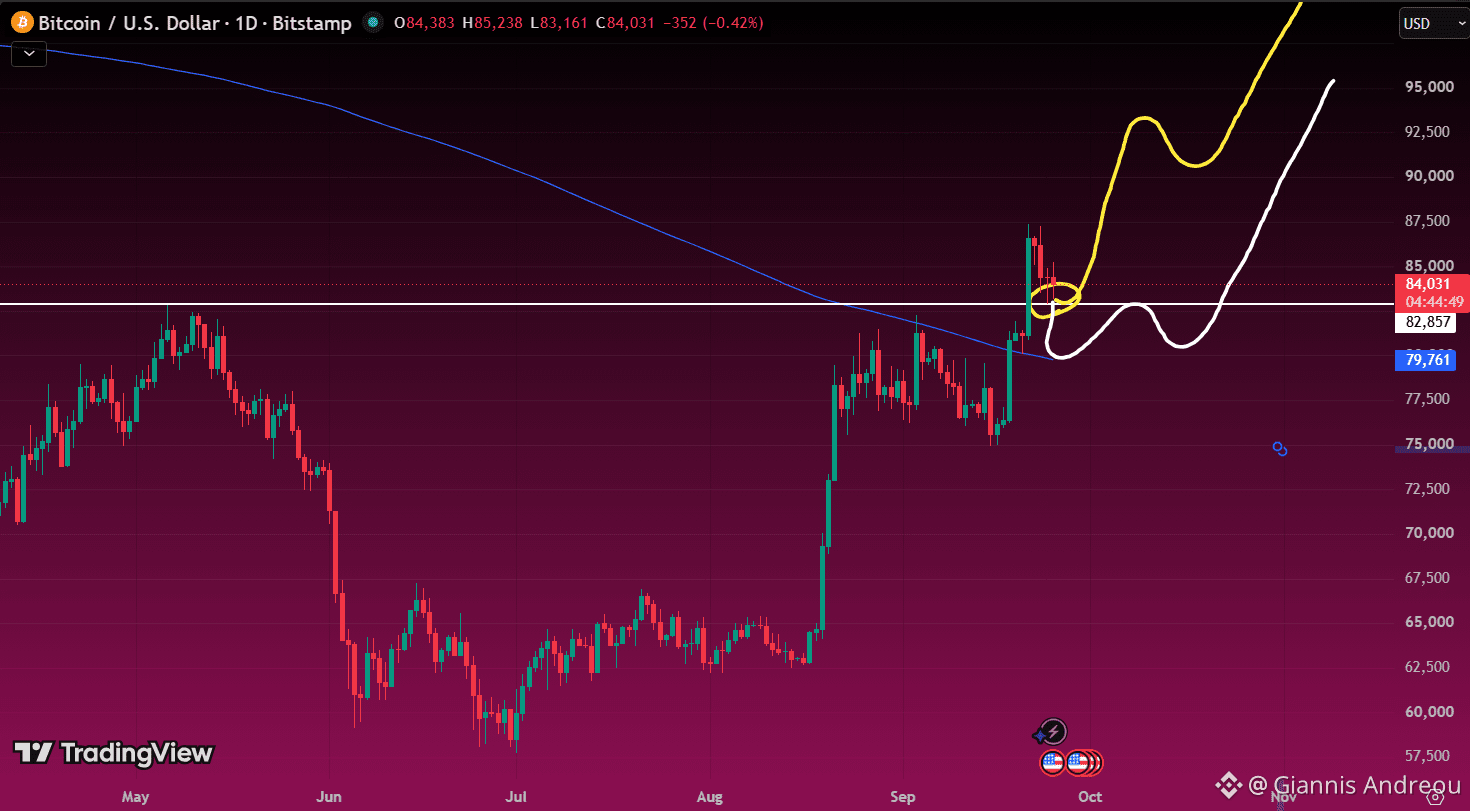
🟠 $BTC JUST REACTED FROM A KEY SUPPORT
Bitcoin tapped the $82.8K support area and bounced slightly higher.
For now, that level is doing its job.
If BTC loses it, the next major support I’m watching is the 360 SMA around $79.7K.
Hold support here, and the bullish structure stays intact.
Lose it, and the 360 SMA becomes the next key level to defend.
🟠 $BTC JUST REACTED FROM A KEY SUPPORT
Bitcoin tapped the $82.8K support area and bounced slightly higher.
For now, that level is doing its job.
If BTC loses it, the next major support I’m watching is the 360 SMA around $79.7K.
Hold support here, and the bullish structure stays intact.
Lose it, and the 360 SMA becomes the next key level to defend.
Bitcoin tapped the $82.8K support area and bounced slightly higher.
For now, that level is doing its job.
If BTC loses it, the next major support I’m watching is the 360 SMA around $79.7K.
Hold support here, and the bullish structure stays intact.
Lose it, and the 360 SMA becomes the next key level to defend.
144
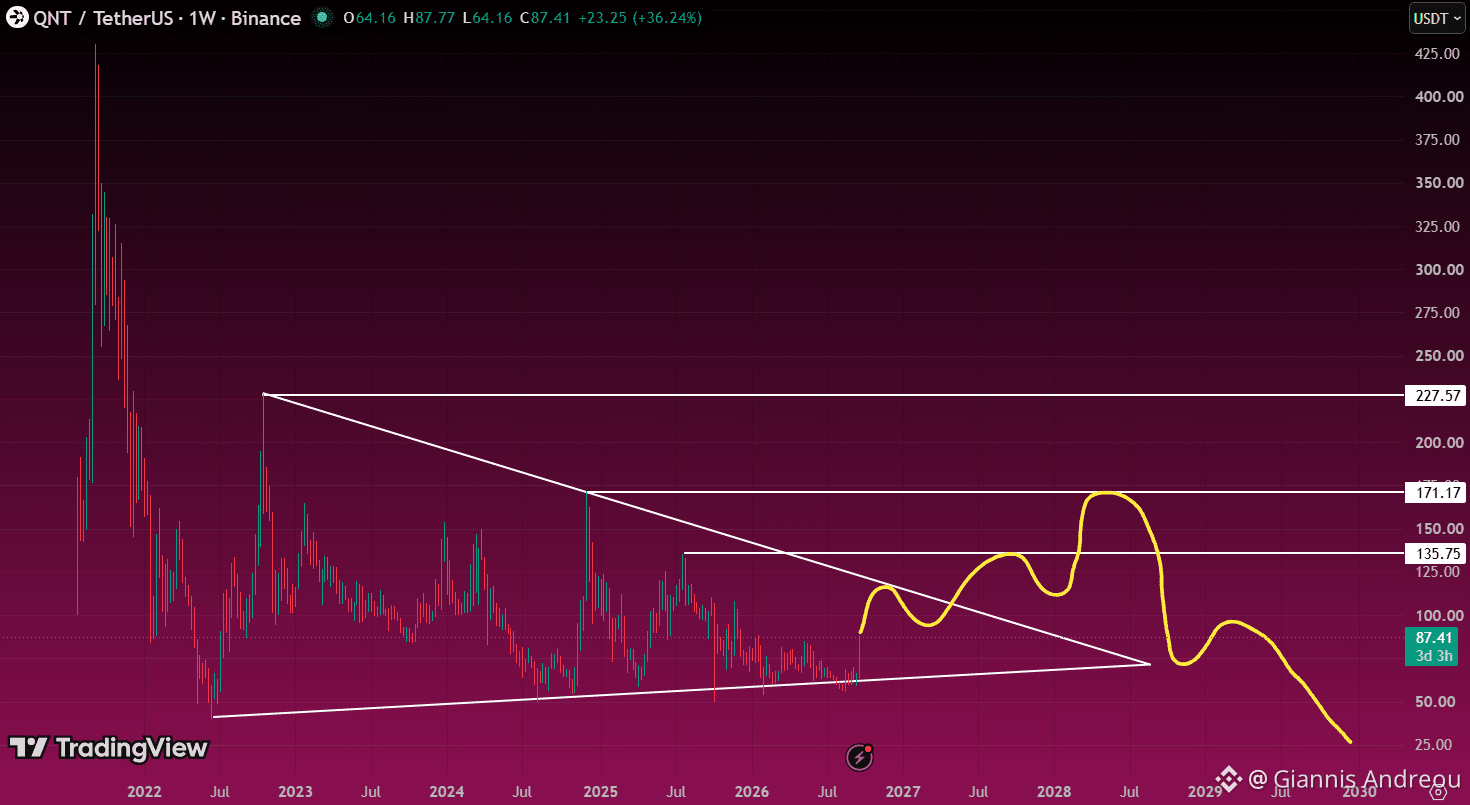
⚪ $QNT: A BIG BOUNCE INSIDE A BIGGER SQUEEZE
$QNT is rebounding from its rising support line, but price remains inside the multi-year triangle. The descending trendline is the next major test.
A weekly breakout and successful retest would strengthen the case for $135.75, followed by $171.17.
My drawn scenario allows that recovery before a potential rejection. A sustained break above $171.17 would challenge that bearish second leg and bring $227.57 into focus.
Lose the rising support near $60–$65 instead, and the recovery setup weakens.
The weekly candle is still open. The projected path is conditional, not a timetable.
Nothing is guaranteed. Do Your Own Research.
⚪ $QNT: A BIG BOUNCE INSIDE A BIGGER SQUEEZE
$QNT is rebounding from its rising support line, but price remains inside the multi-year triangle. The descending trendline is the next major test.
A weekly breakout and successful retest would strengthen the case for $135.75, followed by $171.17.
My drawn scenario allows that recovery before a potential rejection. A sustained break above $171.17 would challenge that bearish second leg and bring $227.57 into focus.
Lose the rising support near $60–$65 instead, and the recovery setup weakens.
The weekly candle is still open. The projected path is conditional, not a timetable.
Nothing is guaranteed. Do Your Own Research.
$QNT is rebounding from its rising support line, but price remains inside the multi-year triangle. The descending trendline is the next major test.
A weekly breakout and successful retest would strengthen the case for $135.75, followed by $171.17.
My drawn scenario allows that recovery before a potential rejection. A sustained break above $171.17 would challenge that bearish second leg and bring $227.57 into focus.
Lose the rising support near $60–$65 instead, and the recovery setup weakens.
The weekly candle is still open. The projected path is conditional, not a timetable.
Nothing is guaranteed. Do Your Own Research.
1
65
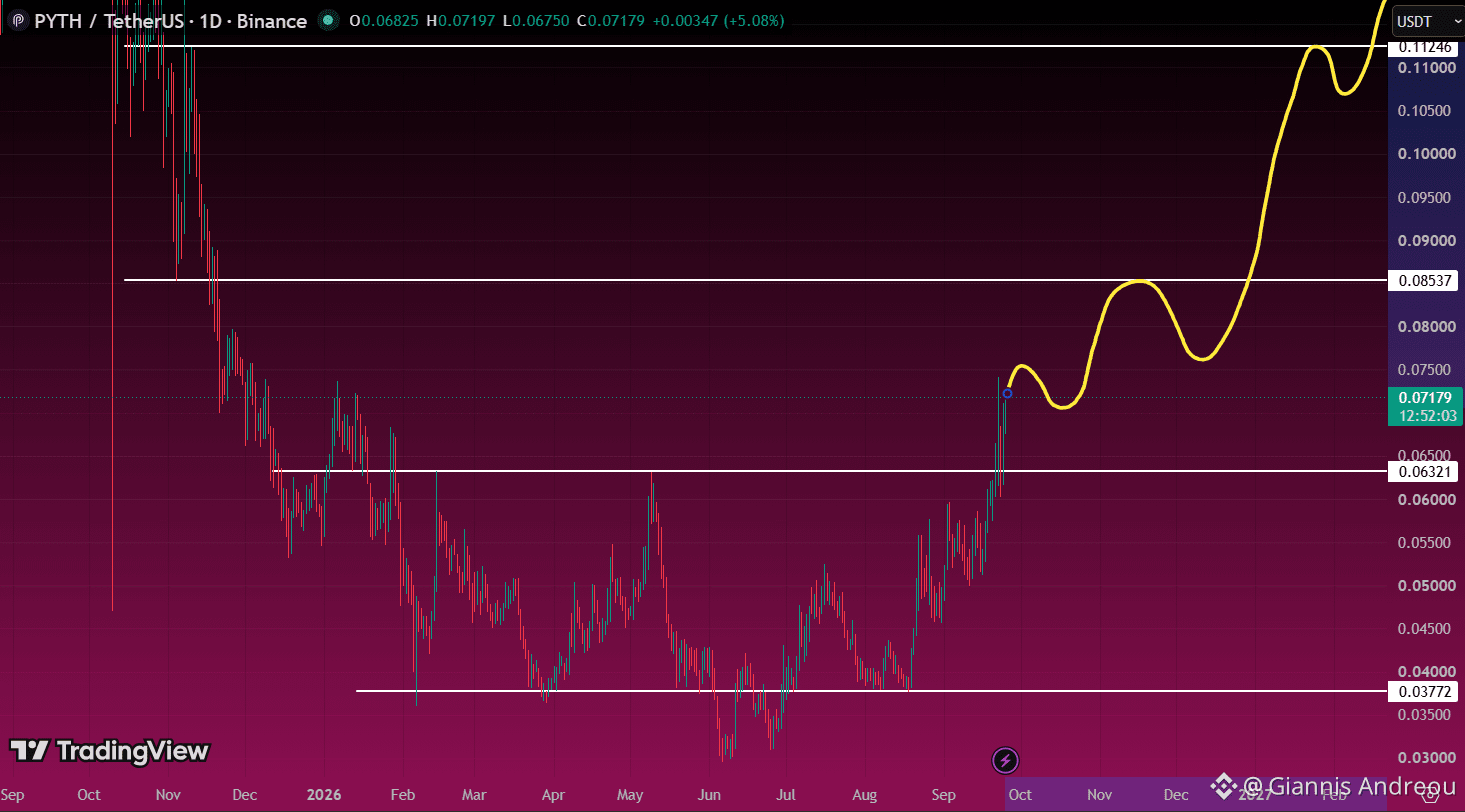
🟣 $PYTH: THE RECOVERY HAS ITS FIRST REAL TEST.
PYTH has pushed above $0.0632 after building a base around $0.0377.
Now the key is holding that reclaimed level on a pullback. If buyers defend it, $0.0854 becomes the next resistance to watch.
Break above that and hold the retest, and $0.1125 comes into focus.
Lose $0.0632, and the bullish setup weakens, bringing $0.050 back into play.
The yellow path is a scenario. Each breakout still needs confirmation.
Nothing is guaranteed. Do Your Own Research.
🟣 $PYTH: THE RECOVERY HAS ITS FIRST REAL TEST.
PYTH has pushed above $0.0632 after building a base around $0.0377.
Now the key is holding that reclaimed level on a pullback. If buyers defend it, $0.0854 becomes the next resistance to watch.
Break above that and hold the retest, and $0.1125 comes into focus.
Lose $0.0632, and the bullish setup weakens, bringing $0.050 back into play.
The yellow path is a scenario. Each breakout still needs confirmation.
Nothing is guaranteed. Do Your Own Research.
PYTH has pushed above $0.0632 after building a base around $0.0377.
Now the key is holding that reclaimed level on a pullback. If buyers defend it, $0.0854 becomes the next resistance to watch.
Break above that and hold the retest, and $0.1125 comes into focus.
Lose $0.0632, and the bullish setup weakens, bringing $0.050 back into play.
The yellow path is a scenario. Each breakout still needs confirmation.
Nothing is guaranteed. Do Your Own Research.
39
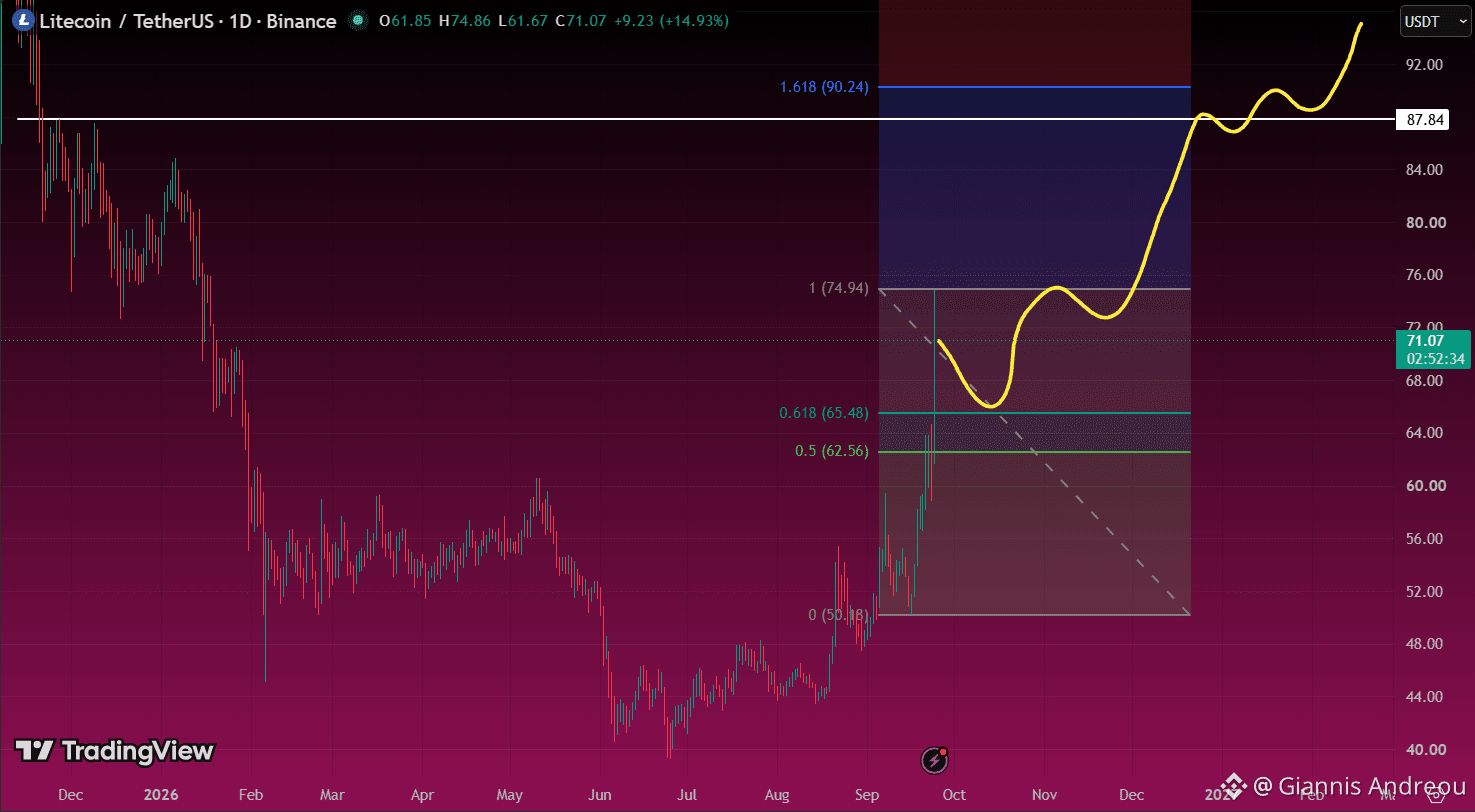
⚡ $LTC: THE NEXT DIP COULD BE THE REAL TEST
After a sharp rally, I’m watching a potential pullback toward $65.48. The broader support zone sits at $62.56–$65.48, matching the marked 0.5–0.618 Fibonacci levels.
Hold that zone and reclaim $74.94, and $87.84–$90.24 becomes the next major area to watch. Historical resistance and the 1.618 extension sit close together there.
My bullish scenario is a retest first, then continuation. A daily close below $62.56 would weaken that setup.
The current daily candle is still open. Let the close confirm the move.
Nothing is guaranteed. Do Your Own Research.
⚡ $LTC: THE NEXT DIP COULD BE THE REAL TEST
After a sharp rally, I’m watching a potential pullback toward $65.48. The broader support zone sits at $62.56–$65.48, matching the marked 0.5–0.618 Fibonacci levels.
Hold that zone and reclaim $74.94, and $87.84–$90.24 becomes the next major area to watch. Historical resistance and the 1.618 extension sit close together there.
My bullish scenario is a retest first, then continuation. A daily close below $62.56 would weaken that setup.
The current daily candle is still open. Let the close confirm the move.
Nothing is guaranteed. Do Your Own Research.
After a sharp rally, I’m watching a potential pullback toward $65.48. The broader support zone sits at $62.56–$65.48, matching the marked 0.5–0.618 Fibonacci levels.
Hold that zone and reclaim $74.94, and $87.84–$90.24 becomes the next major area to watch. Historical resistance and the 1.618 extension sit close together there.
My bullish scenario is a retest first, then continuation. A daily close below $62.56 would weaken that setup.
The current daily candle is still open. Let the close confirm the move.
Nothing is guaranteed. Do Your Own Research.
48
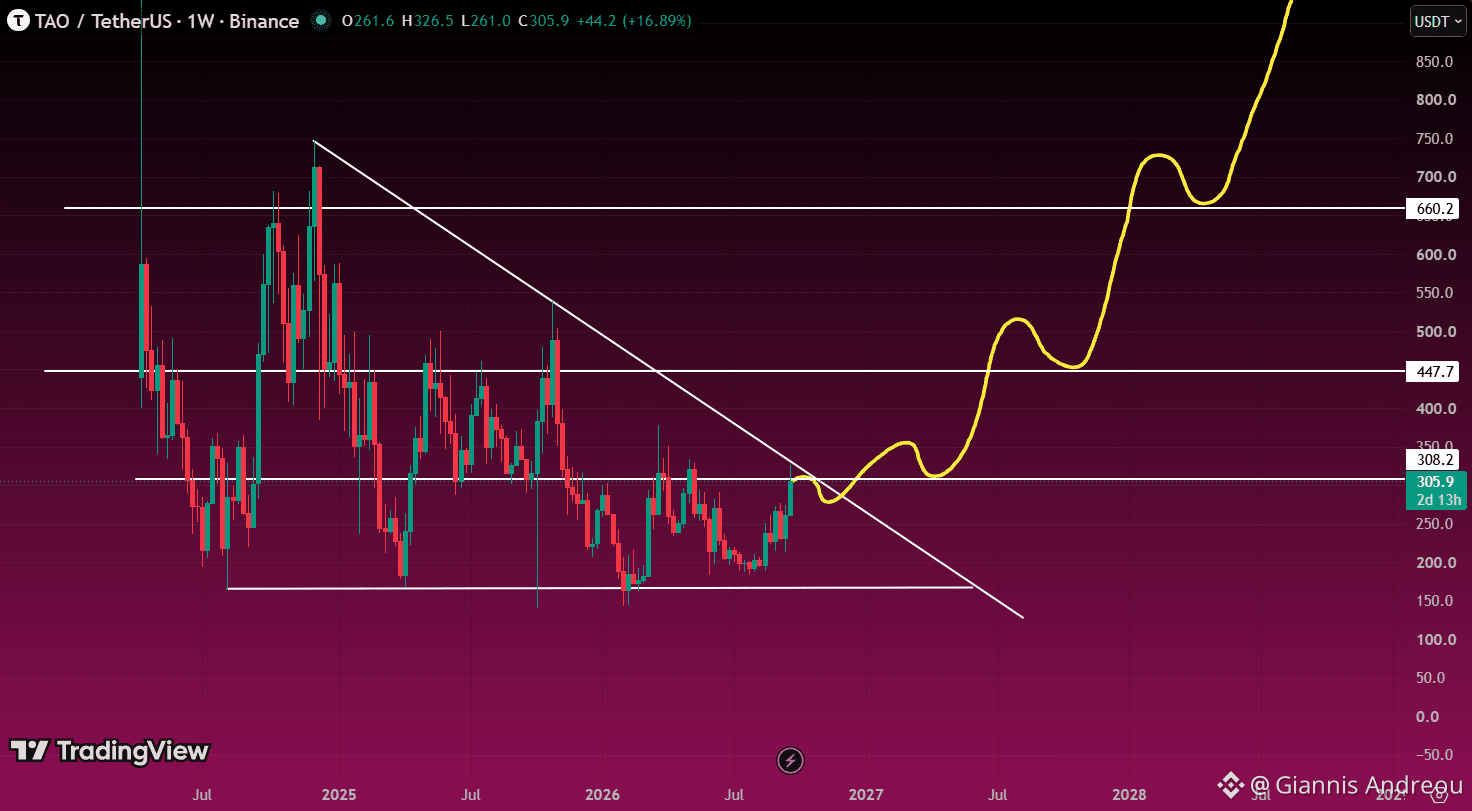
⚪ $TAO: WAITING FOR THE TRIANGLE TO BREAK.
TAO is approaching descending resistance on the weekly chart, with $308.2 adding another hurdle nearby.
I’m waiting for a weekly close above both, followed by a retest that holds.
That would strengthen the bullish scenario toward $447.7, then $660.2. Turning those levels into support could open the path toward the previous highs.
Until the breakout confirms, price remains inside the triangle. Rejection keeps another move toward $200–$165 in play.
Nothing is guaranteed. Do Your Own Research.
⚪ $TAO: WAITING FOR THE TRIANGLE TO BREAK.
TAO is approaching descending resistance on the weekly chart, with $308.2 adding another hurdle nearby.
I’m waiting for a weekly close above both, followed by a retest that holds.
That would strengthen the bullish scenario toward $447.7, then $660.2. Turning those levels into support could open the path toward the previous highs.
Until the breakout confirms, price remains inside the triangle. Rejection keeps another move toward $200–$165 in play.
Nothing is guaranteed. Do Your Own Research.
TAO is approaching descending resistance on the weekly chart, with $308.2 adding another hurdle nearby.
I’m waiting for a weekly close above both, followed by a retest that holds.
That would strengthen the bullish scenario toward $447.7, then $660.2. Turning those levels into support could open the path toward the previous highs.
Until the breakout confirms, price remains inside the triangle. Rejection keeps another move toward $200–$165 in play.
Nothing is guaranteed. Do Your Own Research.
80
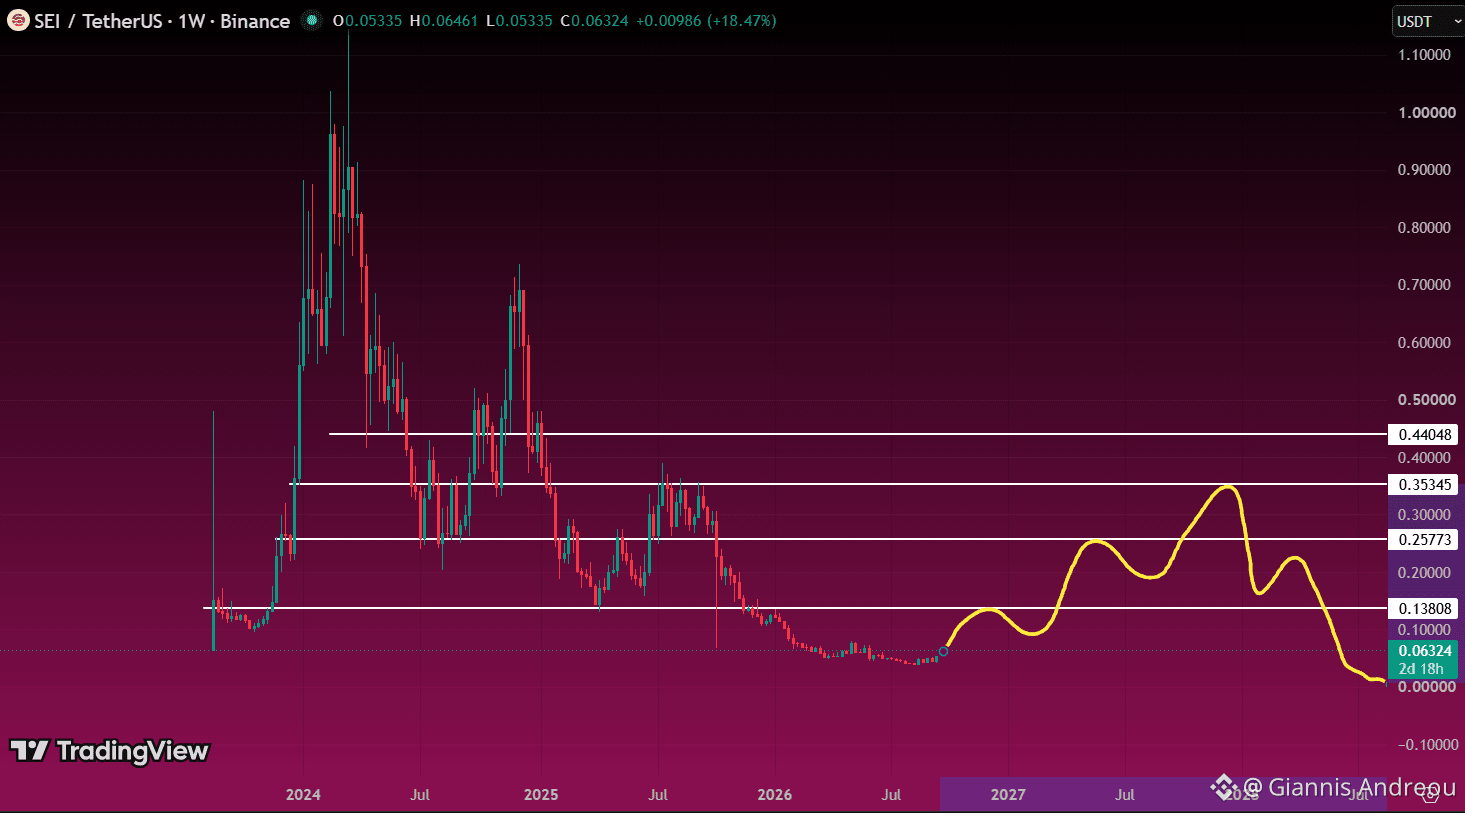
🔴 $SEI: A BIG RALLY CAN STILL END IN A LOWER HIGH.
My drawn scenario starts with a recovery toward $0.138. A weekly breakout and successful retest would bring $0.258, then $0.353 into focus.
That’s where I’d watch closely for exhaustion. Even reaching those levels would leave SEI well below its previous cycle peak.
Rejection followed by a lower high could set up another major decline. Sustained strength above $0.353–$0.440 would challenge that bearish second leg.
The yellow path is a scenario, not a prediction of zero.
Nothing is guaranteed. Do Your Own Research.
🔴 $SEI: A BIG RALLY CAN STILL END IN A LOWER HIGH.
My drawn scenario starts with a recovery toward $0.138. A weekly breakout and successful retest would bring $0.258, then $0.353 into focus.
That’s where I’d watch closely for exhaustion. Even reaching those levels would leave SEI well below its previous cycle peak.
Rejection followed by a lower high could set up another major decline. Sustained strength above $0.353–$0.440 would challenge that bearish second leg.
The yellow path is a scenario, not a prediction of zero.
Nothing is guaranteed. Do Your Own Research.
My drawn scenario starts with a recovery toward $0.138. A weekly breakout and successful retest would bring $0.258, then $0.353 into focus.
That’s where I’d watch closely for exhaustion. Even reaching those levels would leave SEI well below its previous cycle peak.
Rejection followed by a lower high could set up another major decline. Sustained strength above $0.353–$0.440 would challenge that bearish second leg.
The yellow path is a scenario, not a prediction of zero.
Nothing is guaranteed. Do Your Own Research.
1
64
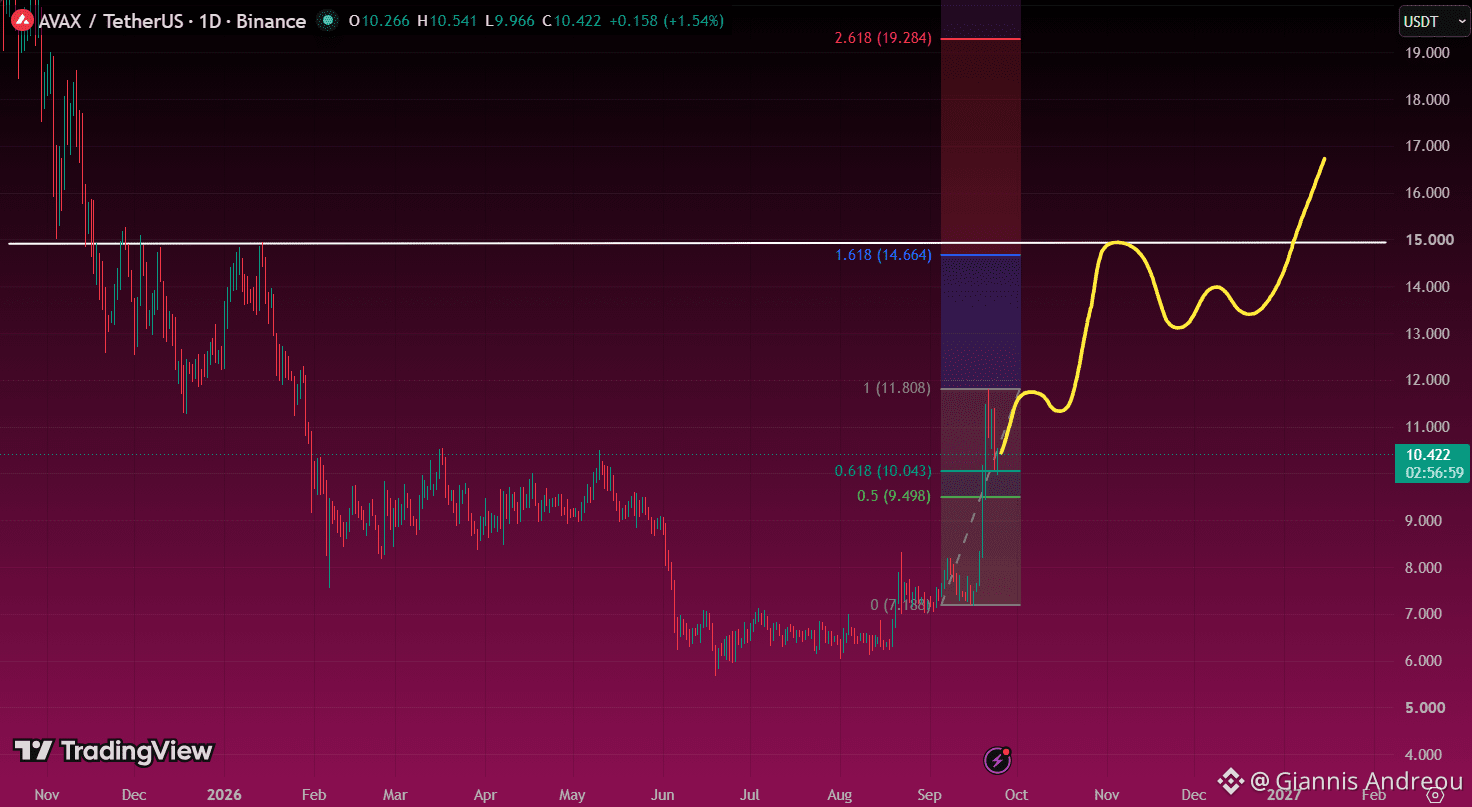
🔺 $AVAX: THE PULLBACK THAT COULD SET UP ROUND TWO
$AVAX is testing the $10 area after its sharp rally. I’m watching $9.50–$10.04 as the support zone for this setup.
Hold that zone and reclaim $11.81, and the next upside area is $14.66–$15.00, where the 1.618 Fibonacci extension meets historical resistance.
That’s where I’d expect a tougher test. A breakout and successful retest would strengthen the case for $16–$17.
A daily close below $9.50 would weaken this scenario and put the breakout base near $7.20 back on the radar.
Nothing is guaranteed. Do Your Own Research.
🔺 $AVAX: THE PULLBACK THAT COULD SET UP ROUND TWO
$AVAX is testing the $10 area after its sharp rally. I’m watching $9.50–$10.04 as the support zone for this setup.
Hold that zone and reclaim $11.81, and the next upside area is $14.66–$15.00, where the 1.618 Fibonacci extension meets historical resistance.
That’s where I’d expect a tougher test. A breakout and successful retest would strengthen the case for $16–$17.
A daily close below $9.50 would weaken this scenario and put the breakout base near $7.20 back on the radar.
Nothing is guaranteed. Do Your Own Research.
$AVAX is testing the $10 area after its sharp rally. I’m watching $9.50–$10.04 as the support zone for this setup.
Hold that zone and reclaim $11.81, and the next upside area is $14.66–$15.00, where the 1.618 Fibonacci extension meets historical resistance.
That’s where I’d expect a tougher test. A breakout and successful retest would strengthen the case for $16–$17.
A daily close below $9.50 would weaken this scenario and put the breakout base near $7.20 back on the radar.
Nothing is guaranteed. Do Your Own Research.
31
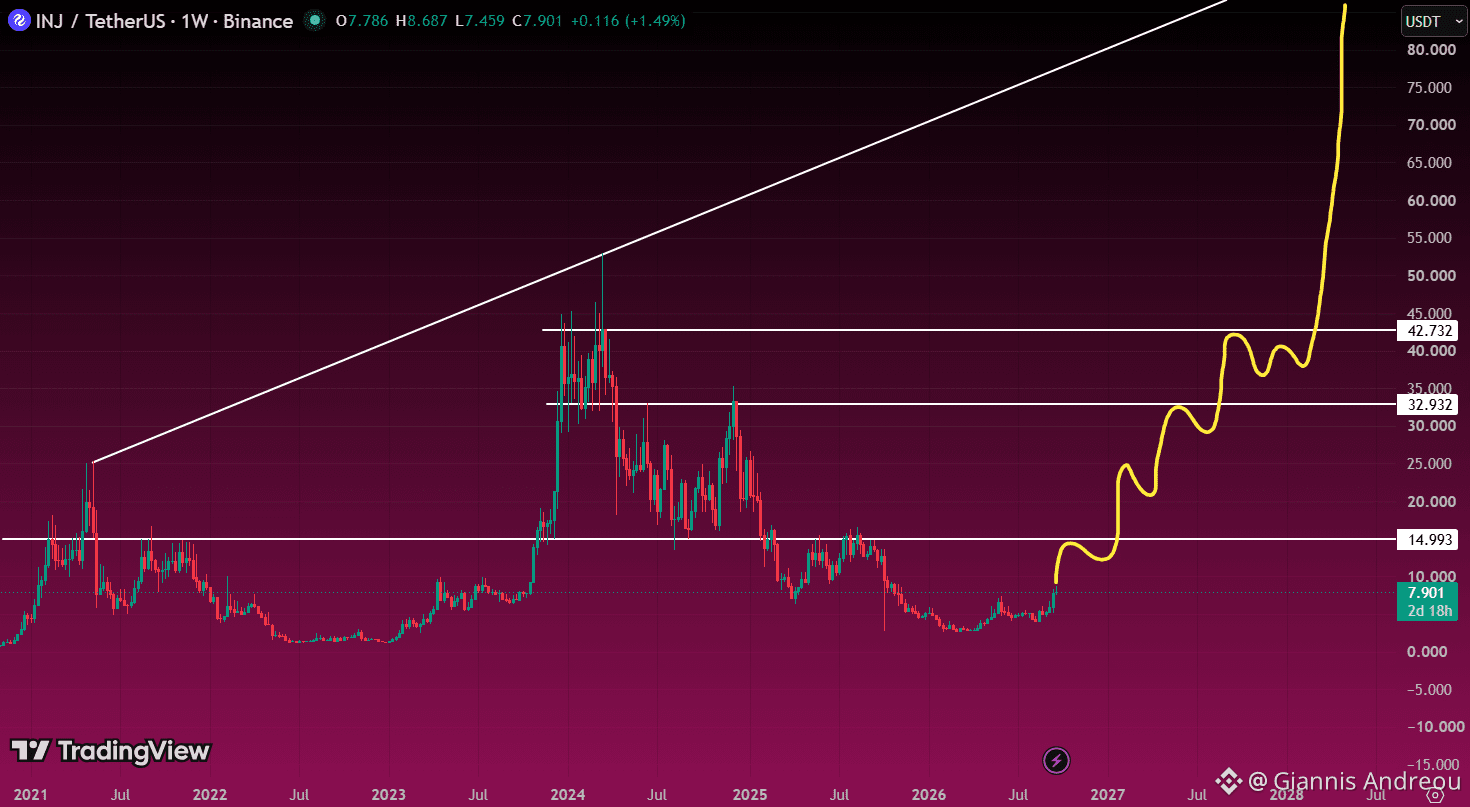
🔵 $INJ: THE COMEBACK HAS LEVELS TO CLEAR.
INJ is recovering from its recent base, but $15 remains the first major resistance on this weekly chart.
Reclaim it and hold the retest, and the recovery could extend toward $20–$25, then $32.93 and $42.73.
My bullish scenario builds through those levels before challenging the previous peak near $53. The drawn $80+ extension depends on that breakout actually happening.
Losing the recent base around $3–$4 would undermine the setup.
Nothing is guaranteed. Do Your Own Research.
🔵 $INJ: THE COMEBACK HAS LEVELS TO CLEAR.
INJ is recovering from its recent base, but $15 remains the first major resistance on this weekly chart.
Reclaim it and hold the retest, and the recovery could extend toward $20–$25, then $32.93 and $42.73.
My bullish scenario builds through those levels before challenging the previous peak near $53. The drawn $80+ extension depends on that breakout actually happening.
Losing the recent base around $3–$4 would undermine the setup.
Nothing is guaranteed. Do Your Own Research.
INJ is recovering from its recent base, but $15 remains the first major resistance on this weekly chart.
Reclaim it and hold the retest, and the recovery could extend toward $20–$25, then $32.93 and $42.73.
My bullish scenario builds through those levels before challenging the previous peak near $53. The drawn $80+ extension depends on that breakout actually happening.
Losing the recent base around $3–$4 would undermine the setup.
Nothing is guaranteed. Do Your Own Research.
1
64
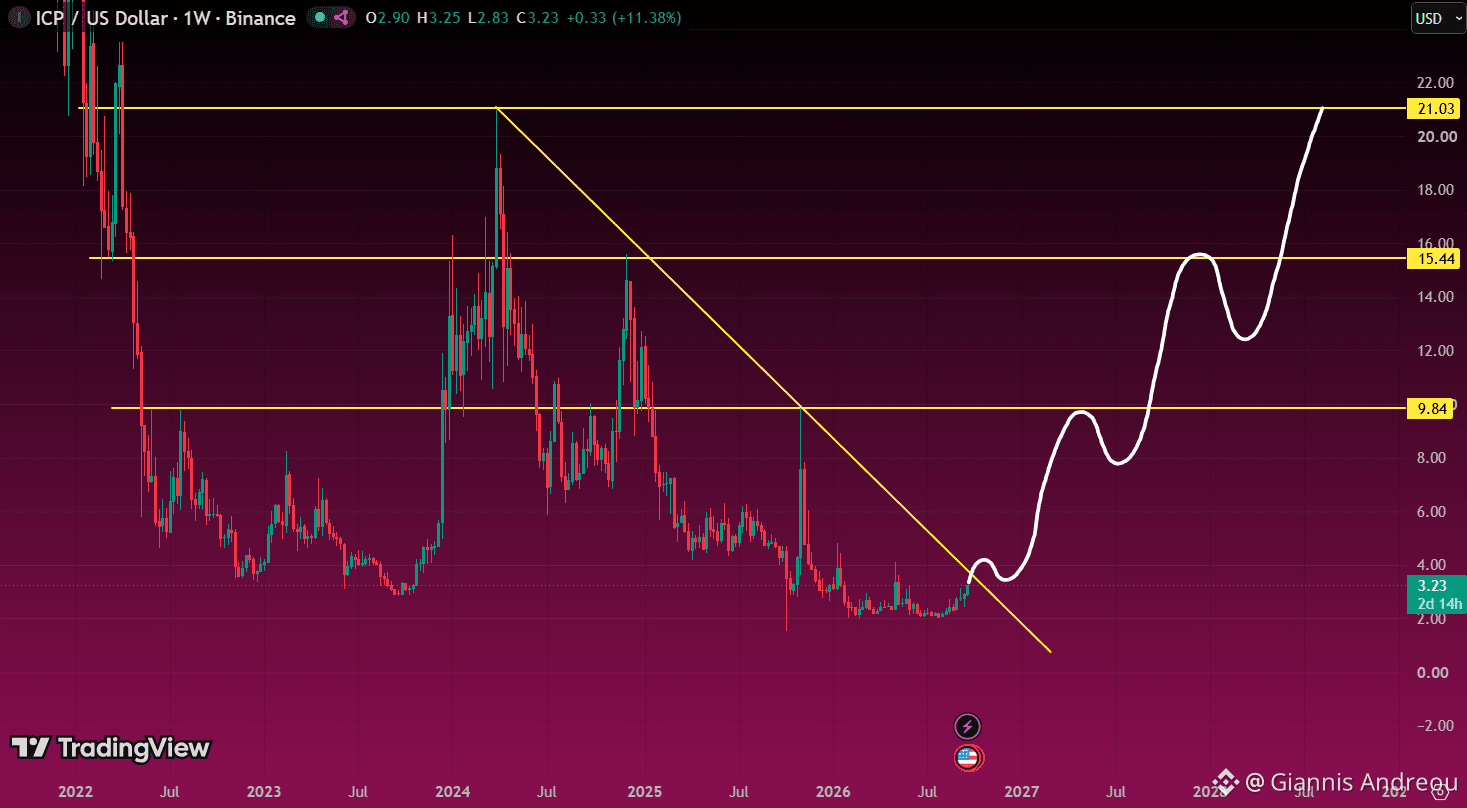
⚪ $ICP: ONE TRENDLINE COULD CHANGE THE PICTURE.
$ICP is approaching the descending trendline from its 2024 peak.
If it breaks above and holds a successful weekly retest, the recovery could start building toward $5–$6, then the major resistance at $9.84.
My broader bullish scenario puts $15.44 and $21.03 on the map, provided each breakout holds and higher lows keep forming.
Until that trendline clears, this remains an unconfirmed setup. Rejection could send price back toward the base near $2.
Nothing is guaranteed. Do Your Own Research.
⚪ $ICP: ONE TRENDLINE COULD CHANGE THE PICTURE.
$ICP is approaching the descending trendline from its 2024 peak.
If it breaks above and holds a successful weekly retest, the recovery could start building toward $5–$6, then the major resistance at $9.84.
My broader bullish scenario puts $15.44 and $21.03 on the map, provided each breakout holds and higher lows keep forming.
Until that trendline clears, this remains an unconfirmed setup. Rejection could send price back toward the base near $2.
Nothing is guaranteed. Do Your Own Research.
$ICP is approaching the descending trendline from its 2024 peak.
If it breaks above and holds a successful weekly retest, the recovery could start building toward $5–$6, then the major resistance at $9.84.
My broader bullish scenario puts $15.44 and $21.03 on the map, provided each breakout holds and higher lows keep forming.
Until that trendline clears, this remains an unconfirmed setup. Rejection could send price back toward the base near $2.
Nothing is guaranteed. Do Your Own Research.
122
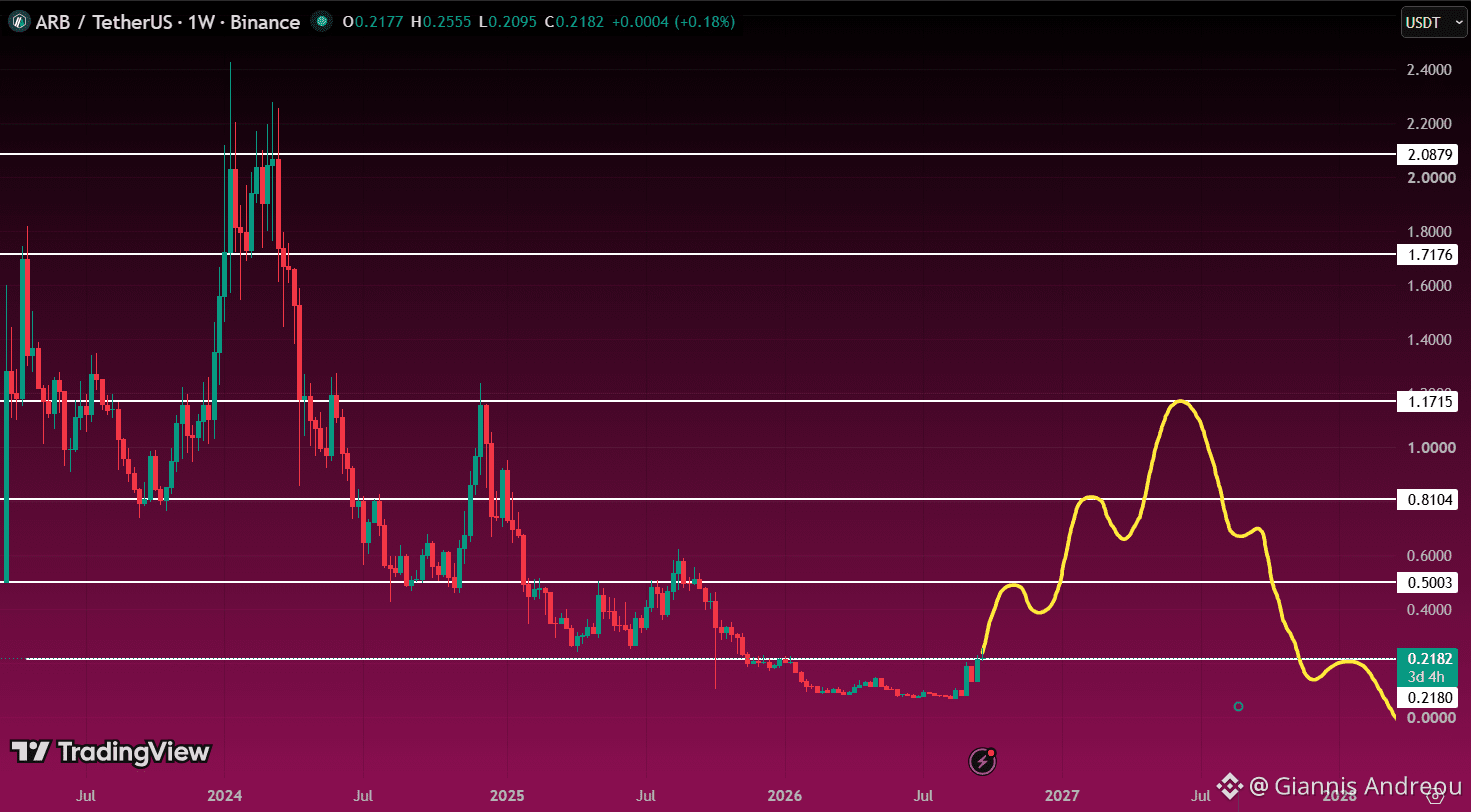
🔵 $ARB: HOW FAR CAN A RELIEF RALLY GO?
$ARB is testing $0.218 after a prolonged decline. The weekly candle is still open, so the reclaim isn’t confirmed.
Hold above this level and establish support, and $0.50 becomes the next major checkpoint. Further strength would bring $0.81, then $1.17 into focus.
My broader scenario is a recovery into resistance followed by renewed selling. Even a rally toward $1.17 would leave price well below its previous peak.
Lose $0.218 and fail to reclaim it, and the recent base comes back into play.
The yellow path illustrates that scenario, not an exact timeline or a prediction of zero.
Nothing is guaranteed. Do Your Own Research.
🔵 $ARB: HOW FAR CAN A RELIEF RALLY GO?
$ARB is testing $0.218 after a prolonged decline. The weekly candle is still open, so the reclaim isn’t confirmed.
Hold above this level and establish support, and $0.50 becomes the next major checkpoint. Further strength would bring $0.81, then $1.17 into focus.
My broader scenario is a recovery into resistance followed by renewed selling. Even a rally toward $1.17 would leave price well below its previous peak.
Lose $0.218 and fail to reclaim it, and the recent base comes back into play.
The yellow path illustrates that scenario, not an exact timeline or a prediction of zero.
Nothing is guaranteed. Do Your Own Research.
$ARB is testing $0.218 after a prolonged decline. The weekly candle is still open, so the reclaim isn’t confirmed.
Hold above this level and establish support, and $0.50 becomes the next major checkpoint. Further strength would bring $0.81, then $1.17 into focus.
My broader scenario is a recovery into resistance followed by renewed selling. Even a rally toward $1.17 would leave price well below its previous peak.
Lose $0.218 and fail to reclaim it, and the recent base comes back into play.
The yellow path illustrates that scenario, not an exact timeline or a prediction of zero.
Nothing is guaranteed. Do Your Own Research.
50
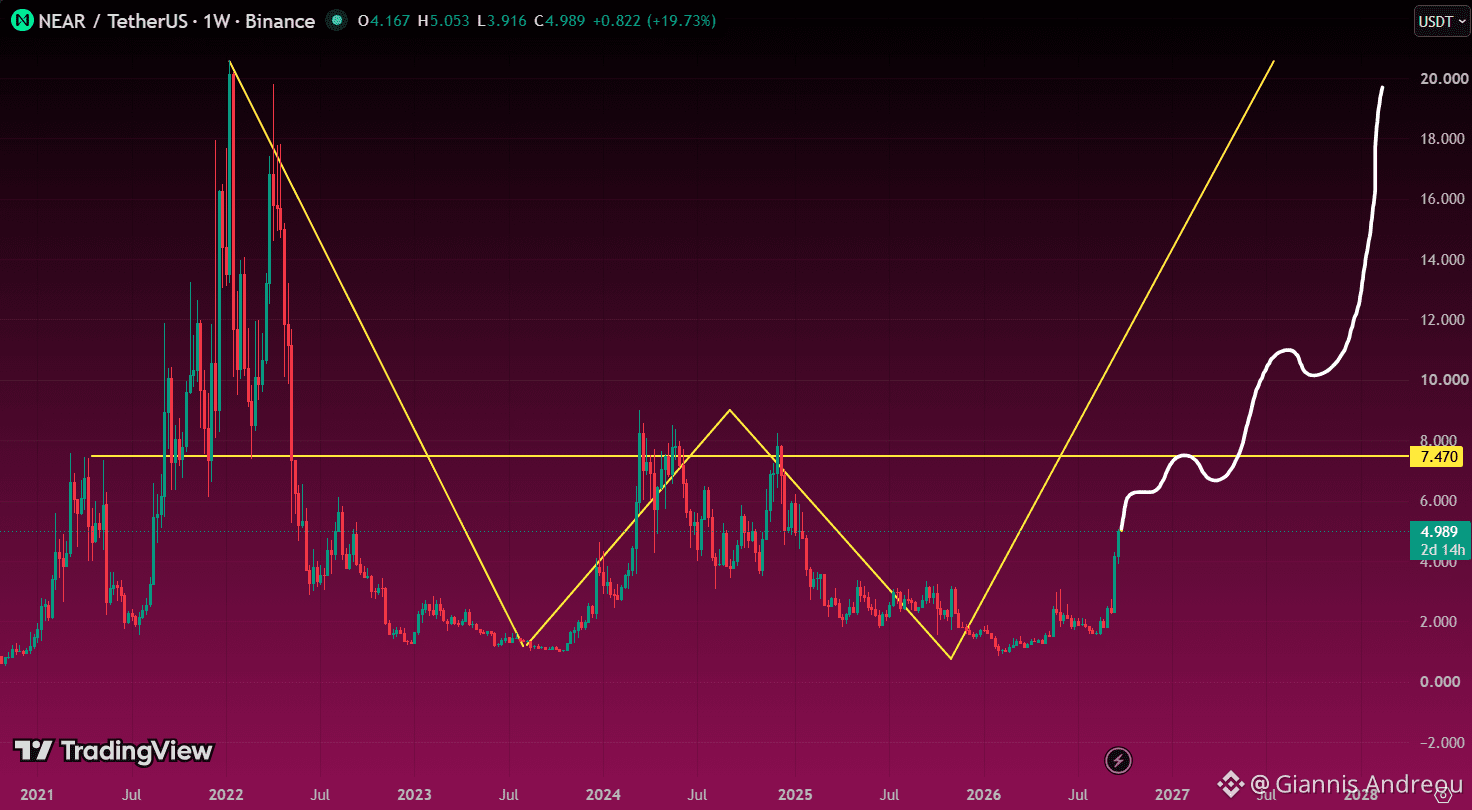
🟢 $NEAR: A MULTI-YEAR W IS TAKING SHAPE.
NEAR’s weekly chart shows a potential double bottom around $1, with the right side now recovering.
$7.47 is the first major resistance. Clearing it would bring the central peak around $9 into focus, the key neckline for confirming the broader W.
A weekly breakout and successful retest there would strengthen the case for $10–$11, followed by a longer-term recovery toward $17–$20.
The pattern is still unconfirmed. Losing the base near $1 would invalidate it.
Nothing is guaranteed. Do Your Own Research.
🟢 $NEAR: A MULTI-YEAR W IS TAKING SHAPE.
NEAR’s weekly chart shows a potential double bottom around $1, with the right side now recovering.
$7.47 is the first major resistance. Clearing it would bring the central peak around $9 into focus, the key neckline for confirming the broader W.
A weekly breakout and successful retest there would strengthen the case for $10–$11, followed by a longer-term recovery toward $17–$20.
The pattern is still unconfirmed. Losing the base near $1 would invalidate it.
Nothing is guaranteed. Do Your Own Research.
NEAR’s weekly chart shows a potential double bottom around $1, with the right side now recovering.
$7.47 is the first major resistance. Clearing it would bring the central peak around $9 into focus, the key neckline for confirming the broader W.
A weekly breakout and successful retest there would strengthen the case for $10–$11, followed by a longer-term recovery toward $17–$20.
The pattern is still unconfirmed. Losing the base near $1 would invalidate it.
Nothing is guaranteed. Do Your Own Research.
47
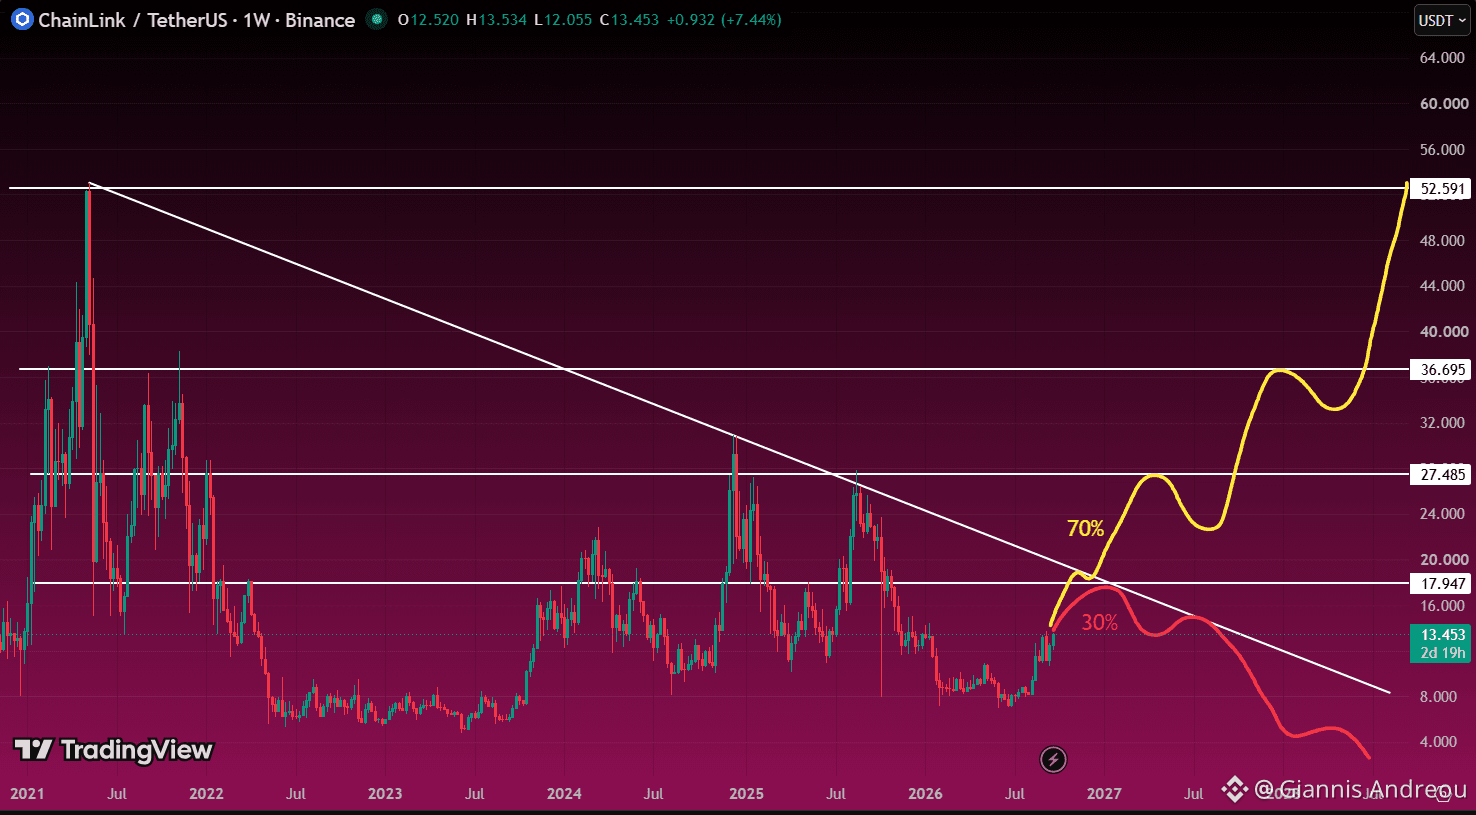
🔗 $LINK : FIVE YEARS OF RESISTANCE. ONE BIG TEST AHEAD.
$LINK is recovering toward $18, where horizontal resistance meets the descending trendline from the 2021 peak.
That confluence is the key to my bullish scenario.
A weekly breakout and successful retest would put $27.49 in focus, followed by $36.70. Clearing those levels could open a path toward $52.59.
Rejection around $18 keeps the broader downtrend intact. Losing support near $8 would seriously weaken the recovery.
The chart’s 70/30 split reflects a subjective scenario weighting, not measured odds.
Nothing is guaranteed. Do Your Own Research.
🔗 $LINK : FIVE YEARS OF RESISTANCE. ONE BIG TEST AHEAD.
$LINK is recovering toward $18, where horizontal resistance meets the descending trendline from the 2021 peak.
That confluence is the key to my bullish scenario.
A weekly breakout and successful retest would put $27.49 in focus, followed by $36.70. Clearing those levels could open a path toward $52.59.
Rejection around $18 keeps the broader downtrend intact. Losing support near $8 would seriously weaken the recovery.
The chart’s 70/30 split reflects a subjective scenario weighting, not measured odds.
Nothing is guaranteed. Do Your Own Research.
$LINK is recovering toward $18, where horizontal resistance meets the descending trendline from the 2021 peak.
That confluence is the key to my bullish scenario.
A weekly breakout and successful retest would put $27.49 in focus, followed by $36.70. Clearing those levels could open a path toward $52.59.
Rejection around $18 keeps the broader downtrend intact. Losing support near $8 would seriously weaken the recovery.
The chart’s 70/30 split reflects a subjective scenario weighting, not measured odds.
Nothing is guaranteed. Do Your Own Research.
52
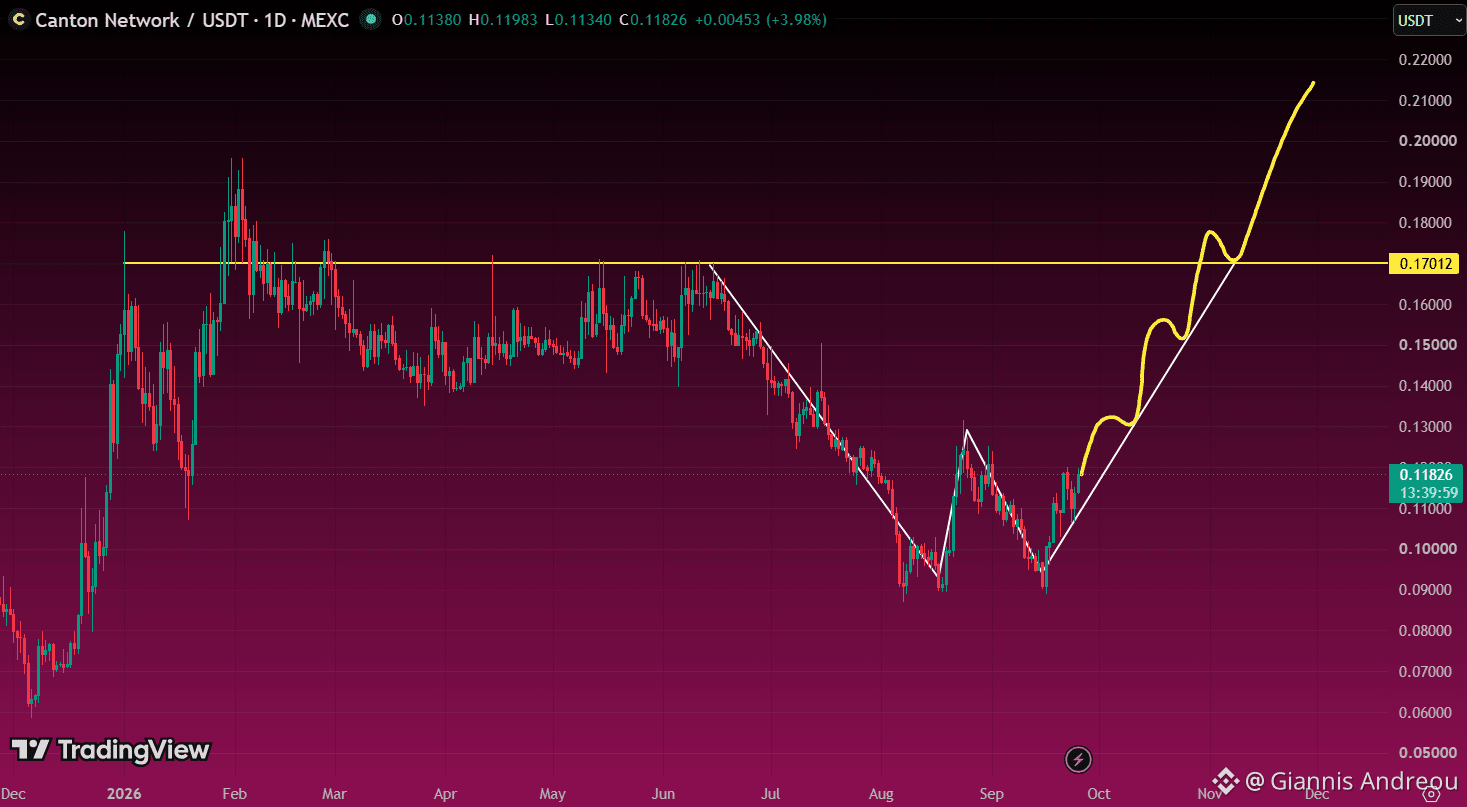
🟡 $CC: A W PATTERN IS TAKING SHAPE.
Canton has tested the $0.09 area twice, forming a potential double bottom on the daily chart.
The neckline sits near $0.13. A daily close above it, followed by a successful retest, would confirm the breakout and put the measured target around $0.17, right at major historical resistance.
Clear $0.17 and hold, and $0.19–$0.22 comes into focus.
Until the neckline breaks, the W remains unconfirmed. Losing $0.09 invalidates the setup.
Nothing is guaranteed. Do Your Own Research.
🟡 $CC: A W PATTERN IS TAKING SHAPE.
Canton has tested the $0.09 area twice, forming a potential double bottom on the daily chart.
The neckline sits near $0.13. A daily close above it, followed by a successful retest, would confirm the breakout and put the measured target around $0.17, right at major historical resistance.
Clear $0.17 and hold, and $0.19–$0.22 comes into focus.
Until the neckline breaks, the W remains unconfirmed. Losing $0.09 invalidates the setup.
Nothing is guaranteed. Do Your Own Research.
Canton has tested the $0.09 area twice, forming a potential double bottom on the daily chart.
The neckline sits near $0.13. A daily close above it, followed by a successful retest, would confirm the breakout and put the measured target around $0.17, right at major historical resistance.
Clear $0.17 and hold, and $0.19–$0.22 comes into focus.
Until the neckline breaks, the W remains unconfirmed. Losing $0.09 invalidates the setup.
Nothing is guaranteed. Do Your Own Research.
109
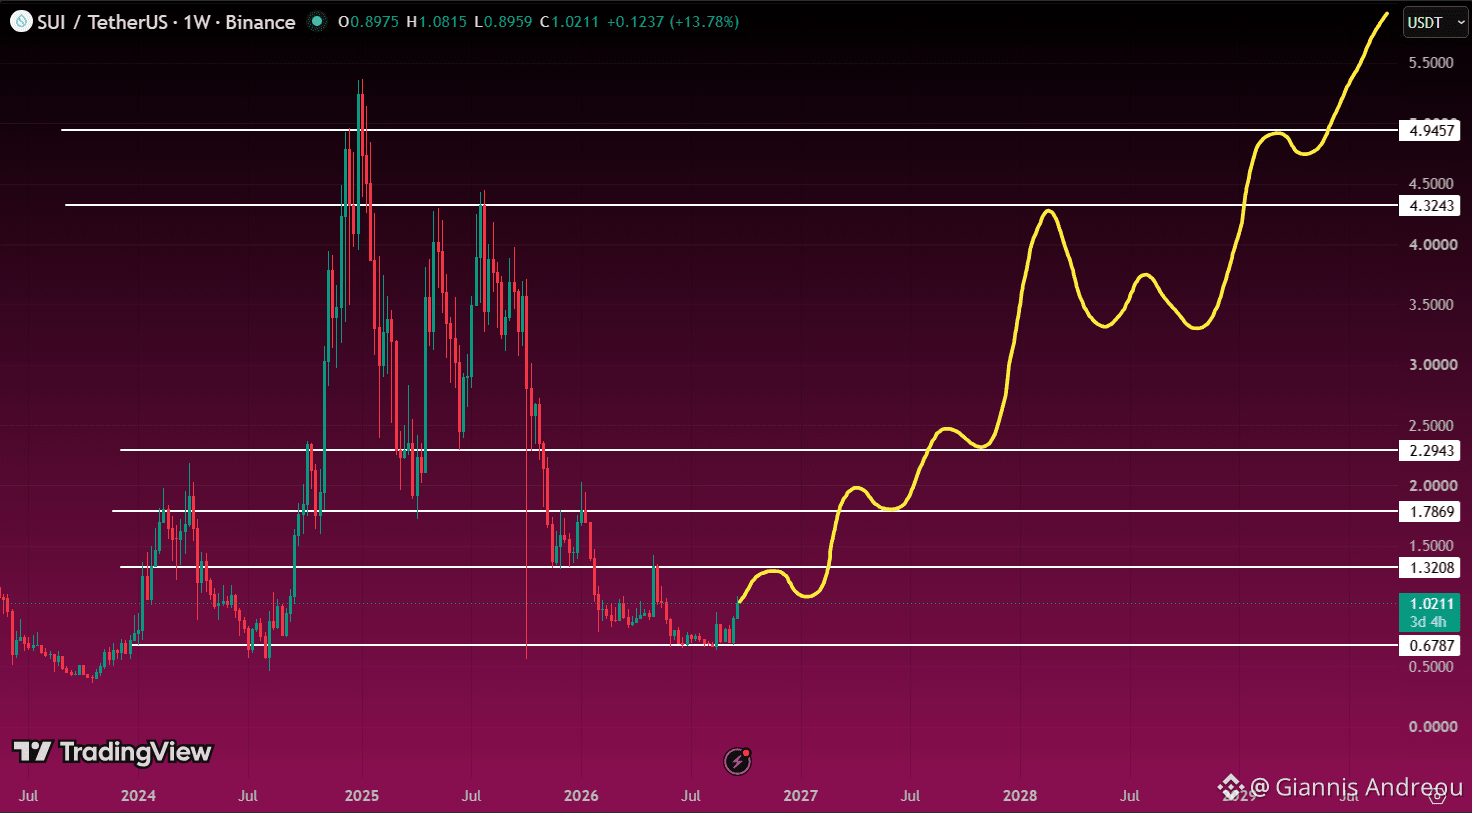
💧 $SUI: THE ROAD BACK STARTS AT $1.32
$SUI is recovering near $1.02 after holding the $0.68 area. Now buyers need to reclaim lost ground.
My first checkpoint is $1.32. A weekly close above it and a successful retest would strengthen the case for $1.79, then $2.29.
If those levels turn into support, the broader recovery scenario brings $4.32 and $4.95 into focus. New highs would still require clearing the previous peak near $5.35.
The yellow path is my bullish scenario, with pullbacks along the way. A weekly breakdown below $0.68 would undermine it.
Nothing is guaranteed. Do Your Own Research.
💧 $SUI: THE ROAD BACK STARTS AT $1.32
$SUI is recovering near $1.02 after holding the $0.68 area. Now buyers need to reclaim lost ground.
My first checkpoint is $1.32. A weekly close above it and a successful retest would strengthen the case for $1.79, then $2.29.
If those levels turn into support, the broader recovery scenario brings $4.32 and $4.95 into focus. New highs would still require clearing the previous peak near $5.35.
The yellow path is my bullish scenario, with pullbacks along the way. A weekly breakdown below $0.68 would undermine it.
Nothing is guaranteed. Do Your Own Research.
$SUI is recovering near $1.02 after holding the $0.68 area. Now buyers need to reclaim lost ground.
My first checkpoint is $1.32. A weekly close above it and a successful retest would strengthen the case for $1.79, then $2.29.
If those levels turn into support, the broader recovery scenario brings $4.32 and $4.95 into focus. New highs would still require clearing the previous peak near $5.35.
The yellow path is my bullish scenario, with pullbacks along the way. A weekly breakdown below $0.68 would undermine it.
Nothing is guaranteed. Do Your Own Research.
37
තවත් අන්තර්ගතයන් ගවේෂණය කිරීමට ඇතුල් වන්න
Binance චතුරශ්රය හි ගෝලීය ක්රිප්ටෝ පරිශීලකයින් හා එක්වන්න
⚡️ ක්රිප්ටෝ පිළිබඳ නවතම සහ ප්රයෝජනවත් තොරතුරු ලබා ගන්න.
💬 ලොව විශාලතම ක්රිප්ටෝ හුවමාරුව මගින් විශ්වාස කෙරේ.
👍 සත්යායනය කරන ලද නිර්මාණකරුවන්ගෙන් සැබෑ විදසුන් සොයා ගන්න.
විද්යුත් තැපෑල / දුරකථන අංකය
නැගී එන මාතෘකා
CircleMints500MUSDCOnSolana
60,189 views
1,514 සාකච්ඡා කරමින්
$SOL — CIRCLE تطبع للتو دفعة جديدة بقيمة 500 مليون دولار من USDC على سولانا. 🚨
قامت شركة Circle بإصدار 500 مليون USDC على سولانا على دفعتين بقيمة 250 مليون دولار، ما أضاف ضخّ سيولة رئيسي آخر إلى الشبكة. يؤكد الإبلاغ على السلسلة عمليات الإصدار، على الرغم من أن الرموز ظلت في البداية ضمن مخزون الخزانة الخاضع لسيطرة Circle بدلًا من دخول التداول فورًا.
وهذا ليس تحركًا معزولًا.
وصل إجمالي المعروض من العملات المستقرة على سولانا إلى مستوى تاريخي جديد عند 17.3 مليار دولار، بينما أفادت التقارير أن Circle قامت بإصدار ما يقارب 11 مليار دولار من USDC على سولانا خلال شهر أغسطس وحده.
لماذا هذا مهم بالنسبة إلى $SOL ؟
زيادة سيولة العملات المستقرة يمكن أن تعني وقودًا أكبر لتداول DEX وDeFi والمدفوعات والنشاط على السلسلة.
الأموال لا تغادر سولانا.
المزيد من الدولارات يتم سكّها باستمرار عليها. 👀
متابعة من فضلكم
$CRCL
#circlemints500musdconsolana #PolymarketBankFailureBetsDrawFDICConcern #BlackRockBuildsTokenizedPortfoliosForOndo #BitwiseFilesToListNEARETFOnNYSEArca #SECCommissionerPeirceToLeaveOct2
Shamika Metting
·6 කැමත්ත දැක්වීම්
·5.4k views
PolymarketBankFailureBetsDrawFDICConcern
72,629 views
1,503 සාකච්ඡා කරමින්
BlackRockBuildsTokenizedPortfoliosForOndo
59,640 views
1,040 සාකච්ඡා කරමින්