
Muhammed Szn
71 පෝස්ටු

Muhammed Szn
Binance Alpha top Chad with Information
විවෘත වෙළෙඳාම
නිතර වෙළෙන්දා
{වේලාව} වසර
9 හඹා යමින්
664 හඹා යන්නන්
175 කැමති විය
පෝස්ටු
ආයෝජන කළඹ
සියල්ල
උපුටා දැක්වීම්
පරිවර්තනය බලන්න
පරිවර්තනය බලන්න

Fhiyyerh
·
--
The Math Behind SOL’s Bullish Return
Extreme fear in crypto rarely appears dramatic at first. Structurally, it shows up as declining liquidity, volatility compression, and persistent rejection under resistance clusters.
The current macro backdrop reflects cautious capital rotation rather than aggressive expansion. #bitcoin dominance remains influential, while high-beta assets trade in compressed ranges.
Historically, #Solana has behaved as a rebound-sensitive asset. After prolonged compression phases, its structural recoveries have tended to accelerate relative to its drawdown speed.
Solana was designed for high throughput and low transaction costs. That architecture makes it attractive during expansion phases, particularly when on-chain activity rises sharply.
The same high-beta nature that fuels upside also intensifies downside during market stress. In my experience, $SOL tends to overshoot both directions, especially when liquidity thins.
If we look closer at prior cycles, drawdowns were severe but not structurally terminal. After compression under resistance, recovery phases formed rapidly once broader conditions stabilized.
Bitcoin dominance plays a role here. As capital rotates outward from BTC, high-beta ecosystems historically see accelerated structural rebounds.
Rebounds rarely begin with price alone. Validator expansion, ecosystem tooling, and developer retention often strengthen quietly before visible breakouts.
Historically, Solana’s recovery phases aligned with periods of renewed application growth and infrastructure refinement. What stands out is that base formation often overlapped with ecosystem stabilization.
From what I’ve observed, accumulation phases tend to look inactive on the surface. Yet structurally, they represent energy storage beneath resistance.
The pattern that follows is typically measured: reclaim, consolidation, then expansion toward prior highs.
#Ethereum has already completed a prior accumulation-to-expansion cycle in the past. Its structure transitioned from prolonged compression into sustained continuation once resistance broke decisively.
Solana’s current structure appears earlier in that sequence. The resemblance lies in compression dynamics and resistance reclaim behavior, not in price magnitude assumptions.
At the same time, it remains a developing pattern. Structural similarity strengthens the rebound case, but completion depends on sustained participation and liquidity rotation.
Right now, SOL is still trading well below its 2021 all-time high, which reflects broader market conditions rather than a broken structure. From a structural standpoint, holding reclaimed support would be the first real signal of renewed expansion.
Final thoughts
Solana’s historical behavior reflects a recurring cycle: compression, base formation, reclaim, and expansion. Each phase builds upon structural positioning rather than emotional momentum.
I stand grounded that the math behind the rebound is not a prediction. It is an observation of repeated structural responses to liquidity compression across prior cycles, and this cycle is no different.
#SolanaJourney
The current macro backdrop reflects cautious capital rotation rather than aggressive expansion. #bitcoin dominance remains influential, while high-beta assets trade in compressed ranges.
Historically, #Solana has behaved as a rebound-sensitive asset. After prolonged compression phases, its structural recoveries have tended to accelerate relative to its drawdown speed.
Solana was designed for high throughput and low transaction costs. That architecture makes it attractive during expansion phases, particularly when on-chain activity rises sharply.
The same high-beta nature that fuels upside also intensifies downside during market stress. In my experience, $SOL tends to overshoot both directions, especially when liquidity thins.
If we look closer at prior cycles, drawdowns were severe but not structurally terminal. After compression under resistance, recovery phases formed rapidly once broader conditions stabilized.
Bitcoin dominance plays a role here. As capital rotates outward from BTC, high-beta ecosystems historically see accelerated structural rebounds.
Rebounds rarely begin with price alone. Validator expansion, ecosystem tooling, and developer retention often strengthen quietly before visible breakouts.
Historically, Solana’s recovery phases aligned with periods of renewed application growth and infrastructure refinement. What stands out is that base formation often overlapped with ecosystem stabilization.
From what I’ve observed, accumulation phases tend to look inactive on the surface. Yet structurally, they represent energy storage beneath resistance.
The pattern that follows is typically measured: reclaim, consolidation, then expansion toward prior highs.
#Ethereum has already completed a prior accumulation-to-expansion cycle in the past. Its structure transitioned from prolonged compression into sustained continuation once resistance broke decisively.
Solana’s current structure appears earlier in that sequence. The resemblance lies in compression dynamics and resistance reclaim behavior, not in price magnitude assumptions.
At the same time, it remains a developing pattern. Structural similarity strengthens the rebound case, but completion depends on sustained participation and liquidity rotation.
Right now, SOL is still trading well below its 2021 all-time high, which reflects broader market conditions rather than a broken structure. From a structural standpoint, holding reclaimed support would be the first real signal of renewed expansion.
Final thoughts
Solana’s historical behavior reflects a recurring cycle: compression, base formation, reclaim, and expansion. Each phase builds upon structural positioning rather than emotional momentum.
I stand grounded that the math behind the rebound is not a prediction. It is an observation of repeated structural responses to liquidity compression across prior cycles, and this cycle is no different.
#SolanaJourney
පරිවර්තනය බලන්න


Binance Square Official
·
--
Congratulations to the winners who won the 1BNB surprise drop from Binance Square on Feb 13 for your content. Keep it up and continue to share good quality insights with unique value.
@Muhammed Szn :Why I Long Bitcoin at Resistance (And Short Support)
@Yeakub Durjoy :Understanding the Memecoin Economy: How I See It
@DNT_Capital :Opportunity to Catch Bitcoin Bottom at 65K When All Technical Indicators Signal Strong Buy
@dhrugtest :Ethereum 1,900 Retest Could Decide Next Major Move – Is ETH Preparing For New Lows?
@W Shakespeare :GOLD AND SILVER ARE IN FREE FALL — PANIC IS THE STRATEGY, NOT THE MARKET
@Muhammed Szn :Why I Long Bitcoin at Resistance (And Short Support)
@Yeakub Durjoy :Understanding the Memecoin Economy: How I See It
@DNT_Capital :Opportunity to Catch Bitcoin Bottom at 65K When All Technical Indicators Signal Strong Buy
@dhrugtest :Ethereum 1,900 Retest Could Decide Next Major Move – Is ETH Preparing For New Lows?
@W Shakespeare :GOLD AND SILVER ARE IN FREE FALL — PANIC IS THE STRATEGY, NOT THE MARKET

පරිවර්තනය බලන්න

SHEUIBRAHIM
·
--
MANAGING RISK AND REWARDS
📊 Managing Risk While Letting Winners Run My Current Futures Positions
Trading isn’t about being right every time.
It’s about managing risk while positioning for asymmetric rewards.
Here’s a breakdown of two positions I’m currently holding:
🟢 Position 1: $UNI /USDT (Long – 10x)
Entry: 3.500
Mark Price: 3.661
Margin: 30.75 USDT
Unrealized PnL: +13.52 USDT
ROE: +43.97%
This position is performing strongly and reacting well to structure.
The key factors:
Clean breakout from support
Strong continuation momentum
Risk defined from entry
At 10x leverage, position control is critical.
The goal here is not greed,it’s protecting profit while allowing expansion.
Plan:
Trail stop progressively
Secure partial profits at resistance
Protect capital first, compound second
🔴 Position 2: $RIVER /USDT (Long – 2x)
Entry: 14.600
Mark Price: 14.006
Margin: 28.01 USDT
Unrealized PnL: -2.39 USDT
ROE: -8.56%
This is a lower-leverage position designed for structure play.
Why 2x? Because not every setup deserves high exposure.
Currently in controlled drawdown:
Risk is minimal relative to margin
No emotional decision-making
Structure still being respected
Losses are part of the business.
Small losses protect accounts. Large losses destroy them.
🧠 The Bigger Picture
This is what real trading looks like:
✔ One position running
✔ One position consolidating
✔ Risk controlled
✔ No panic
You don’t need every trade to win.
You need:
Proper risk management
Defined stop-loss
Reward-to-risk discipline
Emotional stability
Capital preservation > Ego.
📈 Lesson
A trader’s job is not to predict.
A trader’s job is to manage risk and let probabilities play out.
Green trades pay you.
Red trades teach you.
Discipline keeps you in the game.
#TradeCryptosOnX #Uniswap’s #RİVER
Trading isn’t about being right every time.
It’s about managing risk while positioning for asymmetric rewards.
Here’s a breakdown of two positions I’m currently holding:
🟢 Position 1: $UNI /USDT (Long – 10x)
Entry: 3.500
Mark Price: 3.661
Margin: 30.75 USDT
Unrealized PnL: +13.52 USDT
ROE: +43.97%
This position is performing strongly and reacting well to structure.
The key factors:
Clean breakout from support
Strong continuation momentum
Risk defined from entry
At 10x leverage, position control is critical.
The goal here is not greed,it’s protecting profit while allowing expansion.
Plan:
Trail stop progressively
Secure partial profits at resistance
Protect capital first, compound second
🔴 Position 2: $RIVER /USDT (Long – 2x)
Entry: 14.600
Mark Price: 14.006
Margin: 28.01 USDT
Unrealized PnL: -2.39 USDT
ROE: -8.56%
This is a lower-leverage position designed for structure play.
Why 2x? Because not every setup deserves high exposure.
Currently in controlled drawdown:
Risk is minimal relative to margin
No emotional decision-making
Structure still being respected
Losses are part of the business.
Small losses protect accounts. Large losses destroy them.
🧠 The Bigger Picture
This is what real trading looks like:
✔ One position running
✔ One position consolidating
✔ Risk controlled
✔ No panic
You don’t need every trade to win.
You need:
Proper risk management
Defined stop-loss
Reward-to-risk discipline
Emotional stability
Capital preservation > Ego.
📈 Lesson
A trader’s job is not to predict.
A trader’s job is to manage risk and let probabilities play out.
Green trades pay you.
Red trades teach you.
Discipline keeps you in the game.
#TradeCryptosOnX #Uniswap’s #RİVER
පරිවර්තනය බලන්න

Fatima_ Zahra
·
--
$BULLA what should do i now😭😭😭
i'm lost💔😭
close or hold $BULLA
i'm lost💔😭
close or hold $BULLA
පරිවර්තනය බලන්න

Crypto_Star_BNB
·
--
🐸🎁 $COA
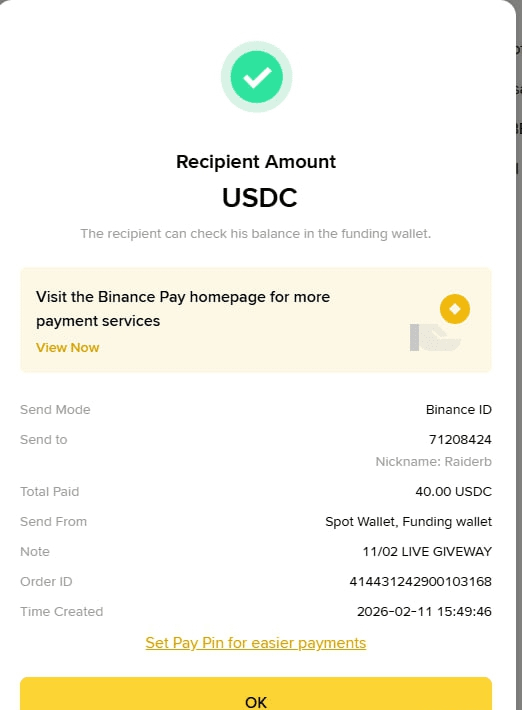
COA – 40 USDC GIVEAWAY! 🎁🐸
Yes, you heard it right…
💰 40 $USDC
up for grabs!
Simple. Fast. Rewarding. 🚀
✅ How to Join:
1️⃣ Follow this account
2️⃣ Like & share this post
3️⃣ Comment “COA COA” 🐸
That’s it — you’re in!
More rewards, more opportunities, more winning chances coming soon 👀
Don’t miss out… next winner could be YOU! 🎯
#Trading #Binance #CryptoGiveaway #USDC
COA – 40 USDC GIVEAWAY! 🎁🐸
Yes, you heard it right…
💰 40 $USDC
up for grabs!
Simple. Fast. Rewarding. 🚀
✅ How to Join:
1️⃣ Follow this account
2️⃣ Like & share this post
3️⃣ Comment “COA COA” 🐸
That’s it — you’re in!
More rewards, more opportunities, more winning chances coming soon 👀
Don’t miss out… next winner could be YOU! 🎯
#Trading #Binance #CryptoGiveaway #USDC
පරිවර්තනය බලන්න
Muhammed Szn
·
--
BTC Short-Term Holders Capitulation Zone Is Back
Bitcoin’s Short-Term Holder (STH) NUPL has dropped to around –0.5, a level that historically signals intense unrealized losses among recent buyers. But what does that actually mean and why does it matter ?
First, What Is STH NUPL?
NUPL (Net Unrealized Profit/Loss) measures whether holders are, on average, sitting in profit or loss.
Above 0 → holders are mostly in profitBelow 0 → holders are mostly in loss
When we focus on Short-Term Holders (coins held <155 days), we’re looking at the most reactive participants in the market — traders and recent buyers who are more likely to panic sell during drawdowns.
So when STH NUPL falls to –0.5, it means:
A large portion of recent buyers are deeply underwaterMarket sentiment among short-term players is extremely negativeFear is dominating decision-making
Historically, this is where emotional selling peaks.
📉 Why –0.5 Is Important
Levels this deep don’t happen often.
Previous times STH NUPL reached similar depths:
Mid-2022 post-ATH crashLate-stage bear market conditionsPeriods of forced exits and capitulation
These moments were characterized by:
Panic sellingRetail exhaustionWeak hands exiting the marketQuiet accumulation by stronger participants
It’s important to note: these zones historically formed near macro bottoms, not at the beginning of fresh breakdowns.
🧠 Psychology Behind Capitulation
Capitulation is not just a price event it’s an emotional event
It’s when:
Traders lose conviction
Social sentiment turns aggressively bearishIt’s over” narratives dominate
Ironically, these are the environments where long-term investors begin accumulating, not distributing.
Why?
Because markets move from:
Euphoria → Distribution
Fear → AccumulationWhen short-term pain peaks, long-term opportunity often forms.
📊 Big Picture Takeaway
When:
Short-term holders are deeply underwaterFear dominates sentimentSelling pressure appears exhausted
We’re often closer to a smart money accumulation window than a structural breakdown phase.
The market punishes late buyers at the top… and rewards patient accumulators during peak discomfort.
First, What Is STH NUPL?
NUPL (Net Unrealized Profit/Loss) measures whether holders are, on average, sitting in profit or loss.
Above 0 → holders are mostly in profitBelow 0 → holders are mostly in loss
When we focus on Short-Term Holders (coins held <155 days), we’re looking at the most reactive participants in the market — traders and recent buyers who are more likely to panic sell during drawdowns.
So when STH NUPL falls to –0.5, it means:
A large portion of recent buyers are deeply underwaterMarket sentiment among short-term players is extremely negativeFear is dominating decision-making
Historically, this is where emotional selling peaks.
📉 Why –0.5 Is Important
Levels this deep don’t happen often.
Previous times STH NUPL reached similar depths:
Mid-2022 post-ATH crashLate-stage bear market conditionsPeriods of forced exits and capitulation
These moments were characterized by:
Panic sellingRetail exhaustionWeak hands exiting the marketQuiet accumulation by stronger participants
It’s important to note: these zones historically formed near macro bottoms, not at the beginning of fresh breakdowns.
🧠 Psychology Behind Capitulation
Capitulation is not just a price event it’s an emotional event
It’s when:
Traders lose conviction
Social sentiment turns aggressively bearishIt’s over” narratives dominate
Ironically, these are the environments where long-term investors begin accumulating, not distributing.
Why?
Because markets move from:
Euphoria → Distribution
Fear → AccumulationWhen short-term pain peaks, long-term opportunity often forms.
📊 Big Picture Takeaway
When:
Short-term holders are deeply underwaterFear dominates sentimentSelling pressure appears exhausted
We’re often closer to a smart money accumulation window than a structural breakdown phase.
The market punishes late buyers at the top… and rewards patient accumulators during peak discomfort.
පරිවර්තනය බලන්න
තවත් අන්තර්ගතයන් ගවේෂණය කිරීමට ඇතුල් වන්න