

cryptos talker
44 පෝස්ටු

cryptos talker
වාර්තා කරන්න
පරිශීලක අවහිර කරන්න
8 හඹා යමින්
64 හඹා යන්නන්
27 කැමති විය
පෝස්ටු
ආයෝජන කළඹ
සියල්ල
උපුටා දැක්වීම්
සජීවි
·
--
උසබ තත්ත්වය
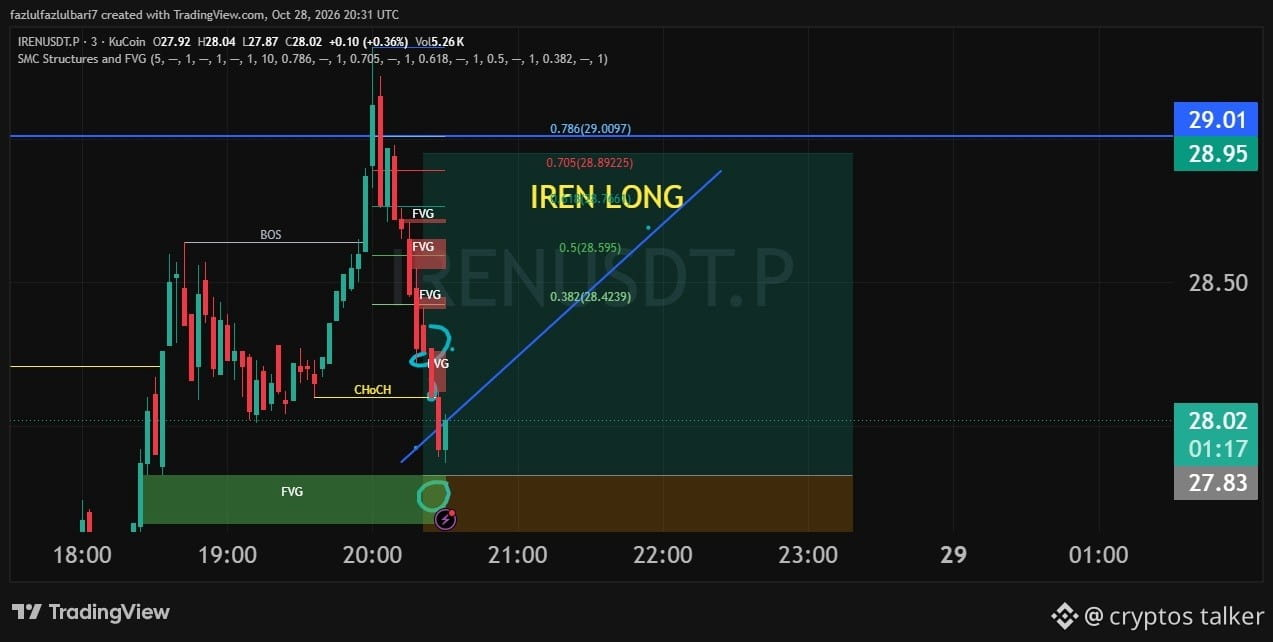
🚀 IREN/USDT — BULLISH LONG SETUP 📈
IREN is showing a potential bullish reversal opportunity on the 3-minute chart! 🔥
After a sharp pullback, price is approaching a key demand zone around 27.83–28.00, where buyers could step in and push the price higher.
🎯 Potential Targets:
TP1: 28.42
TP2: 28.60
TP3: 28.89
TP4: 29.01
🛡️ Key Support: 27.83
📈 Bullish Bias: A strong bounce from the demand zone could trigger an upside move.
⚠️ Important: Wait for bullish confirmation before entering. If price breaks below the support zone, the setup may be invalidated.
Will IREN pump toward $29.00? 👀🚀
#IREN #IRENUSDT #CryptoTrading #TechnicalAnalysis #TradingSignals #Altcoins
$IREN
{future}(IRENUSDT)
🚀 IREN/USDT — BULLISH LONG SETUP 📈
IREN is showing a potential bullish reversal opportunity on the 3-minute chart! 🔥
After a sharp pullback, price is approaching a key demand zone around 27.83–28.00, where buyers could step in and push the price higher.
🎯 Potential Targets:
TP1: 28.42
TP2: 28.60
TP3: 28.89
TP4: 29.01
🛡️ Key Support: 27.83
📈 Bullish Bias: A strong bounce from the demand zone could trigger an upside move.
⚠️ Important: Wait for bullish confirmation before entering. If price breaks below the support zone, the setup may be invalidated.
Will IREN pump toward $29.00? 👀🚀
#IREN #IRENUSDT #CryptoTrading #TechnicalAnalysis #TradingSignals #Altcoins
$IREN
81
·
--
බෙයාරිෂ්
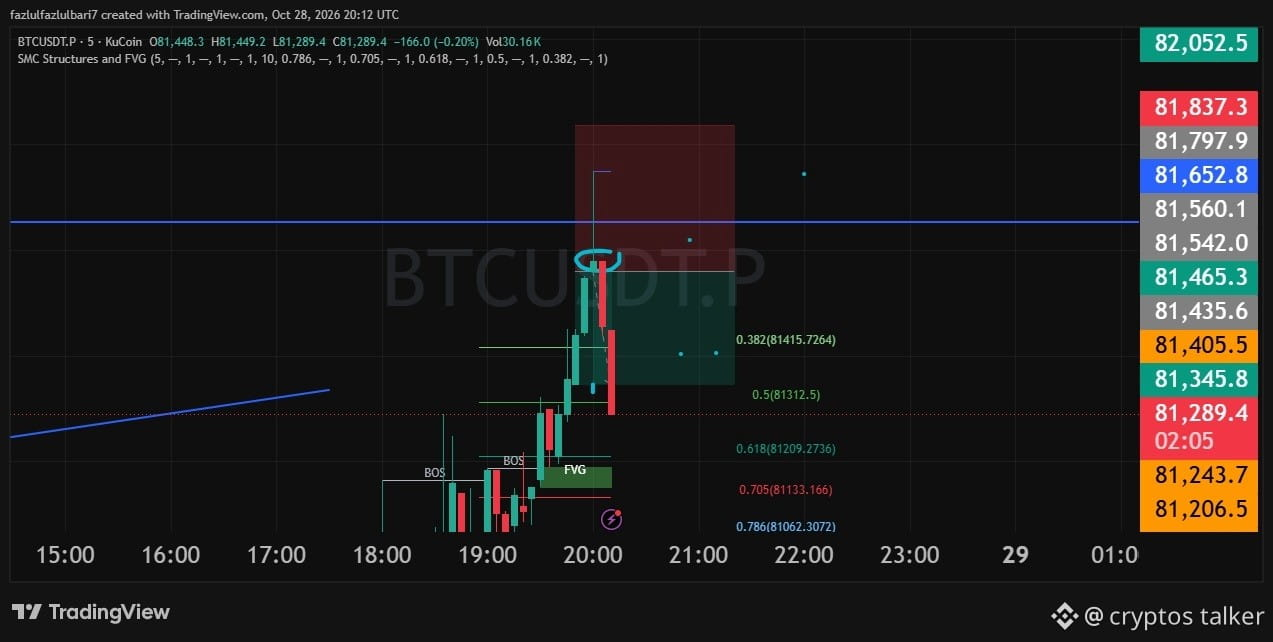
📉 BTC SHORT SETUP — MORE DOWNSIDE EXPECTED! 🐻
BTC faced strong rejection near the $81,465–$81,540 resistance zone, followed by a sharp bearish candle. More downside could be coming if sellers maintain control.
🎯 Short Targets:
TP1: $81,210
TP2: $81,130
TP3: $81,060
🛑 Invalidation: Above $81,560–$81,650
⚠️ Watch for a weak retest before entering. A break below $81,200 could strengthen bearish momentum.
#BTC #Bitcoin #CryptoTrading #TechnicalAnalysis #BTCUSDT $BTC
143
·
--
උසබ තත්ත්වය
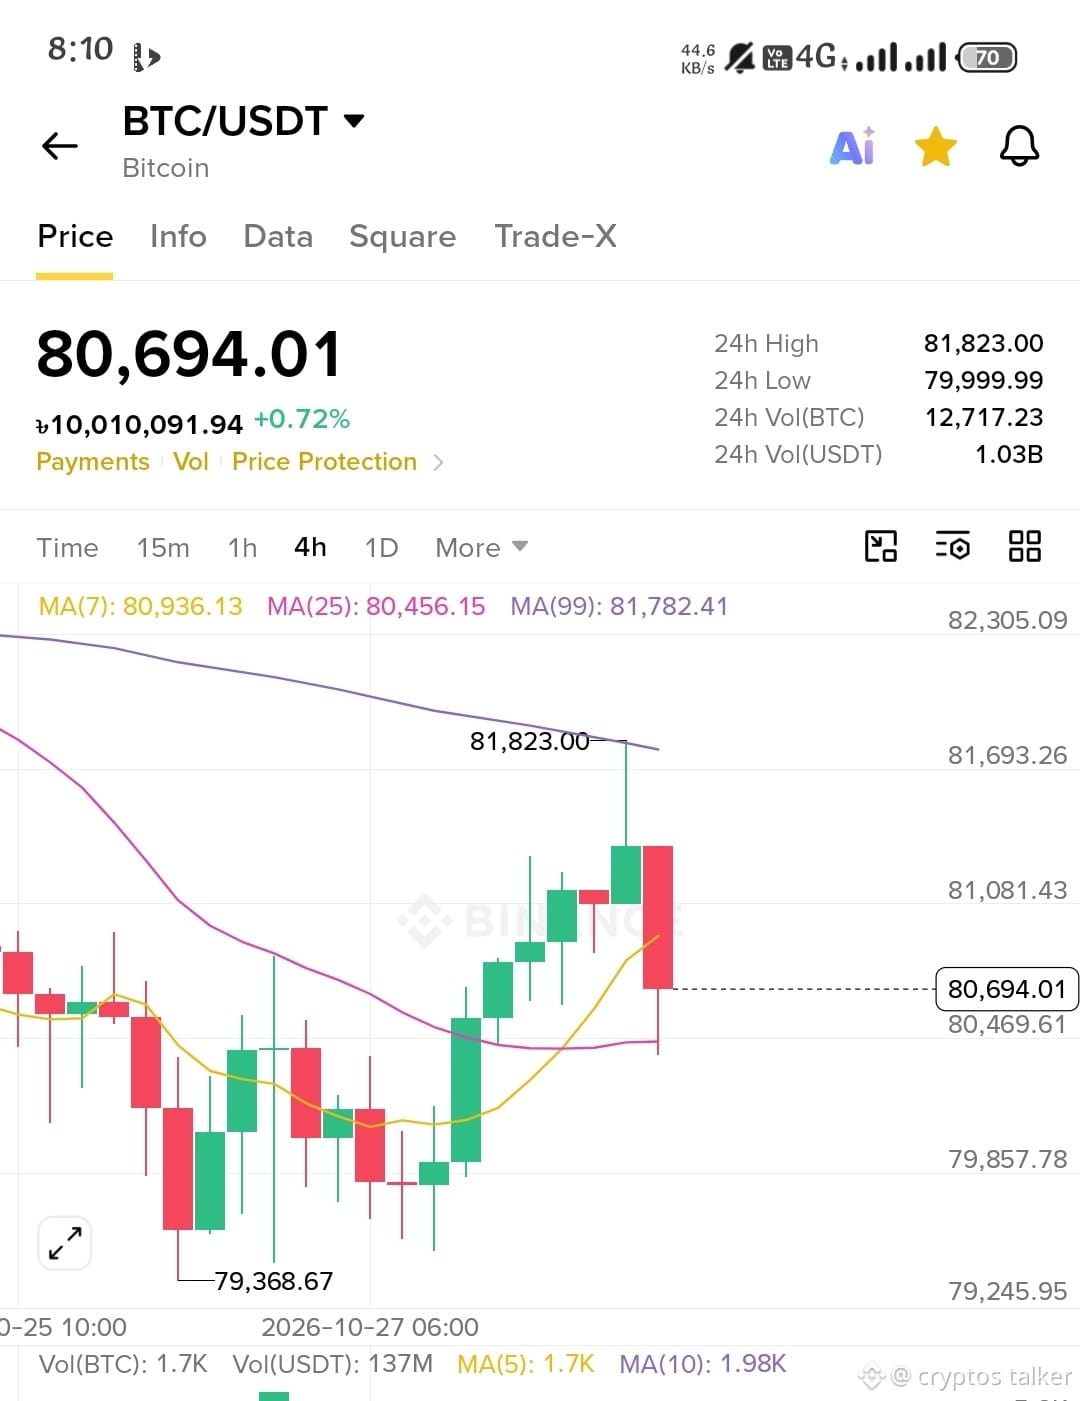
btc📊 BTC/USDT Technical Analysis | Binance
Bitcoin is approaching a key resistance zone. Traders should watch for a confirmed breakout or rejection before entering a position.
🔹 Resistance Levels:
• R1: $81,400–$81,600
• R2: $81,960–$82,000
• R3: $83,100
🔹 Support Levels:
• S1: $80,150–$80,570
• S2: $79,200–$79,850
• S3: $78,100–$78,800
🟢 Bullish Scenario: A confirmed breakout above $81,960 could open the door toward $82,400 and $83,100.
🔴 Bearish Scenario: A breakdown below $80,150 could lead to further downside toward $79,500.
⚠️ Trading Strategy: Wait for confirmation, manage your risk, and avoid emotional entries. These levels are potential scenarios, not guaranteed predictions.
💬 What's your BTC prediction? $83K or $79K first?
#BTC #Bitcoin #Binance #CryptoAnalysis #BTCUSDT #TechnicalAnalysis #CryptoTrading
$BTC $
111
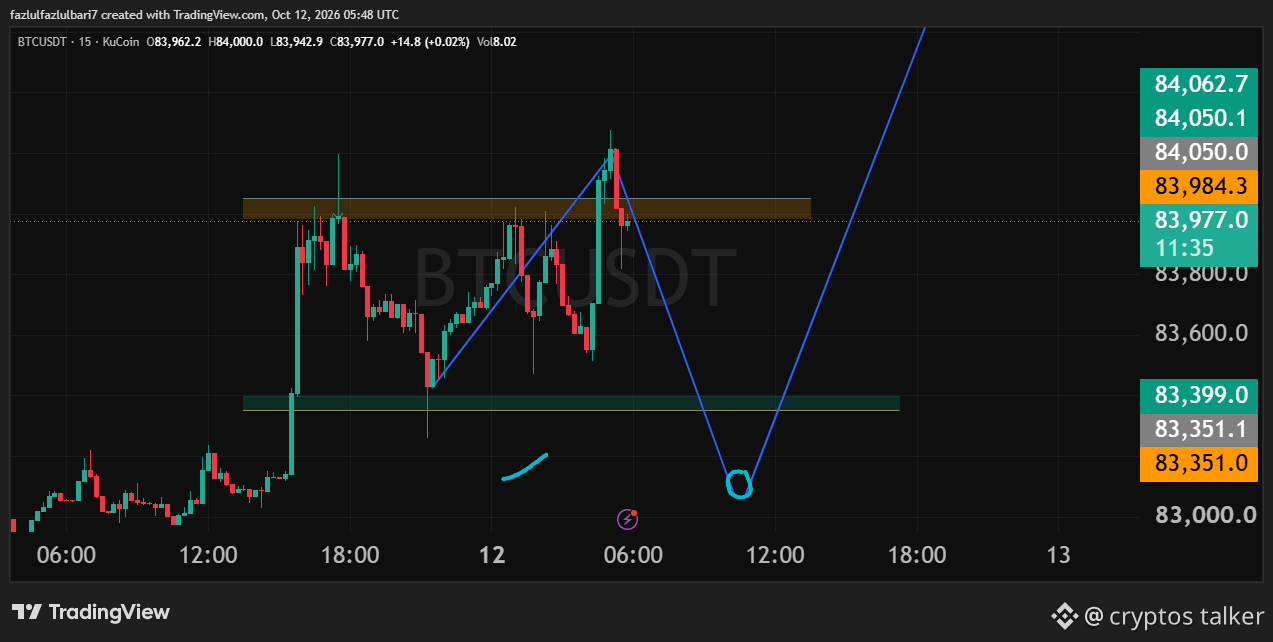
📊 BTC/USDT Technical Analysis | 15M Timeframe
Bitcoin is facing strong resistance around $83,980–$84,050 after a sharp upward move. The latest candles show rejection from this zone, indicating a possible short-term pullback.
🔴 Resistance: $83,980–$84,050
🟢 Major Support: $83,350–$83,400
📉 SHORT SETUP
Entry: $83,950–$84,050 (after bearish confirmation)
TP1: $83,700
TP2: $83,500
TP3: $83,400
Stop Loss: $84,150
📈 LONG SETUP
Entry: $83,350–$83,450 (after a confirmed bounce)
TP1: $83,700
TP2: $83,980
TP3: $84,050
Stop Loss: $83,200
🎯 Market Outlook:
A pullback toward the $83,350–$83,400 support zone is possible. If BTC breaks above $84,050 and holds, bullish continuation toward $84,200–$84,400 could follow.
⚠️ Trading Strategy: Don't chase the price. Wait for confirmation before entering any trade and always manage your risk.
This analysis is based on the 15-minute chart and is not financial advice.
#BTC #Bitcoin #BTCUSDT #CryptoAnalysis #TechnicalAnalysis #CryptoTrading
105
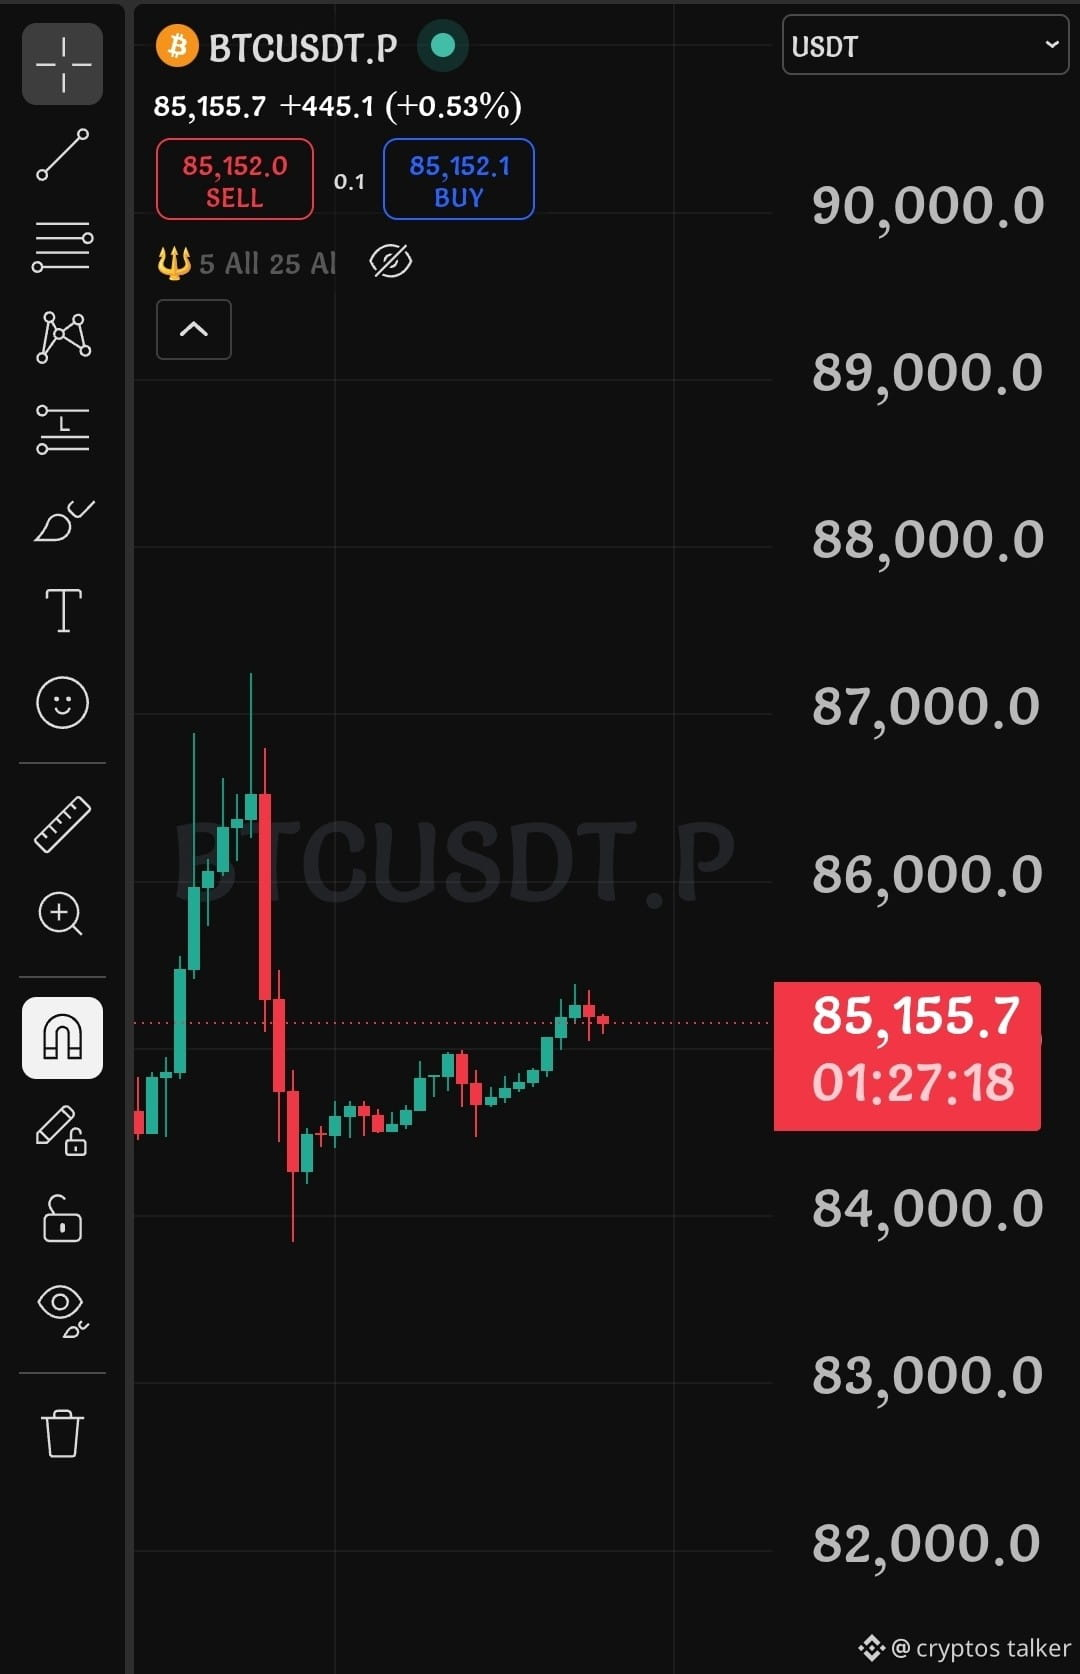
BTC/USDT Technical Analysis 📊
Current Price: ~$85,155
🟢 LONG Trade Setup
Entry: $85,000 – $85,200
TP1: $85,500
TP2: $86,000
TP3: $86,500
Stop Loss: $84,650
Key Levels
Resistance: $85,400–$85,600
Next Resistance: $86,000 / $86,500
Support: $84,700–$84,800
Major Support: $84,200–$84,400
Analysis: BTC is showing a short-term bullish recovery with higher lows after bouncing from the $84K area. A clean breakout and retest above $85,500 could trigger further upside toward $86K–$86.5K.
⚠️ Invalidation: If BTC breaks and closes below $84,650, the bullish setup becomes invalid and downside toward $84,200–$83,800 becomes possible.
Bias: 🟢 Slightly Bullish
Use proper risk management; this is a technical setup, not financial advice.
$BTC
{future}(BTCUSDT)
BTC/USDT Technical Analysis 📊
Current Price: ~$85,155
🟢 LONG Trade Setup
Entry: $85,000 – $85,200
TP1: $85,500
TP2: $86,000
TP3: $86,500
Stop Loss: $84,650
Key Levels
Resistance: $85,400–$85,600
Next Resistance: $86,000 / $86,500
Support: $84,700–$84,800
Major Support: $84,200–$84,400
Analysis: BTC is showing a short-term bullish recovery with higher lows after bouncing from the $84K area. A clean breakout and retest above $85,500 could trigger further upside toward $86K–$86.5K.
⚠️ Invalidation: If BTC breaks and closes below $84,650, the bullish setup becomes invalid and downside toward $84,200–$83,800 becomes possible.
Bias: 🟢 Slightly Bullish
Use proper risk management; this is a technical setup, not financial advice.
$BTC
78
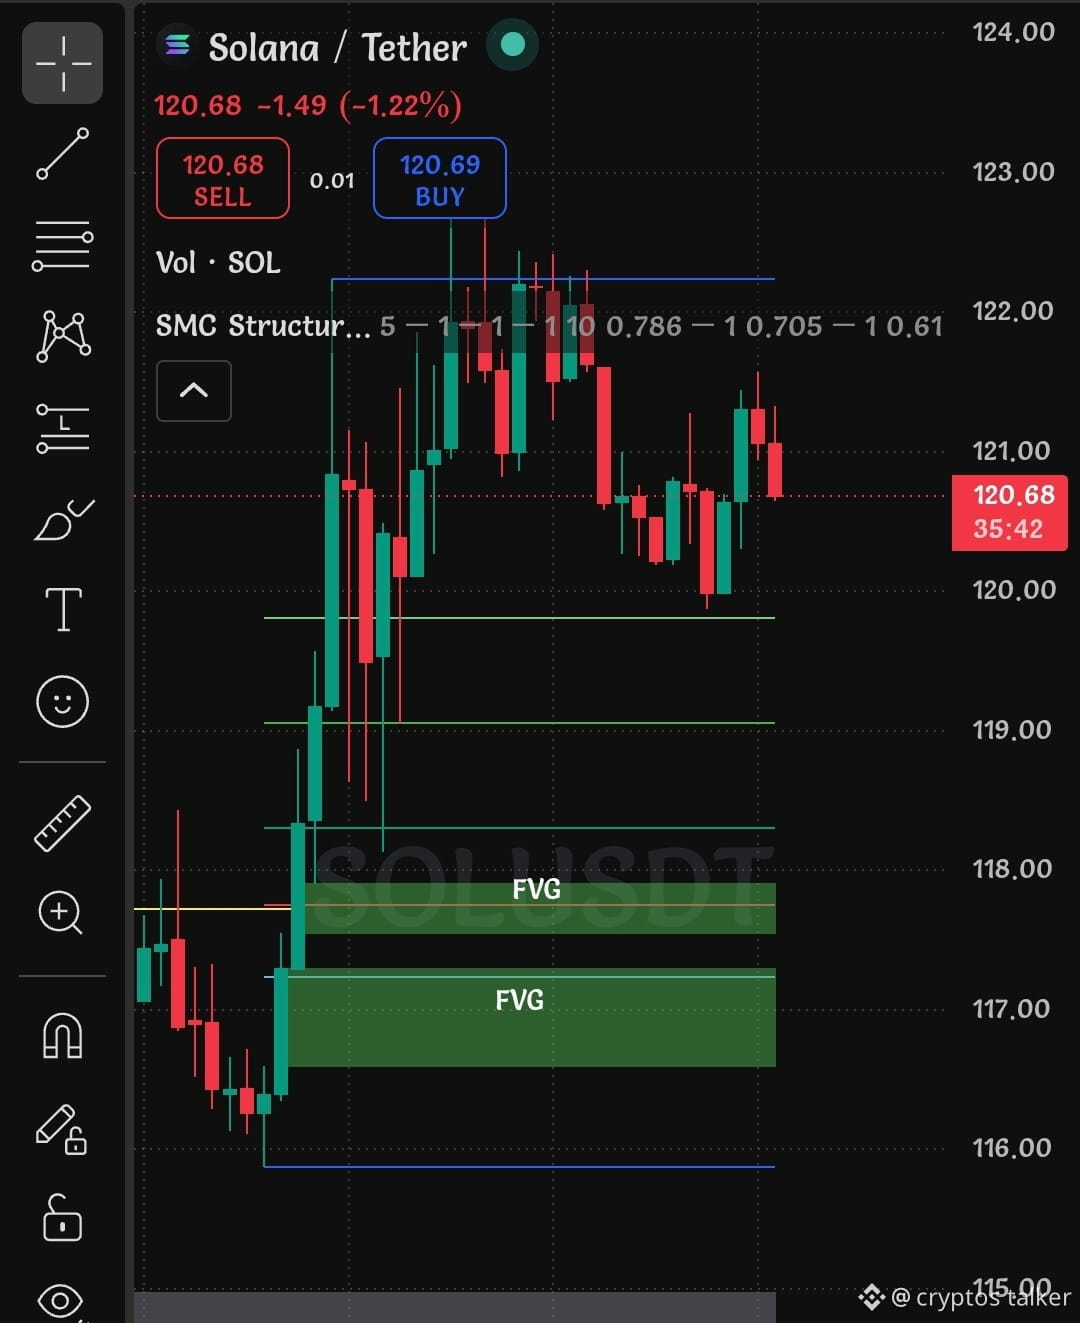
🟣 SOL/USDT — Technical Analysis
Current Price: ~$120.9
Solana is currently trading around $121, with buyers attempting to maintain the recent bullish momentum. The most important short-term level is $123, because a clean breakout could confirm another upward move.
Key Resistance Levels:
$123
$128
$135
$140
Key Support Levels:
$118
$115
$110
$105
Technical Outlook:
SOL is currently holding above the $118 support zone. If buyers push the price above $123 with strong volume, the next potential targets are $128 and $135.
On the other hand, rejection from $123 followed by a breakdown below $118 could trigger a short-term correction toward $115 or even $110.
Prediction:
My short-term outlook remains bullish above $118. A confirmed breakout above $123 could create enough momentum for SOL to test the $128–$135 region.
Trade Idea:
🟢 Long above $123
🎯 TP1: $128
🎯 TP2: $132
🎯 TP3: $135
🛑 SL: Below $118.50
This is technical analysis, not financial advice. Trade with proper risk management$SOL
{future}(SOLUSDT)
🟣 SOL/USDT — Technical Analysis
Current Price: ~$120.9
Solana is currently trading around $121, with buyers attempting to maintain the recent bullish momentum. The most important short-term level is $123, because a clean breakout could confirm another upward move.
Key Resistance Levels:
$123
$128
$135
$140
Key Support Levels:
$118
$115
$110
$105
Technical Outlook:
SOL is currently holding above the $118 support zone. If buyers push the price above $123 with strong volume, the next potential targets are $128 and $135.
On the other hand, rejection from $123 followed by a breakdown below $118 could trigger a short-term correction toward $115 or even $110.
Prediction:
My short-term outlook remains bullish above $118. A confirmed breakout above $123 could create enough momentum for SOL to test the $128–$135 region.
Trade Idea:
🟢 Long above $123
🎯 TP1: $128
🎯 TP2: $132
🎯 TP3: $135
🛑 SL: Below $118.50
This is technical analysis, not financial advice. Trade with proper risk management$SOL
29
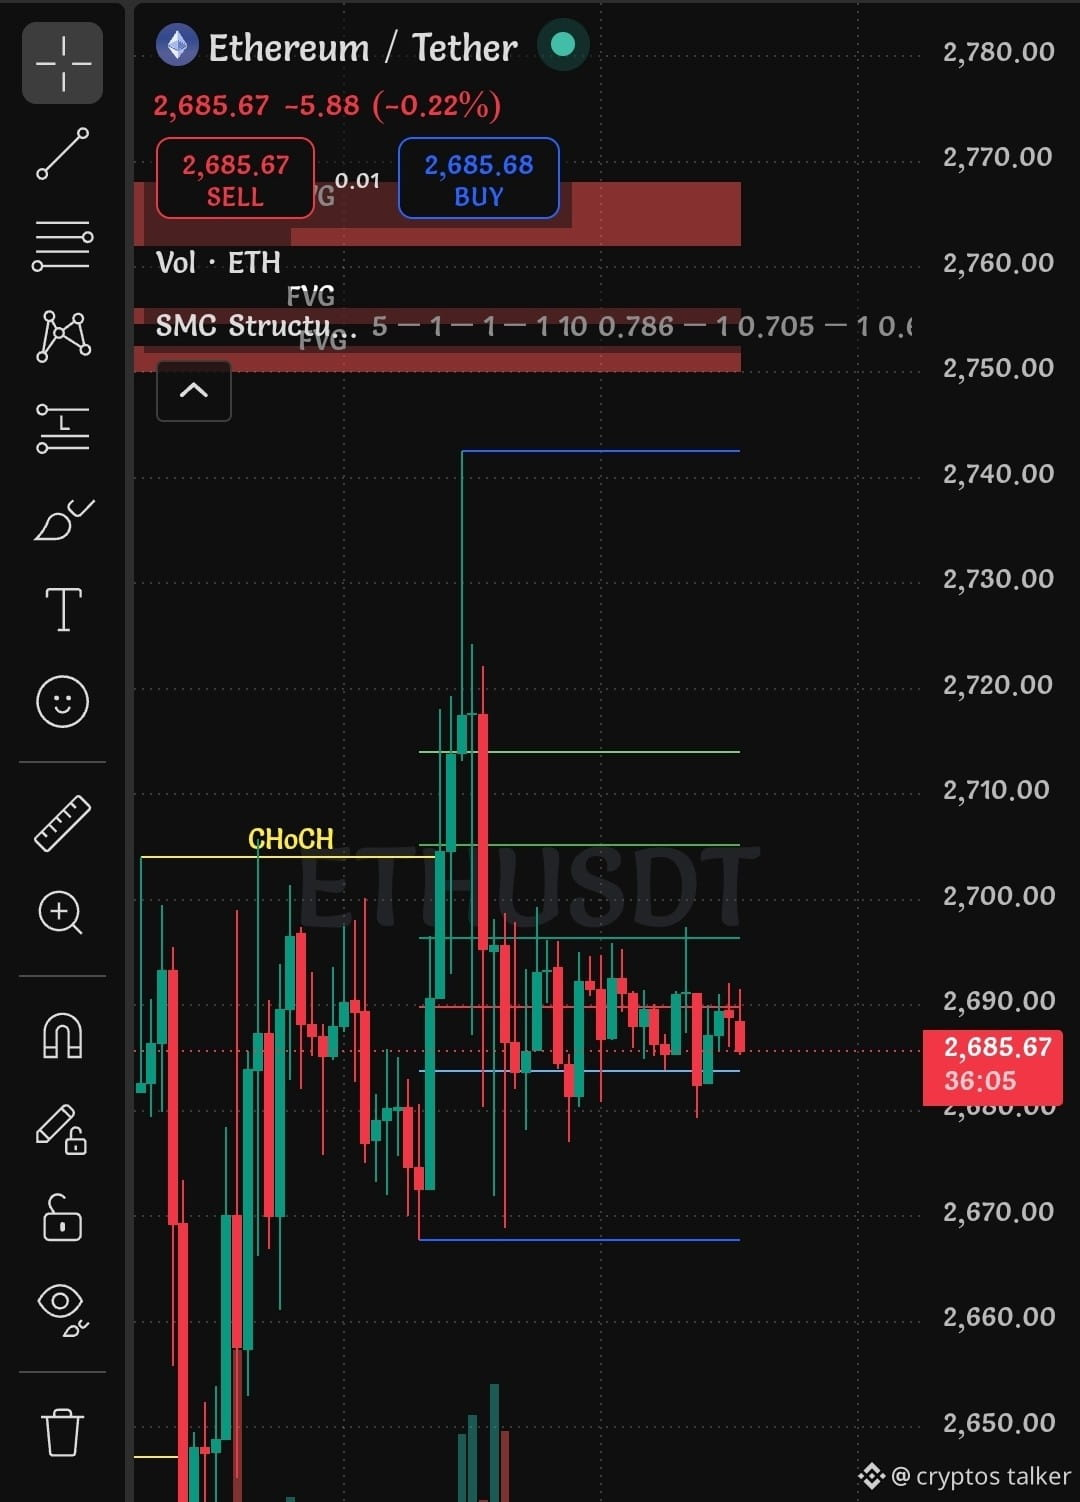
🔵 ETH/USDT — Technical Analysis
Current Price: ~$2,690
Ethereum is currently trading near the $2,700 psychological resistance. ETH has been showing relatively strong recovery momentum, but bulls still need to break the immediate resistance zone to confirm further upside.
Key Resistance Levels:
$2,705
$2,775
$2,825
$3,000–$3,050
Key Support Levels:
$2,650
$2,600
$2,560
$2,450
Technical Outlook:
If ETH successfully breaks and holds above $2,705–$2,775, bullish momentum could accelerate. The next important targets would be $2,825, followed by the psychological $3,000 level.
However, rejection around $2,700–$2,775 could bring ETH back toward $2,650–$2,600. A decisive break below $2,560 would weaken the current bullish structure.
Prediction:
My short-term prediction is bullish above $2,650. If ETH confirms a breakout above $2,775, I would watch the $2,825–$3,050 zone next.
Trade Idea:
🟢 Long above $2,775
🎯 TP1: $2,825
🎯 TP2: $2,900
🎯 TP3: $3,000
🛑 SL: Below $2,680
This is technical analysis, not financial advice.
{future}(ETHUSDT)
🔵 ETH/USDT — Technical Analysis
Current Price: ~$2,690
Ethereum is currently trading near the $2,700 psychological resistance. ETH has been showing relatively strong recovery momentum, but bulls still need to break the immediate resistance zone to confirm further upside.
Key Resistance Levels:
$2,705
$2,775
$2,825
$3,000–$3,050
Key Support Levels:
$2,650
$2,600
$2,560
$2,450
Technical Outlook:
If ETH successfully breaks and holds above $2,705–$2,775, bullish momentum could accelerate. The next important targets would be $2,825, followed by the psychological $3,000 level.
However, rejection around $2,700–$2,775 could bring ETH back toward $2,650–$2,600. A decisive break below $2,560 would weaken the current bullish structure.
Prediction:
My short-term prediction is bullish above $2,650. If ETH confirms a breakout above $2,775, I would watch the $2,825–$3,050 zone next.
Trade Idea:
🟢 Long above $2,775
🎯 TP1: $2,825
🎯 TP2: $2,900
🎯 TP3: $3,000
🛑 SL: Below $2,680
This is technical analysis, not financial advice.
57
තවත් අන්තර්ගතයන් ගවේෂණය කිරීමට ඇතුල් වන්න
Binance චතුරශ්රය හි ගෝලීය ක්රිප්ටෝ පරිශීලකයින් හා එක්වන්න
⚡️ ක්රිප්ටෝ පිළිබඳ නවතම සහ ප්රයෝජනවත් තොරතුරු ලබා ගන්න.
💬 ලොව විශාලතම ක්රිප්ටෝ හුවමාරුව මගින් විශ්වාස කෙරේ.
👍 සත්යායනය කරන ලද නිර්මාණකරුවන්ගෙන් සැබෑ විදසුන් සොයා ගන්න.
විද්යුත් තැපෑල / දුරකථන අංකය
නැගී එන මාතෘකා
FedWatch
16.2M නැරඹීම්
38,638 සාකච්ඡා කරමින්
🚨 BREAKING: THE US ECONOMY JUST BEAT ON EVERYTHING. THAT IS THE WORST NEWS FOR YOUR PORTFOLIO.
GDP Q3: 3.4% vs 3.2% expected. Previous: 2.2%
Jobless claims: 194K vs 199K expected. Previous: 194K
PCE inflation: 3.6%, as expected. Previous: 3.4%
Strong growth. Almost no layoffs. Inflation going UP, not down. The Fed has zero reason to stop, and a December hike is priced near 80%.
In this market, good news for the economy is bad news for stocks and crypto. PCE in line is not a relief, it is 0.2 points higher than last month.
Rate cut hopes are dead. Stay alert.
12 years in these markets. This is what I do.
Follow me and turn notifications on.
#FedWatch
#EarningsSeason
#Nasdaq100FuturesFall0.9%
$BTC
$SOL
$SUI
MARKET STRUCTURE GUIDE
·4 කැමත්ත දැක්වීම්
·967 නැරඹීම්
EarningsSeason
6.3M නැරඹීම්
31,396 සාකච්ඡා කරමින්
USMidtermElections
6,764 නැරඹීම්
270 සාකච්ඡා කරමින්