
LoserBoi
56 පෝස්ටු

LoserBoi
Follow For Free Signals And Airdrops Thanks
0 හඹා යමින්
71 හඹා යන්නන්
78 කැමති විය
පෝස්ටු
සියල්ල
උපුටා දැක්වීම්
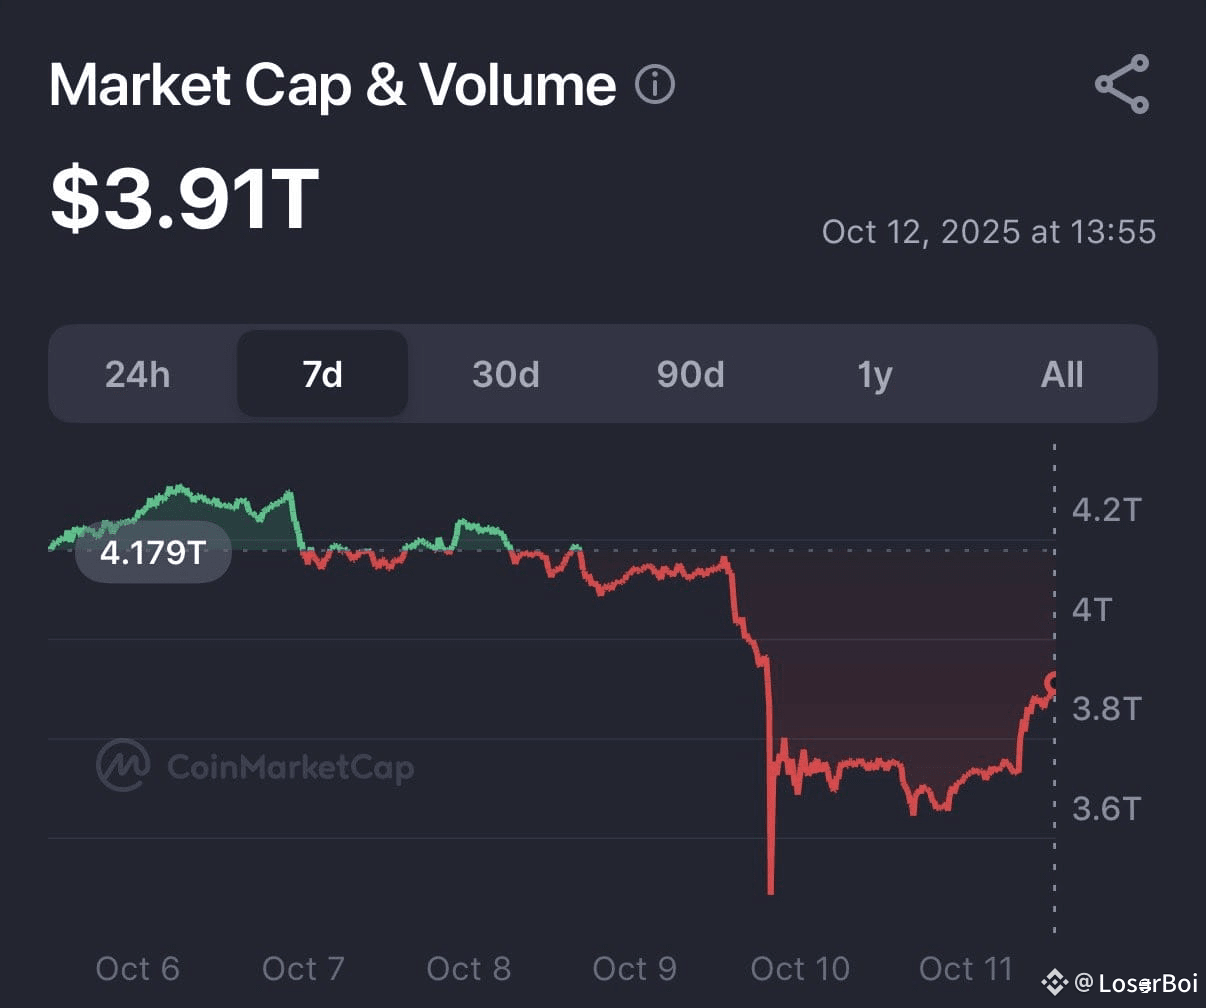
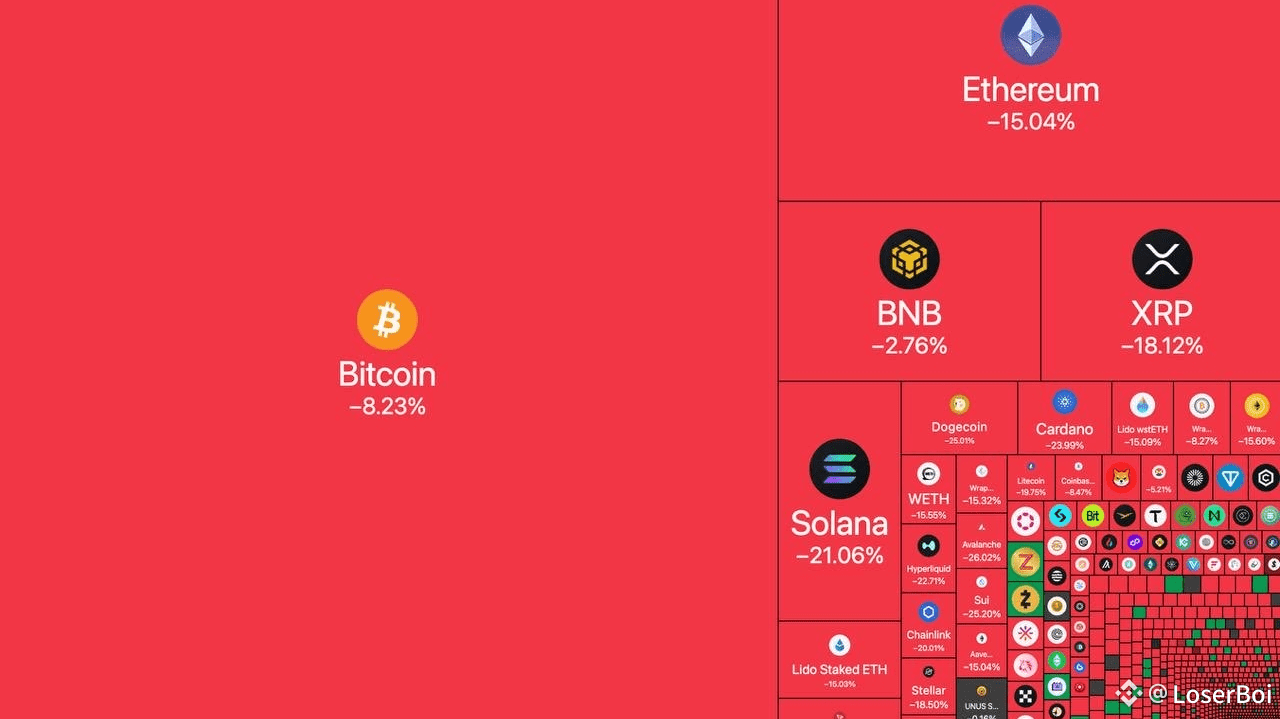
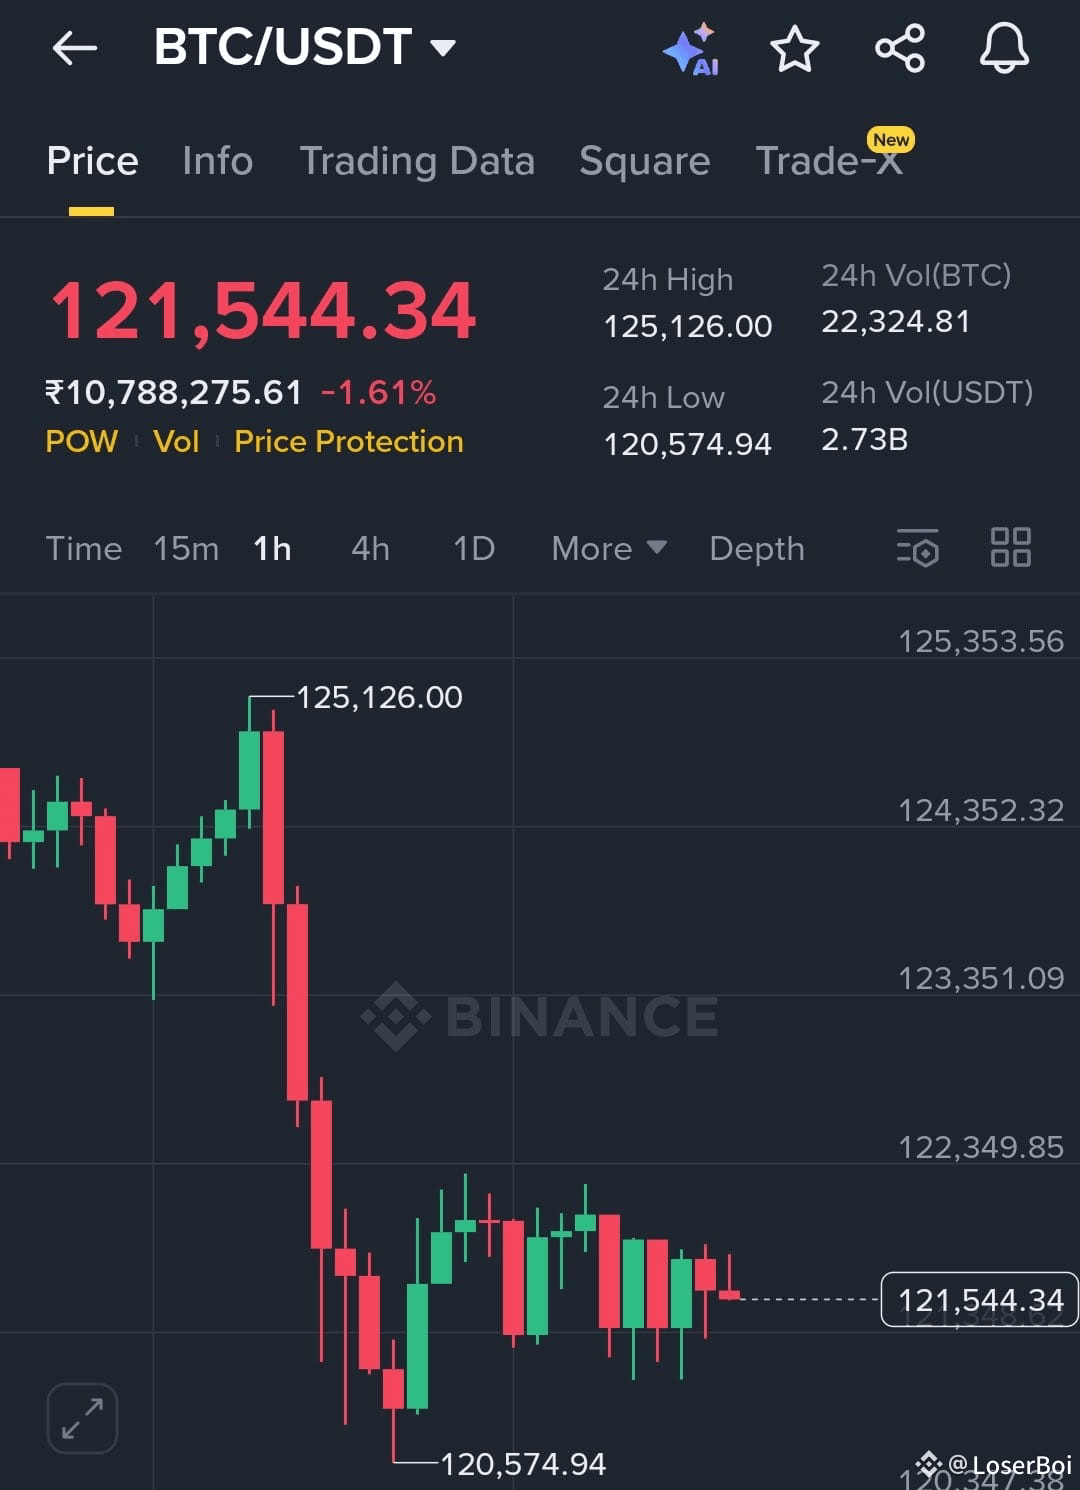
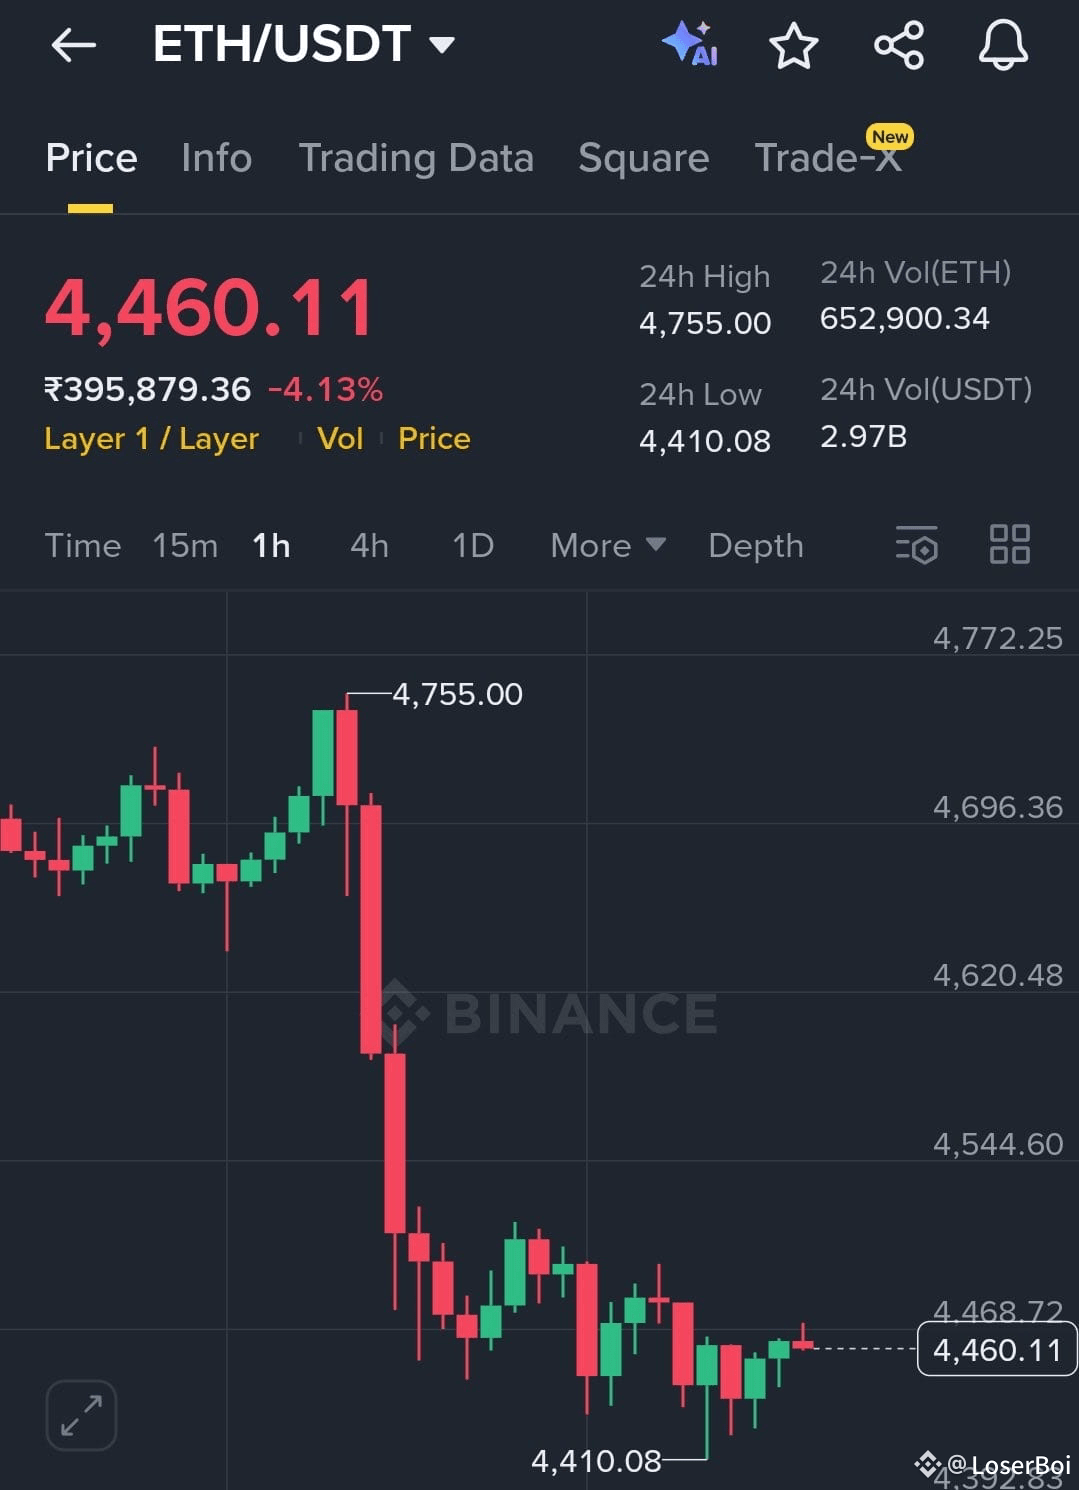
If you look closely this whole crash was engineered to wipe out leverage.
Bitcoin still above $115k
ETH above $4,000
High caps almost recovered
Mid-Low caps down -30%
No major Bull market structure was broken just pure $19 Billion leverage liquidations. Total crypto mcap is still $3.91T and climbing up to ATH of $4.3T.
This shows us the flash crash was just a massive shakeout before the monster pump of Q4.
Drop a 👍 if you are still bullish on Q4
#MarketRebound #MarketRouteToRecovery
Bitcoin still above $115k
ETH above $4,000
High caps almost recovered
Mid-Low caps down -30%
No major Bull market structure was broken just pure $19 Billion leverage liquidations. Total crypto mcap is still $3.91T and climbing up to ATH of $4.3T.
This shows us the flash crash was just a massive shakeout before the monster pump of Q4.
Drop a 👍 if you are still bullish on Q4
#MarketRebound #MarketRouteToRecovery
🇺🇸 🇨🇳 TRUMP CONFIRMS THAT HE HASN'T CANCELLED HIS MEETING WITH XI AND THINGS MIGHT CHANGE


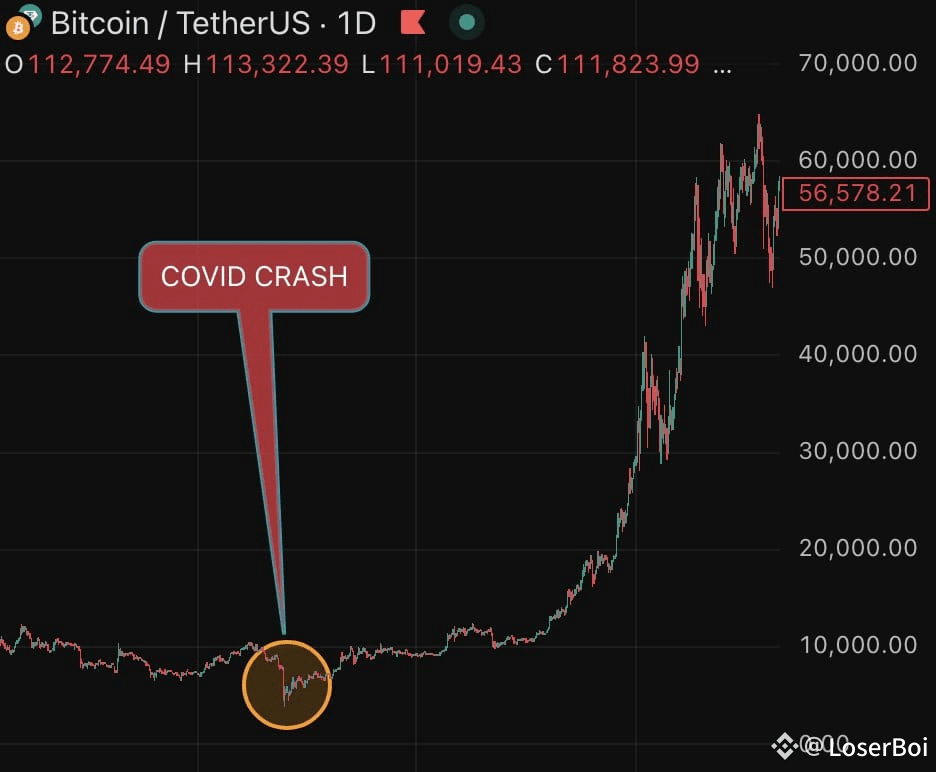
WE SAW THE BIGGEST BULL RUN IN HISTORY AFTER COVID CRASH
TODAY WAS WORSE THAN COVID CRASH
I HAVE NEVER BEEN SO BULLISH
LONG YOUR FUCKING LONGS
BIGGEST. BULL. RUN. STARTING. MONDAY
TODAY WAS WORSE THAN COVID CRASH
I HAVE NEVER BEEN SO BULLISH
LONG YOUR FUCKING LONGS
BIGGEST. BULL. RUN. STARTING. MONDAY
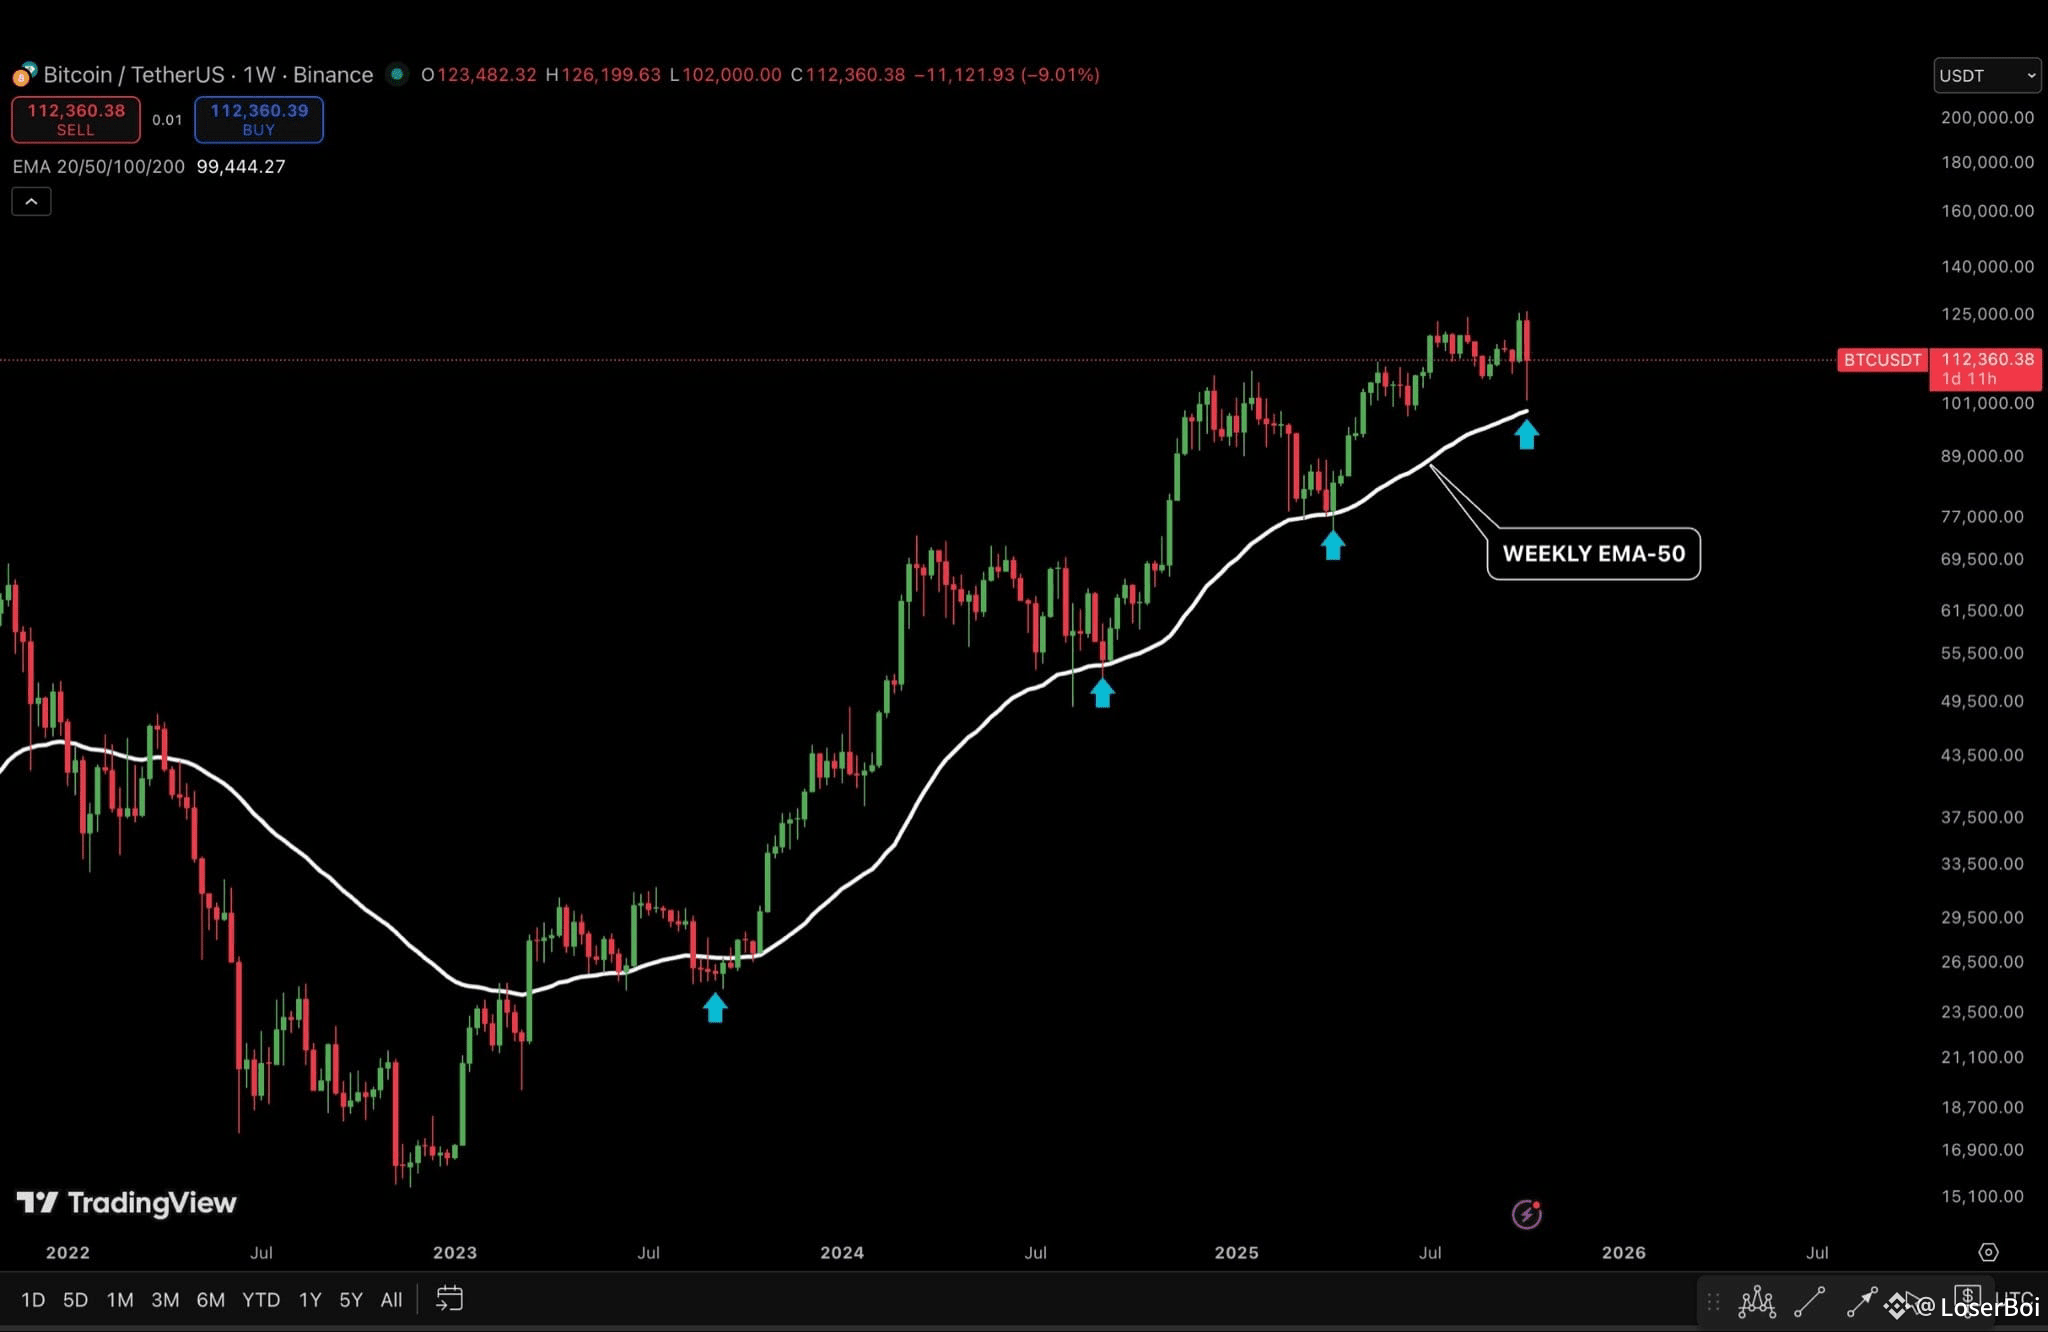
BITCOIN’S MACRO BULLISH STRUCTURE REMAINS INTACT
The weekly EMA-50 continues to act as Bitcoin’s key dynamic support, a level that has held strong since the 2023 reversal.
Historically, every time BTC touches this band, it bounces back sharply.
As long as Bitcoin stays above this zone on the weekly timeframe, the macro trend remains bullish.
The weekly EMA-50 continues to act as Bitcoin’s key dynamic support, a level that has held strong since the 2023 reversal.
Historically, every time BTC touches this band, it bounces back sharply.
As long as Bitcoin stays above this zone on the weekly timeframe, the macro trend remains bullish.
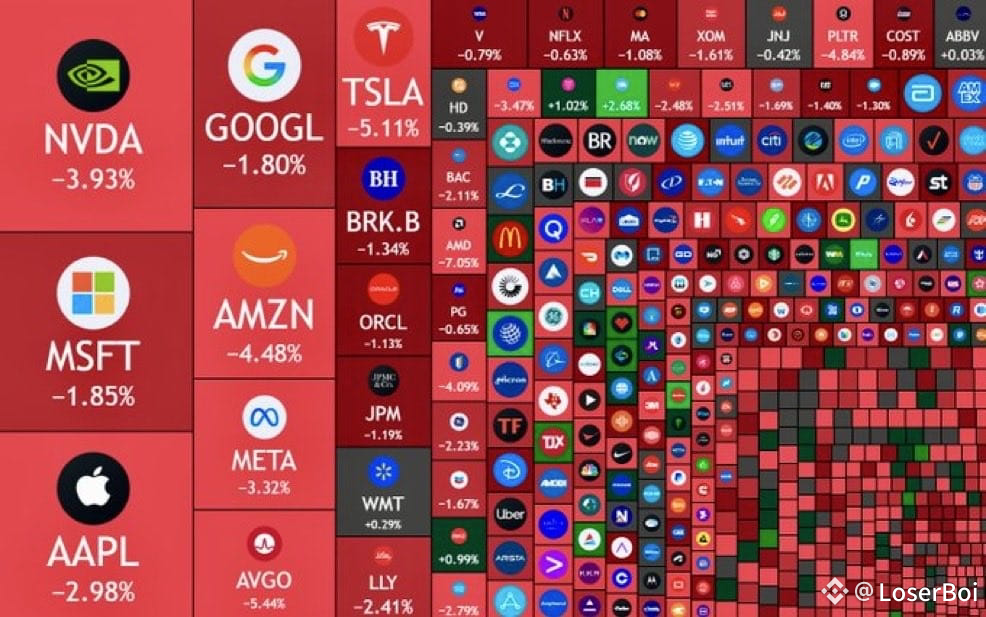
BREAKING: 🇺🇸 $1.6 TRILLION WIPED OUT FROM THE US STOCK MARKET TODAY.
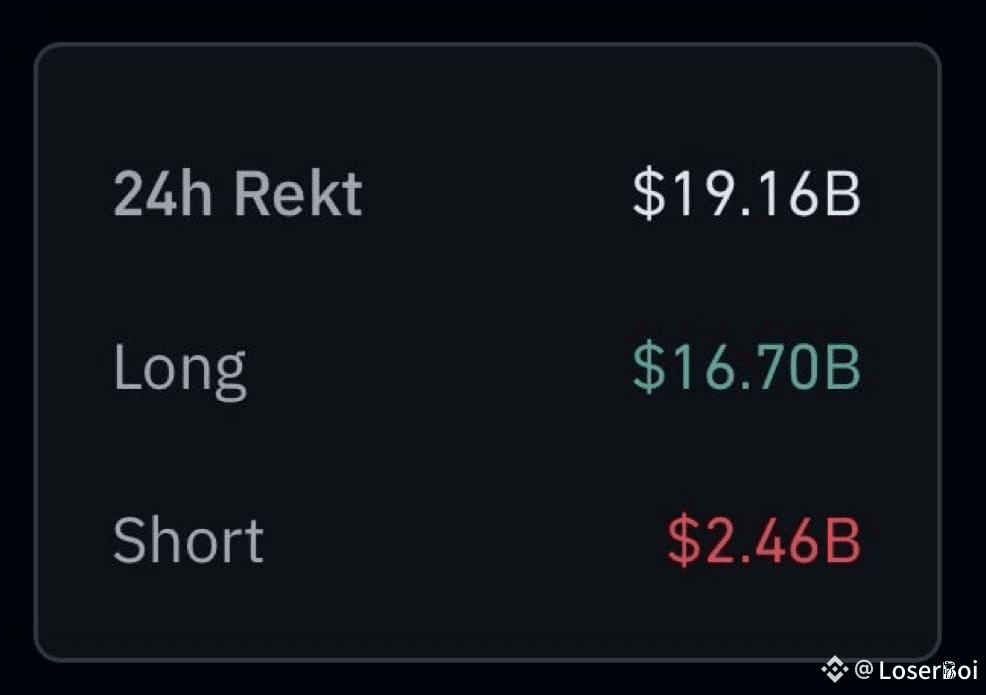
Covid crash: $1.2 Billion in liquidations
FTX crash: $1.6 Billion in liquidations
Today: $19.16 Billion in liquidations
This is biggest liquidation event in history of crypto and almost 20x bigger than the Covid crash of March 2020
FTX crash: $1.6 Billion in liquidations
Today: $19.16 Billion in liquidations
This is biggest liquidation event in history of crypto and almost 20x bigger than the Covid crash of March 2020
WHY BITCOIN AND ALTS ARE DUMPING?
THE CRYPTO MARKET HAS LOST $140 BILLION IN THE LAST 24 HOURS.
4 REASONS BEHIND THIS DUMP:
1️⃣ OG WHALE SELLING
➞ YESTERDAY, AN OG BITCOIN WHALE DEPOSITED 3000 $BTC AND STARTED SELLING.
➞ THIS ISN'T A BIG AMOUNT, BUT THE MARKETS PANICKED BECAUSE OF ONE THING.
➞ THIS WHALE STILL HOLDS $3.4 BILLION IN BTC AND COULD START SELLING HIS ENTIRE HOLDINGS.
2️⃣ RISING INFLATION
➞ YESTERDAY, NY FED INFLATION EXPECTATIONS ROSE TO ITS HIGHEST LEVEL IN 3.5 YEARS.
➞ HIGH INFLATION MEANS THE RATE CUTS PROBABILITY WILL GO LOW, WHICH IS BAD FOR RISK-ON ASSETS.
3️⃣ LEVERAGE FLUSH
➞ AFTER BTC NEW ATH, NEARLY $3 BILLION IN OPEN INTEREST WAS ADDED.
➞ THIS WAS GREEDY LONGS CHASING BITCOIN PUMPS, AND MARKET MAKERS ALWAYS FLUSH THEM.
4️⃣ GOLD AND DXY RALLY
➞ JUST LIKE THE BTC PUMP SUCKS LIQUIDITY FROM ALTS, THE GOLD PUMP IS SUCKING LIQUIDITY FROM RISK-ON ASSETS.
➞ ON TOP OF THAT, DXY IS ALSO GOING UP, WHICH IS CAUSING MORE DAMAGE TO BITCOIN AND ALTS.
WHAT WILL HAPPEN NEXT?
● THERE'S NO DOUBT THAT Q4 WILL BE BULLISH FOR BITCOIN AND ALTS.
● NONE OF THE BULLISH CATALYSTS HAVE BEEN PRICED IN, AND THERE'S NO EUPHORIA ON THE TIMELINE.
● BUT JUST LIKE 2023 AND 2024, WHALES WILL FIRST SHAKE OUT THE WEAK HANDS.
● ONCE PEOPLE START BELIEVING THERE'LL BE NO Q4 PUMP, A MASSIVE RALLY WILL START.
● I THINK THE WORST-CASE SCENARIO NOW COULD BE A FEW WEEKS OF CHOP BEFORE A REVERSAL.
#BTC #ETH
$BTC $ETH
THE CRYPTO MARKET HAS LOST $140 BILLION IN THE LAST 24 HOURS.
4 REASONS BEHIND THIS DUMP:
1️⃣ OG WHALE SELLING
➞ YESTERDAY, AN OG BITCOIN WHALE DEPOSITED 3000 $BTC AND STARTED SELLING.
➞ THIS ISN'T A BIG AMOUNT, BUT THE MARKETS PANICKED BECAUSE OF ONE THING.
➞ THIS WHALE STILL HOLDS $3.4 BILLION IN BTC AND COULD START SELLING HIS ENTIRE HOLDINGS.
2️⃣ RISING INFLATION
➞ YESTERDAY, NY FED INFLATION EXPECTATIONS ROSE TO ITS HIGHEST LEVEL IN 3.5 YEARS.
➞ HIGH INFLATION MEANS THE RATE CUTS PROBABILITY WILL GO LOW, WHICH IS BAD FOR RISK-ON ASSETS.
3️⃣ LEVERAGE FLUSH
➞ AFTER BTC NEW ATH, NEARLY $3 BILLION IN OPEN INTEREST WAS ADDED.
➞ THIS WAS GREEDY LONGS CHASING BITCOIN PUMPS, AND MARKET MAKERS ALWAYS FLUSH THEM.
4️⃣ GOLD AND DXY RALLY
➞ JUST LIKE THE BTC PUMP SUCKS LIQUIDITY FROM ALTS, THE GOLD PUMP IS SUCKING LIQUIDITY FROM RISK-ON ASSETS.
➞ ON TOP OF THAT, DXY IS ALSO GOING UP, WHICH IS CAUSING MORE DAMAGE TO BITCOIN AND ALTS.
WHAT WILL HAPPEN NEXT?
● THERE'S NO DOUBT THAT Q4 WILL BE BULLISH FOR BITCOIN AND ALTS.
● NONE OF THE BULLISH CATALYSTS HAVE BEEN PRICED IN, AND THERE'S NO EUPHORIA ON THE TIMELINE.
● BUT JUST LIKE 2023 AND 2024, WHALES WILL FIRST SHAKE OUT THE WEAK HANDS.
● ONCE PEOPLE START BELIEVING THERE'LL BE NO Q4 PUMP, A MASSIVE RALLY WILL START.
● I THINK THE WORST-CASE SCENARIO NOW COULD BE A FEW WEEKS OF CHOP BEFORE A REVERSAL.
#BTC #ETH
$BTC $ETH
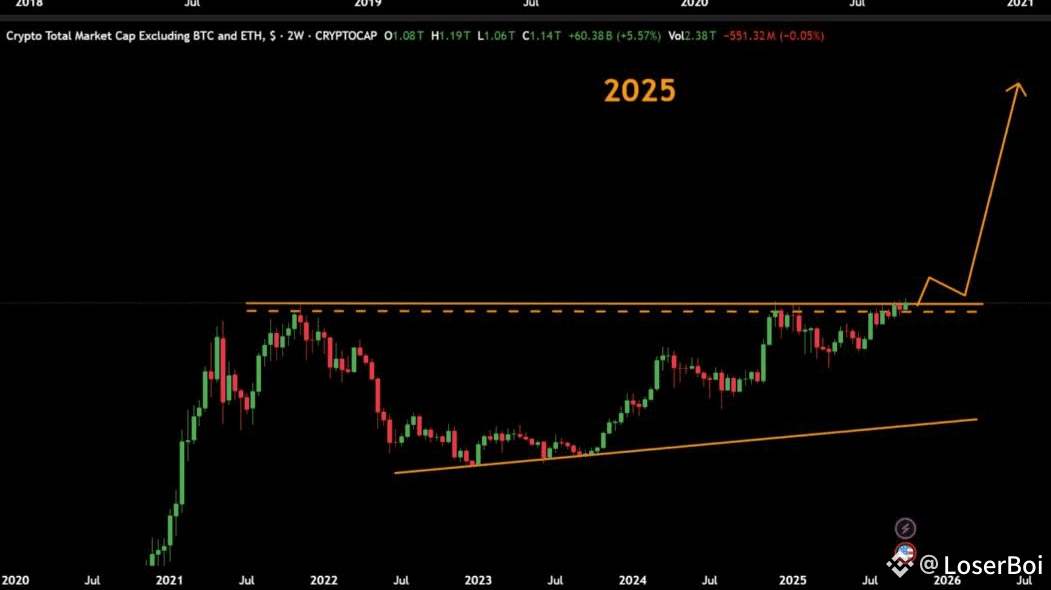
🚨 WE ARE ABOUT TO ENTER THE MOST EXPLOSIVE PHASE FOR ALTS.
Here’s the big picture 👇
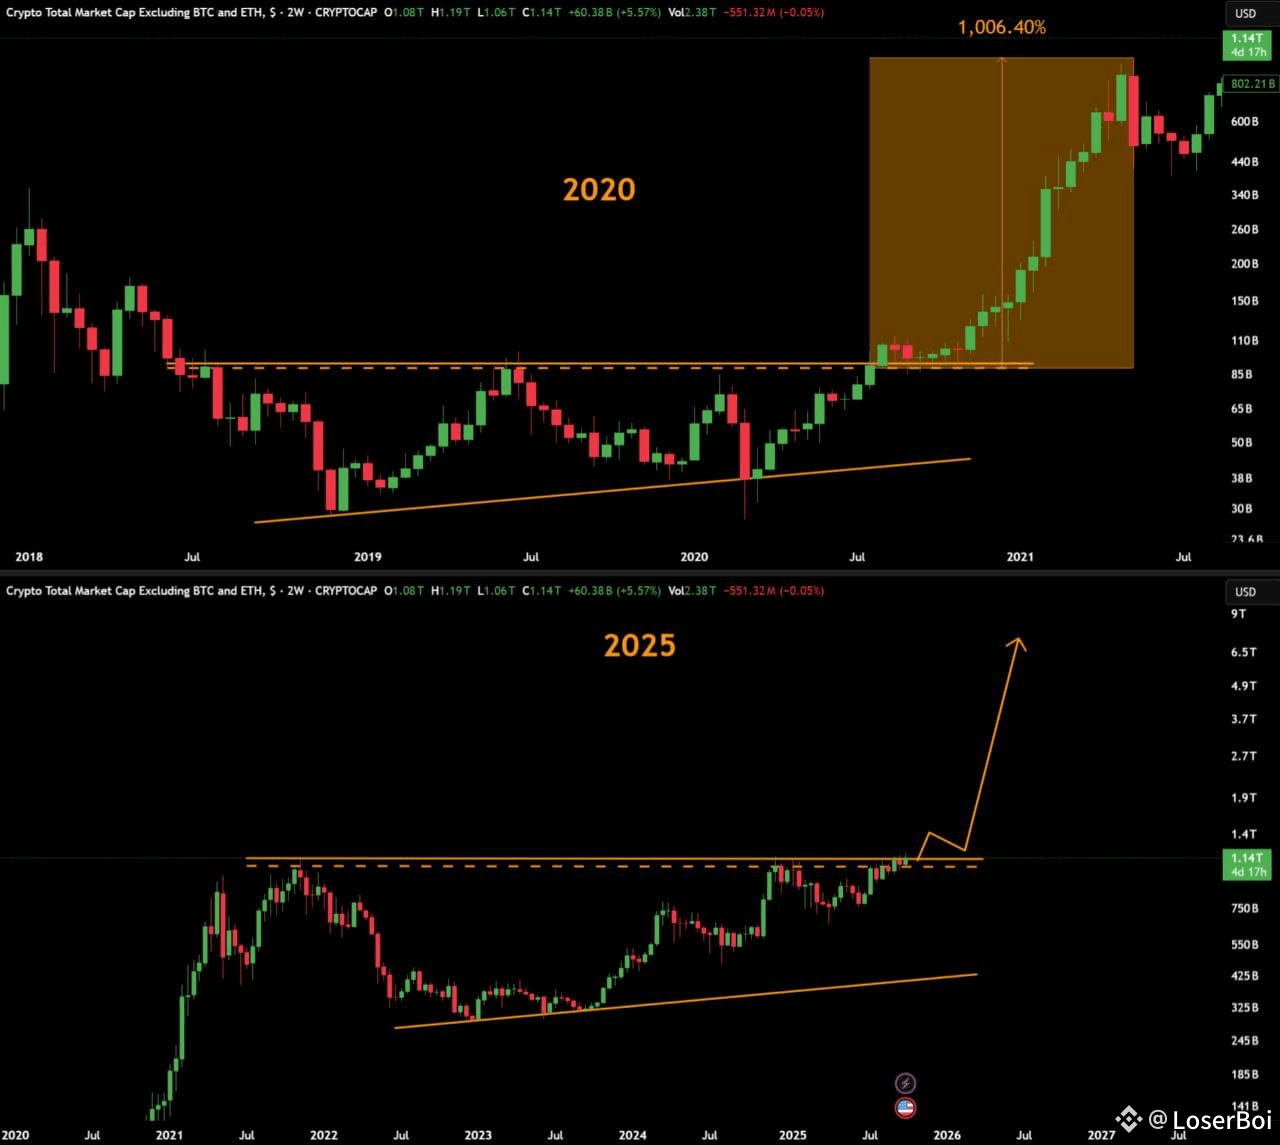
In 2020, the TOTAL3 market cap (altcoins excluding BTC & ETH) built a base for nearly 2 years.
Once it broke out, it triggered a vertical move: +1,000% in less than a year.
That breakout marked the real start of Altseason.
➡️ Now look at 2025.
We’re seeing the exact same structure:
➤ A multi-year base formation
➤ Higher lows (buyers absorbing supply)
➤ A horizontal resistance around ~$1.2T TOTAL3
Altseason hasn’t taken off yet because this resistance hasn’t been broken.
As long as $BTC pushes new highs, liquidity concentrates in Bitcoin.
But once TOTAL3 clears that ceiling, the pattern historically releases massive upside.
Why it matters:
TOTAL3 is at $1.14T, just under resistance.
In 2020, the breakout zone was ~$100B → rally went to $1T+.
This cycle, a breakout could mean $5T–$7T in altcoin market cap if history rhymes.
And importantly, this setup is happening while:
➡️ BTC dominance is still high
➡️ ETH ETFs are already pulling billions
➡️ Regulatory clarity is improving
➡️ Global liquidity injections are restarting (China, Japan, Fed cuts ahead)
That’s why the current DELAY isn’t weakness, it’s consolidation before expansion.
Altseason doesn’t start randomly.
It starts when TOTAL3 breaks out of its ceiling.
The chart says we’re almost there.
Here’s the big picture 👇
In 2020, the TOTAL3 market cap (altcoins excluding BTC & ETH) built a base for nearly 2 years.
Once it broke out, it triggered a vertical move: +1,000% in less than a year.
That breakout marked the real start of Altseason.
➡️ Now look at 2025.
We’re seeing the exact same structure:
➤ A multi-year base formation
➤ Higher lows (buyers absorbing supply)
➤ A horizontal resistance around ~$1.2T TOTAL3
Altseason hasn’t taken off yet because this resistance hasn’t been broken.
As long as $BTC pushes new highs, liquidity concentrates in Bitcoin.
But once TOTAL3 clears that ceiling, the pattern historically releases massive upside.
Why it matters:
TOTAL3 is at $1.14T, just under resistance.
In 2020, the breakout zone was ~$100B → rally went to $1T+.
This cycle, a breakout could mean $5T–$7T in altcoin market cap if history rhymes.
And importantly, this setup is happening while:
➡️ BTC dominance is still high
➡️ ETH ETFs are already pulling billions
➡️ Regulatory clarity is improving
➡️ Global liquidity injections are restarting (China, Japan, Fed cuts ahead)
That’s why the current DELAY isn’t weakness, it’s consolidation before expansion.
Altseason doesn’t start randomly.
It starts when TOTAL3 breaks out of its ceiling.
The chart says we’re almost there.
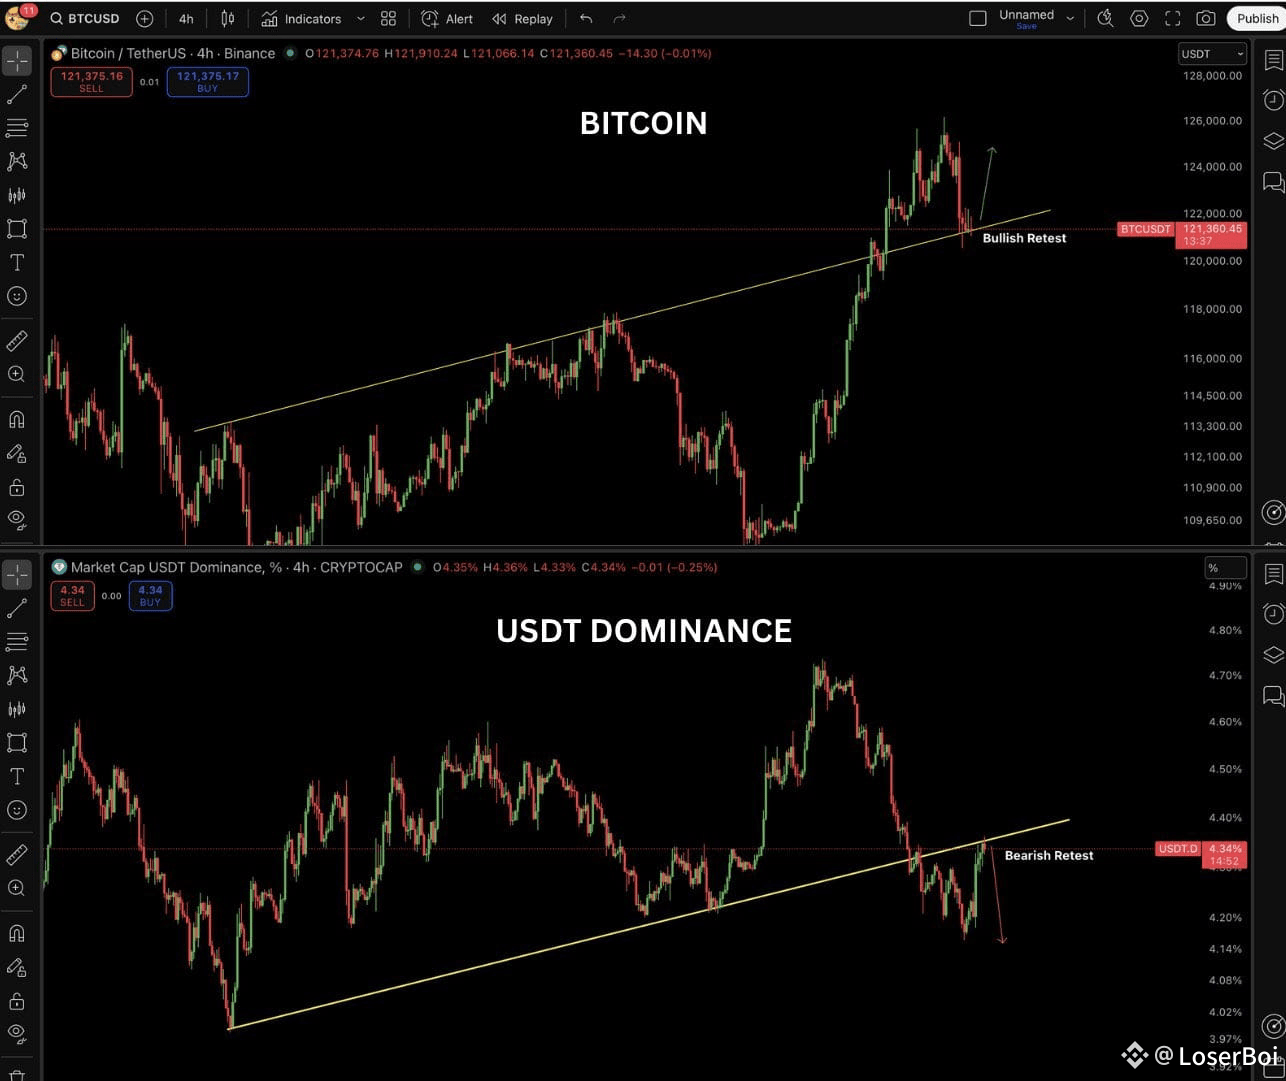
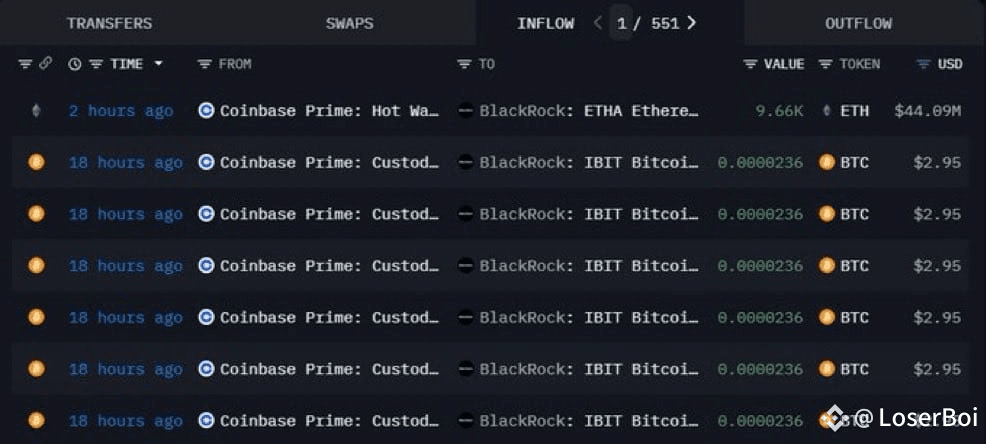
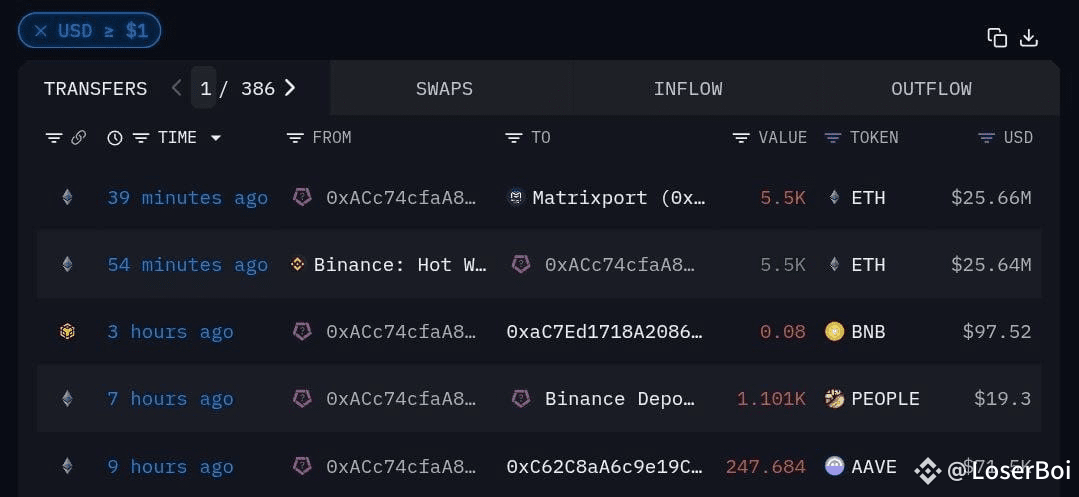
🐳 A WHALE JUST BOUGHT 5,500 $ETH WORTH $25.64 MILLION.
BIG MONEY IS BUYING NON-STOP.
#ETH #WhaleWatch $ETH
BIG MONEY IS BUYING NON-STOP.
#ETH #WhaleWatch $ETH
LoserBoi
·
--
HUGE BREAKOUT IS COMING
Spot ETH Insights 20251006 15:00 UTC
TLDR
Ethereum is experiencing a significant price surge, up approximately 2.33% in the last 24 hours to $4637.62, driven by strong institutional interest and bullish technicals, yet it faces risks from overbought conditions and strategic whale profittaking, leading to a mixed market outlook. Moving forward.
1. Technical & Inflow Driven Surge: ETH's price surged approximately 2.33% in the past 24 hours, supported by strong bullish technical indicators like rising EMAs and MACD, alongside significant positive money inflows from institutional players.
2. Overbought & Supply Pressures: The token is currently in overbought territory per RSI and Bollinger Bands, signaling a potential pullback, compounded by increased circulating supply and ongoing ETH sales by the Ethereum Foundation.
3. Divided Sentiment & Whale Actions: Community sentiment is split between bullish predictions for a $6,000+ price target and bearish concerns over liquidation risks, with some whales accumulating while others are taking substantial profits.
Positives
1. Institutional Demand & Staking ETPs: Grayscale has received approval and launched the first US spot crypto ETPs with staking for Ethereum, signaling growing institutional interest and new avenues for investment, reinforced by reports of institutions holding a larger percentage of ETH supply than Bitcoin.
2. Whale Accumulation & Adoption: Significant whale activity includes a whale opening a $67.9 million long position and BitMine buying 179K ETH ($820.6 million) in the past week. Furthermore, reports suggest the US Treasury exempted ETH from a 15% corporate tax and Walmart's OnePay plans to integrate ETH trading by late 2025.
3. Bullish Technical Momentum & Inflows: ETH price has risen approximately 2.33% to $4637.62 in the last 24 hours. Technical indicators show a strong bullish trend with EMAs rising and a positive MACD histogram, supported by significant positive money inflows, especially large inflows.
Risks
1. Overbought Conditions & Potential Pullback: The RSI(6) and RSI(12) are significantly in overbought territory (85.41 and 73.87 respectively), and the price is currently above the upper Bollinger Band, suggesting ETH may be overextended and due for a price correction.
2. Increased Circulating Supply & Treasury Sales: Ethereum's circulating supply has increased due to reduced network activity and lower burn rates. The Ethereum Foundation continues to sell ETH (17th sale in 2025, 1,000 ETH recently) for treasury management, potentially adding selling pressure.
3. Whale ProfitTaking & Liquidation Risks: Whales recently secured significant profits, with one taking $93.74 million from selling 10,000 ETH and another clearing $315 million in profits. High futures long liquidations of $181 million also indicate market vulnerability.
Community Sentiment
1. Mixed Sentiment: While some community members are highly bullish, predicting ETH could surpass $6,000 and mirroring Bitcoin's 2017 pump pattern, others express significant concern, discussing potential shorting opportunities, liquidation risks, and a belief that ETH is overvalued or due for a major correction.
#ETH $ETH
TLDR
Ethereum is experiencing a significant price surge, up approximately 2.33% in the last 24 hours to $4637.62, driven by strong institutional interest and bullish technicals, yet it faces risks from overbought conditions and strategic whale profittaking, leading to a mixed market outlook. Moving forward.
1. Technical & Inflow Driven Surge: ETH's price surged approximately 2.33% in the past 24 hours, supported by strong bullish technical indicators like rising EMAs and MACD, alongside significant positive money inflows from institutional players.
2. Overbought & Supply Pressures: The token is currently in overbought territory per RSI and Bollinger Bands, signaling a potential pullback, compounded by increased circulating supply and ongoing ETH sales by the Ethereum Foundation.
3. Divided Sentiment & Whale Actions: Community sentiment is split between bullish predictions for a $6,000+ price target and bearish concerns over liquidation risks, with some whales accumulating while others are taking substantial profits.
Positives
1. Institutional Demand & Staking ETPs: Grayscale has received approval and launched the first US spot crypto ETPs with staking for Ethereum, signaling growing institutional interest and new avenues for investment, reinforced by reports of institutions holding a larger percentage of ETH supply than Bitcoin.
2. Whale Accumulation & Adoption: Significant whale activity includes a whale opening a $67.9 million long position and BitMine buying 179K ETH ($820.6 million) in the past week. Furthermore, reports suggest the US Treasury exempted ETH from a 15% corporate tax and Walmart's OnePay plans to integrate ETH trading by late 2025.
3. Bullish Technical Momentum & Inflows: ETH price has risen approximately 2.33% to $4637.62 in the last 24 hours. Technical indicators show a strong bullish trend with EMAs rising and a positive MACD histogram, supported by significant positive money inflows, especially large inflows.
Risks
1. Overbought Conditions & Potential Pullback: The RSI(6) and RSI(12) are significantly in overbought territory (85.41 and 73.87 respectively), and the price is currently above the upper Bollinger Band, suggesting ETH may be overextended and due for a price correction.
2. Increased Circulating Supply & Treasury Sales: Ethereum's circulating supply has increased due to reduced network activity and lower burn rates. The Ethereum Foundation continues to sell ETH (17th sale in 2025, 1,000 ETH recently) for treasury management, potentially adding selling pressure.
3. Whale ProfitTaking & Liquidation Risks: Whales recently secured significant profits, with one taking $93.74 million from selling 10,000 ETH and another clearing $315 million in profits. High futures long liquidations of $181 million also indicate market vulnerability.
Community Sentiment
1. Mixed Sentiment: While some community members are highly bullish, predicting ETH could surpass $6,000 and mirroring Bitcoin's 2017 pump pattern, others express significant concern, discussing potential shorting opportunities, liquidation risks, and a belief that ETH is overvalued or due for a major correction.
#ETH $ETH
#BTCBreaksATH
$BNB
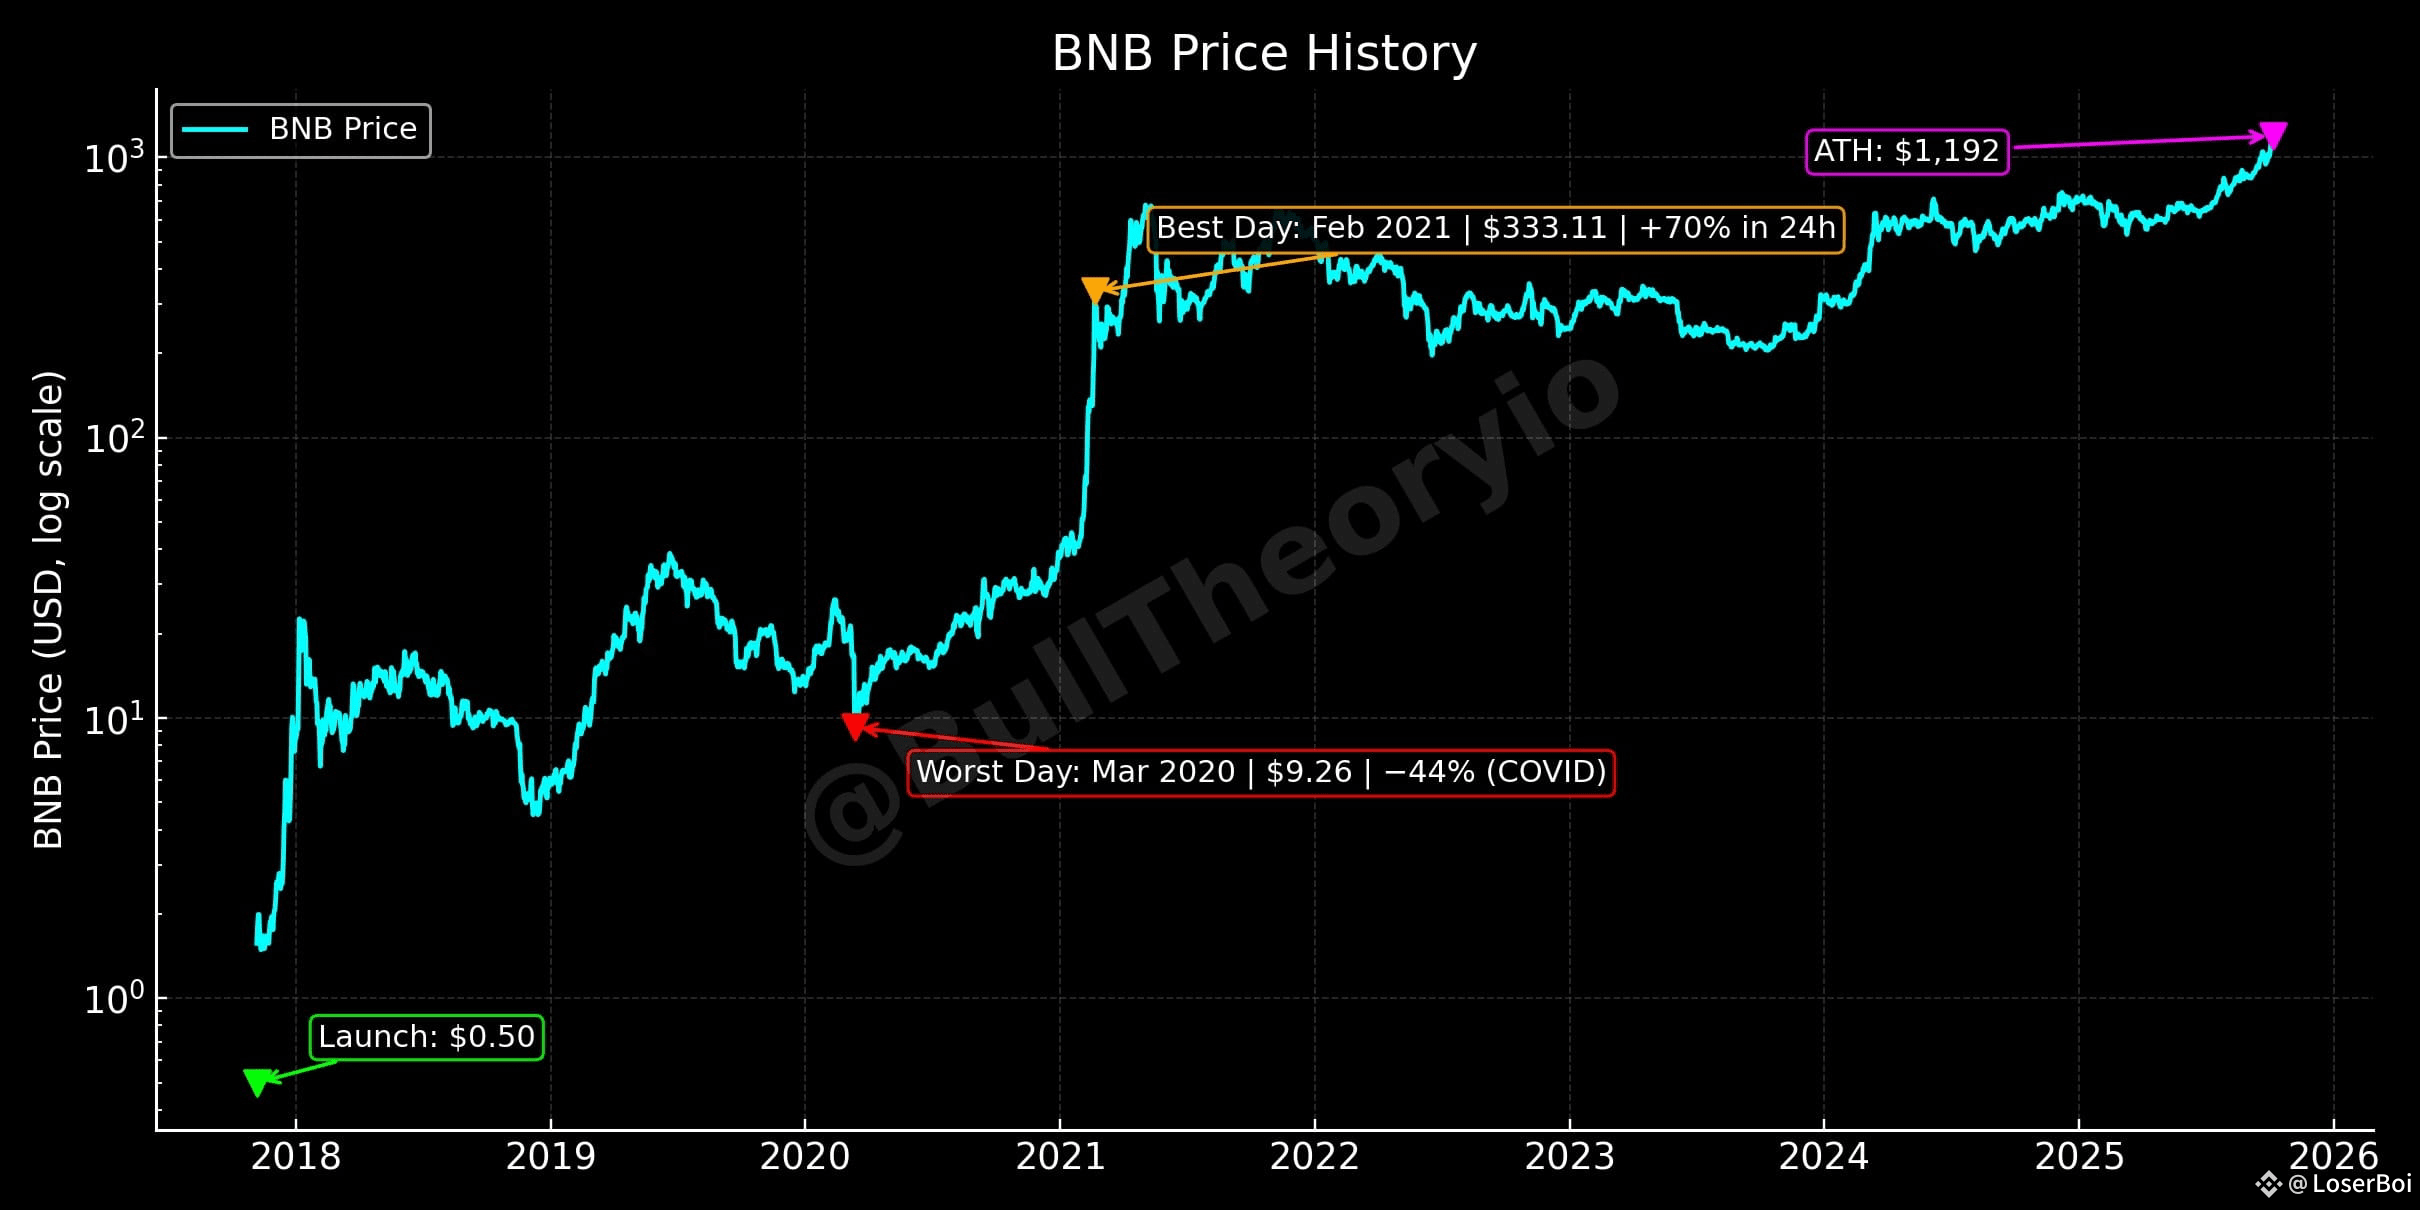
is the most efficient large-cap asset in crypto history.
Launched at $0.50 → Now at a new all-time high of $1,192.
That’s a +238,300% return, with an average yearly growth of ~167% over 8 years.
But here’s what makes this important 👇
BNB has reached a new price high, even though activity on @BNBChain is still below its own peak.
That’s a major signal.
📊 Latest BNB Chain data:
• TVL (Total Value Locked): $8.33 billion
• Stablecoin market cap: $13.46 billion
• DEX Volume (24h): $4.39 billion
• Active addresses (24h): 2.32 million
• Transactions (24h): 18.79 million
These are strong numbers but not all-time highs.
This means BNB is reaching new highs in price before the chain activity fully recovers.
Here’s how it plays out:
1. Momentum in price attracts capital → new ATHs = confidence, liquidity chases trend.
2. Usage follows capital, not leads it → projects deploy, then users scale in.
3. Reflecting fundamentals → volume + active address growth + stablecoin cap = real demand.
4. Leverage optional → usage not maxed out yet = lower downside, higher convex upside.
In short👇
$BNB just set a new record.
But BNB Chain still has room to grow in usage and capital.
If onchain metrics catch up with price, the next phase could be even stronger.
This setup is rare and it’s why BNB is one of the most reliable assets in the market right now.
$BNB
is the most efficient large-cap asset in crypto history.
Launched at $0.50 → Now at a new all-time high of $1,192.
That’s a +238,300% return, with an average yearly growth of ~167% over 8 years.
But here’s what makes this important 👇
BNB has reached a new price high, even though activity on @BNBChain is still below its own peak.
That’s a major signal.
📊 Latest BNB Chain data:
• TVL (Total Value Locked): $8.33 billion
• Stablecoin market cap: $13.46 billion
• DEX Volume (24h): $4.39 billion
• Active addresses (24h): 2.32 million
• Transactions (24h): 18.79 million
These are strong numbers but not all-time highs.
This means BNB is reaching new highs in price before the chain activity fully recovers.
Here’s how it plays out:
1. Momentum in price attracts capital → new ATHs = confidence, liquidity chases trend.
2. Usage follows capital, not leads it → projects deploy, then users scale in.
3. Reflecting fundamentals → volume + active address growth + stablecoin cap = real demand.
4. Leverage optional → usage not maxed out yet = lower downside, higher convex upside.
In short👇
$BNB just set a new record.
But BNB Chain still has room to grow in usage and capital.
If onchain metrics catch up with price, the next phase could be even stronger.
This setup is rare and it’s why BNB is one of the most reliable assets in the market right now.
Spot DOGE Insights 20251005 16:00 UTC
TLDR
Dogecoin has experienced a volatile 24 hours, with recent price increases followed by some cooling, amidst strong institutional interest and whale movements; however.
1. Institutional & Whale Support: Dogecoin is benefiting from significant institutional ETF inflows and whale accumulation, alongside positive sentiment influenced by Elon Musk's related ventures.
2. Mixed Technical Indicators: Recent bullish EMA crossovers suggest upward momentum, but a bearish MACD crossover and significant outflows indicate potential shortterm price cooling.
3. LongTerm Bullish Outlook: The community and analysts anticipate a strong altcoin season, with predictions for DOGE to reach $0.80 to $1.50, supported by its fundamental characteristics and cultural status.
Positives
1. Institutional Inflows: The RexOsprey DOGE ETF has attracted over $20 million in inflows, indicating increasing demand from American investors and suggesting substantial future inflows from upcoming mainstream DOGE ETFs.
2. Whale Accumulation: Large holders have accumulated over 30 million DOGE in recent days, accompanied by net outflows exceeding $25 million from exchanges, signaling strong confidence and reduced supply pressure.
3. Bullish EMA Crossover: The 7period Exponential Moving Average (EMA) recently crossed above both the 25period and 99period EMAs, forming a bullish crossover pattern that indicates potential for continued upward price momentum.
#DOGE $DOGE
TLDR
Dogecoin has experienced a volatile 24 hours, with recent price increases followed by some cooling, amidst strong institutional interest and whale movements; however.
1. Institutional & Whale Support: Dogecoin is benefiting from significant institutional ETF inflows and whale accumulation, alongside positive sentiment influenced by Elon Musk's related ventures.
2. Mixed Technical Indicators: Recent bullish EMA crossovers suggest upward momentum, but a bearish MACD crossover and significant outflows indicate potential shortterm price cooling.
3. LongTerm Bullish Outlook: The community and analysts anticipate a strong altcoin season, with predictions for DOGE to reach $0.80 to $1.50, supported by its fundamental characteristics and cultural status.
Positives
1. Institutional Inflows: The RexOsprey DOGE ETF has attracted over $20 million in inflows, indicating increasing demand from American investors and suggesting substantial future inflows from upcoming mainstream DOGE ETFs.
2. Whale Accumulation: Large holders have accumulated over 30 million DOGE in recent days, accompanied by net outflows exceeding $25 million from exchanges, signaling strong confidence and reduced supply pressure.
3. Bullish EMA Crossover: The 7period Exponential Moving Average (EMA) recently crossed above both the 25period and 99period EMAs, forming a bullish crossover pattern that indicates potential for continued upward price momentum.
#DOGE $DOGE
Target 🎯 Done
LoserBoi
·
--
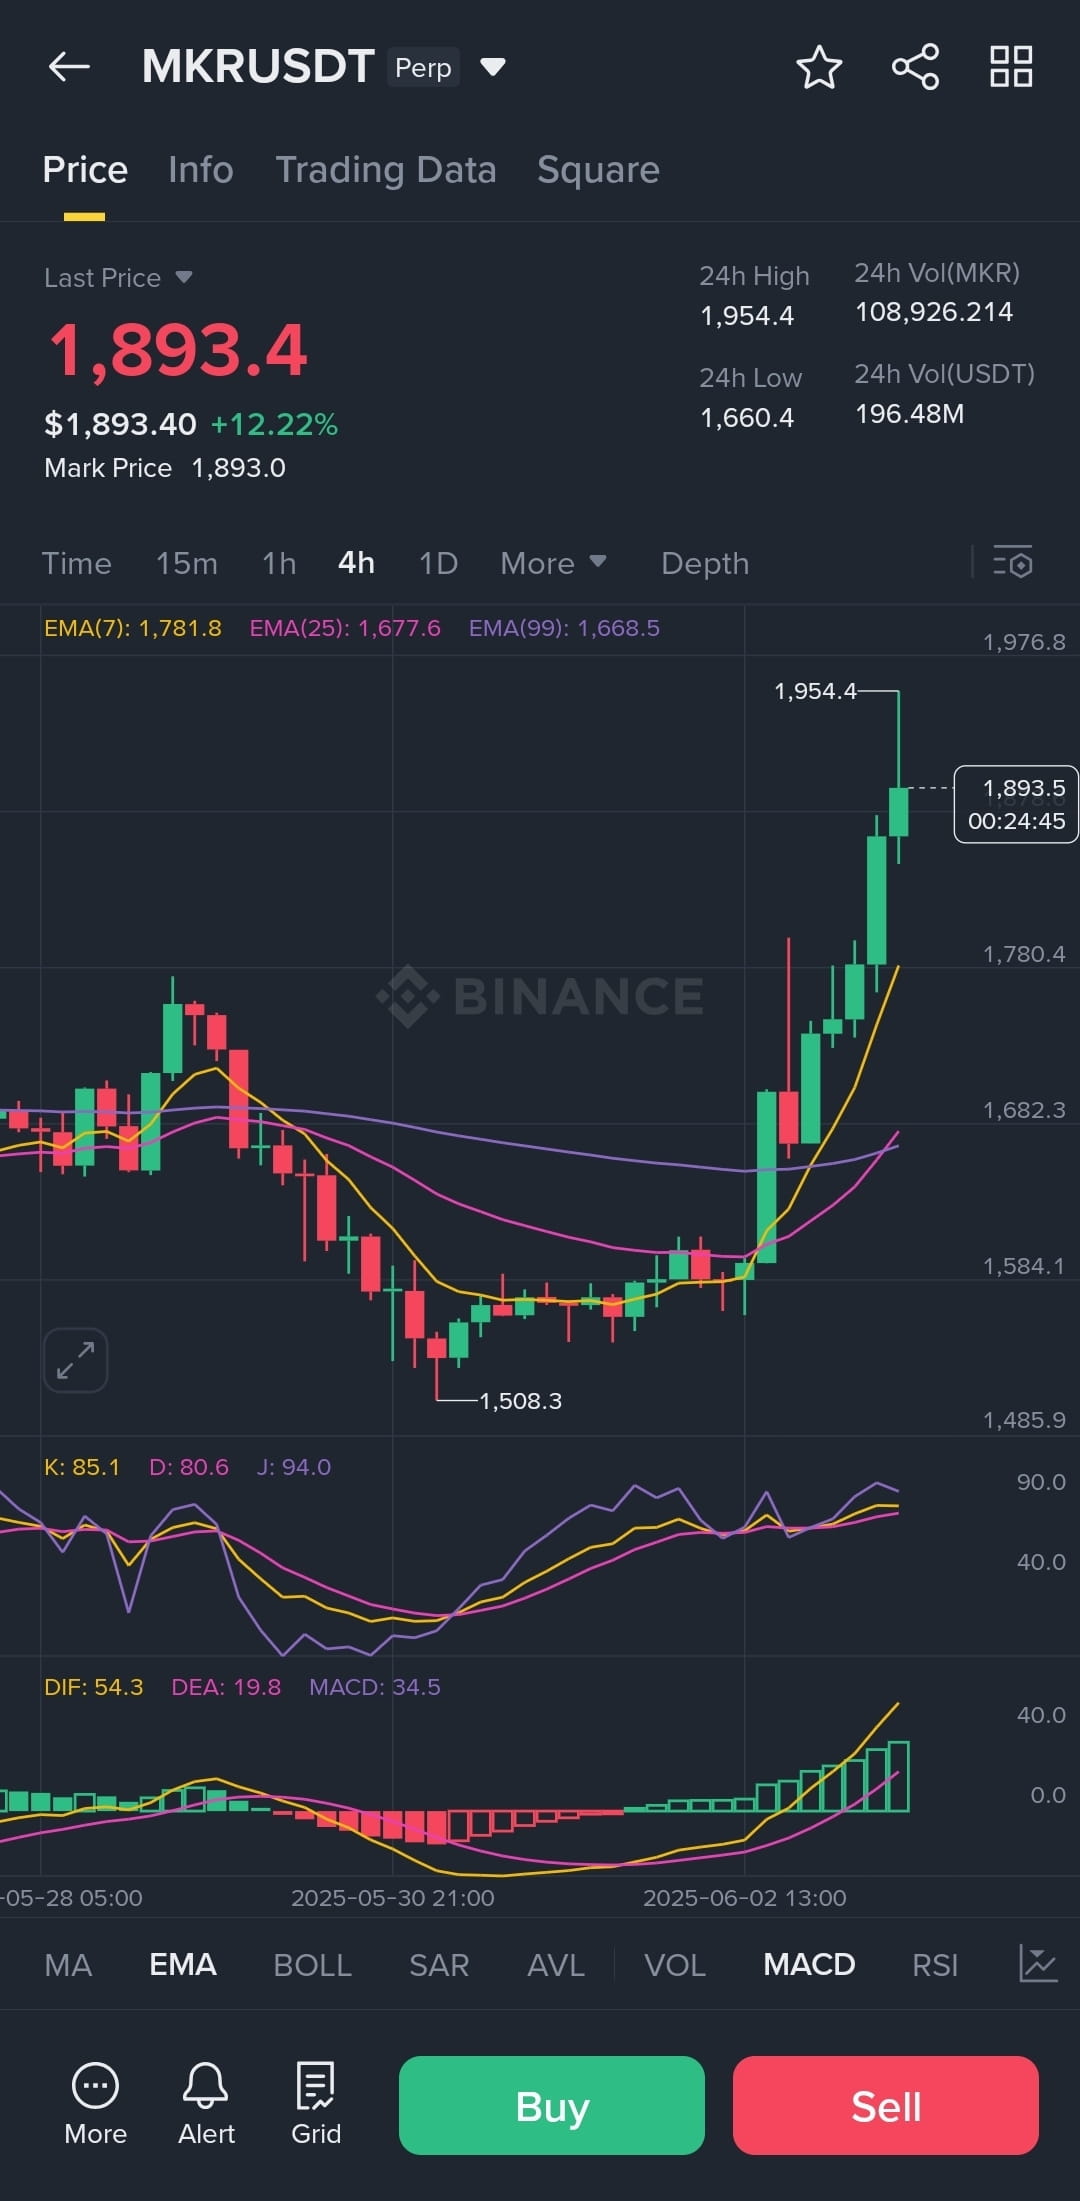
📣 MKRUSDT | Short
✅ Entry price: 1944.5
🚫 Termination price: 1927
⏰ Running time: 0 days 0 hours 57 minutes
✅ Entry price: 1944.5
🚫 Termination price: 1927
⏰ Running time: 0 days 0 hours 57 minutes
තවත් අන්තර්ගතයන් ගවේෂණය කිරීමට ඇතුල් වන්න