
Crypto AnalyZen
1.2k පෝස්ටු

Crypto AnalyZen
වාර්තා කරන්න
පරිශීලක අවහිර කරන්න
Gold & Silver Futures Trader | BTC & Top 20
Scenario-based crypto market analysis.
Focus on structure, liquidity and risk.
54 හඹා යමින්
639 හඹා යන්නන්
1.1K+ කැමති විය
පෝස්ටු
සියල්ල
උපුටා දැක්වීම්
අමුණා ඇත
ලිපිය
පරිවර්තනය බලන්න
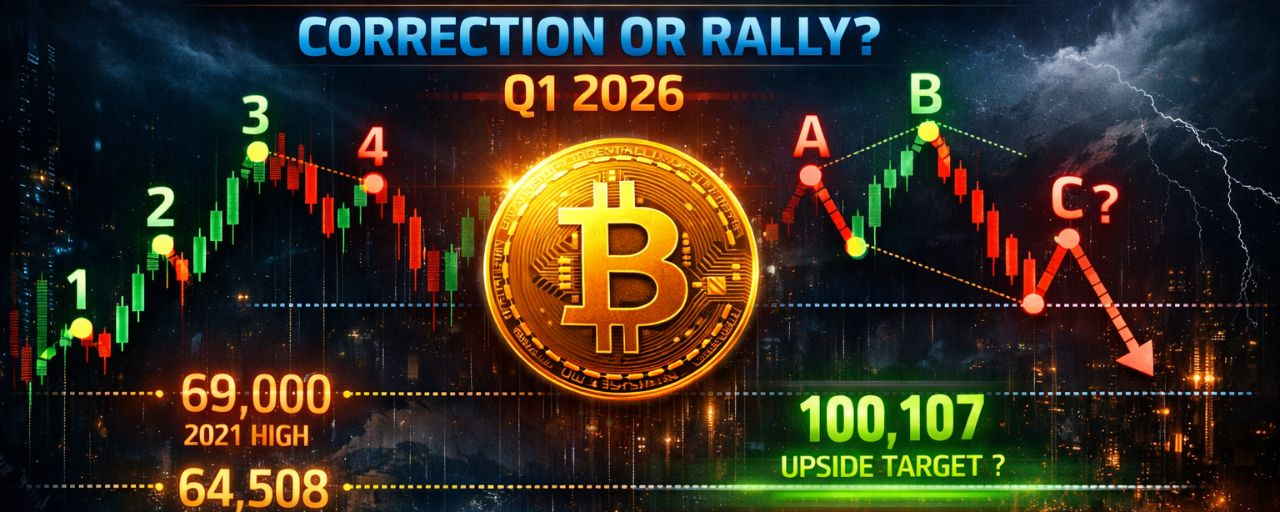
Bitcoin at a Crossroads: Correction to $32K or Rally to $100K?$BTC With Q1 2026 now closed, it is essential to reassess Bitcoin’s structure on higher time frames.
From a macro perspective, the annual chart aligns well with Elliott Wave Theory, showing:
Three completed impulse waves (1–3–5)Two corrective waves (2–4)This suggests that the market may have entered a macro corrective phase (A–B–C), with price currently developing Wave A (downward leg).
Current Market Structure
On the annual chart:
The price has successfully filled the gap between the 2021 high (69,000) and the 2025 low (74,508)The gap midpoint is located at 71,789
The February decline:
Broke below the 50% macro range (64,508.32)
However, it failed to reach 57,672.35, which represents:
50% of the upper wick of the 2021 candle~62% Fibonacci retracement of the recent impulse move
Key Downside Levels
If the correction continues, the following levels are critical:
69,000 → 2021 high / lower boundary of the annual gap64,508.32 → 50% of macro range (ATL–ATH)49,949.16 → 62% retracement of macro range48,189.84 → 2022 high46,216.93 → 2022 open
Monthly Projection
The monthly chart provides a clearer Elliott Wave structure.
Projecting the first downward leg:
Target aligns with a lower time frame gap midpoint at ~51,968
Capitulation Zone (High-Probability Demand Area)
The most critical area for a potential bottom:
37,579 – 32,428
This zone represents:
Likely Wave A completionStrong institutional demand (“smart money” interest)A base for projecting Wave B (upward retracement)
Alternative Scenario (Bullish Case)
Given that the decline paused within the 2024 accumulation zone, we cannot exclude the possibility that:
Wave A has already completedWave B (upward movement) is beginning
Upside Target
Projecting the decline range upward from the capitulation zone:
Target: 100,107
This level represents:
The midpoint of an unfilled upper gap between:
October 2025 low: 102,000January 2026 high: 97,924
{spot}(BTCUSDT)
{future}(BTCUSDT)
Bitcoin at a Crossroads: Correction to $32K or Rally to $100K?
$BTC With Q1 2026 now closed, it is essential to reassess Bitcoin’s structure on higher time frames.
From a macro perspective, the annual chart aligns well with Elliott Wave Theory, showing:
Three completed impulse waves (1–3–5)Two corrective waves (2–4)This suggests that the market may have entered a macro corrective phase (A–B–C), with price currently developing Wave A (downward leg).
Current Market Structure
On the annual chart:
The price has successfully filled the gap between the 2021 high (69,000) and the 2025 low (74,508)The gap midpoint is located at 71,789
The February decline:
Broke below the 50% macro range (64,508.32)
However, it failed to reach 57,672.35, which represents:
50% of the upper wick of the 2021 candle~62% Fibonacci retracement of the recent impulse move
Key Downside Levels
If the correction continues, the following levels are critical:
69,000 → 2021 high / lower boundary of the annual gap64,508.32 → 50% of macro range (ATL–ATH)49,949.16 → 62% retracement of macro range48,189.84 → 2022 high46,216.93 → 2022 open
Monthly Projection
The monthly chart provides a clearer Elliott Wave structure.
Projecting the first downward leg:
Target aligns with a lower time frame gap midpoint at ~51,968
Capitulation Zone (High-Probability Demand Area)
The most critical area for a potential bottom:
37,579 – 32,428
This zone represents:
Likely Wave A completionStrong institutional demand (“smart money” interest)A base for projecting Wave B (upward retracement)
Alternative Scenario (Bullish Case)
Given that the decline paused within the 2024 accumulation zone, we cannot exclude the possibility that:
Wave A has already completedWave B (upward movement) is beginning
Upside Target
Projecting the decline range upward from the capitulation zone:
Target: 100,107
This level represents:
The midpoint of an unfilled upper gap between:
October 2025 low: 102,000January 2026 high: 97,924
From a macro perspective, the annual chart aligns well with Elliott Wave Theory, showing:
Three completed impulse waves (1–3–5)Two corrective waves (2–4)This suggests that the market may have entered a macro corrective phase (A–B–C), with price currently developing Wave A (downward leg).
Current Market Structure
On the annual chart:
The price has successfully filled the gap between the 2021 high (69,000) and the 2025 low (74,508)The gap midpoint is located at 71,789
The February decline:
Broke below the 50% macro range (64,508.32)
However, it failed to reach 57,672.35, which represents:
50% of the upper wick of the 2021 candle~62% Fibonacci retracement of the recent impulse move
Key Downside Levels
If the correction continues, the following levels are critical:
69,000 → 2021 high / lower boundary of the annual gap64,508.32 → 50% of macro range (ATL–ATH)49,949.16 → 62% retracement of macro range48,189.84 → 2022 high46,216.93 → 2022 open
Monthly Projection
The monthly chart provides a clearer Elliott Wave structure.
Projecting the first downward leg:
Target aligns with a lower time frame gap midpoint at ~51,968
Capitulation Zone (High-Probability Demand Area)
The most critical area for a potential bottom:
37,579 – 32,428
This zone represents:
Likely Wave A completionStrong institutional demand (“smart money” interest)A base for projecting Wave B (upward retracement)
Alternative Scenario (Bullish Case)
Given that the decline paused within the 2024 accumulation zone, we cannot exclude the possibility that:
Wave A has already completedWave B (upward movement) is beginning
Upside Target
Projecting the decline range upward from the capitulation zone:
Target: 100,107
This level represents:
The midpoint of an unfilled upper gap between:
October 2025 low: 102,000January 2026 high: 97,924
1
2
30
·
--
උසබ තත්ත්වය
#DXYDrop #DollarIndex
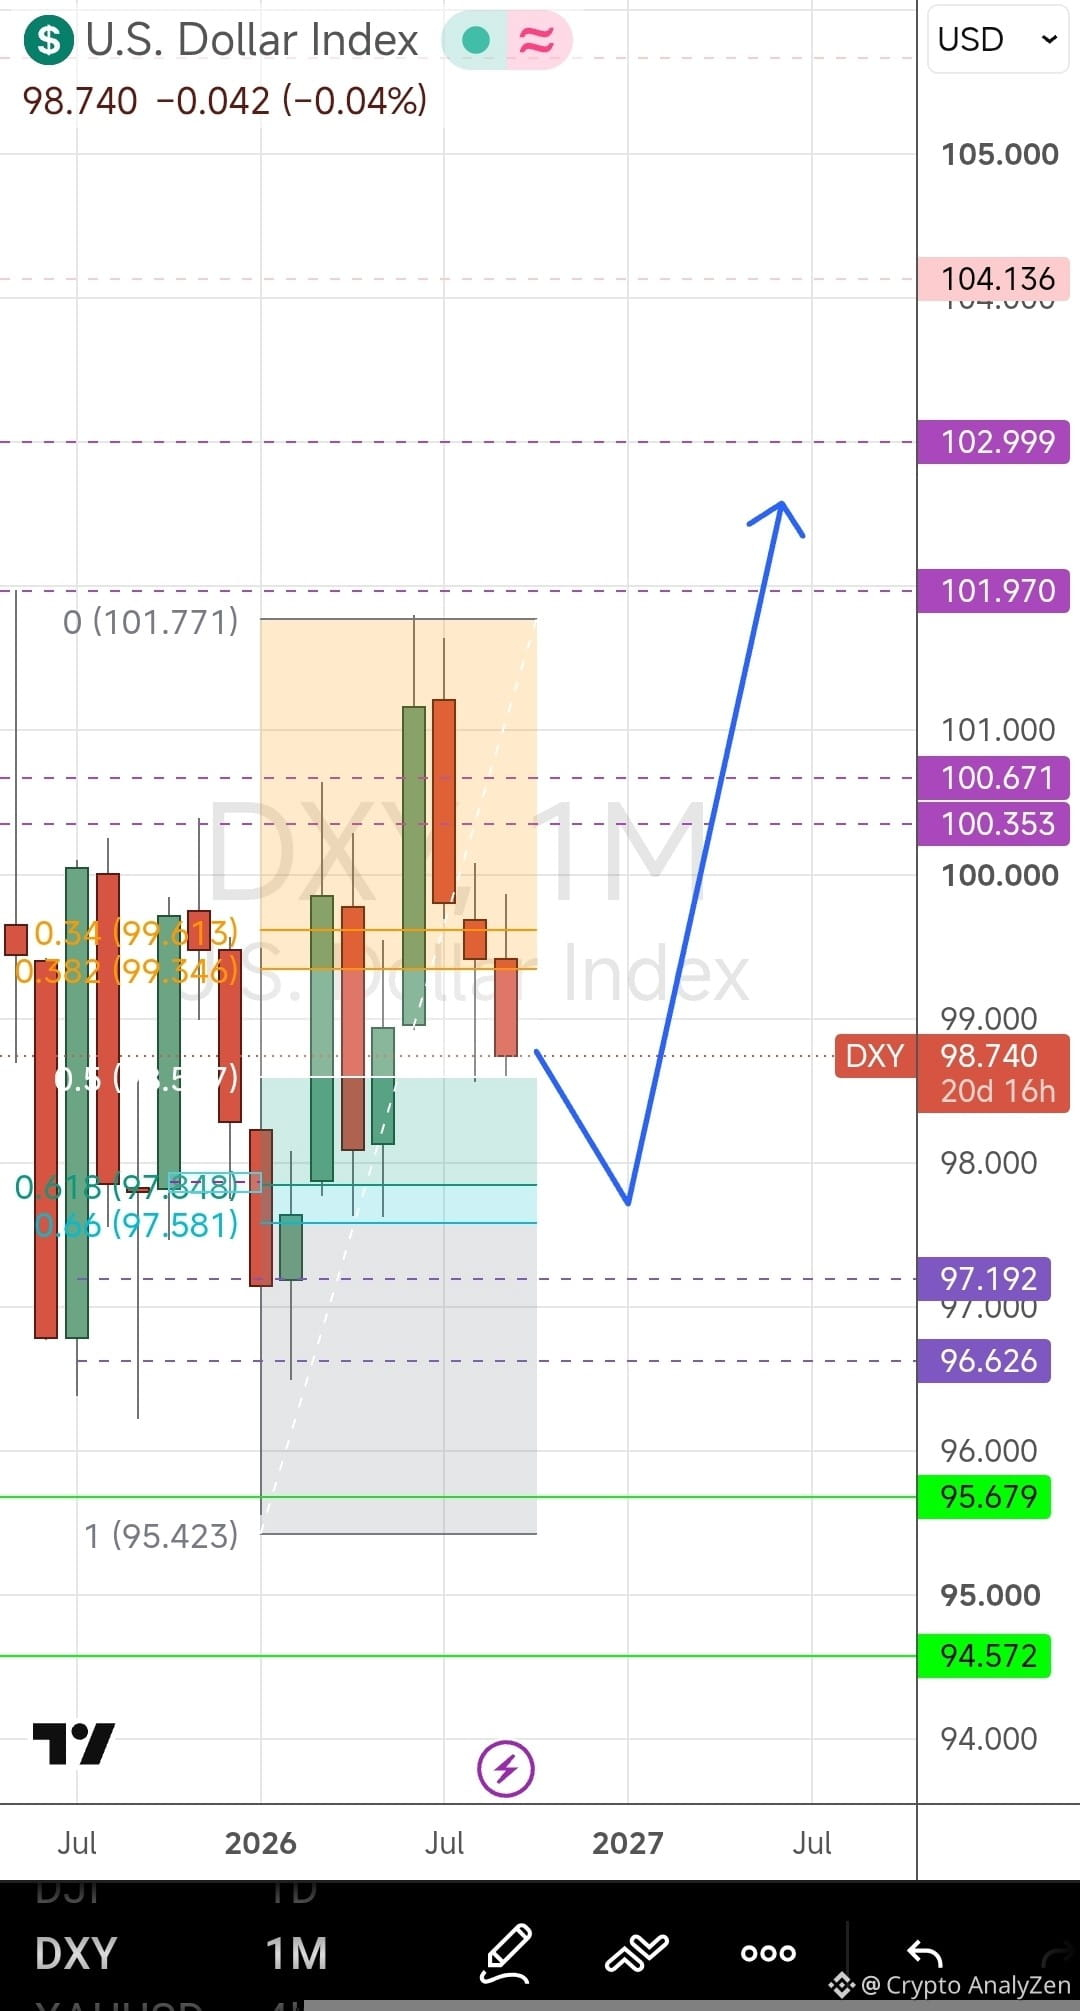
ඩොලර් දර්ශකය අවසාන මාසයේ අවම මට්ටමට ලැබී ඇත.
97.6 දක්වා (68% ෆිබොනාචි මට්ටම) පහත යාමේ දිගුවක් සිදුවීමේ ඉහළ සම්භාවිතාවක් ඇත.
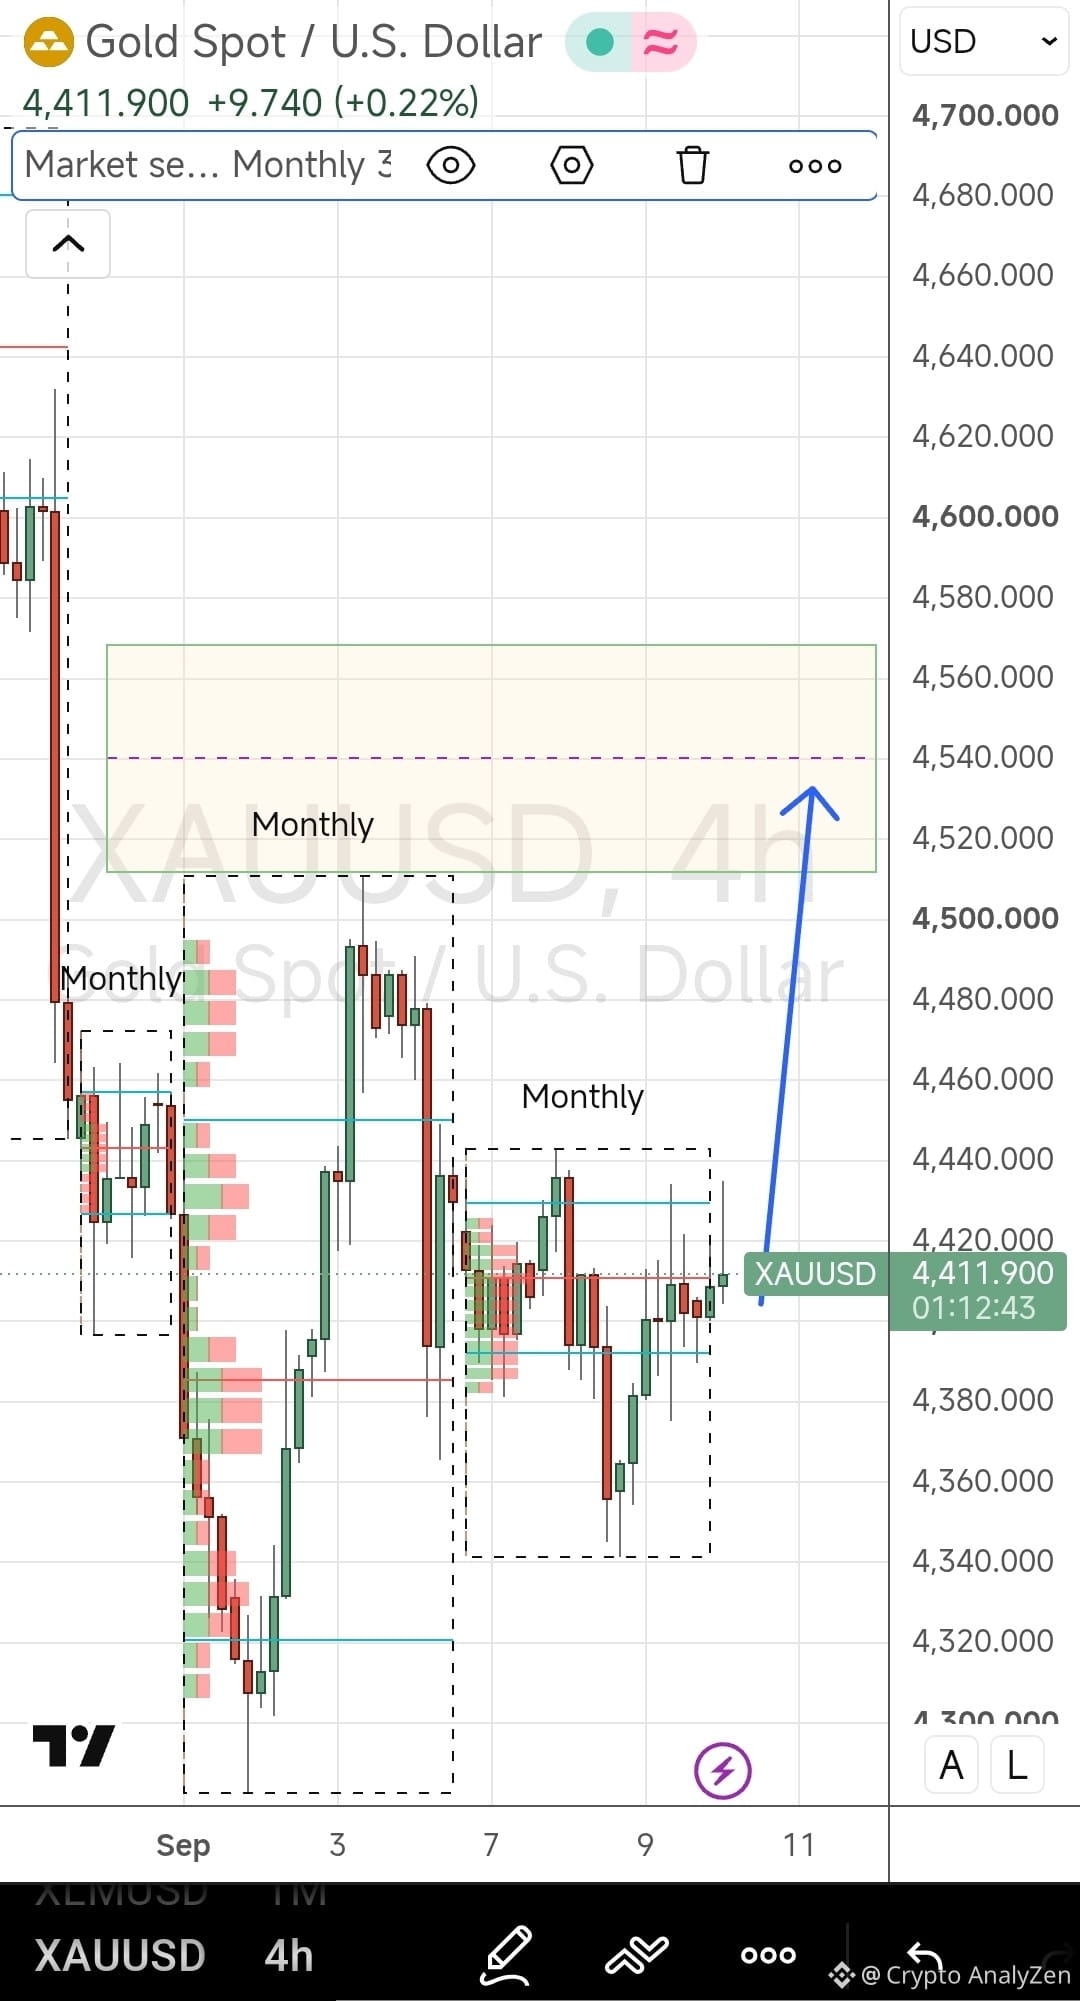
#GOLD සඳහා මෙයින් අදහස් කරන්නේ කුමක්ද? $XAU $XAUT
4511-4568 පරාසයේ තවමත් පිරී නොමැති හිඩැසක් තිබේ.
{future}(XAUUSDT)
{future}(XAUTUSDT)
#DXYDrop #DollarIndex
ඩොලර් දර්ශකය අවසාන මාසයේ අවම මට්ටමට ලැබී ඇත.
97.6 දක්වා (68% ෆිබොනාචි මට්ටම) පහත යාමේ දිගුවක් සිදුවීමේ ඉහළ සම්භාවිතාවක් ඇත.
#GOLD සඳහා මෙයින් අදහස් කරන්නේ කුමක්ද? $XAU $XAUT
4511-4568 පරාසයේ තවමත් පිරී නොමැති හිඩැසක් තිබේ.
ඩොලර් දර්ශකය අවසාන මාසයේ අවම මට්ටමට ලැබී ඇත.
97.6 දක්වා (68% ෆිබොනාචි මට්ටම) පහත යාමේ දිගුවක් සිදුවීමේ ඉහළ සම්භාවිතාවක් ඇත.
#GOLD සඳහා මෙයින් අදහස් කරන්නේ කුමක්ද? $XAU $XAUT
4511-4568 පරාසයේ තවමත් පිරී නොමැති හිඩැසක් තිබේ.
1
155
·
--
උසබ තත්ත්වය
$XAG #Silver
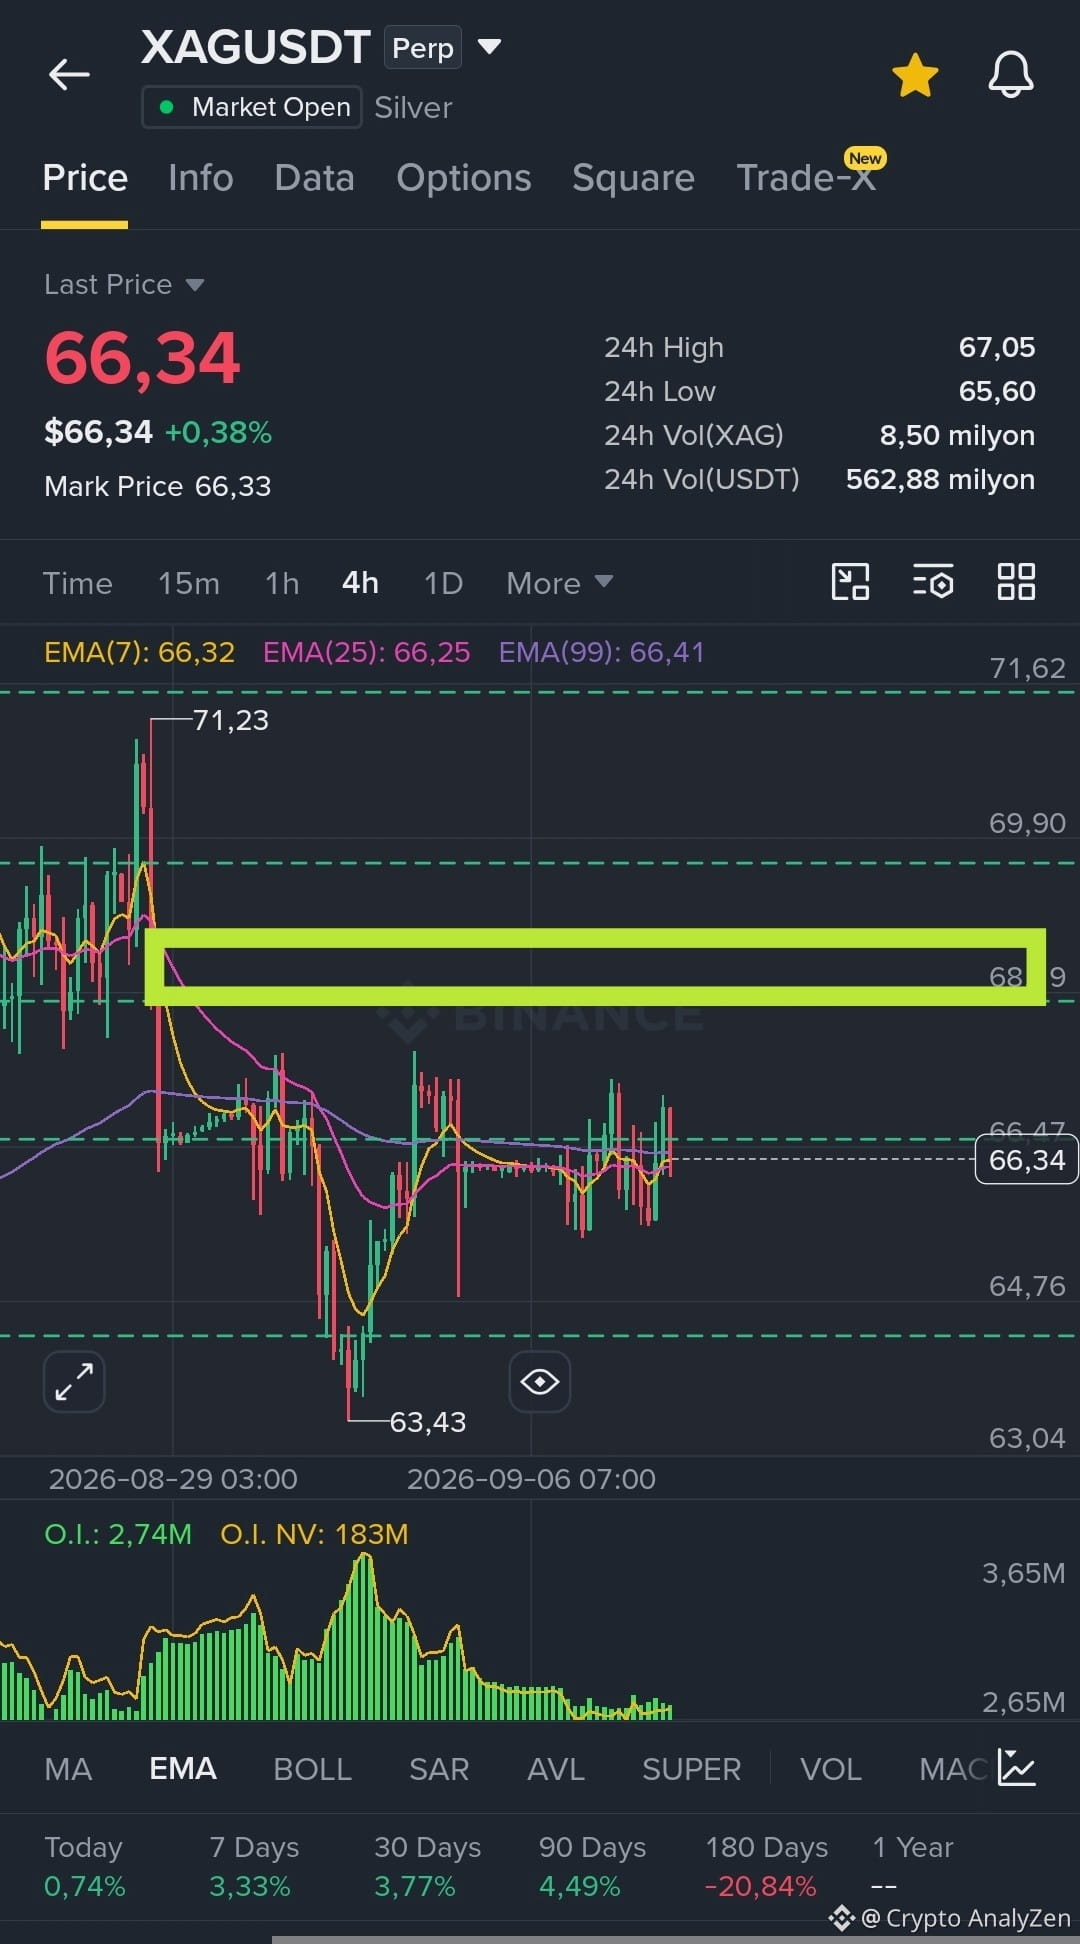
68 အထက် මිලကိုရရန် နောက်ဆုံး ကြိုးစားမှု
Marked gap zone - ආපန်ပြန်လှန်မှု ဖြစ်နိုင်ခြေ အမြင့်
{future}(XAGUSDT)
$XAG #Silver
68 အထက် මිලကိုရရန် နောက်ဆုံး ကြိုးစားမှု
Marked gap zone - ආපန်ပြန်လှန်မှု ဖြစ်နိုင်ခြေ အမြင့်
68 အထက် මිලကိုရရန် နောက်ဆုံး ကြိုးစားမှု
Marked gap zone - ආපန်ပြန်လှန်မှု ဖြစ်နိုင်ခြေ အမြင့်
2
122
·
--
බෙයාරිෂ්
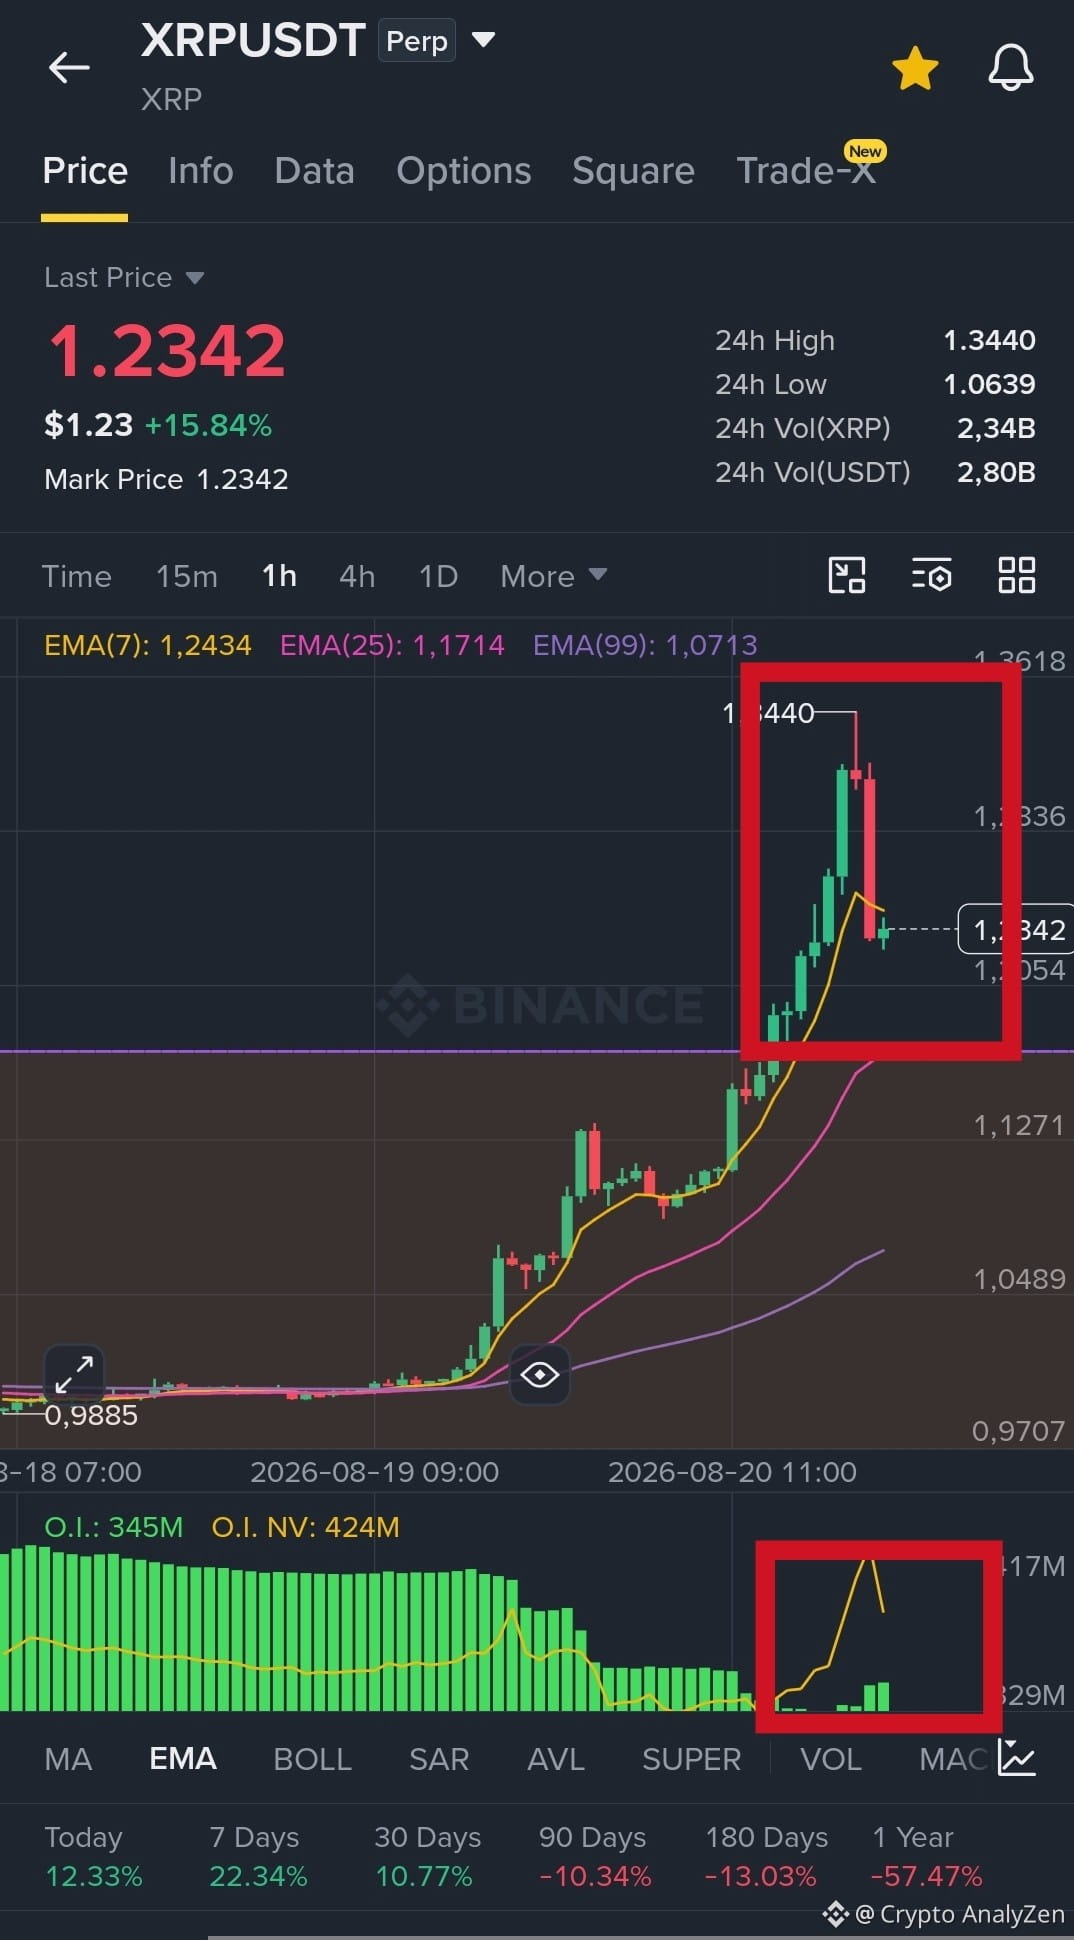
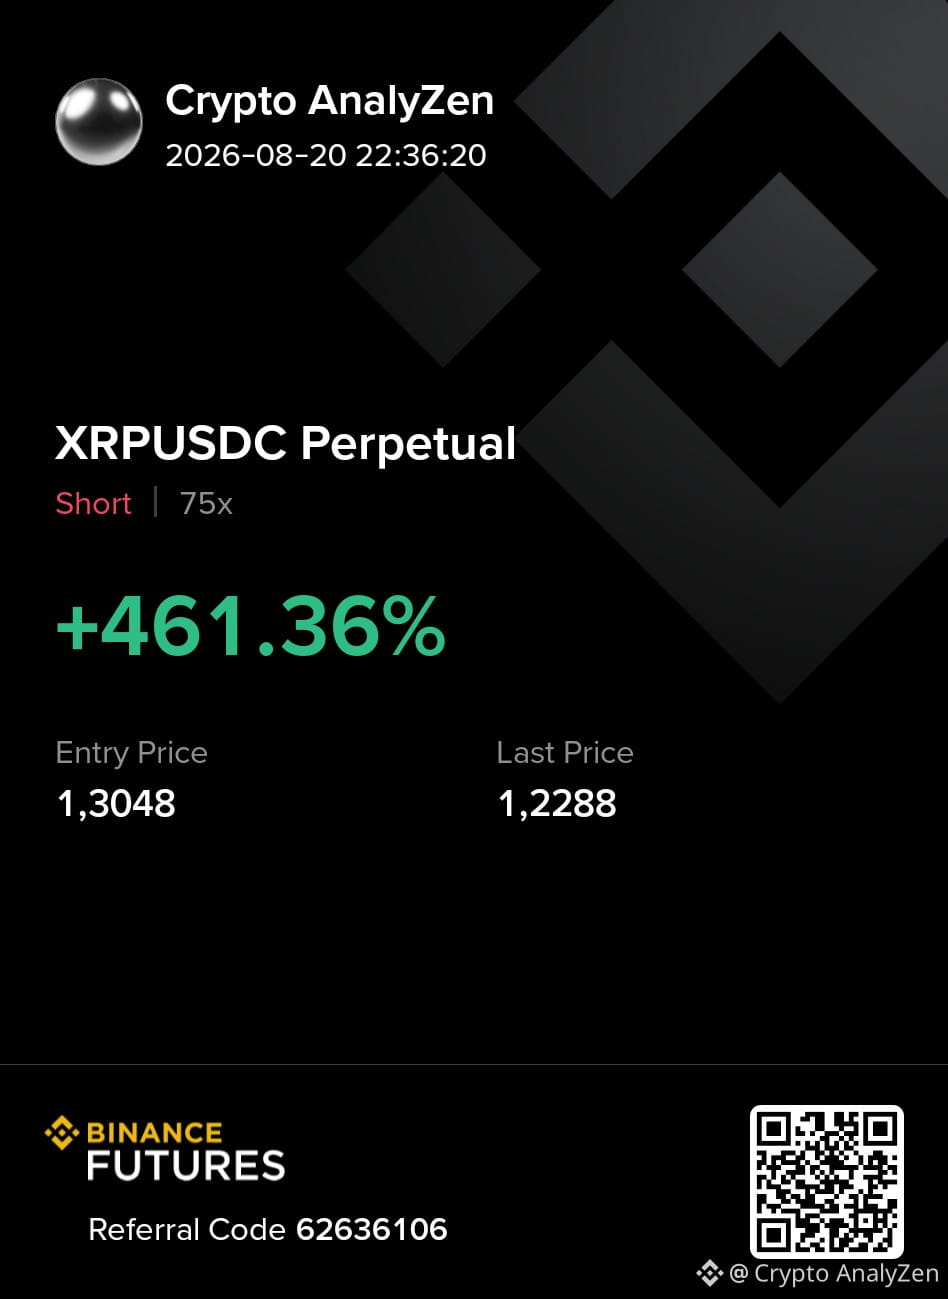
$XRP මිල පැය 8ක් තුළ 20%කින් ඉහළ ගියේය.
අපේක්ෂිත මට්ටම් ඉක්මවා ඉහල යාමක් මෑතකදී සිදු වූ නිසා, NY විවෘත වීමට පෙර සහ පසු යම් කාලයකදි ලොන්ග් සහ ස්පොට් ස්ථාන ක්රියාකාරී ලෙස වසා දැමීමක් සිදු විය.
විවෘත උනන්දුව තියුණු ලෙස පහත වැටුණ බව සලකන්න.
අද දින මුල් කාලීන ෂෝර්ට් සඳහා සහ ප්රමාද වී ලොන්ග් සඳහා අසීරු විය
#Ripple💰
$XRP මිල පැය 8ක් තුළ 20%කින් ඉහළ ගියේය.
අපේක්ෂිත මට්ටම් ඉක්මවා ඉහල යාමක් මෑතකදී සිදු වූ නිසා, NY විවෘත වීමට පෙර සහ පසු යම් කාලයකදි ලොන්ග් සහ ස්පොට් ස්ථාන ක්රියාකාරී ලෙස වසා දැමීමක් සිදු විය.
විවෘත උනන්දුව තියුණු ලෙස පහත වැටුණ බව සලකන්න.
අද දින මුල් කාලීන ෂෝර්ට් සඳහා සහ ප්රමාද වී ලොන්ග් සඳහා අසීරු විය
#Ripple💰
අපේක්ෂිත මට්ටම් ඉක්මවා ඉහල යාමක් මෑතකදී සිදු වූ නිසා, NY විවෘත වීමට පෙර සහ පසු යම් කාලයකදි ලොන්ග් සහ ස්පොට් ස්ථාන ක්රියාකාරී ලෙස වසා දැමීමක් සිදු විය.
විවෘත උනන්දුව තියුණු ලෙස පහත වැටුණ බව සලකන්න.
අද දින මුල් කාලීන ෂෝර්ට් සඳහා සහ ප්රමාද වී ලොන්ග් සඳහා අසීරු විය
#Ripple💰
2
145
·
--
බෙයාරිෂ්
$BTC #bitcoin
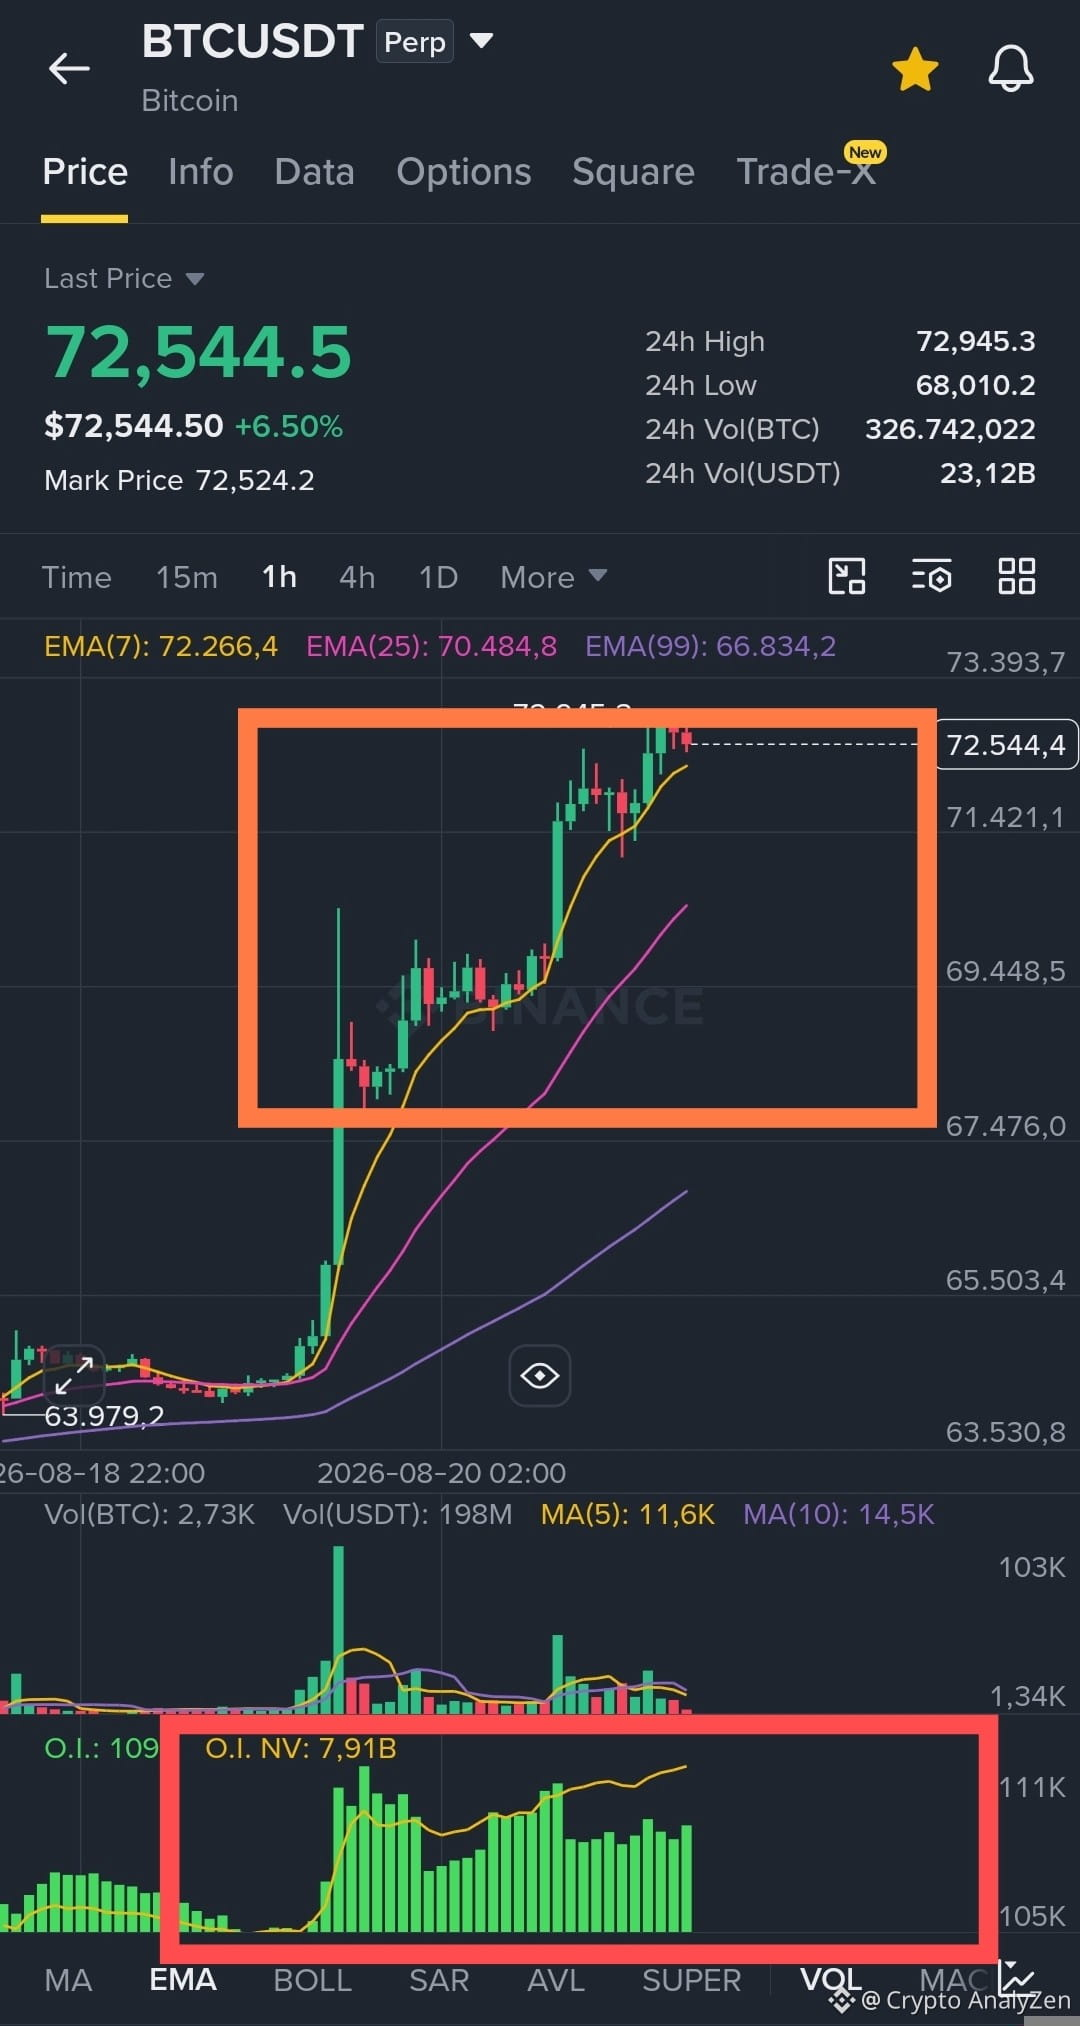
စျေးနှုန်းတဖြည်းဖြည်း မြင့်တက်လာတာနဲ့အတူ Open interest တိုးလာပါတယ် ;)
အချက်ပြမှုတွေအားလုံးက short positions အသစ်တွေ ဖွင့်နေတယ်ဆိုတာကို ညွှန်ပြနေပါတယ်
{future}(BTCUSDT)
$BTC #bitcoin
စျေးနှုန်းတဖြည်းဖြည်း မြင့်တက်လာတာနဲ့အတူ Open interest တိုးလာပါတယ် ;)
အချက်ပြမှုတွေအားလုံးက short positions အသစ်တွေ ဖွင့်နေတယ်ဆိုတာကို ညွှန်ပြနေပါတယ်
စျေးနှုန်းတဖြည်းဖြည်း မြင့်တက်လာတာနဲ့အတူ Open interest တိုးလာပါတယ် ;)
အချက်ပြမှုတွေအားလုံးက short positions အသစ်တွေ ဖွင့်နေတယ်ဆိုတာကို ညွှန်ပြနေပါတယ်
1
92
·
--
බෙයාරිෂ්
Crypto AnalyZen
·
--
උසබ තත්ත්වය$BTC #bitcoin
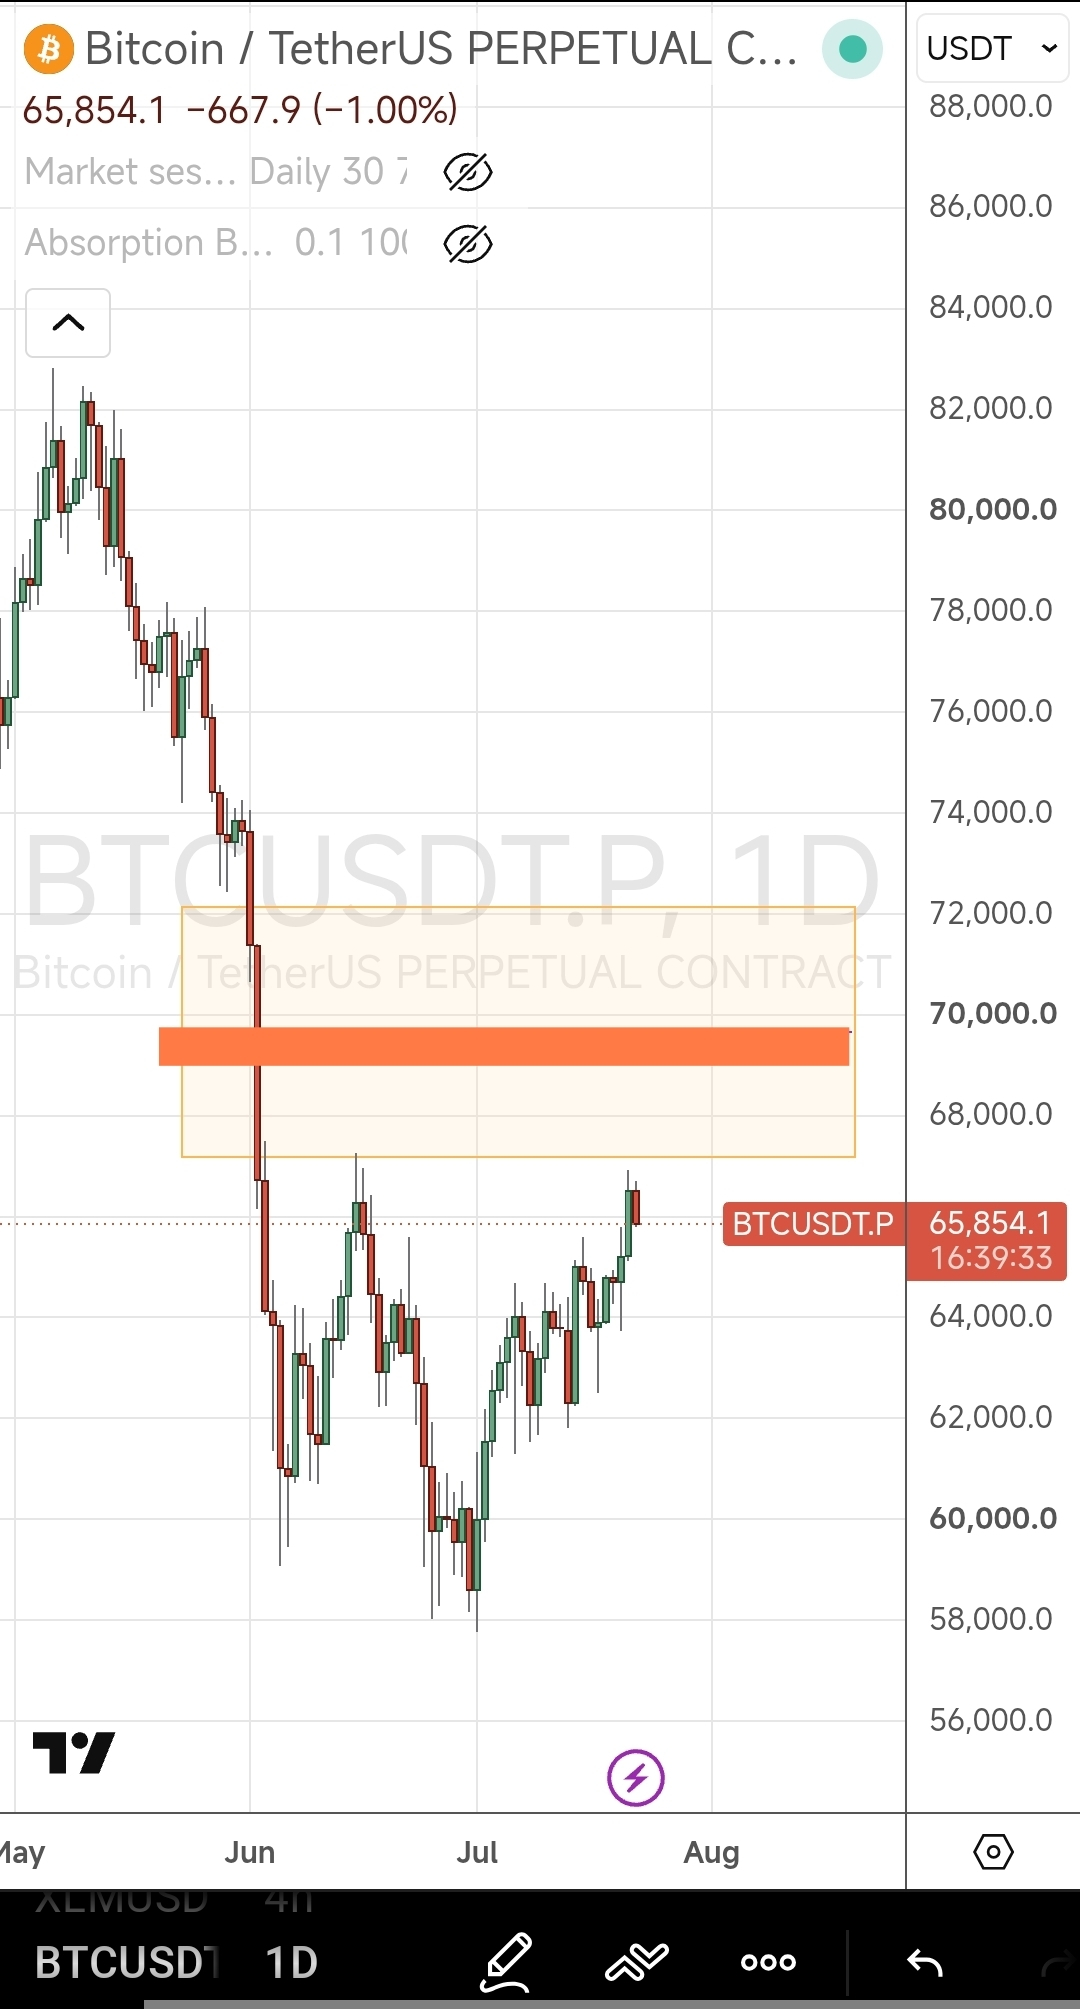
-67k-72k အတွင်းရှိ gap ကို ဖြည့်ရန် ဆက်လက် တက်သွားနိုင်မည့် မြင့်မားသော အလားအလာ
gap အလယ်ပိုင်းက 69k-70k ဝန်းကျင်
စျေးနှုန်းက gap အလယ်မှာ ရပ်သွားမယ်ဆိုရင် အသစ်သော အနိမ့်ဆုံးအသစ်ကို ရှာဖွေရန် အောက်ဘက်သို့ လျင်မြန်စွာ ကျဆင်းမယ်လို့ မျှော်လင့်တယ်
ဒီကိစ္စမှာ high time frame ရဲ့ projection နဲ့ Fibonacci retracement က 47k ဆိုတဲ့ အဆင့်ကို ညွှန်ပြနေပါတယ်
#BitcoinDunyamiz
#BTCUSDT
-67k-72k အတွင်းရှိ gap ကို ဖြည့်ရန် ဆက်လက် တက်သွားနိုင်မည့် မြင့်မားသော အလားအလာ
gap အလယ်ပိုင်းက 69k-70k ဝန်းကျင်
စျေးနှုန်းက gap အလယ်မှာ ရပ်သွားမယ်ဆိုရင် အသစ်သော အနိမ့်ဆုံးအသစ်ကို ရှာဖွေရန် အောက်ဘက်သို့ လျင်မြန်စွာ ကျဆင်းမယ်လို့ မျှော်လင့်တယ်
ဒီကိစ္စမှာ high time frame ရဲ့ projection နဲ့ Fibonacci retracement က 47k ဆိုတဲ့ အဆင့်ကို ညွှန်ပြနေပါတယ်
#BitcoinDunyamiz
#BTCUSDT
1
120
සෝදිසියෙන් සිටින්න; මෙය බුලිෂ් වෙළඳපොළක් නොව, ඒත් බුල් ට්රැප් එකක් වගේය.
මිල ඉහළට තල්ලු කර නව කෙටි (short) කිරීම් විවෘත කිරීමට අදහස් ඇති බවට සියල්ලම පෙන්වයි.
#bitcoin සහ ප්රධාන දර්ශක සඳහා ඉහළ කාලරාමු විශ්ලේෂණය වෙනස් වී නැත; එය තවමත් ඊටත් වඩා බෙයරිෂ් වන අතර මට්ටම් තවමත් පහළම අගයන් ළඟයි.
#MarketSentimentToday
සෝදිසියෙන් සිටින්න; මෙය බුලිෂ් වෙළඳපොළක් නොව, ඒත් බුල් ට්රැප් එකක් වගේය.
මිල ඉහළට තල්ලු කර නව කෙටි (short) කිරීම් විවෘත කිරීමට අදහස් ඇති බවට සියල්ලම පෙන්වයි.
#bitcoin සහ ප්රධාන දර්ශක සඳහා ඉහළ කාලරාමු විශ්ලේෂණය වෙනස් වී නැත; එය තවමත් ඊටත් වඩා බෙයරිෂ් වන අතර මට්ටම් තවමත් පහළම අගයන් ළඟයි.
#MarketSentimentToday
මිල ඉහළට තල්ලු කර නව කෙටි (short) කිරීම් විවෘත කිරීමට අදහස් ඇති බවට සියල්ලම පෙන්වයි.
#bitcoin සහ ප්රධාන දර්ශක සඳහා ඉහළ කාලරාමු විශ්ලේෂණය වෙනස් වී නැත; එය තවමත් ඊටත් වඩා බෙයරිෂ් වන අතර මට්ටම් තවමත් පහළම අගයන් ළඟයි.
#MarketSentimentToday
1
3
125
·
--
උසබ තත්ත්වය
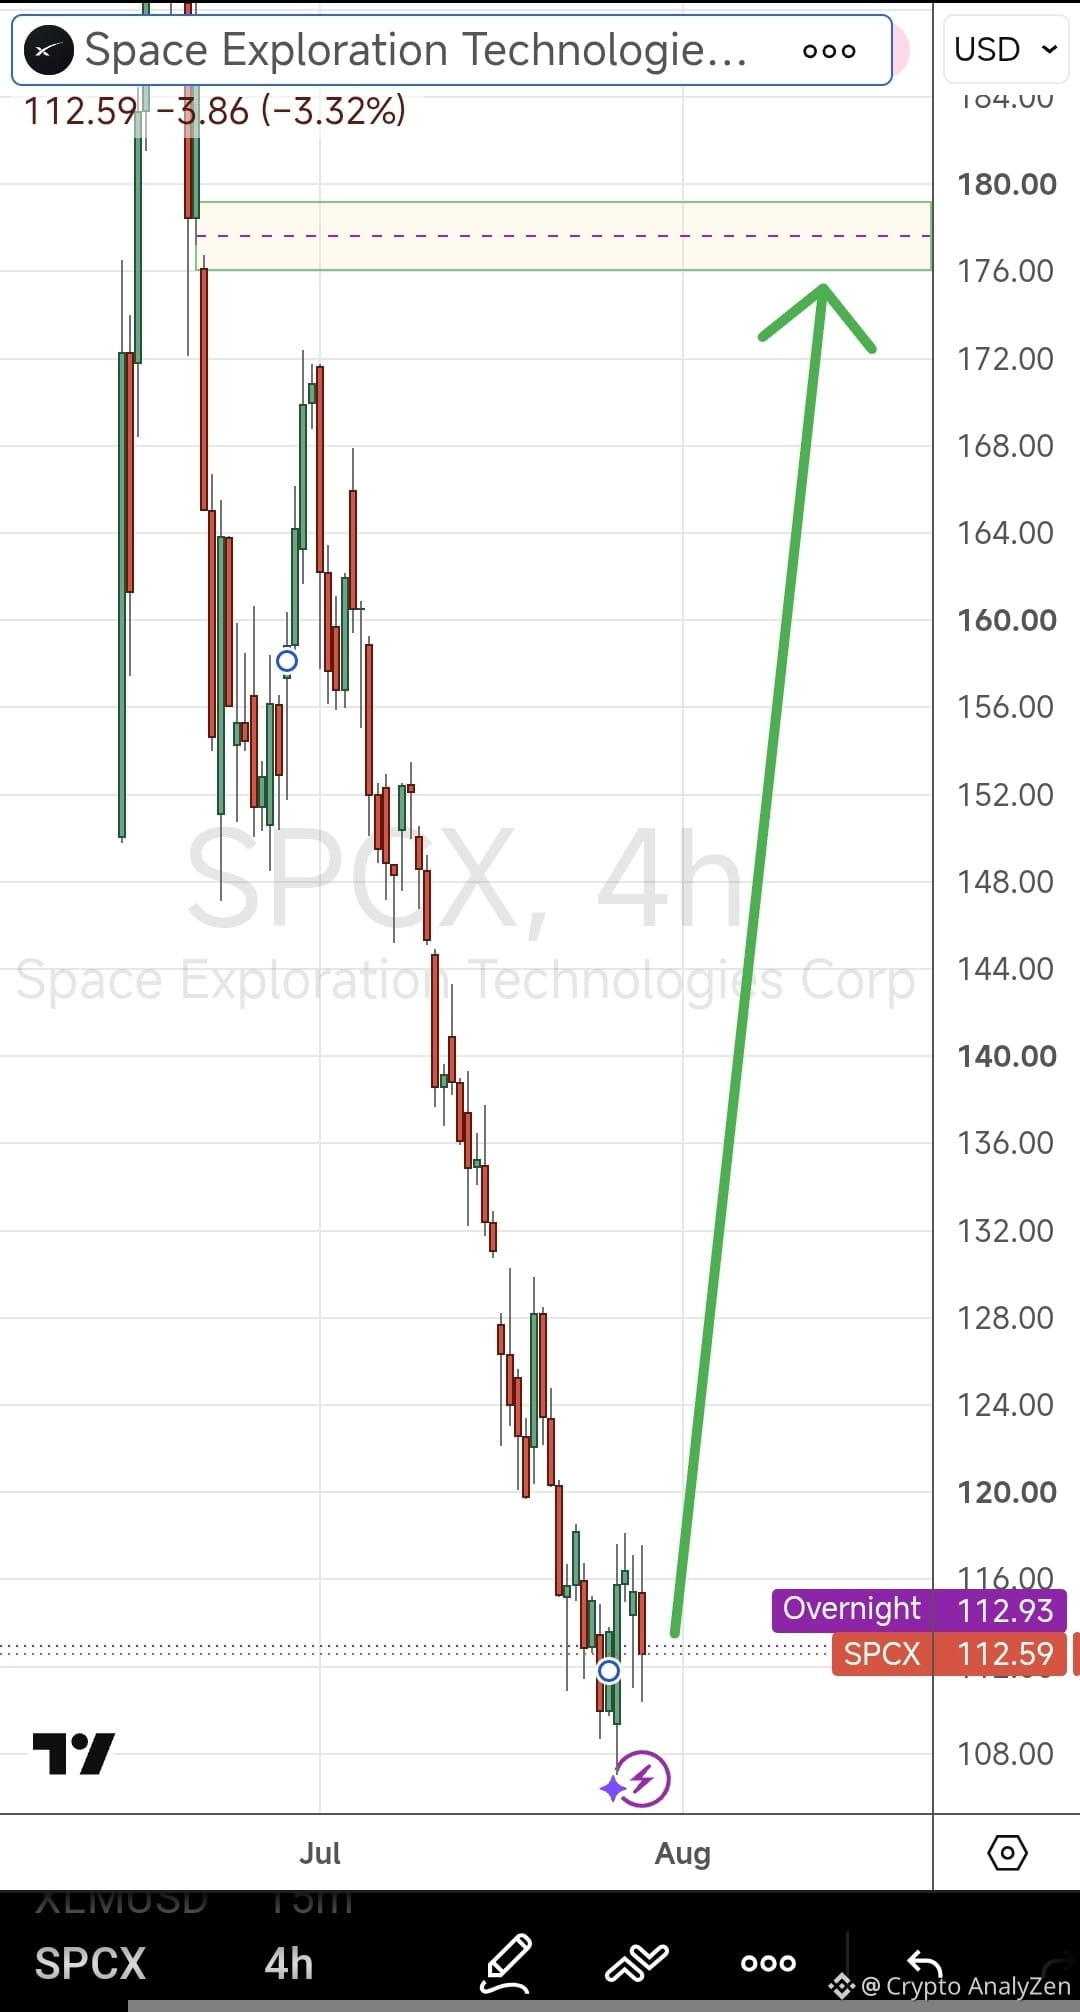
$SPCX $SPCXB $SPCX.US #SpaceX
සියල්ල සැලසුමට අනුව සිදුවෙමින් තිබේ.
ප්රමාදය ටිකක් ව්යාකූලයි; වාර්තාව නිකුත් වීමට ඉතිරිව ඇත්තේ පැය භාගයක් පමණයි (4:30), ඒත් මිල තවමත් $135 ලෙස සඳහන් යොමු මිලට වඩා අඩුයි.
{future}(SPCXUSDT)
{spot}(SPCXBUSDT)
{stock_us}(SPCX.US)
$SPCX $SPCXB $SPCX.US #SpaceX
සියල්ල සැලසුමට අනුව සිදුවෙමින් තිබේ.
ප්රමාදය ටිකක් ව්යාකූලයි; වාර්තාව නිකුත් වීමට ඉතිරිව ඇත්තේ පැය භාගයක් පමණයි (4:30), ඒත් මිල තවමත් $135 ලෙස සඳහන් යොමු මිලට වඩා අඩුයි.
සියල්ල සැලසුමට අනුව සිදුවෙමින් තිබේ.
ප්රමාදය ටිකක් ව්යාකූලයි; වාර්තාව නිකුත් වීමට ඉතිරිව ඇත්තේ පැය භාගයක් පමණයි (4:30), ඒත් මිල තවමත් $135 ලෙස සඳහන් යොමු මිලට වඩා අඩුයි.
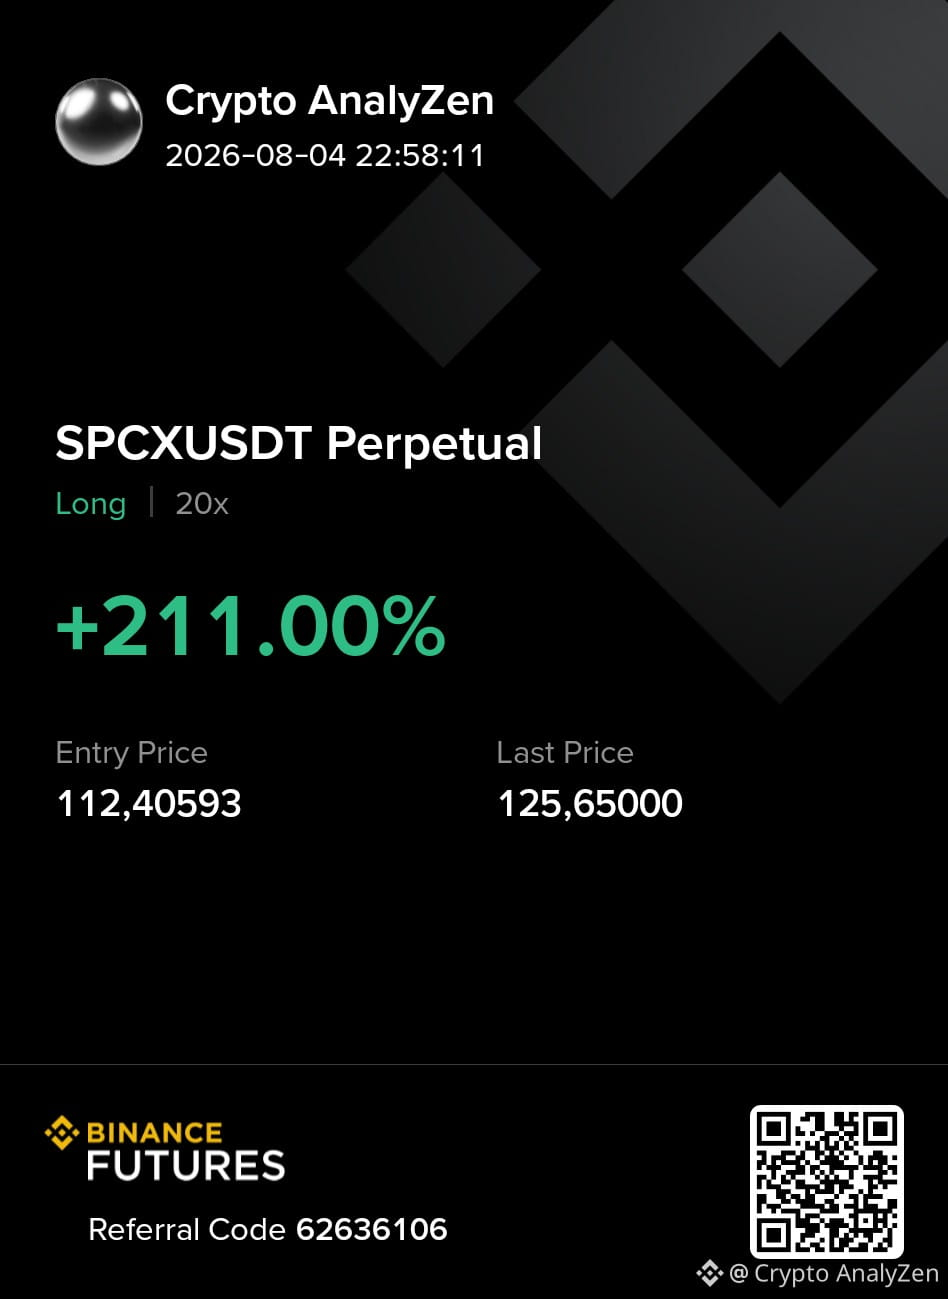
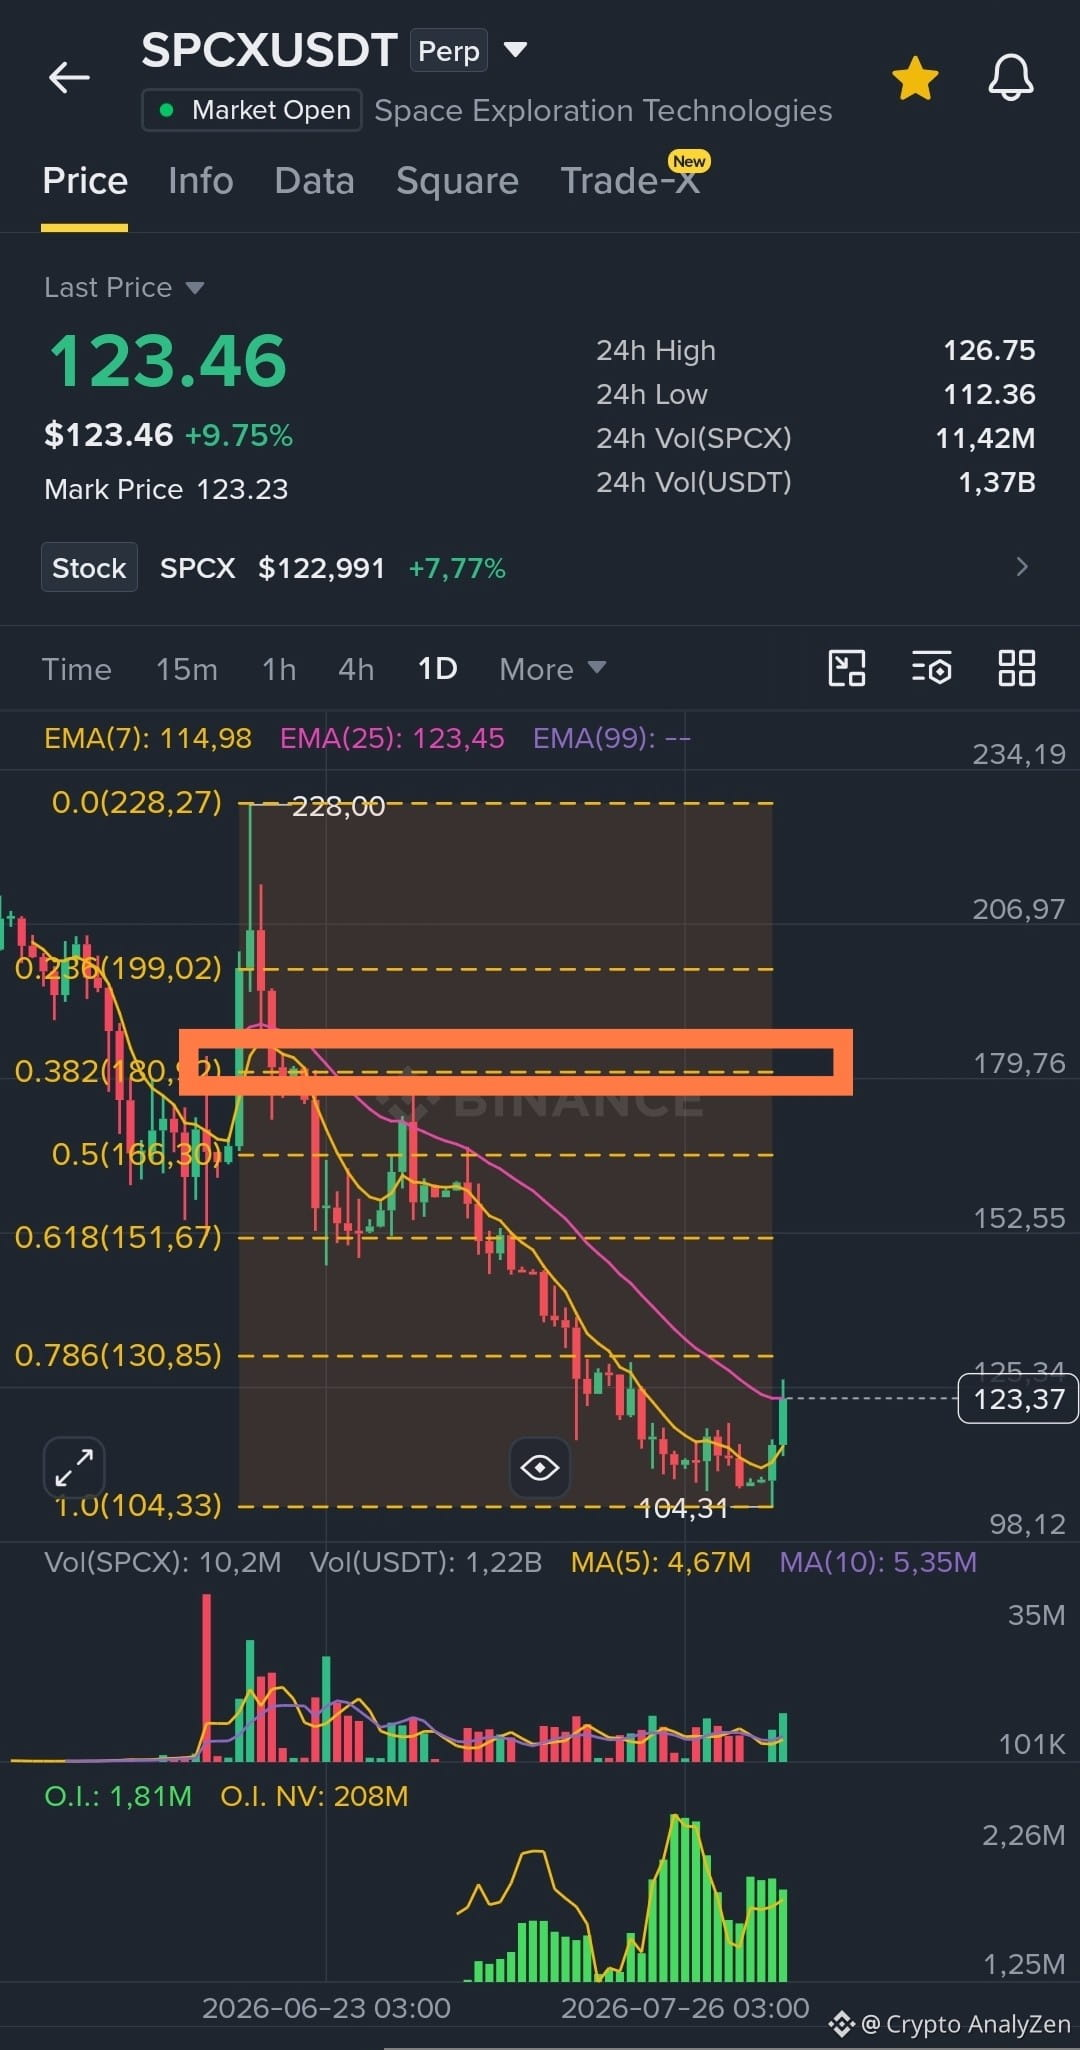
Crypto AnalyZen
·
--
උසබ තත්ත්වය🚨 යාවත්කාලීන කිරීම - එය ආරම්භ විය, අතපසු නොකරන්න ;)
#SpaceX ( $SPCX ) $SPCXB $SPCX.US
අඟහරුවාදා, 2026 අගෝස්තු 4 දින වෙළඳ අවසන් වීමට පසුව (balance sheet ඇතුළුව) සිය Q2 2026 මූල්ය සහ මෙහෙයුම් ප්රතිඵල නිකුත් කරනු ඇත.
----
ඉලක්කය $180-$199
----
එදිනම CT ප.ව. 3:30 / ET ප.ව. 4:30 ට කළමනාකාරීත්වය සජීවී ශ්රව්ය-පමණ webcast එකක් පැවැත්වෙන අතර, ප්රතිඵල සාකච්ඡා කරනු ඇත. webcast එක සහ නැවත නැරඹීම සමාගමේ investor relations වෙබ් අඩවියෙන් (ir.spacex.com) ලබාගත හැකි අතර, එය X ( @SpaceX ) හි ද සජීවීව විකාශනය කරනු ඇත
(2026 ජුනි IPO එකෙන් පසුව) මෙය SpaceX හි මහජන සමාගමක් ලෙස පළමු ත්රෛමාසික ආදායම් වාර්තාවයි. නිකුතුවෙන් පසුව දින දෙකකට පසුව (2026 අගෝස්තු 6 පමණ) මුල් “early-release eligible” කොටස් මුදාහැරීම්වල පළමු ප්රමාණවත් කොටස අවුලුවනු ඇතැයි අපේක්ෂා කෙරේ (20%) සහ මිල $175 හෝ ඊට ඉහළ නම් අමතර 10% ක්ද ඇත.
---
#USIranTalksToBegin #SPCXBToZero
#SpaceX ( $SPCX ) $SPCXB $SPCX.US
අඟහරුවාදා, 2026 අගෝස්තු 4 දින වෙළඳ අවසන් වීමට පසුව (balance sheet ඇතුළුව) සිය Q2 2026 මූල්ය සහ මෙහෙයුම් ප්රතිඵල නිකුත් කරනු ඇත.
----
ඉලක්කය $180-$199
----
එදිනම CT ප.ව. 3:30 / ET ප.ව. 4:30 ට කළමනාකාරීත්වය සජීවී ශ්රව්ය-පමණ webcast එකක් පැවැත්වෙන අතර, ප්රතිඵල සාකච්ඡා කරනු ඇත. webcast එක සහ නැවත නැරඹීම සමාගමේ investor relations වෙබ් අඩවියෙන් (ir.spacex.com) ලබාගත හැකි අතර, එය X ( @SpaceX ) හි ද සජීවීව විකාශනය කරනු ඇත
(2026 ජුනි IPO එකෙන් පසුව) මෙය SpaceX හි මහජන සමාගමක් ලෙස පළමු ත්රෛමාසික ආදායම් වාර්තාවයි. නිකුතුවෙන් පසුව දින දෙකකට පසුව (2026 අගෝස්තු 6 පමණ) මුල් “early-release eligible” කොටස් මුදාහැරීම්වල පළමු ප්රමාණවත් කොටස අවුලුවනු ඇතැයි අපේක්ෂා කෙරේ (20%) සහ මිල $175 හෝ ඊට ඉහළ නම් අමතර 10% ක්ද ඇත.
---
#USIranTalksToBegin #SPCXBToZero
SPCXB-0.93%
SPCXUS+0.27%
2
1k
·
--
උසබ තත්ත්වය
සත්යායනය කළ
🚨 යාවත්කාලීන කිරීම - එය ආරම්භ විය, අතපසු නොකරන්න ;)
#SpaceX ( $SPCX ) $SPCXB $SPCX.US
අඟහරුවාදා, 2026 අගෝස්තු 4 දින වෙළඳ අවසන් වීමට පසුව (balance sheet ඇතුළුව) සිය Q2 2026 මූල්ය සහ මෙහෙයුම් ප්රතිඵල නිකුත් කරනු ඇත.
----
ඉලක්කය $180-$199
----
එදිනම CT ප.ව. 3:30 / ET ප.ව. 4:30 ට කළමනාකාරීත්වය සජීවී ශ්රව්ය-පමණ webcast එකක් පැවැත්වෙන අතර, ප්රතිඵල සාකච්ඡා කරනු ඇත. webcast එක සහ නැවත නැරඹීම සමාගමේ investor relations වෙබ් අඩවියෙන් (ir.spacex.com) ලබාගත හැකි අතර, එය X ( @SpaceX ) හි ද සජීවීව විකාශනය කරනු ඇත
(2026 ජුනි IPO එකෙන් පසුව) මෙය SpaceX හි මහජන සමාගමක් ලෙස පළමු ත්රෛමාසික ආදායම් වාර්තාවයි. නිකුතුවෙන් පසුව දින දෙකකට පසුව (2026 අගෝස්තු 6 පමණ) මුල් “early-release eligible” කොටස් මුදාහැරීම්වල පළමු ප්රමාණවත් කොටස අවුලුවනු ඇතැයි අපේක්ෂා කෙරේ (20%) සහ මිල $175 හෝ ඊට ඉහළ නම් අමතර 10% ක්ද ඇත.
---
#USIranTalksToBegin #SPCXBToZero
{future}(SPCXUSDT)
{spot}(SPCXBUSDT)
{stock_us}(SPCX.US)
🚨 යාවත්කාලීන කිරීම - එය ආරම්භ විය, අතපසු නොකරන්න ;)
#SpaceX ( $SPCX ) $SPCXB $SPCX.US
අඟහරුවාදා, 2026 අගෝස්තු 4 දින වෙළඳ අවසන් වීමට පසුව (balance sheet ඇතුළුව) සිය Q2 2026 මූල්ය සහ මෙහෙයුම් ප්රතිඵල නිකුත් කරනු ඇත.
----
ඉලක්කය $180-$199
----
එදිනම CT ප.ව. 3:30 / ET ප.ව. 4:30 ට කළමනාකාරීත්වය සජීවී ශ්රව්ය-පමණ webcast එකක් පැවැත්වෙන අතර, ප්රතිඵල සාකච්ඡා කරනු ඇත. webcast එක සහ නැවත නැරඹීම සමාගමේ investor relations වෙබ් අඩවියෙන් (ir.spacex.com) ලබාගත හැකි අතර, එය X ( @SpaceX ) හි ද සජීවීව විකාශනය කරනු ඇත
(2026 ජුනි IPO එකෙන් පසුව) මෙය SpaceX හි මහජන සමාගමක් ලෙස පළමු ත්රෛමාසික ආදායම් වාර්තාවයි. නිකුතුවෙන් පසුව දින දෙකකට පසුව (2026 අගෝස්තු 6 පමණ) මුල් “early-release eligible” කොටස් මුදාහැරීම්වල පළමු ප්රමාණවත් කොටස අවුලුවනු ඇතැයි අපේක්ෂා කෙරේ (20%) සහ මිල $175 හෝ ඊට ඉහළ නම් අමතර 10% ක්ද ඇත.
---
#USIranTalksToBegin #SPCXBToZero
#SpaceX ( $SPCX ) $SPCXB $SPCX.US
අඟහරුවාදා, 2026 අගෝස්තු 4 දින වෙළඳ අවසන් වීමට පසුව (balance sheet ඇතුළුව) සිය Q2 2026 මූල්ය සහ මෙහෙයුම් ප්රතිඵල නිකුත් කරනු ඇත.
----
ඉලක්කය $180-$199
----
එදිනම CT ප.ව. 3:30 / ET ප.ව. 4:30 ට කළමනාකාරීත්වය සජීවී ශ්රව්ය-පමණ webcast එකක් පැවැත්වෙන අතර, ප්රතිඵල සාකච්ඡා කරනු ඇත. webcast එක සහ නැවත නැරඹීම සමාගමේ investor relations වෙබ් අඩවියෙන් (ir.spacex.com) ලබාගත හැකි අතර, එය X ( @SpaceX ) හි ද සජීවීව විකාශනය කරනු ඇත
(2026 ජුනි IPO එකෙන් පසුව) මෙය SpaceX හි මහජන සමාගමක් ලෙස පළමු ත්රෛමාසික ආදායම් වාර්තාවයි. නිකුතුවෙන් පසුව දින දෙකකට පසුව (2026 අගෝස්තු 6 පමණ) මුල් “early-release eligible” කොටස් මුදාහැරීම්වල පළමු ප්රමාණවත් කොටස අවුලුවනු ඇතැයි අපේක්ෂා කෙරේ (20%) සහ මිල $175 හෝ ඊට ඉහළ නම් අමතර 10% ක්ද ඇත.
---
#USIranTalksToBegin #SPCXBToZero
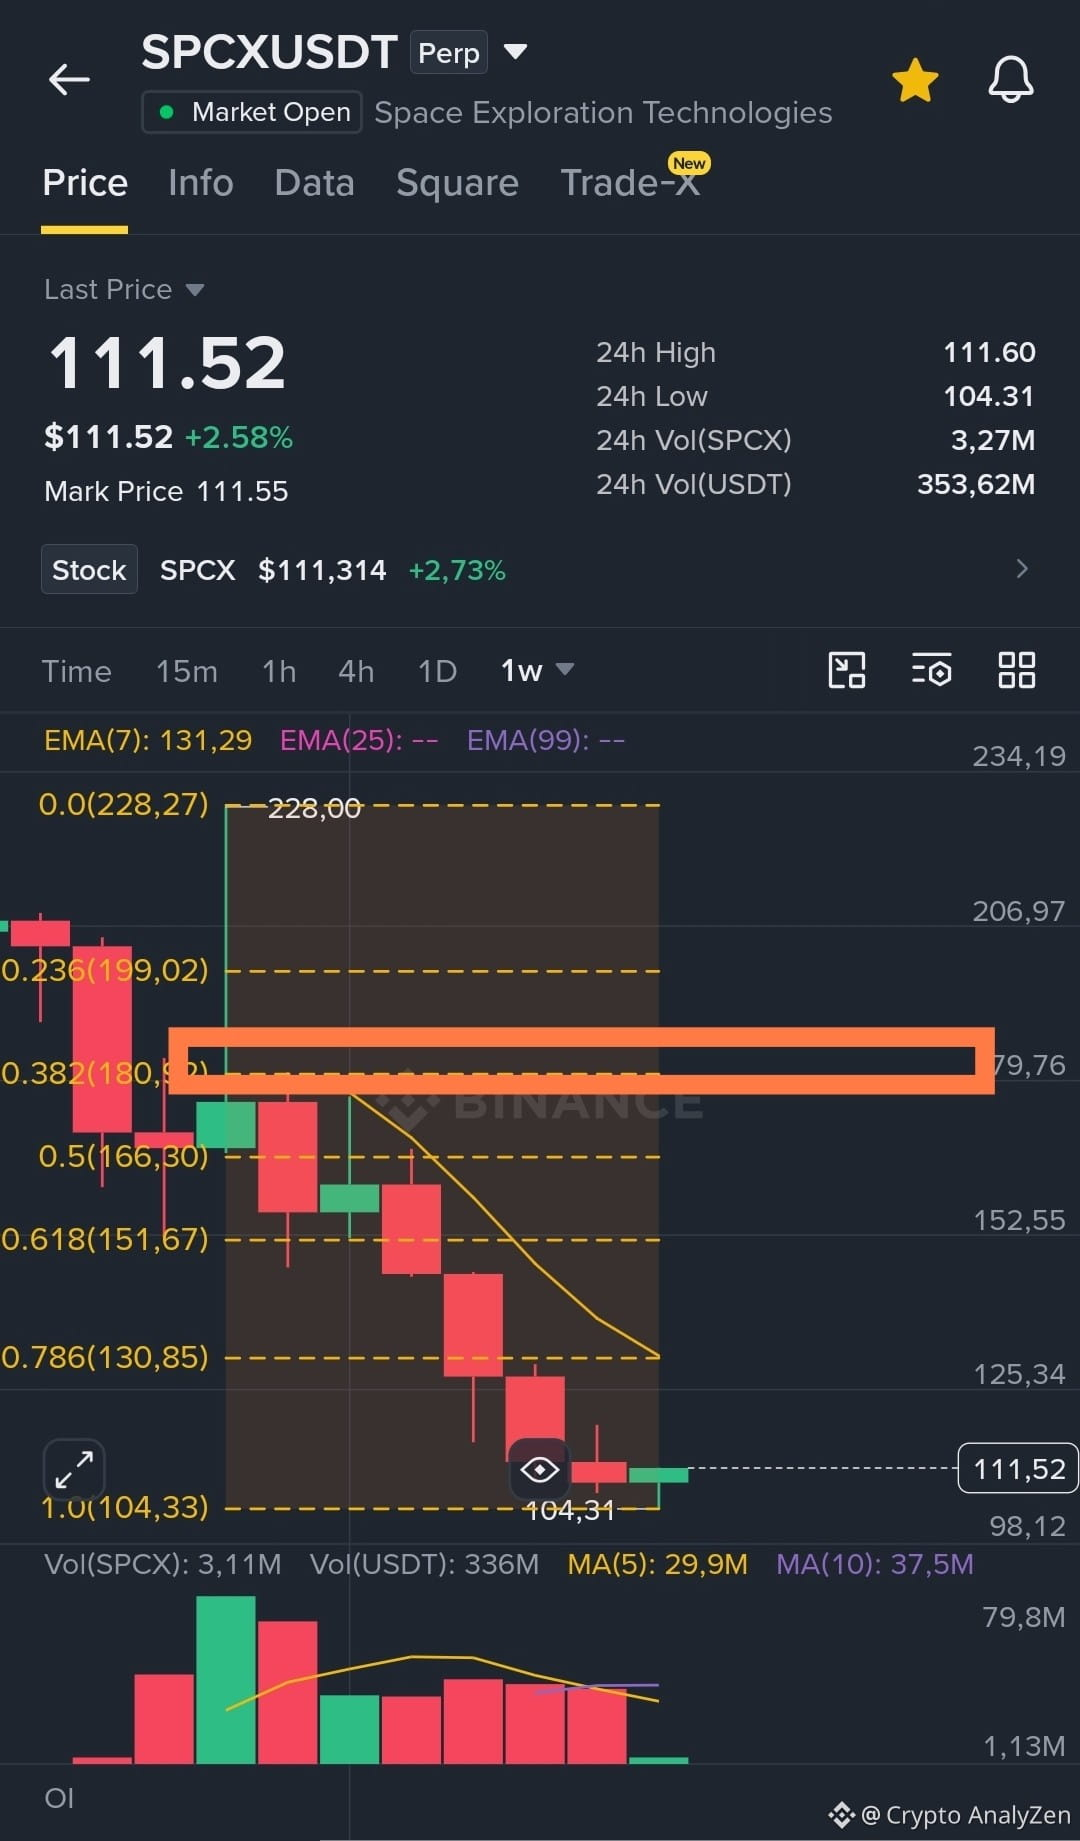
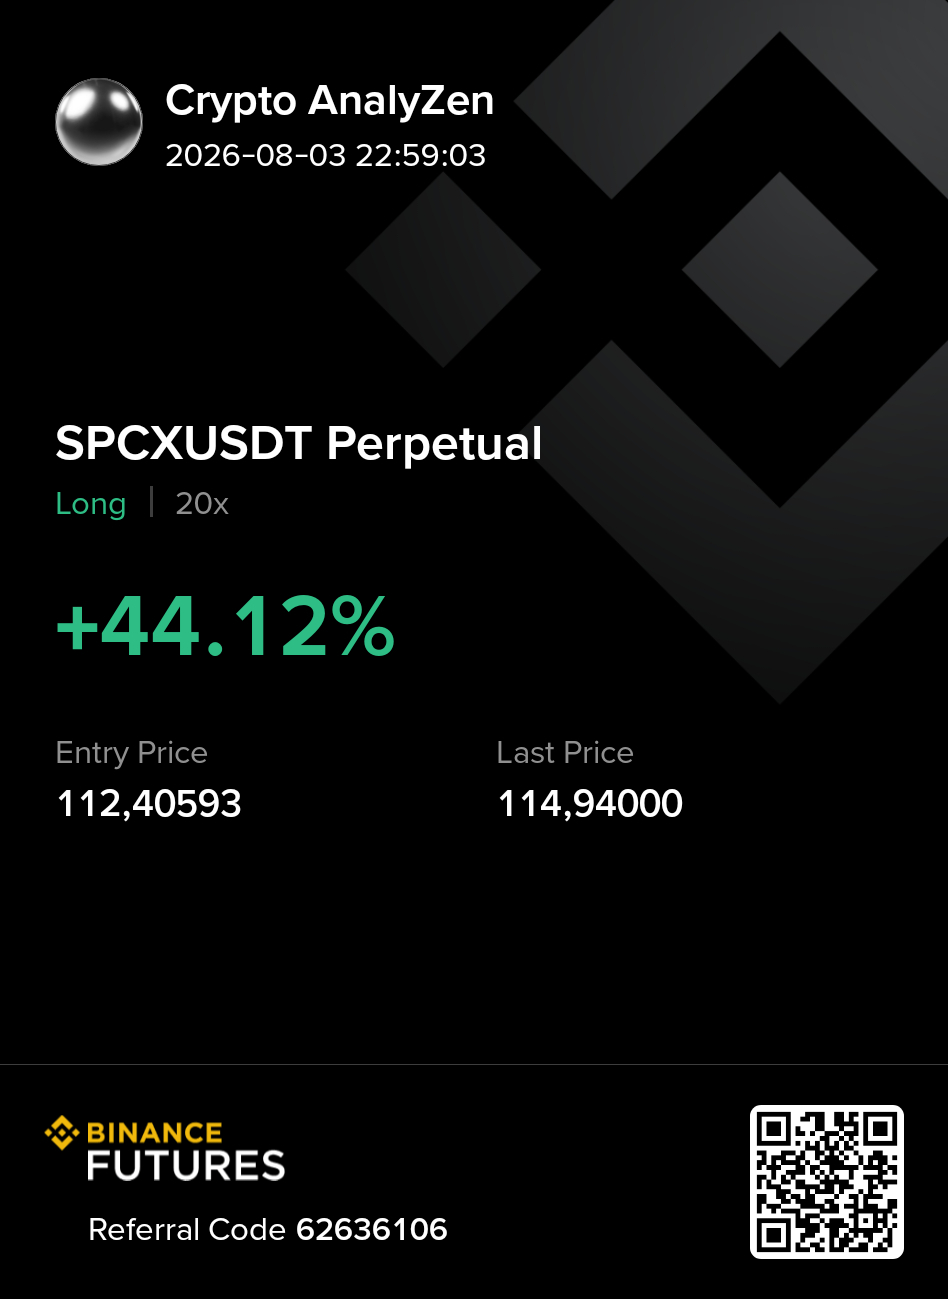
SPCXB-0.93%
SPCXUS+0.27%
1
3
1.1k
·
--
උසබ තත්ත්වය
$SPCX $SPCXB #SpaceX $SPCX.US
ကောင်းသတင်းတွေကို အချိန်မီစတင်လိုက်တာပဲနော် ;)
ဝင်ငွေအစီရင်ခံစာမတိုင်ခင် (သြဂုတ် ၄)
သတိပေးချက်အဖြစ်—ရှယ်ယာစျေးနှုန်းက 175 ထက်ကျော်သွားပါက၊ စီစဉ်ထားတဲ့ 20% အတွင်းပိုင်းရှယ်ယာပိုင်ဆိုင်မှုအပြင် ပြည်သူကို အတွင်းပိုင်းရှယ်ယာများ 10% ကို ထပ်မံထုတ်ပေးမည်ဖြစ်သည်။
{future}(SPCXUSDT)
{spot}(SPCXBUSDT)
{stock_us}(SPCX.US)
$SPCX $SPCXB #SpaceX $SPCX.US
ကောင်းသတင်းတွေကို အချိန်မီစတင်လိုက်တာပဲနော် ;)
ဝင်ငွေအစီရင်ခံစာမတိုင်ခင် (သြဂုတ် ၄)
သတိပေးချက်အဖြစ်—ရှယ်ယာစျေးနှုန်းက 175 ထက်ကျော်သွားပါက၊ စီစဉ်ထားတဲ့ 20% အတွင်းပိုင်းရှယ်ယာပိုင်ဆိုင်မှုအပြင် ပြည်သူကို အတွင်းပိုင်းရှယ်ယာများ 10% ကို ထပ်မံထုတ်ပေးမည်ဖြစ်သည်။
ကောင်းသတင်းတွေကို အချိန်မီစတင်လိုက်တာပဲနော် ;)
ဝင်ငွေအစီရင်ခံစာမတိုင်ခင် (သြဂုတ် ၄)
သတိပေးချက်အဖြစ်—ရှယ်ယာစျေးနှုန်းက 175 ထက်ကျော်သွားပါက၊ စီစဉ်ထားတဲ့ 20% အတွင်းပိုင်းရှယ်ယာပိုင်ဆိုင်မှုအပြင် ပြည်သူကို အတွင်းပိုင်းရှယ်ယာများ 10% ကို ထပ်မံထုတ်ပေးမည်ဖြစ်သည်။


Binance News
·
--
SpaceX විසින් Falcon 9 දියත් කිරීම් 18ක් සඳහා මිලියන 1.6ක ඩොලර් වටිනා එක්සත් ජනපද අභ්යවකාශ බලකා කොන්ත්රාත්තුවක් දිනාගනී
සැපයුම් මූලාශ්රවලට අනුව, SpaceX (SPCX.O) ඇමෙරිකානු අභ්යවකාශ බලකායෙන් (U.S. Space Force) මිලියන 1.6ක් ඩොලර් ප්රමාණයේ කොන්ත්රාත්තුවක් දිනාගෙන තිබේ. එමගින් හමුදා නාවික සන්නිවේදන චන්ද්රිකා සඳහා Falcon 9 දියත් කිරීම් මෙහෙයුම් 18ක් සිදු කිරීමට නියමිතය.
SPCXB-0.93%
SPCXUS+0.27%
2
539
·
--
බෙයාරිෂ්
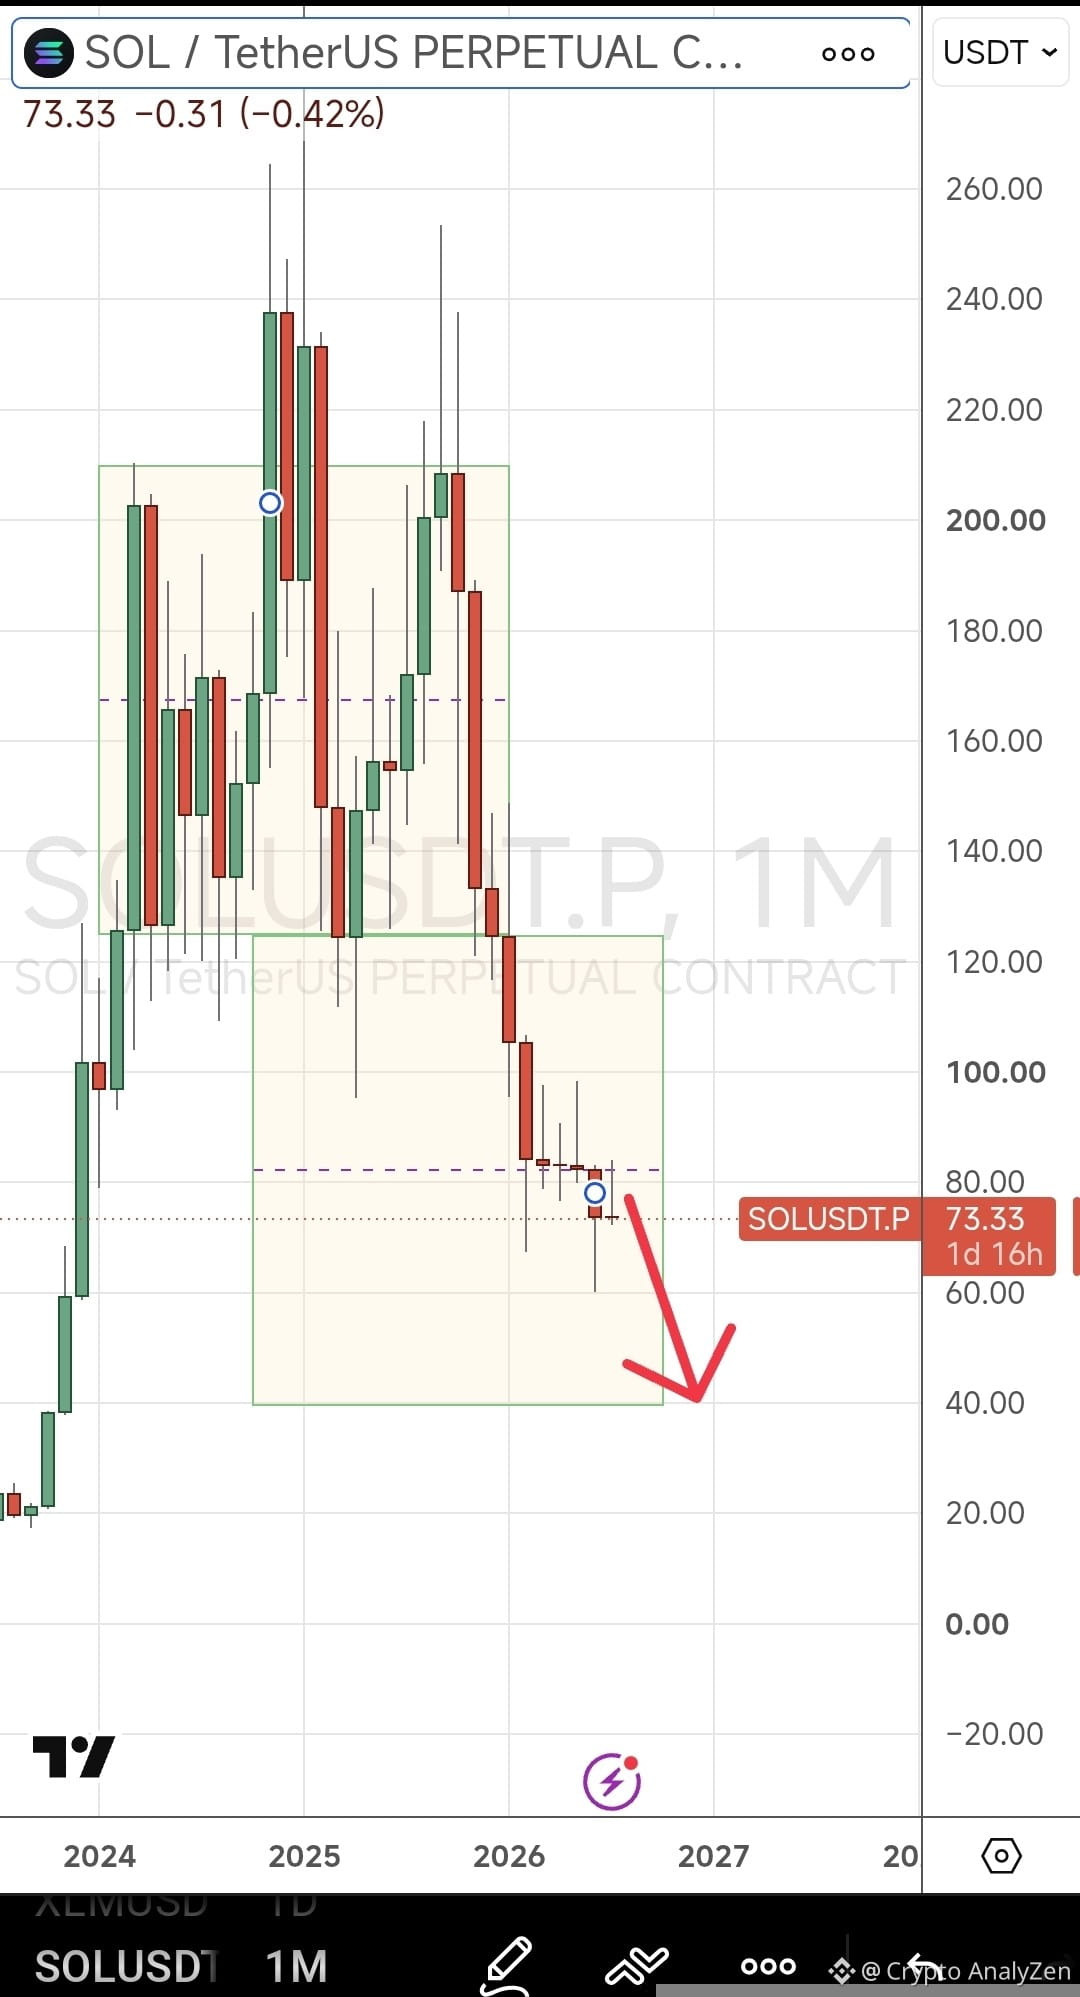
$SOL solana ကိုချစ်တဲ့သူတွေတောင် ဒီအရာကို ကြားချင်ကြတယ် မဟုတ်ဘူး ;)
လစဉ်ဇယားပေါ်မှာ shoulder-head-and-shoulder ပုံစံရဲ့ ပခုံးအပိုင်းအခြမ်းရဲ့ projection က downside လှုပ်ရှားမှုက hတကယ်တော့ မပြီးသေးဘူးဆိုတာကို ညွှန်ပြနေပါတယ်။
စျေးနှုန်းက ဒီအကွာအဝေးရဲ့ အလယ်မှတ်အောက်ကို ရောက်နေပြီး၊ ပြီးခဲ့တဲ့လရဲ့ "လှပတဲ့" candlestick ရှိလင့်ကစား long positions လုပ်ဖို့ အချိန်မတန်သေးပါဘူး။
#FOMCWatching #solana
$SOL solana ကိုချစ်တဲ့သူတွေတောင် ဒီအရာကို ကြားချင်ကြတယ် မဟုတ်ဘူး ;)
လစဉ်ဇယားပေါ်မှာ shoulder-head-and-shoulder ပုံစံရဲ့ ပခုံးအပိုင်းအခြမ်းရဲ့ projection က downside လှုပ်ရှားမှုက hတကယ်တော့ မပြီးသေးဘူးဆိုတာကို ညွှန်ပြနေပါတယ်။
စျေးနှုန်းက ဒီအကွာအဝေးရဲ့ အလယ်မှတ်အောက်ကို ရောက်နေပြီး၊ ပြီးခဲ့တဲ့လရဲ့ "လှပတဲ့" candlestick ရှိလင့်ကစား long positions လုပ်ဖို့ အချိန်မတန်သေးပါဘူး။
#FOMCWatching #solana
လစဉ်ဇယားပေါ်မှာ shoulder-head-and-shoulder ပုံစံရဲ့ ပခုံးအပိုင်းအခြမ်းရဲ့ projection က downside လှုပ်ရှားမှုက hတကယ်တော့ မပြီးသေးဘူးဆိုတာကို ညွှန်ပြနေပါတယ်။
စျေးနှုန်းက ဒီအကွာအဝေးရဲ့ အလယ်မှတ်အောက်ကို ရောက်နေပြီး၊ ပြီးခဲ့တဲ့လရဲ့ "လှပတဲ့" candlestick ရှိလင့်ကစား long positions လုပ်ဖို့ အချိန်မတန်သေးပါဘူး။
#FOMCWatching #solana
3
56
·
--
බෙයාරිෂ්
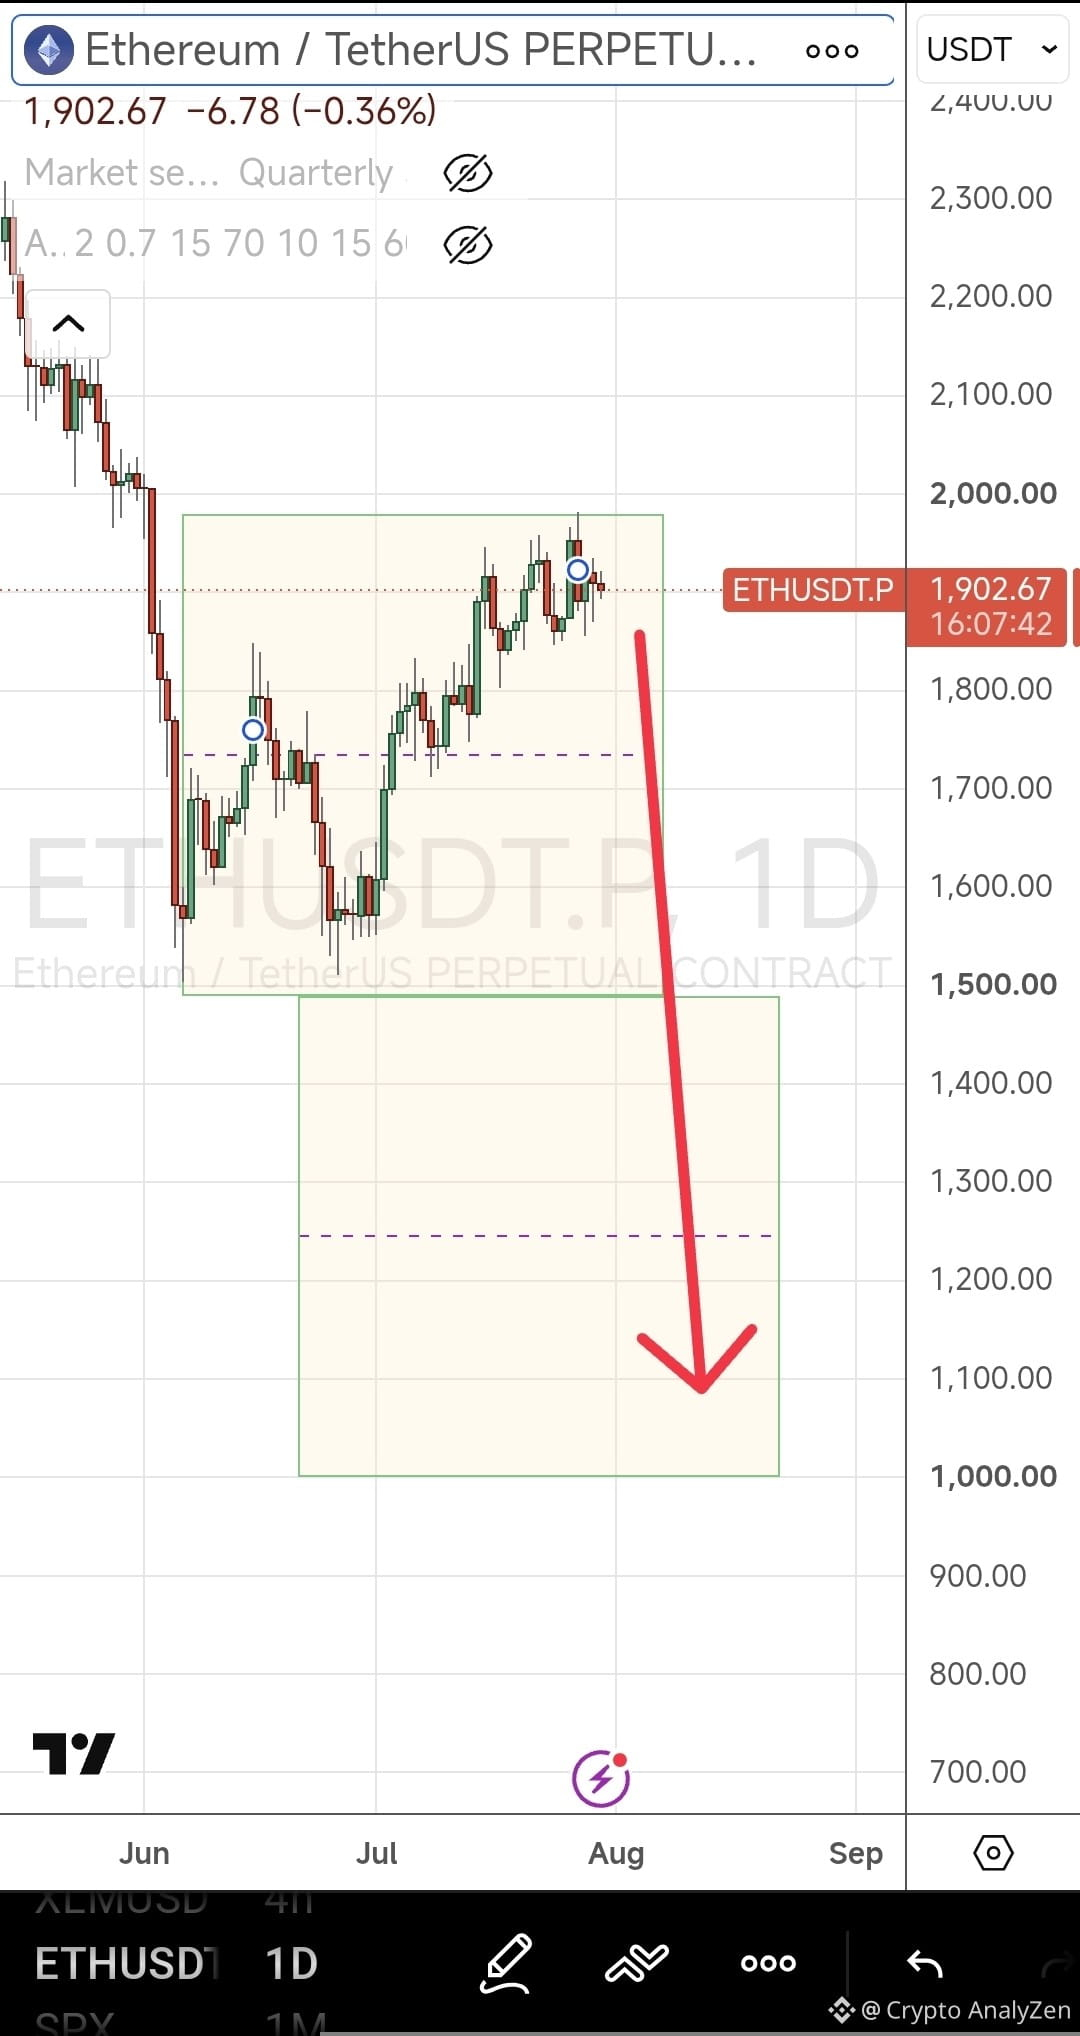
$ETH Nice R:R , don't miss
පසුගිය මාසයේ විවෘත කිරීම මත පරීක්ෂා කළ මිල.
සමස්ත ප්රතිරූපය තවදුරටත් පහත වැටීමකට අනුග්රහ කරයි.
මෙම මාසයේ පරාසයේ පහතට යන ප්රක්ෂේපණය 1,000 මට්ටමට යොමු කරයි.
#FOMCWatching #ETHUSDT
{future}(ETHUSDT)
$ETH Nice R:R , don't miss
පසුගිය මාසයේ විවෘත කිරීම මත පරීක්ෂා කළ මිල.
සමස්ත ප්රතිරූපය තවදුරටත් පහත වැටීමකට අනුග්රහ කරයි.
මෙම මාසයේ පරාසයේ පහතට යන ප්රක්ෂේපණය 1,000 මට්ටමට යොමු කරයි.
#FOMCWatching #ETHUSDT
පසුගිය මාසයේ විවෘත කිරීම මත පරීක්ෂා කළ මිල.
සමස්ත ප්රතිරූපය තවදුරටත් පහත වැටීමකට අනුග්රහ කරයි.
මෙම මාසයේ පරාසයේ පහතට යන ප්රක්ෂේපණය 1,000 මට්ටමට යොමු කරයි.
#FOMCWatching #ETHUSDT
3
89
·
--
බෙයාරිෂ්
පරිවර්තනය බලන්න
#DXY $XAG #Silver #XAGUSTD
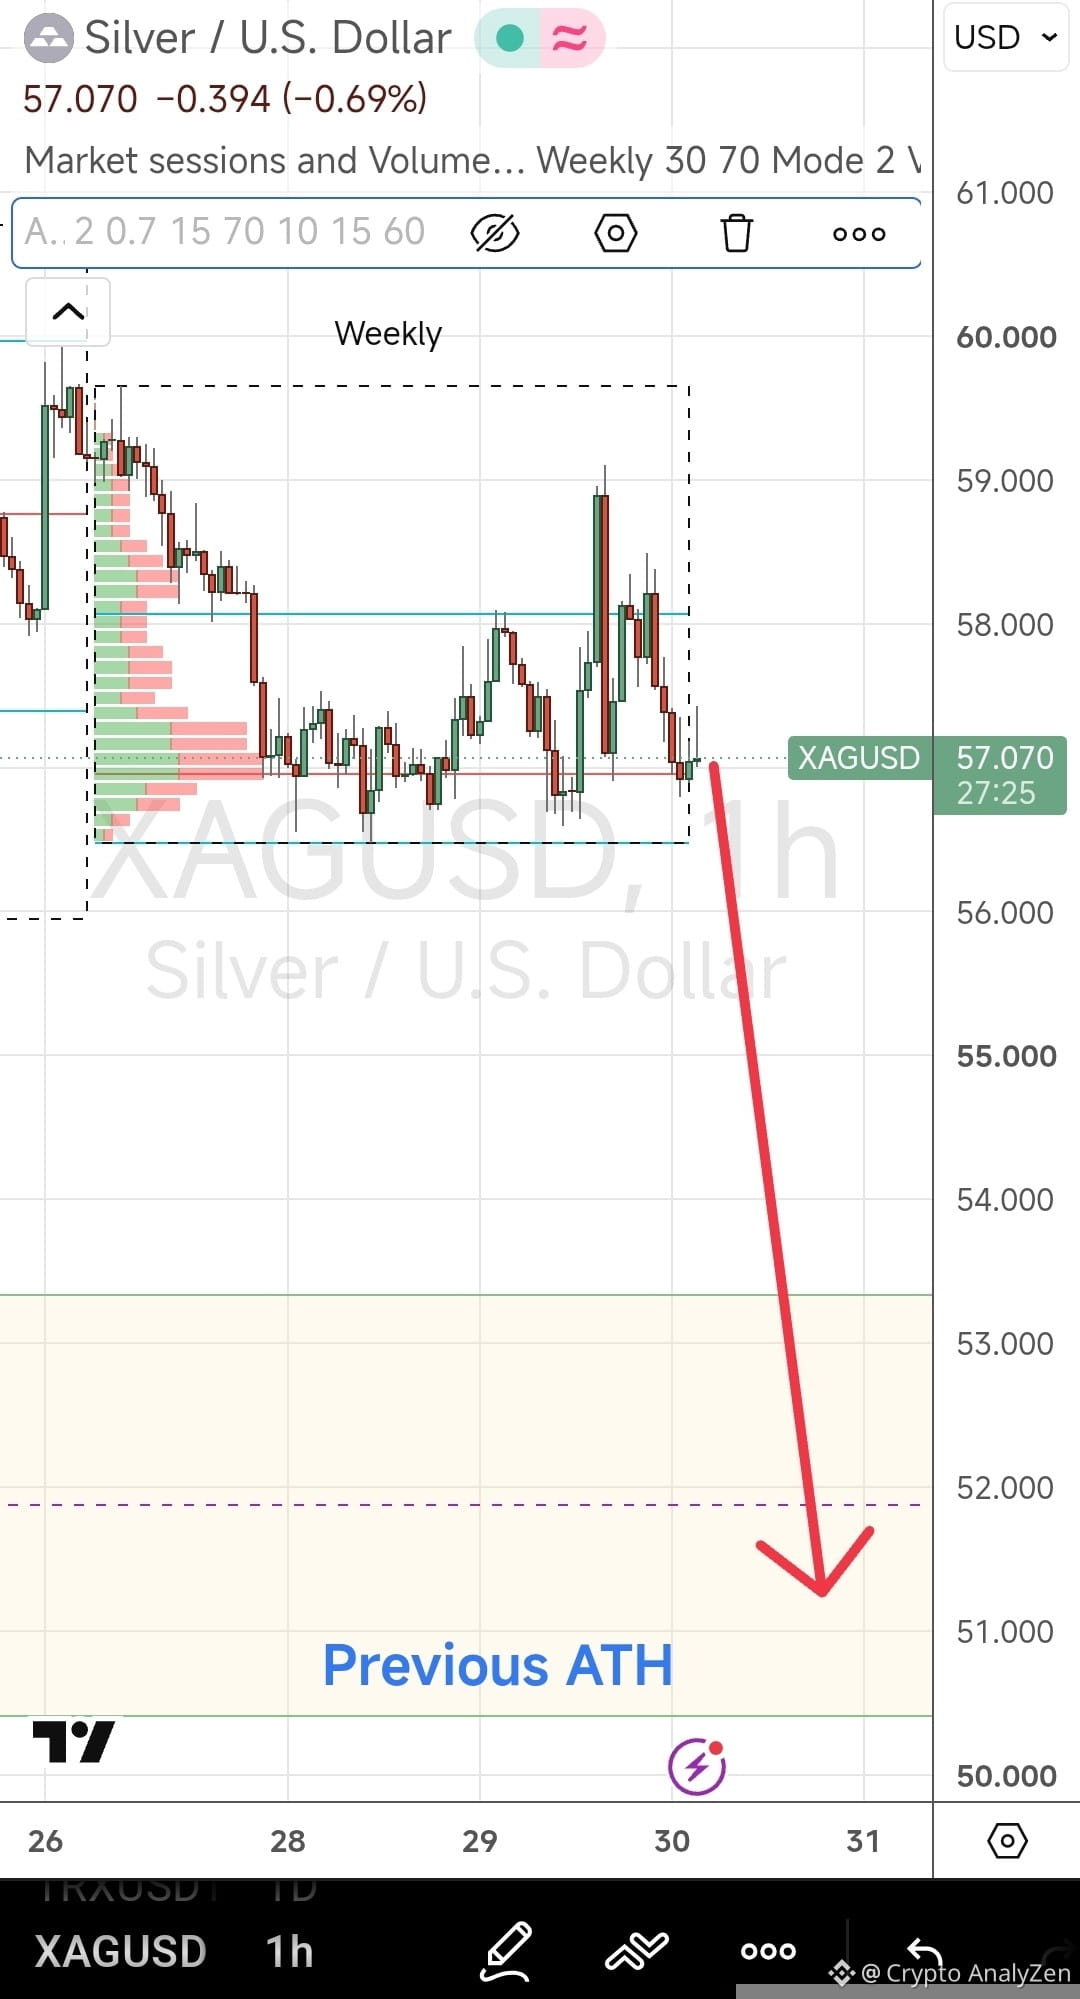
Ahead of the end of the month and the dollar index's upward trend, we can expect to see a continued decline in #GOLD and silver into the designated zone.
The zone itself is notable in that the lower boundary lies at the previous all-time high and corresponds to the 62% Fibonacci range of the upward hype.
{future}(XAUUSDT)
{future}(XAGUSDT)
#DXY $XAG #Silver #XAGUSTD
Ahead of the end of the month and the dollar index's upward trend, we can expect to see a continued decline in #GOLD and silver into the designated zone.
The zone itself is notable in that the lower boundary lies at the previous all-time high and corresponds to the 62% Fibonacci range of the upward hype.
Ahead of the end of the month and the dollar index's upward trend, we can expect to see a continued decline in #GOLD and silver into the designated zone.
The zone itself is notable in that the lower boundary lies at the previous all-time high and corresponds to the 62% Fibonacci range of the upward hype.
1
142
·
--
උසබ තත්ත්වය
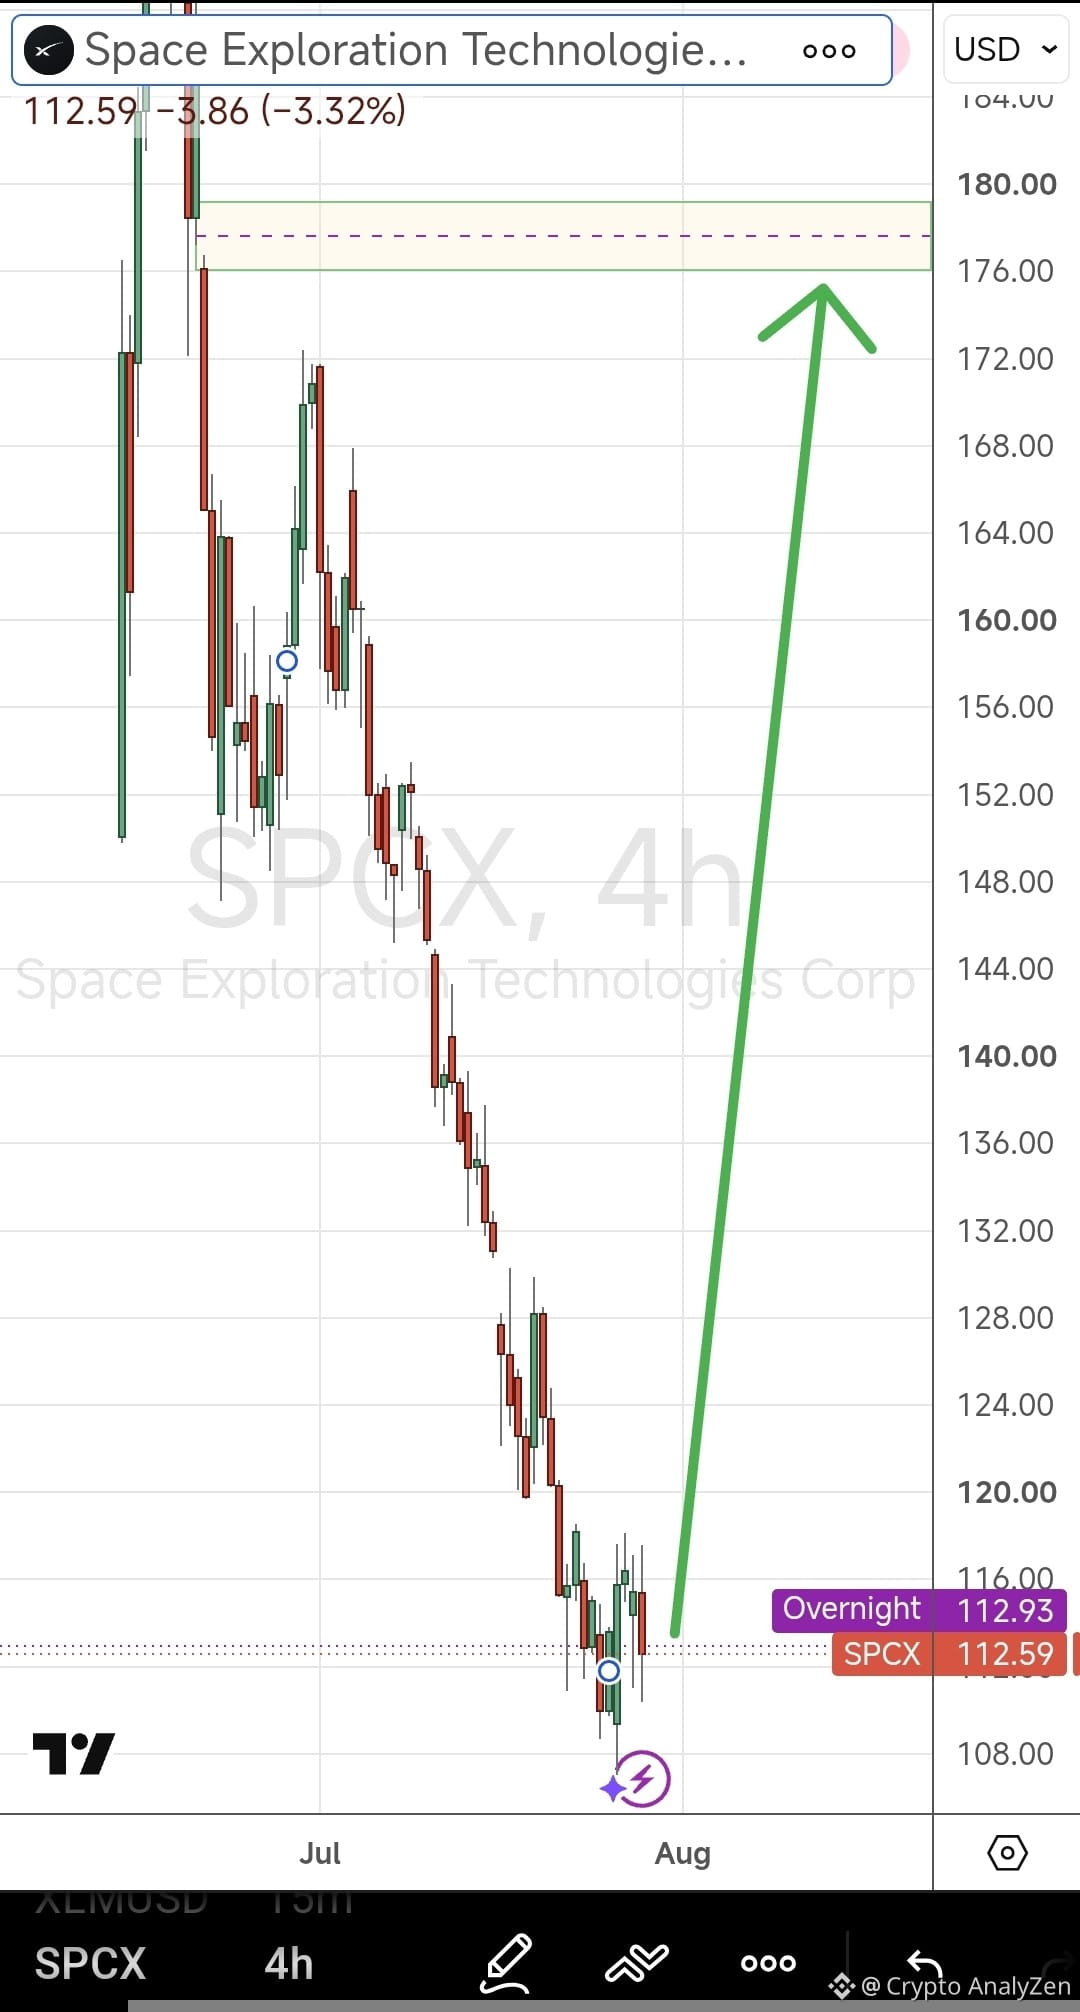
#SpaceX ( $SPCX ) $SPCXB $SPCX.US သည် 2026 ခုနှစ် သြဂုတ်လ ၄ ရက်၊ အင်္ဂါနေ့တွင် စျေးကွက်ပိတ်ချိန်အပြီး ၎င်း၏ Q2 2026 ဘဏ္ဍာရေးနှင့် လုပ်ငန်းလည်ပတ်မှုဆိုင်ရာ ရလဒ်များ (လက်ကျန်ရှင်းတမ်း အပါအဝင်) ကို ထုတ်ပြန်မည်ဖြစ်သည်။
စီမံခန့်ခွဲမှုအဖွဲ့သည် ရလဒ်များကို ဆွေးနွေးရန် တူညီသောနေ့တွင် ညနေ ၃:၃၀ နာရီ CT / ညနေ ၄:၃၀ နာရီ ET တွင် အသံတင်သာ လိုက်လံနားဆင်နိုင်သည့် တိုက်ရိုက် webcast တစ်ခုကို လက်ခံကျင်းပမည်ဖြစ်သည်။ webcast နှင့် replay များကို ကုမ္ပဏီ၏ ရင်းနှီးမြှုပ်နှံသူဆက်ဆံရေး ဝက်ဘ်ဆိုဒ် (ir.spacex.com) တွင် ရရှိနိုင်ပြီး X (@SpaceX) တွင်လည်း တိုက်ရိုက်ထုတ်လွှင့်မည်ဖြစ်သည်။
ဤသည် SpaceX ၏ ပြည်သူသို့ စတင်ထုတ်ပြန်သည့် အများပြည်သူကုမ္ပဏီအဖြစ် ပထမဆုံး သုံးလပတ် အမြတ်အစွန်းအစီရင်ခံစာဖြစ်သည် (၎င်း၏ ၂၀၂၆ ခုနှစ် ဇွန်လ IPO နောက်ပိုင်း)။ ထုတ်ပြန်ချက်သည် နှစ်ရက်အကြာတွင် အစောထုတ်ပေးမှု eligible share unlocks များ၏ ပထမအကြီးဆုံး အပိုင်းကို လှုံ့ဆော်ပေးနိုင်မည်ဟု မျှော်လင့်ရပြီး (သြဂုတ် ၆ ခန့်) (၂၀%) ဖြစ်ကာ၊ စျေးနှုန်းသည် ဒေါ်လာ ၁၇၅ သို့မဟုတ် ထက်ပိုမိုမြင့်မားပါက ထပ်တိုး ၁၀% လည်း ရနိုင်သည်။
---
ပစ်မှတ် $175
{future}(SPCXUSDT)
{stock_us}(SPCX.US)
{spot}(SPCXBUSDT)
#SpaceX ( $SPCX ) $SPCXB $SPCX.US သည် 2026 ခုနှစ် သြဂုတ်လ ၄ ရက်၊ အင်္ဂါနေ့တွင် စျေးကွက်ပိတ်ချိန်အပြီး ၎င်း၏ Q2 2026 ဘဏ္ဍာရေးနှင့် လုပ်ငန်းလည်ပတ်မှုဆိုင်ရာ ရလဒ်များ (လက်ကျန်ရှင်းတမ်း အပါအဝင်) ကို ထုတ်ပြန်မည်ဖြစ်သည်။
စီမံခန့်ခွဲမှုအဖွဲ့သည် ရလဒ်များကို ဆွေးနွေးရန် တူညီသောနေ့တွင် ညနေ ၃:၃၀ နာရီ CT / ညနေ ၄:၃၀ နာရီ ET တွင် အသံတင်သာ လိုက်လံနားဆင်နိုင်သည့် တိုက်ရိုက် webcast တစ်ခုကို လက်ခံကျင်းပမည်ဖြစ်သည်။ webcast နှင့် replay များကို ကုမ္ပဏီ၏ ရင်းနှီးမြှုပ်နှံသူဆက်ဆံရေး ဝက်ဘ်ဆိုဒ် (ir.spacex.com) တွင် ရရှိနိုင်ပြီး X (@SpaceX) တွင်လည်း တိုက်ရိုက်ထုတ်လွှင့်မည်ဖြစ်သည်။
ဤသည် SpaceX ၏ ပြည်သူသို့ စတင်ထုတ်ပြန်သည့် အများပြည်သူကုမ္ပဏီအဖြစ် ပထမဆုံး သုံးလပတ် အမြတ်အစွန်းအစီရင်ခံစာဖြစ်သည် (၎င်း၏ ၂၀၂၆ ခုနှစ် ဇွန်လ IPO နောက်ပိုင်း)။ ထုတ်ပြန်ချက်သည် နှစ်ရက်အကြာတွင် အစောထုတ်ပေးမှု eligible share unlocks များ၏ ပထမအကြီးဆုံး အပိုင်းကို လှုံ့ဆော်ပေးနိုင်မည်ဟု မျှော်လင့်ရပြီး (သြဂုတ် ၆ ခန့်) (၂၀%) ဖြစ်ကာ၊ စျေးနှုန်းသည် ဒေါ်လာ ၁၇၅ သို့မဟုတ် ထက်ပိုမိုမြင့်မားပါက ထပ်တိုး ၁၀% လည်း ရနိုင်သည်။
---
ပစ်မှတ် $175
စီမံခန့်ခွဲမှုအဖွဲ့သည် ရလဒ်များကို ဆွေးနွေးရန် တူညီသောနေ့တွင် ညနေ ၃:၃၀ နာရီ CT / ညနေ ၄:၃၀ နာရီ ET တွင် အသံတင်သာ လိုက်လံနားဆင်နိုင်သည့် တိုက်ရိုက် webcast တစ်ခုကို လက်ခံကျင်းပမည်ဖြစ်သည်။ webcast နှင့် replay များကို ကုမ္ပဏီ၏ ရင်းနှီးမြှုပ်နှံသူဆက်ဆံရေး ဝက်ဘ်ဆိုဒ် (ir.spacex.com) တွင် ရရှိနိုင်ပြီး X (@SpaceX) တွင်လည်း တိုက်ရိုက်ထုတ်လွှင့်မည်ဖြစ်သည်။
ဤသည် SpaceX ၏ ပြည်သူသို့ စတင်ထုတ်ပြန်သည့် အများပြည်သူကုမ္ပဏီအဖြစ် ပထမဆုံး သုံးလပတ် အမြတ်အစွန်းအစီရင်ခံစာဖြစ်သည် (၎င်း၏ ၂၀၂၆ ခုနှစ် ဇွန်လ IPO နောက်ပိုင်း)။ ထုတ်ပြန်ချက်သည် နှစ်ရက်အကြာတွင် အစောထုတ်ပေးမှု eligible share unlocks များ၏ ပထမအကြီးဆုံး အပိုင်းကို လှုံ့ဆော်ပေးနိုင်မည်ဟု မျှော်လင့်ရပြီး (သြဂုတ် ၆ ခန့်) (၂၀%) ဖြစ်ကာ၊ စျေးနှုန်းသည် ဒေါ်လာ ၁၇၅ သို့မဟုတ် ထက်ပိုမိုမြင့်မားပါက ထပ်တိုး ၁၀% လည်း ရနိုင်သည်။
---
ပစ်မှတ် $175
2
245
·
--
උසබ තත්ත්වය
$SPCX $SPCXB $SPCX.US #SpaceX #SPCXUSDT
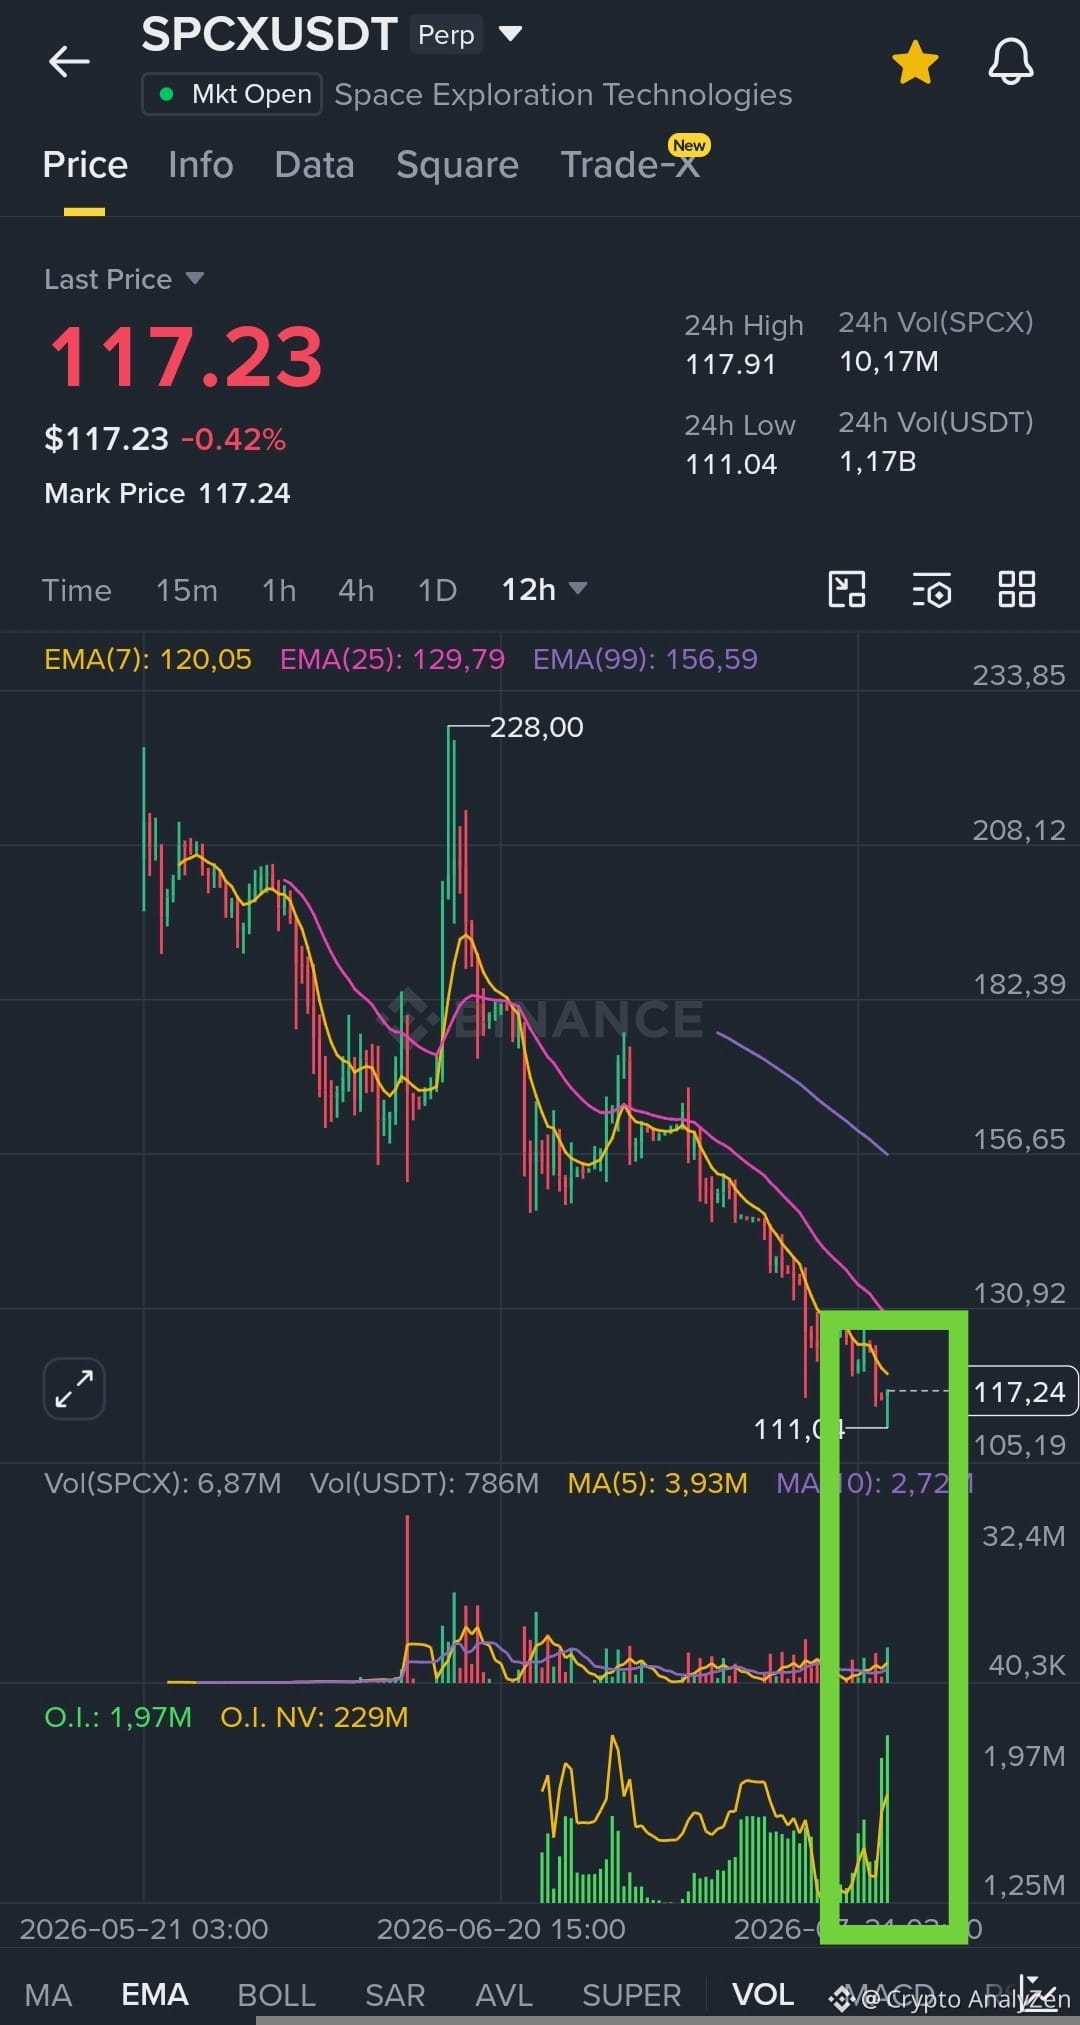
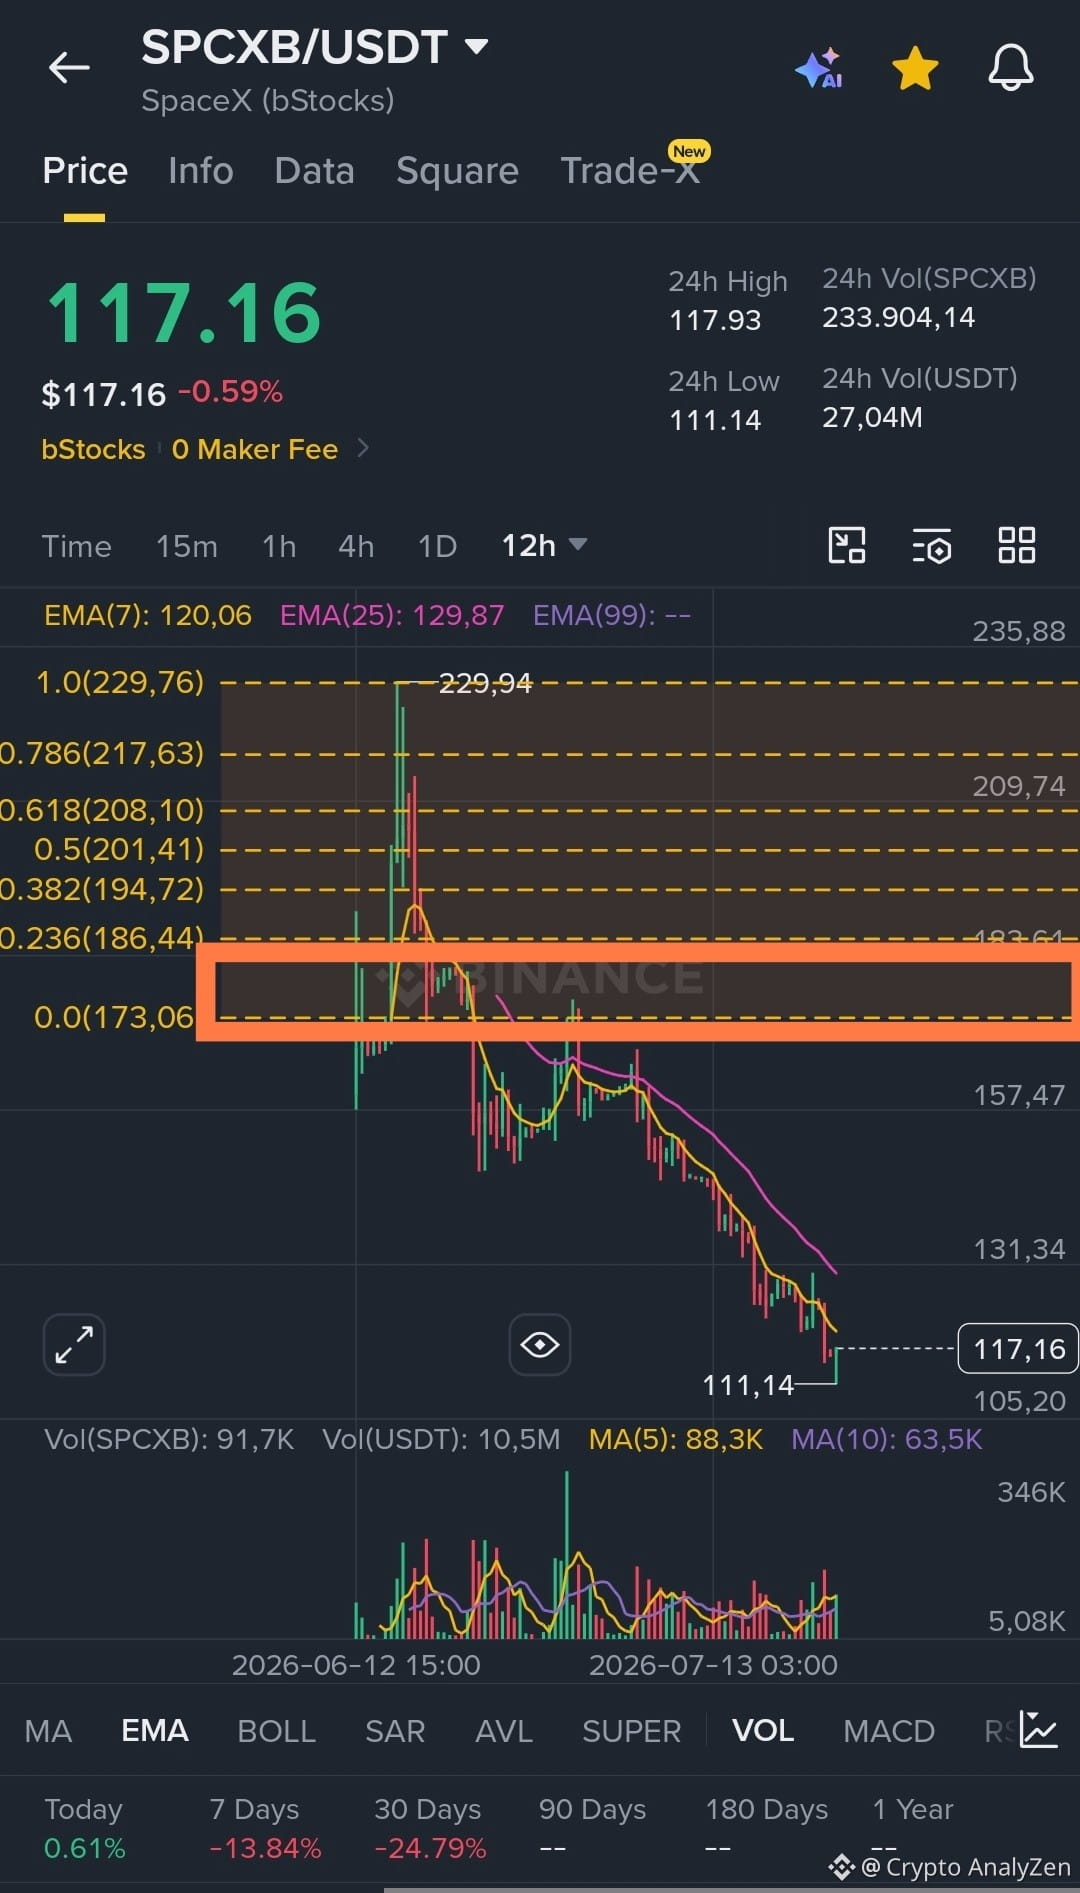
လာမည့် շաբաթများ၏ ඉලක්කය ≥$175.50
ඇයි?
---
2026 Q2 ආදායම් වාර්තා කිරීමෙන් පසු (2026 ජූලි අග සිට අගෝස්තු මුල් දක්වා අපේක්ෂිත) - සුදුසුකම් ලැබූ ඉන්සයිඩර් කොටස්වලින් 20%ක් දක්වා නිදහස් වේ.
🔥 කොටස $175.50ට (IPO මිලට වඩා 30%ක් ඉහළ) හෝ ඊට වැඩි ලෙස අදාළ ආදායම් වාර්තා වටා ඇති 10ක් අතරිනි වෙළඳ දිනයන් 5ක් තුළ ගනුදෙනු කරන්නේ නම් අමතර 10%ක්.
මිල පහළ යන විට ස්පොට් සහ ෆියුචර්ස් වල open interest වැඩිවීම සැලකිල්ලට ගන්න - මෙයින් වැඩි ලෝන්ග්ස් පටවමින් සිටින බව පෙන්නුම් කරයි.
{future}(SPCXUSDT)
{spot}(SPCXBUSDT)
{stock_us}(SPCX.US)
$SPCX $SPCXB $SPCX.US #SpaceX #SPCXUSDT
လာမည့် շաբաթများ၏ ඉලක්කය ≥$175.50
ඇයි?
---
2026 Q2 ආදායම් වාර්තා කිරීමෙන් පසු (2026 ජූලි අග සිට අගෝස්තු මුල් දක්වා අපේක්ෂිත) - සුදුසුකම් ලැබූ ඉන්සයිඩර් කොටස්වලින් 20%ක් දක්වා නිදහස් වේ.
🔥 කොටස $175.50ට (IPO මිලට වඩා 30%ක් ඉහළ) හෝ ඊට වැඩි ලෙස අදාළ ආදායම් වාර්තා වටා ඇති 10ක් අතරිනි වෙළඳ දිනයන් 5ක් තුළ ගනුදෙනු කරන්නේ නම් අමතර 10%ක්.
මිල පහළ යන විට ස්පොට් සහ ෆියුචර්ස් වල open interest වැඩිවීම සැලකිල්ලට ගන්න - මෙයින් වැඩි ලෝන්ග්ස් පටවමින් සිටින බව පෙන්නුම් කරයි.
လာမည့် շաբաթများ၏ ඉලක්කය ≥$175.50
ඇයි?
---
2026 Q2 ආදායම් වාර්තා කිරීමෙන් පසු (2026 ජූලි අග සිට අගෝස්තු මුල් දක්වා අපේක්ෂිත) - සුදුසුකම් ලැබූ ඉන්සයිඩර් කොටස්වලින් 20%ක් දක්වා නිදහස් වේ.
🔥 කොටස $175.50ට (IPO මිලට වඩා 30%ක් ඉහළ) හෝ ඊට වැඩි ලෙස අදාළ ආදායම් වාර්තා වටා ඇති 10ක් අතරිනි වෙළඳ දිනයන් 5ක් තුළ ගනුදෙනු කරන්නේ නම් අමතර 10%ක්.
මිල පහළ යන විට ස්පොට් සහ ෆියුචර්ස් වල open interest වැඩිවීම සැලකිල්ලට ගන්න - මෙයින් වැඩි ලෝන්ග්ස් පටවමින් සිටින බව පෙන්නුම් කරයි.
2
1
747
·
--
උසබ තත්ත්වය
$BTC #bitcoin
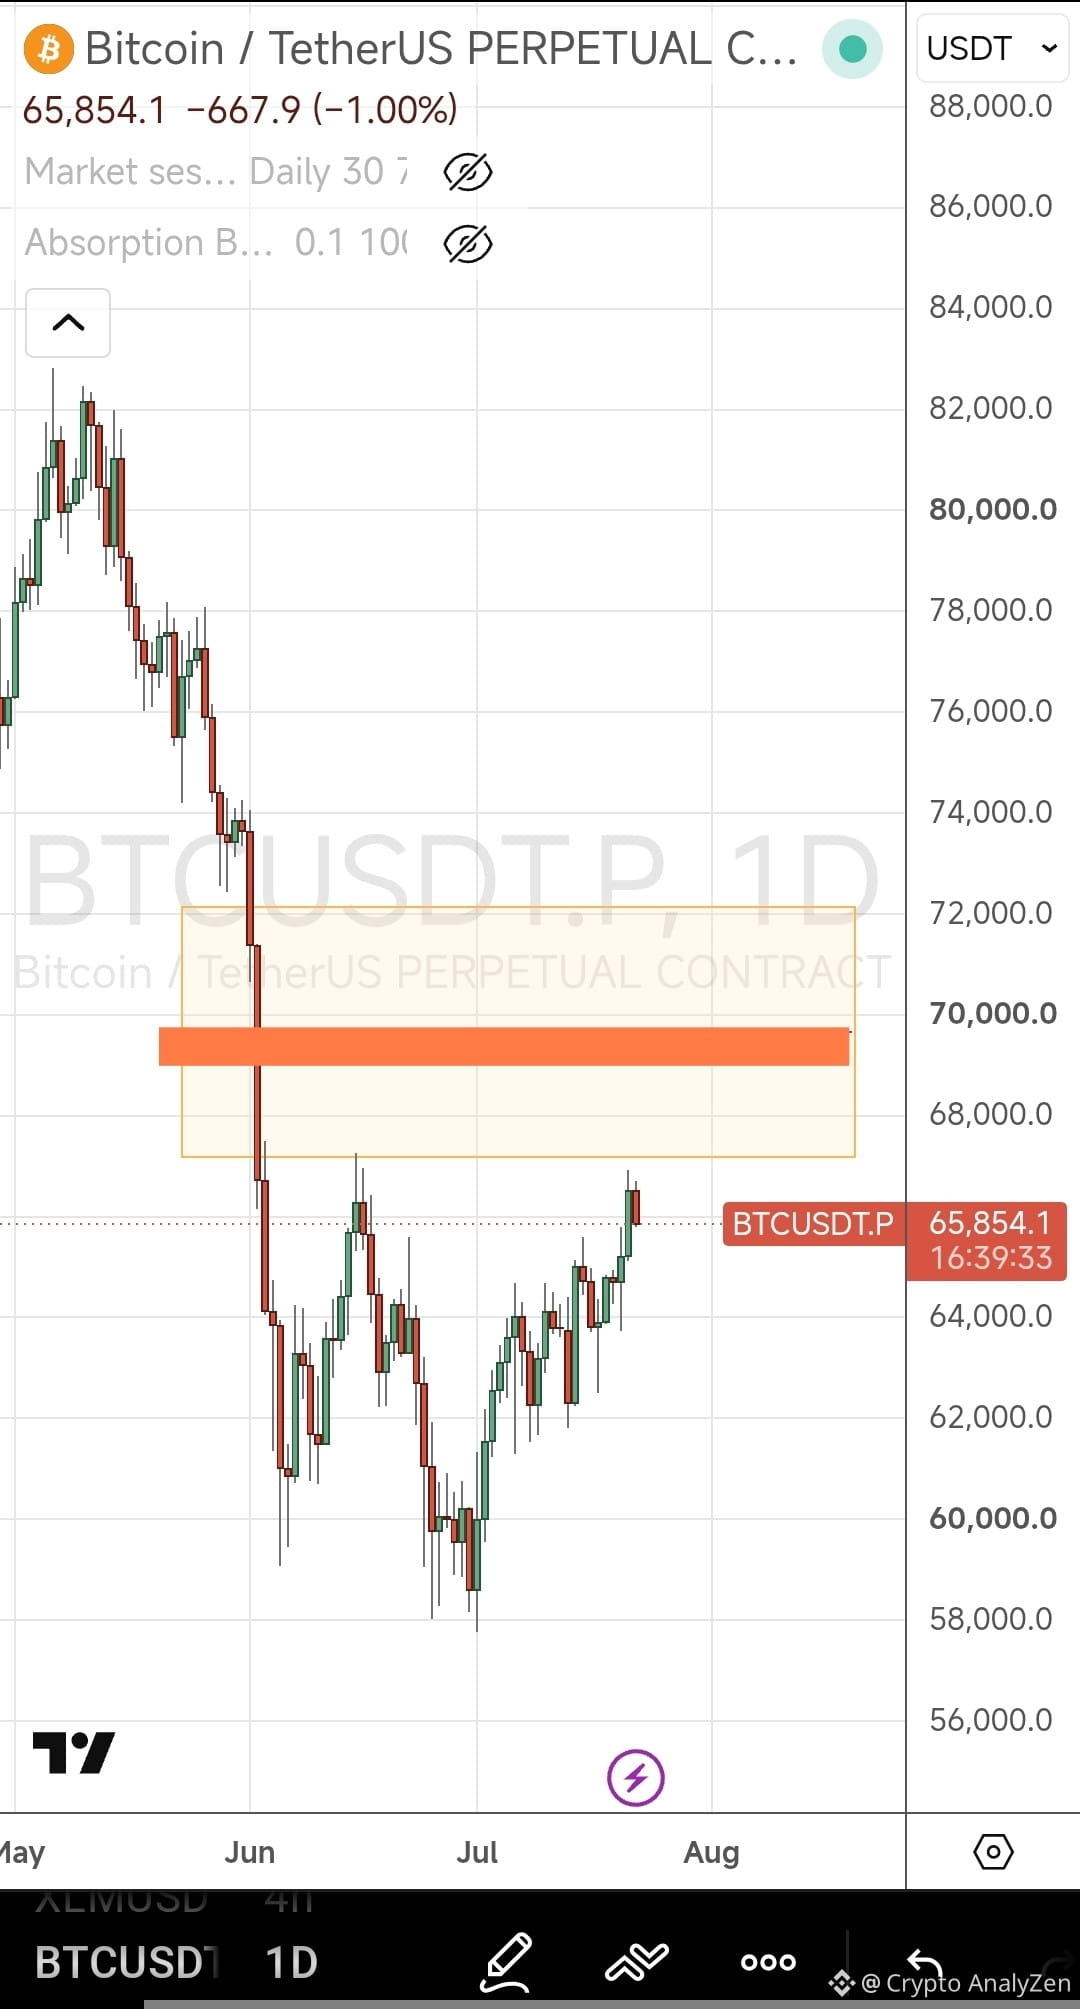
-67k-72k အတွင်းရှိ gap ကို ဖြည့်ရန် ဆက်လက် တက်သွားနိုင်မည့် မြင့်မားသော အလားအလာ
gap အလယ်ပိုင်းက 69k-70k ဝန်းကျင်
စျေးနှုန်းက gap အလယ်မှာ ရပ်သွားမယ်ဆိုရင် အသစ်သော အနိမ့်ဆုံးအသစ်ကို ရှာဖွေရန် အောက်ဘက်သို့ လျင်မြန်စွာ ကျဆင်းမယ်လို့ မျှော်လင့်တယ်
ဒီကိစ္စမှာ high time frame ရဲ့ projection နဲ့ Fibonacci retracement က 47k ဆိုတဲ့ အဆင့်ကို ညွှန်ပြနေပါတယ်
{future}(DOGEUSDT)
{future}(AVAXUSDT)
#BitcoinDunyamiz
#BTCUSDT
{future}(BTCUSDT)
$BTC #bitcoin
-67k-72k အတွင်းရှိ gap ကို ဖြည့်ရန် ဆက်လက် တက်သွားနိုင်မည့် မြင့်မားသော အလားအလာ
gap အလယ်ပိုင်းက 69k-70k ဝန်းကျင်
စျေးနှုန်းက gap အလယ်မှာ ရပ်သွားမယ်ဆိုရင် အသစ်သော အနိမ့်ဆုံးအသစ်ကို ရှာဖွေရန် အောက်ဘက်သို့ လျင်မြန်စွာ ကျဆင်းမယ်လို့ မျှော်လင့်တယ်
ဒီကိစ္စမှာ high time frame ရဲ့ projection နဲ့ Fibonacci retracement က 47k ဆိုတဲ့ အဆင့်ကို ညွှန်ပြနေပါတယ်
#BitcoinDunyamiz
#BTCUSDT
-67k-72k အတွင်းရှိ gap ကို ဖြည့်ရန် ဆက်လက် တက်သွားနိုင်မည့် မြင့်မားသော အလားအလာ
gap အလယ်ပိုင်းက 69k-70k ဝန်းကျင်
စျေးနှုန်းက gap အလယ်မှာ ရပ်သွားမယ်ဆိုရင် အသစ်သော အနိမ့်ဆုံးအသစ်ကို ရှာဖွေရန် အောက်ဘက်သို့ လျင်မြန်စွာ ကျဆင်းမယ်လို့ မျှော်လင့်တယ်
ဒီကိစ္စမှာ high time frame ရဲ့ projection နဲ့ Fibonacci retracement က 47k ဆိုတဲ့ အဆင့်ကို ညွှန်ပြနေပါတယ်
#BitcoinDunyamiz
#BTCUSDT
1
2
158
·
--
උසබ තත්ත්වය
$SPCX $SPCX $SPCX.US #SpaceX
අපි හඳට යනවා ;)
අමතක නොකරන්න. . . ඊළඟට ≥$175.50
පළමු වැදගත් නිදහස් කිරීම:
2026 Q2 මූල්ය ප්රකාශනයෙන් පසු (අනුමානව 2026 ජූලි මැද-අග සිට අගෝස්තු මුල දක්වා). - සුදුසුකම් ලත් අභ්යන්තර කොටස් වලින් උපරිම 20% නිදහස් වෙයි.
!!! කොටස් මිල ≥$175.50 (IPO මිලට වඩා 30% වැඩි) ලෙස earnings වටා ඇති 10 ව්යාපාරික දින වලින් 5 දිනක් සඳහා ගනුදෙනු වුණොත් අමතර 10%.
#TradebStock #MarketSentimentToday
{spot}(SPCXBUSDT)
{future}(SPCXUSDT)
{stock_us}(SPCX.US)
$SPCX $SPCX $SPCX.US #SpaceX
අපි හඳට යනවා ;)
අමතක නොකරන්න. . . ඊළඟට ≥$175.50
පළමු වැදගත් නිදහස් කිරීම:
2026 Q2 මූල්ය ප්රකාශනයෙන් පසු (අනුමානව 2026 ජූලි මැද-අග සිට අගෝස්තු මුල දක්වා). - සුදුසුකම් ලත් අභ්යන්තර කොටස් වලින් උපරිම 20% නිදහස් වෙයි.
!!! කොටස් මිල ≥$175.50 (IPO මිලට වඩා 30% වැඩි) ලෙස earnings වටා ඇති 10 ව්යාපාරික දින වලින් 5 දිනක් සඳහා ගනුදෙනු වුණොත් අමතර 10%.
#TradebStock #MarketSentimentToday
අපි හඳට යනවා ;)
අමතක නොකරන්න. . . ඊළඟට ≥$175.50
පළමු වැදගත් නිදහස් කිරීම:
2026 Q2 මූල්ය ප්රකාශනයෙන් පසු (අනුමානව 2026 ජූලි මැද-අග සිට අගෝස්තු මුල දක්වා). - සුදුසුකම් ලත් අභ්යන්තර කොටස් වලින් උපරිම 20% නිදහස් වෙයි.
!!! කොටස් මිල ≥$175.50 (IPO මිලට වඩා 30% වැඩි) ලෙස earnings වටා ඇති 10 ව්යාපාරික දින වලින් 5 දිනක් සඳහා ගනුදෙනු වුණොත් අමතර 10%.
#TradebStock #MarketSentimentToday
Crypto AnalyZen
·
--
උසබ තත්ත්වය$SPCX $SPCXB #SpaceX
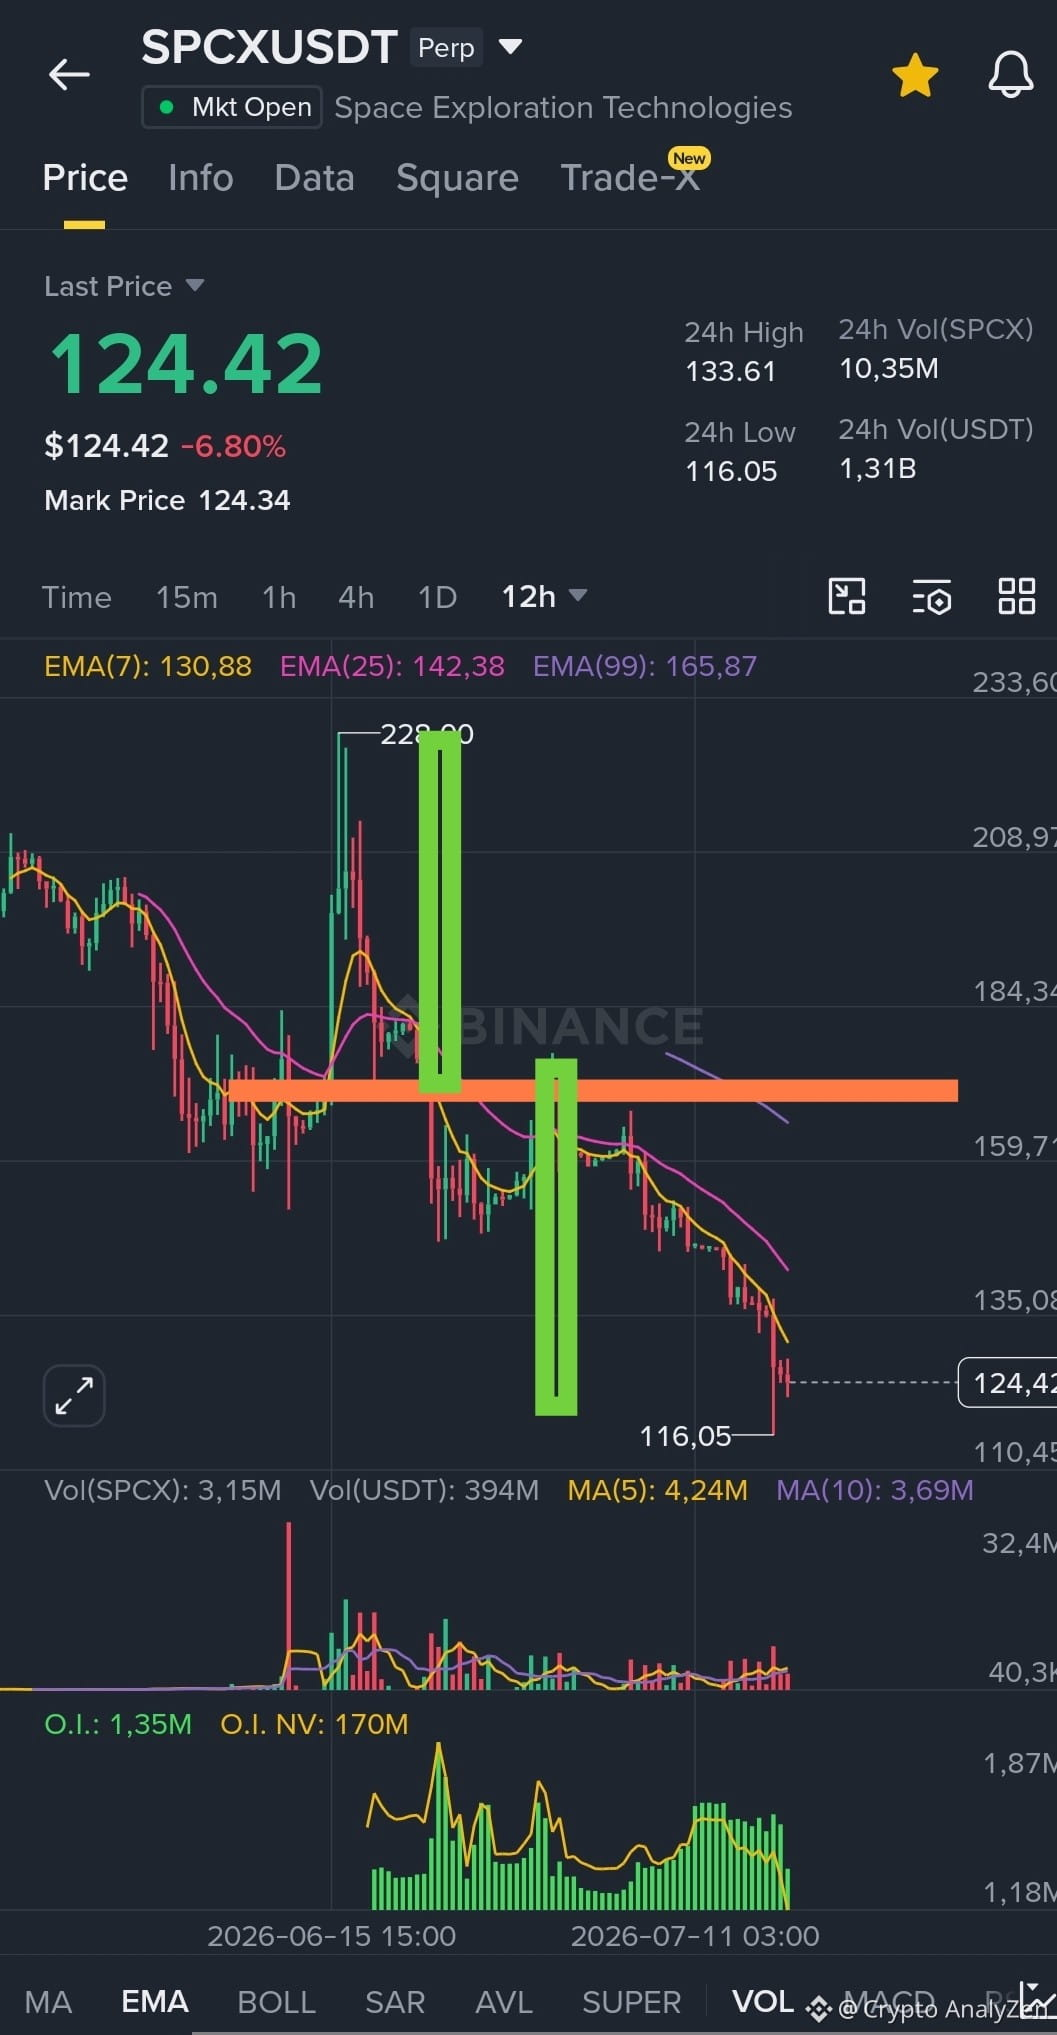
Nasdaq ප්රස්ථාරය
මිල පෙර වෙළඳපොළ ගැප් එක පුරවන්නට ඉහළට තල්ලු කර පසුගිය සතියේ විවෘත මට්ටමට පහළට වැටුණා.
201 දක්වා නැවතත් ඉහළ යන චලනයක් මම බලාපොරොත්තු වෙනවා.
නැතිනම්, 116 දක්වා බලමු
#BinanceTurns9
Nasdaq ප්රස්ථාරය
මිල පෙර වෙළඳපොළ ගැප් එක පුරවන්නට ඉහළට තල්ලු කර පසුගිය සතියේ විවෘත මට්ටමට පහළට වැටුණා.
201 දක්වා නැවතත් ඉහළ යන චලනයක් මම බලාපොරොත්තු වෙනවා.
නැතිනම්, 116 දක්වා බලමු
#BinanceTurns9
1
223
·
--
උසබ තත්ත්වය
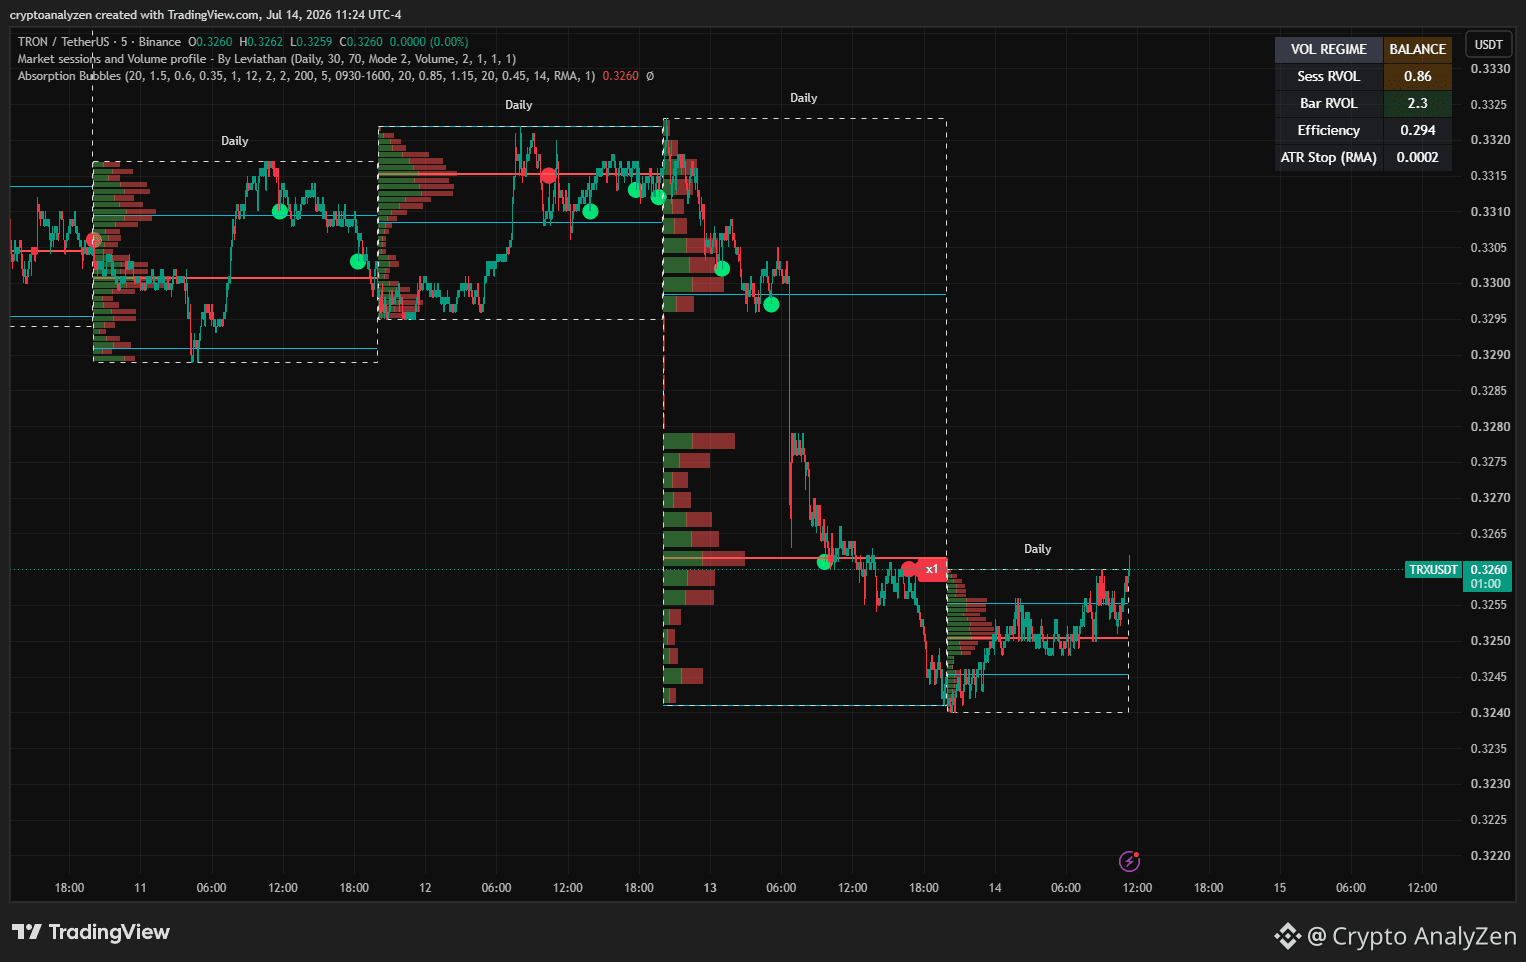
$TRX - ඉහළට යාමට පෙර ශක්තිය වර්ධනය කිරීම
පළමු කලාපය - ගැප් කලාපය - ඉලක්කය 0.3295
දෙවන ඉලක්කය - 0.33195
තුන්වන ඉලක්කය - 0.34279
{future}(TRXUSDT)
{future}(BTCUSDT)
#Tron #BinanceTurns9
$TRX - ඉහළට යාමට පෙර ශක්තිය වර්ධනය කිරීම
පළමු කලාපය - ගැප් කලාපය - ඉලක්කය 0.3295
දෙවන ඉලක්කය - 0.33195
තුන්වන ඉලක්කය - 0.34279
#Tron #BinanceTurns9
පළමු කලාපය - ගැප් කලාපය - ඉලක්කය 0.3295
දෙවන ඉලක්කය - 0.33195
තුන්වන ඉලක්කය - 0.34279
#Tron #BinanceTurns9
1
107
·
--
උසබ තත්ත්වය
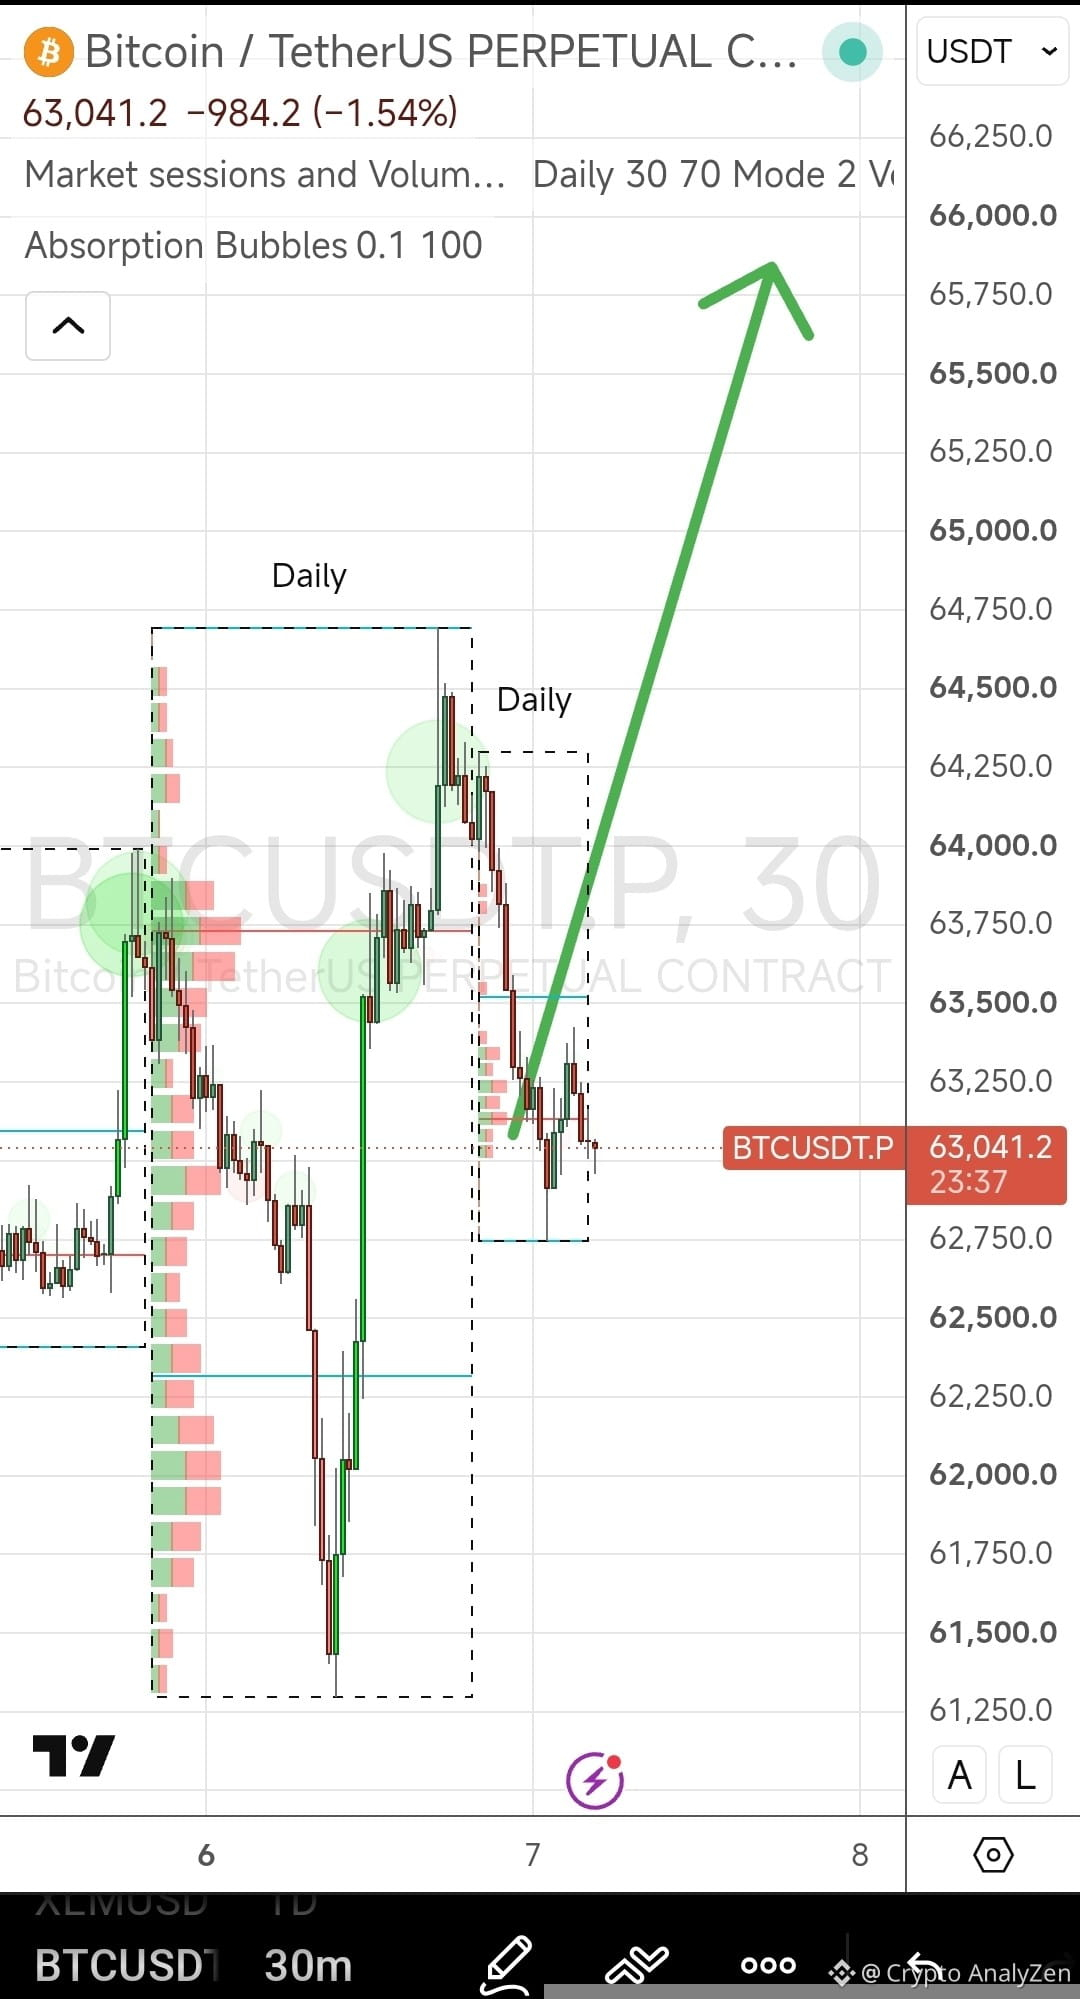
$BTC - حد නොවන්න, දැන්ම වෙළඳාම කරන්න.
ඊයේ NY සැසි ආරම්භයේදී මිල පහළ ගියා.
සතිපතා චාර්ට් - පසුගිය සතිය අවසන් වූයේ වැඩි වන වෝලුම් සමඟ ශක්තිමත් කොළ ඉටිපන්දමකින්.
මට්ටම් 67-70 බලාපොරොත්තු වෙයි.
#BinanceTurns9
{future}(BTCUSDT)
{future}(ETHUSDT)
{future}(LINKUSDT)
$BTC - حد නොවන්න, දැන්ම වෙළඳාම කරන්න.
ඊයේ NY සැසි ආරම්භයේදී මිල පහළ ගියා.
සතිපතා චාර්ට් - පසුගිය සතිය අවසන් වූයේ වැඩි වන වෝලුම් සමඟ ශක්තිමත් කොළ ඉටිපන්දමකින්.
මට්ටම් 67-70 බලාපොරොත්තු වෙයි.
#BinanceTurns9
ඊයේ NY සැසි ආරම්භයේදී මිල පහළ ගියා.
සතිපතා චාර්ට් - පසුගිය සතිය අවසන් වූයේ වැඩි වන වෝලුම් සමඟ ශක්තිමත් කොළ ඉටිපන්දමකින්.
මට්ටම් 67-70 බලාපොරොත්තු වෙයි.
#BinanceTurns9
1
129
·
--
උසබ තත්ත්වය
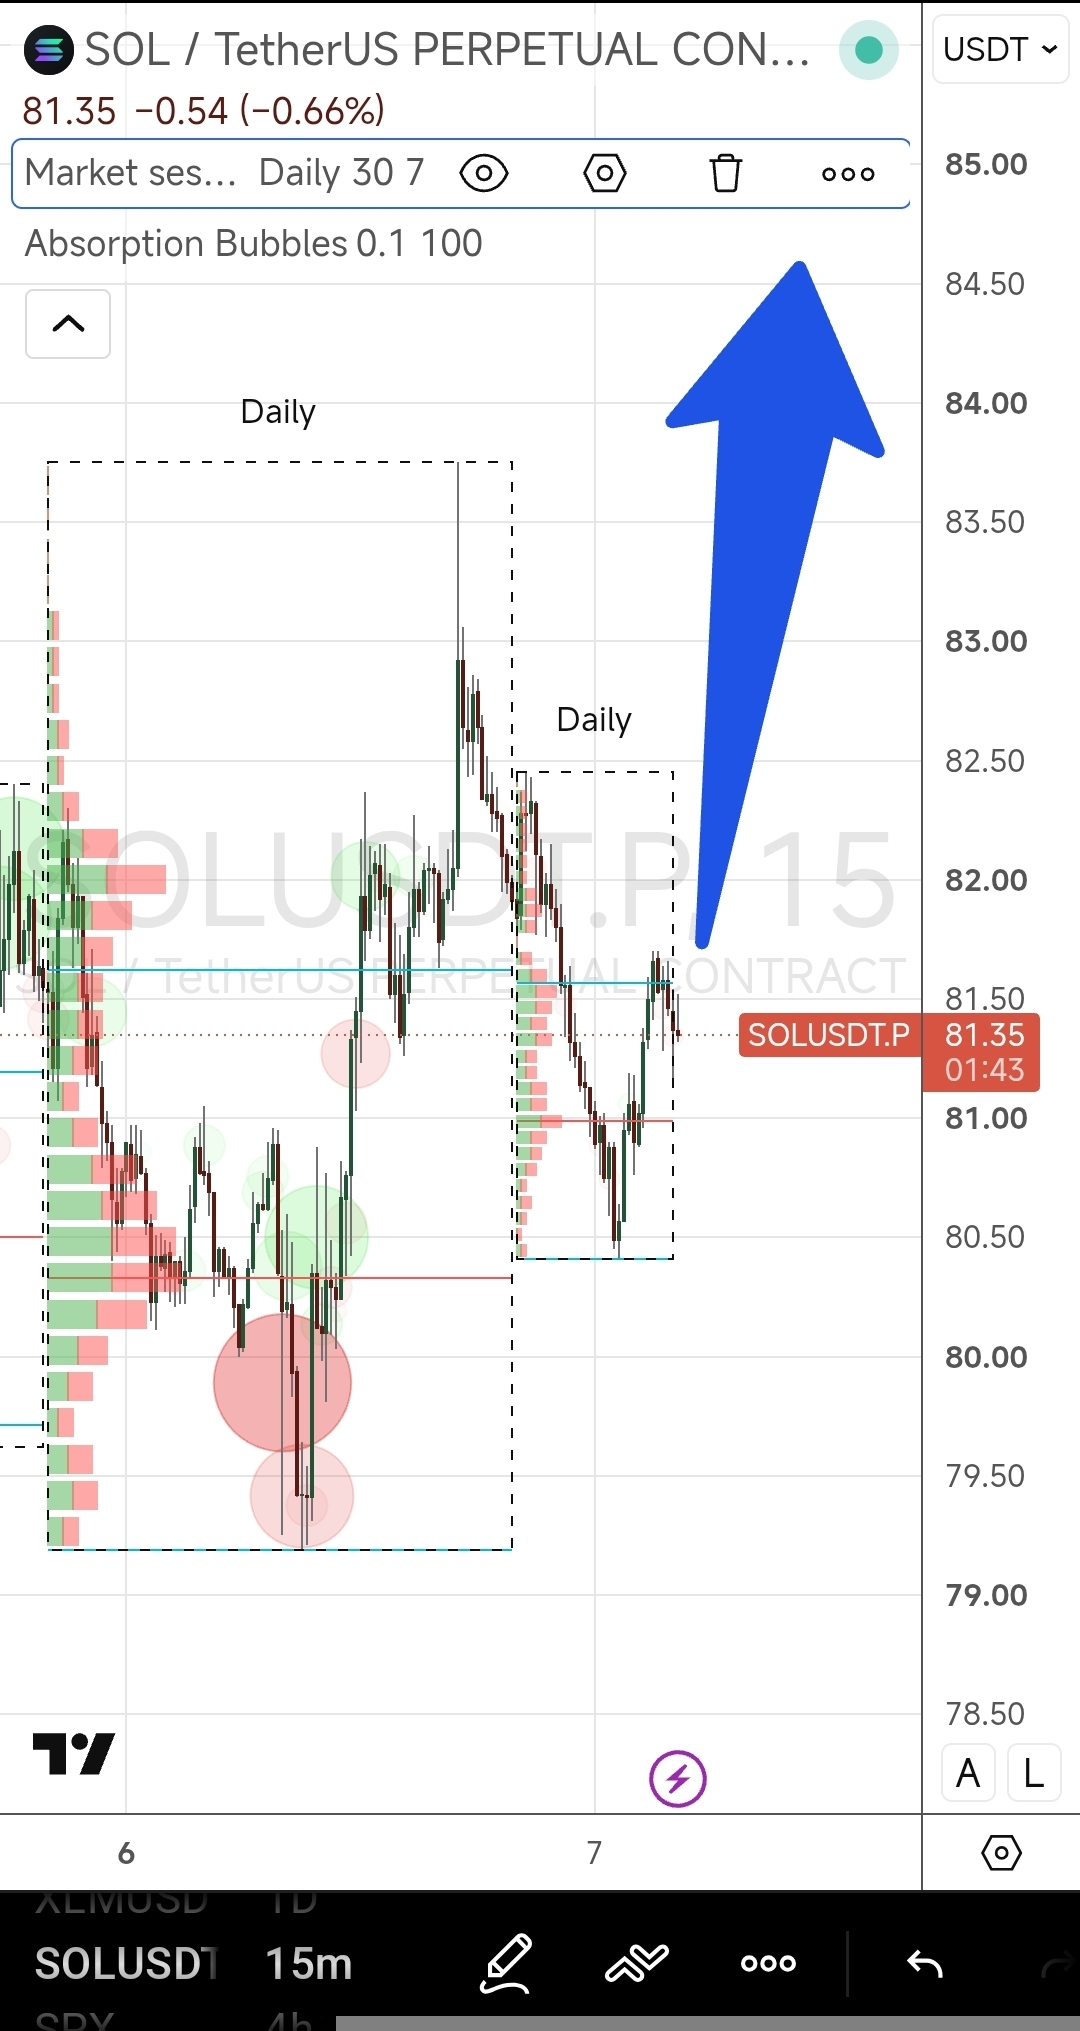
$SOL - මිල අවසානයේ පසුගිය මාසයේ විවෘත මිල මට්ටමේ අත්හිටුවා ඇත.
පසුගිය සතිය හරිත மெழේදීයකින් අවසන් වූ අතර, ඉහළ මට්ටම් තවදුරටත් පරීක්ෂා කිරීමක් සඳහා අඟවයි.
ඊයේ දිනයේ පරාස ප්රක්ෂේපණය අනුව මට්ටම 87-89 වෙත දක්වයි.
#solana
{future}(SOLUSDT)
{future}(ETHUSDT)
{future}(ZECUSDT)
$SOL - මිල අවසානයේ පසුගිය මාසයේ විවෘත මිල මට්ටමේ අත්හිටුවා ඇත.
පසුගිය සතිය හරිත மெழේදීයකින් අවසන් වූ අතර, ඉහළ මට්ටම් තවදුරටත් පරීක්ෂා කිරීමක් සඳහා අඟවයි.
ඊයේ දිනයේ පරාස ප්රක්ෂේපණය අනුව මට්ටම 87-89 වෙත දක්වයි.
#solana
පසුගිය සතිය හරිත மெழේදීයකින් අවසන් වූ අතර, ඉහළ මට්ටම් තවදුරටත් පරීක්ෂා කිරීමක් සඳහා අඟවයි.
ඊයේ දිනයේ පරාස ප්රක්ෂේපණය අනුව මට්ටම 87-89 වෙත දක්වයි.
#solana
1
215
තවත් අන්තර්ගතයන් ගවේෂණය කිරීමට ඇතුල් වන්න
Binance චතුරශ්රය හි ගෝලීය ක්රිප්ටෝ පරිශීලකයින් හා එක්වන්න
⚡️ ක්රිප්ටෝ පිළිබඳ නවතම සහ ප්රයෝජනවත් තොරතුරු ලබා ගන්න.
💬 ලොව විශාලතම ක්රිප්ටෝ හුවමාරුව මගින් විශ්වාස කෙරේ.
👍 සත්යායනය කරන ලද නිර්මාණකරුවන්ගෙන් සැබෑ විදසුන් සොයා ගන්න.
විද්යුත් තැපෑල / දුරකථන අංකය
නැගී එන මාතෘකා
NEARRisesNearly80%InAWeek
12,191 views
575 සාකච්ඡා කරමින්
#nearrisesnearly80%inaweek
NEAR මහාත්මක වශයෙන් මෙම සතියේ — ඉහළ යාමට හේතුව කුමක්ද 🔥
ඒකනම් NEAR සඳහා හොඳ සතියක්! 🚀 දින 7 ක් තුළ ආසන්න වශයෙන් 80%කට ආසන්න ලාභ ලබාගැනීම හුදු වාසනාවක් නොවේ; ඒක NEAR හි දාම ඉවත් කිරීමේ දර්ශනය හා කෘතිම බුද්ධිය (AI) ඒකාබද්ධ කිරීම වටා විශාල උද්යෝගයක් ගොඩනැගෙන බව පෙන්වයි. තාක්ෂණික කාර්යක්ෂමතාව වෙළඳුන්ගේ වෙළඳපොළ උද්යෝගය සමඟ එක්වෙන විට, අපට මේ වගේම මිල චලනයක් ලැබෙයි.
ඔබ NEAR දිගුකාලීනව තබාගන්නවද, නැතිනම් මේ මට්ටම්වලදී ලාභ අරගන්නවද? පහතින් ඔබේ උපායමාර්ගය කියන්න! 👇
කරුණාකර දිගටම අනුගමනය කරන්න
$NEAR
#BitcoinHits$85K #Near #SolanaCutsTargetSlotTimeTo250ms
Shamika Metting
·2 කැමත්ත දැක්වීම්
·1.6k views
MultiversXPlansHardForkRecovery
12,514 views
461 සාකච්ඡා කරමින්
CircleLaunchesInstitutionalBTCBackedBorrowing
14,144 views
594 සාකච්ඡා කරමින්