
Chumba Money
7.2k පෝස්ටු

Chumba Money
 චතුරශ්රය සත්යාපිත
වාර්තා කරන්න
පරිශීලක අවහිර කරන්න
Research & Analysis | Crypto Education | Chumba Labs Dev

Top Voices

Level 2 Creator
1 හඹා යමින්
49.8K+ හඹා යන්නන්
18.1K+ කැමති විය
2 ලාංජනය
පෝස්ටු
සියල්ල
උපුටා දැක්වීම්
·
--
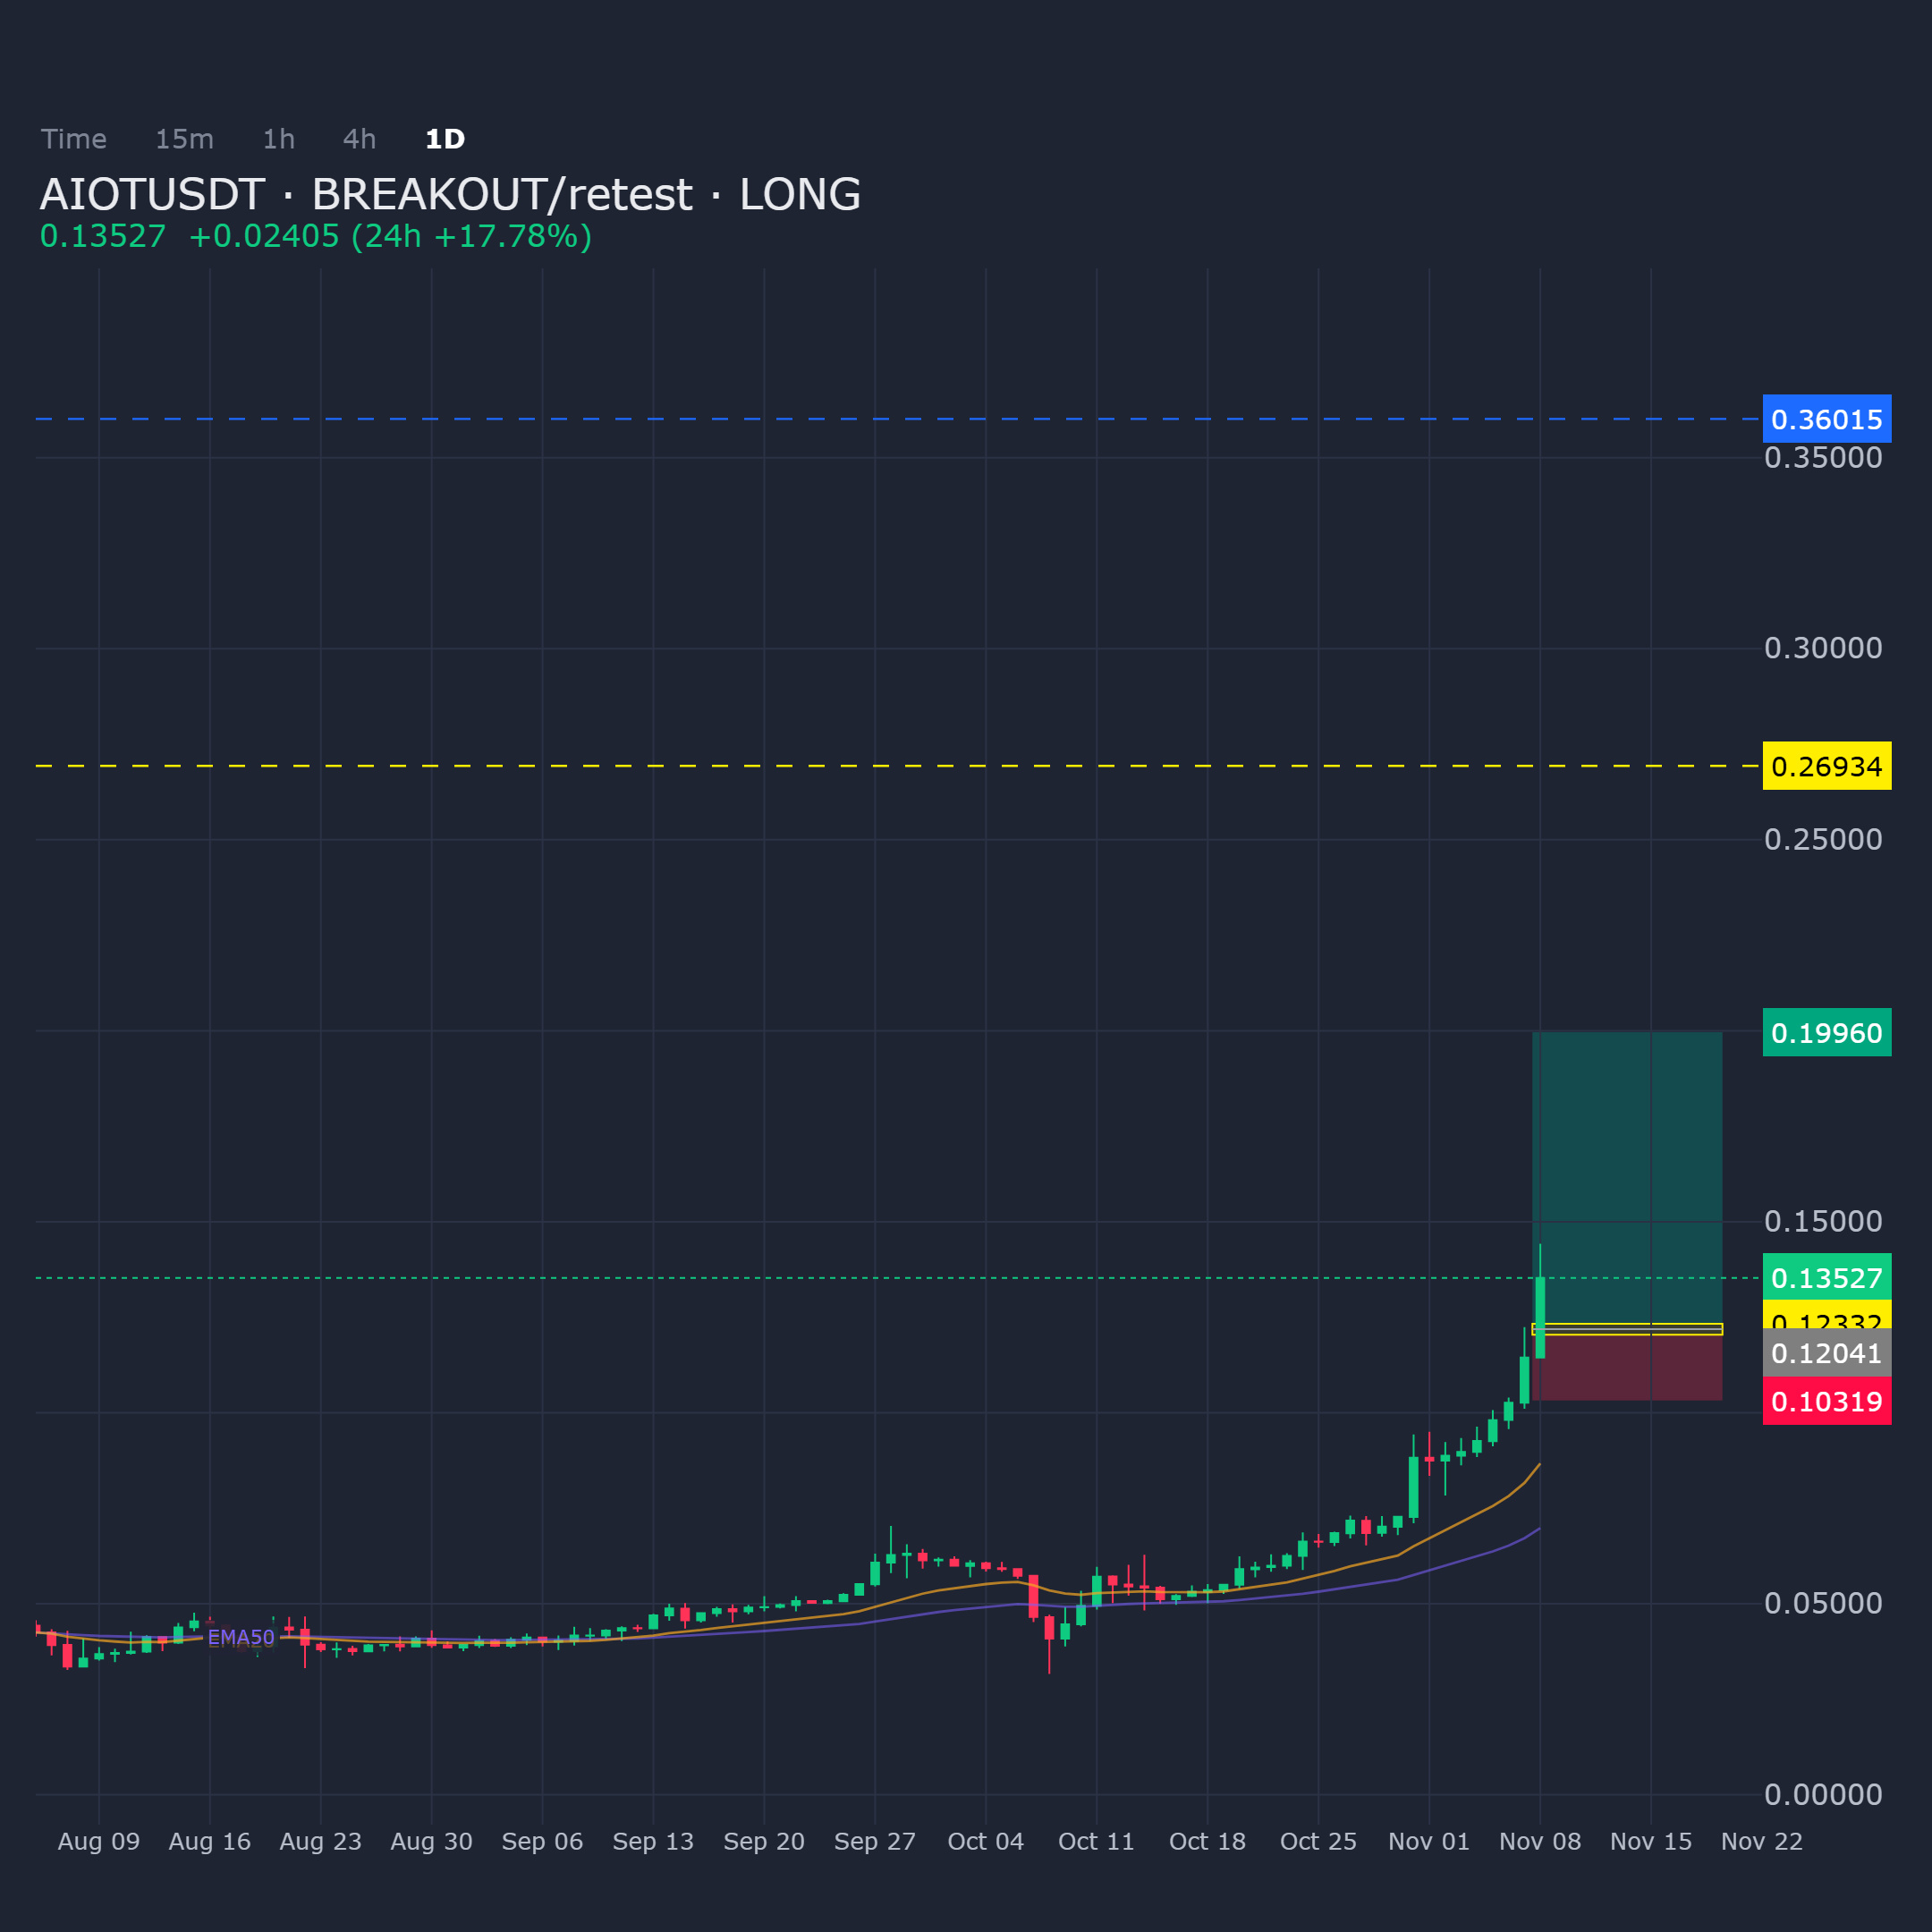
AIOTUSDT on the daily shows confluence lining up for a long bias via breakout-retest structure. Price is approaching a defined entry zone with clear targets ahead.
Entry: 0.120412 - 0.123318
Targets: TP1: 0.199599, TP2: 0.269341, TP3: 0.360151
Stop Loss: 0.103195
$AIOT
AIOTUSDT on the daily shows confluence lining up for a long bias via breakout-retest structure. Price is approaching a defined entry zone with clear targets ahead.
Entry: 0.120412 - 0.123318
Targets: TP1: 0.199599, TP2: 0.269341, TP3: 0.360151
Stop Loss: 0.103195
$AIOT
Entry: 0.120412 - 0.123318
Targets: TP1: 0.199599, TP2: 0.269341, TP3: 0.360151
Stop Loss: 0.103195
$AIOT
9
·
--
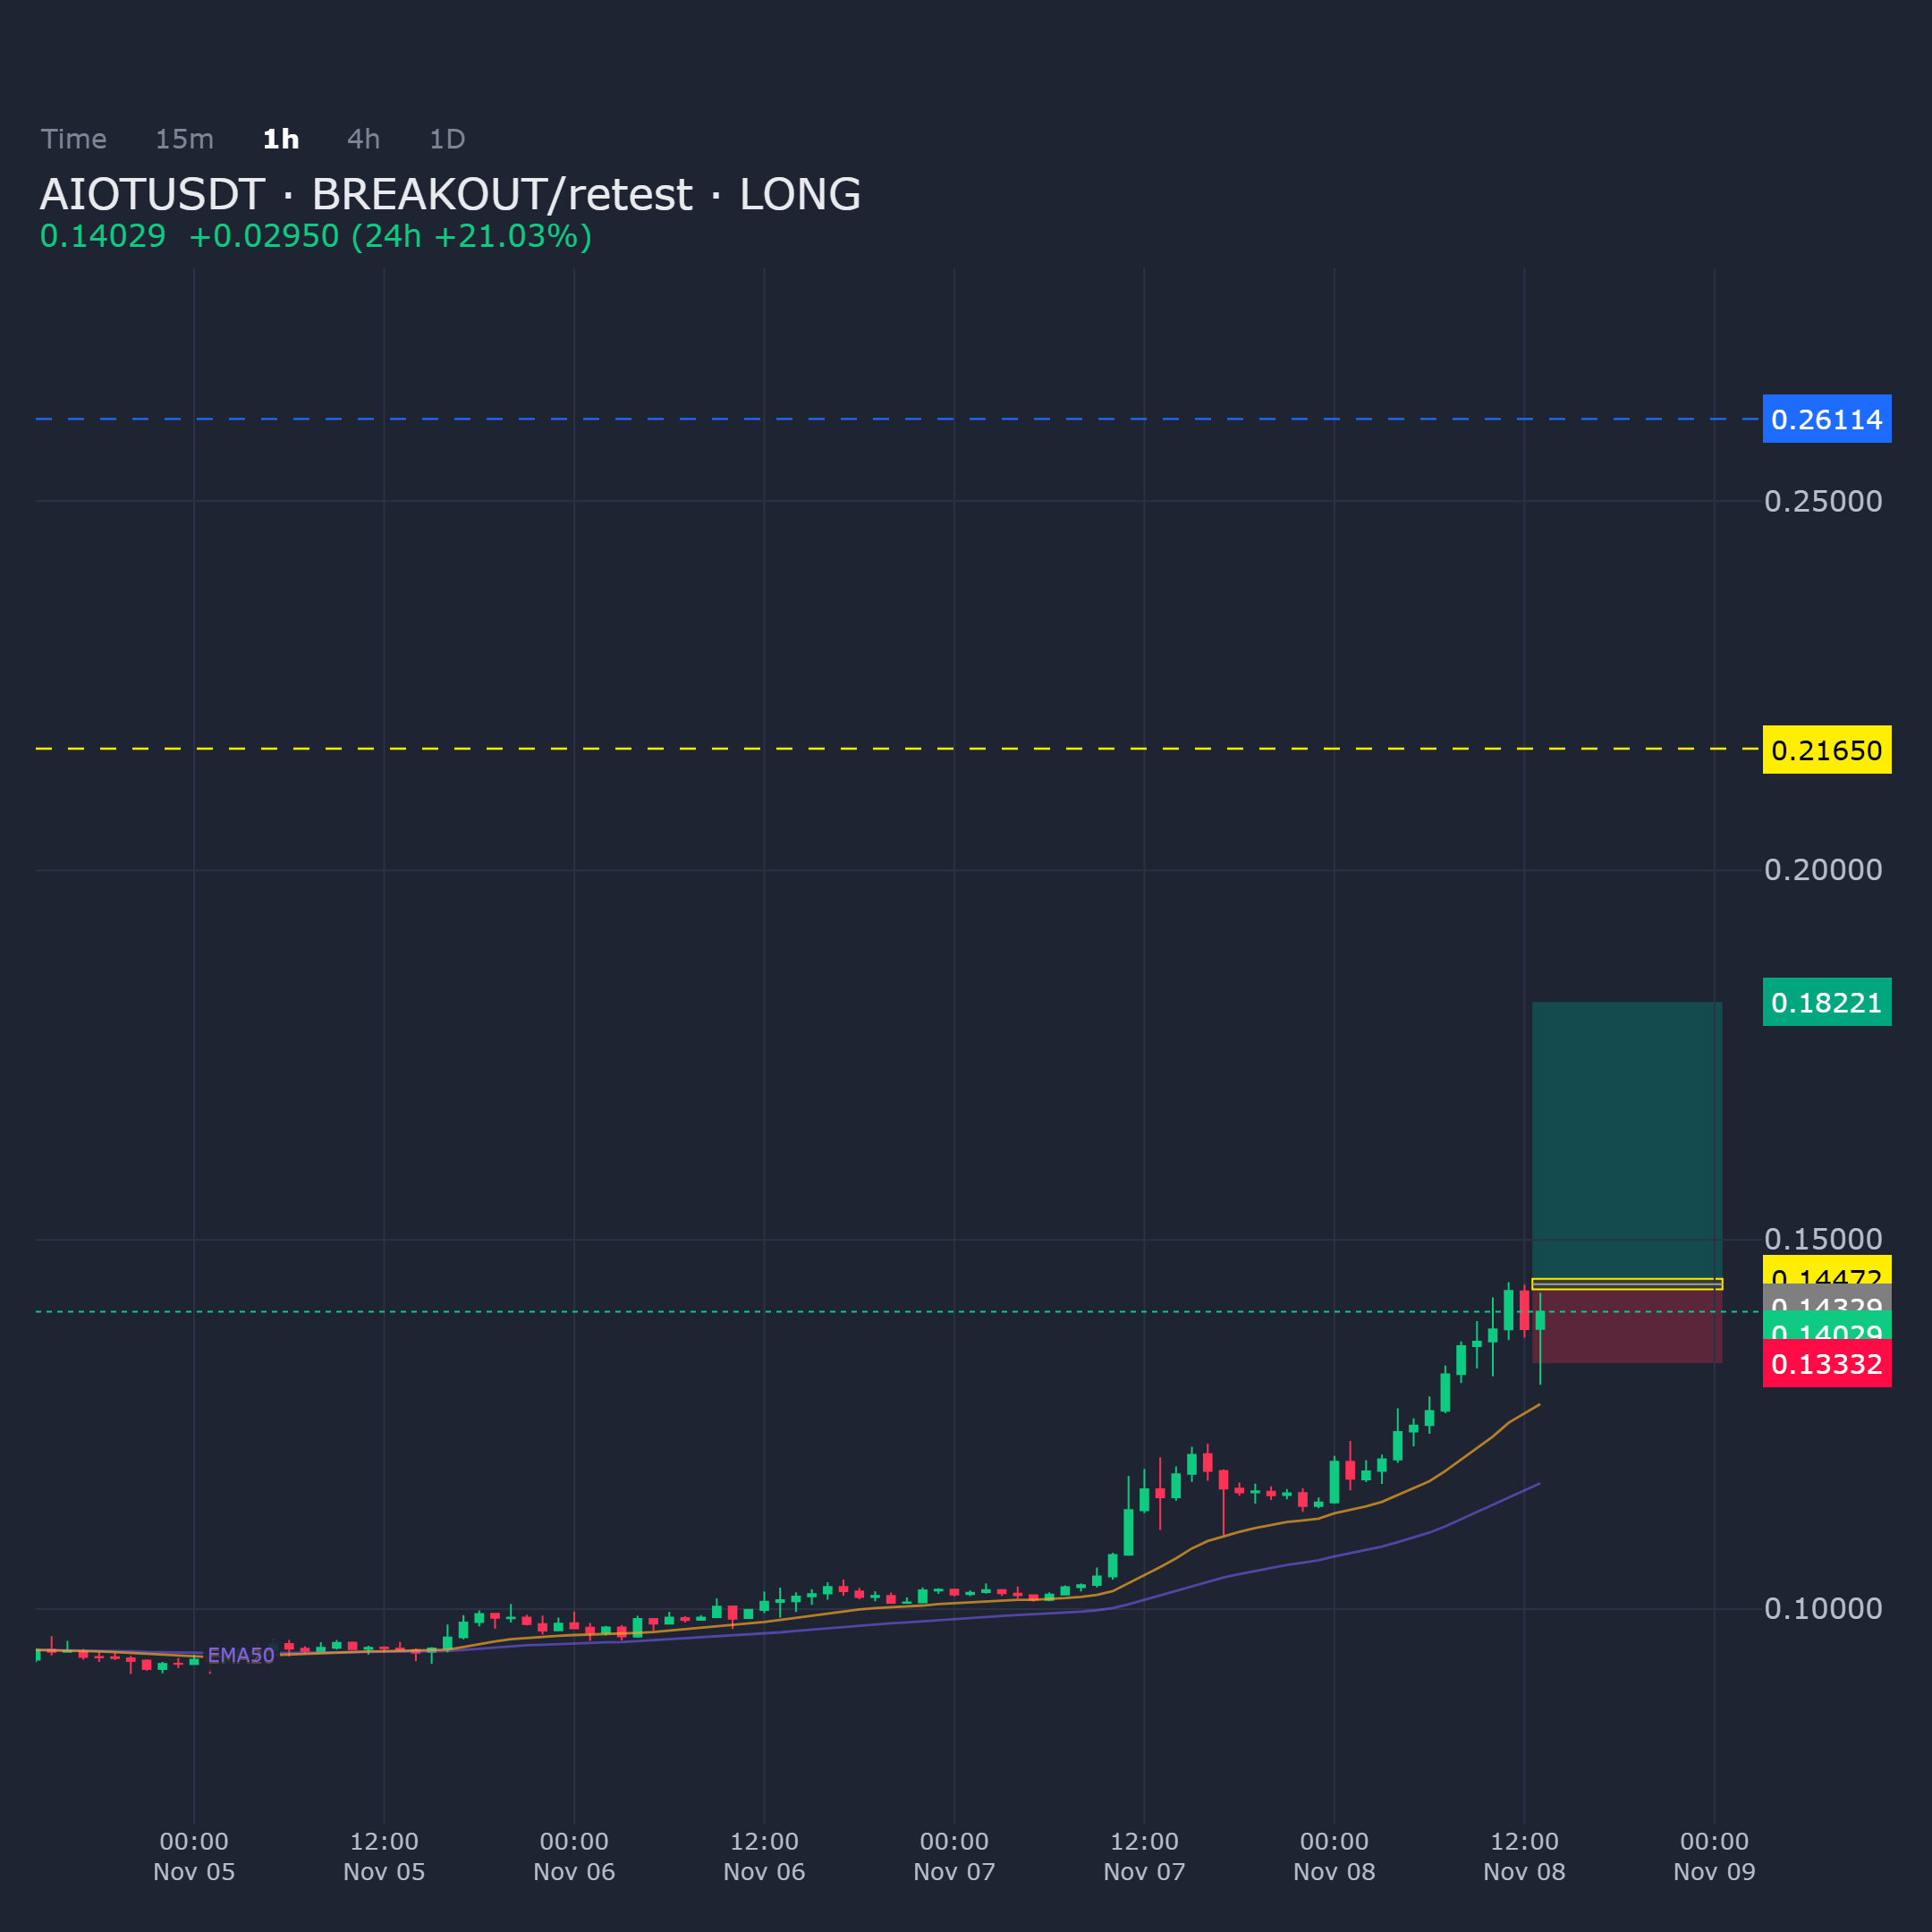
AIOTUSDT on the 1H frame is structured for a breakout retest setup with a long bias approaching the demand zone.
Entry: 0.143288 - 0.144716
Targets: TP1: 0.182214, TP2: 0.216498, TP3: 0.261138
Stop Loss: 0.133321
$AIOT
AIOTUSDT on the 1H frame is structured for a breakout retest setup with a long bias approaching the demand zone.
Entry: 0.143288 - 0.144716
Targets: TP1: 0.182214, TP2: 0.216498, TP3: 0.261138
Stop Loss: 0.133321
$AIOT
Entry: 0.143288 - 0.144716
Targets: TP1: 0.182214, TP2: 0.216498, TP3: 0.261138
Stop Loss: 0.133321
$AIOT
12
·
--
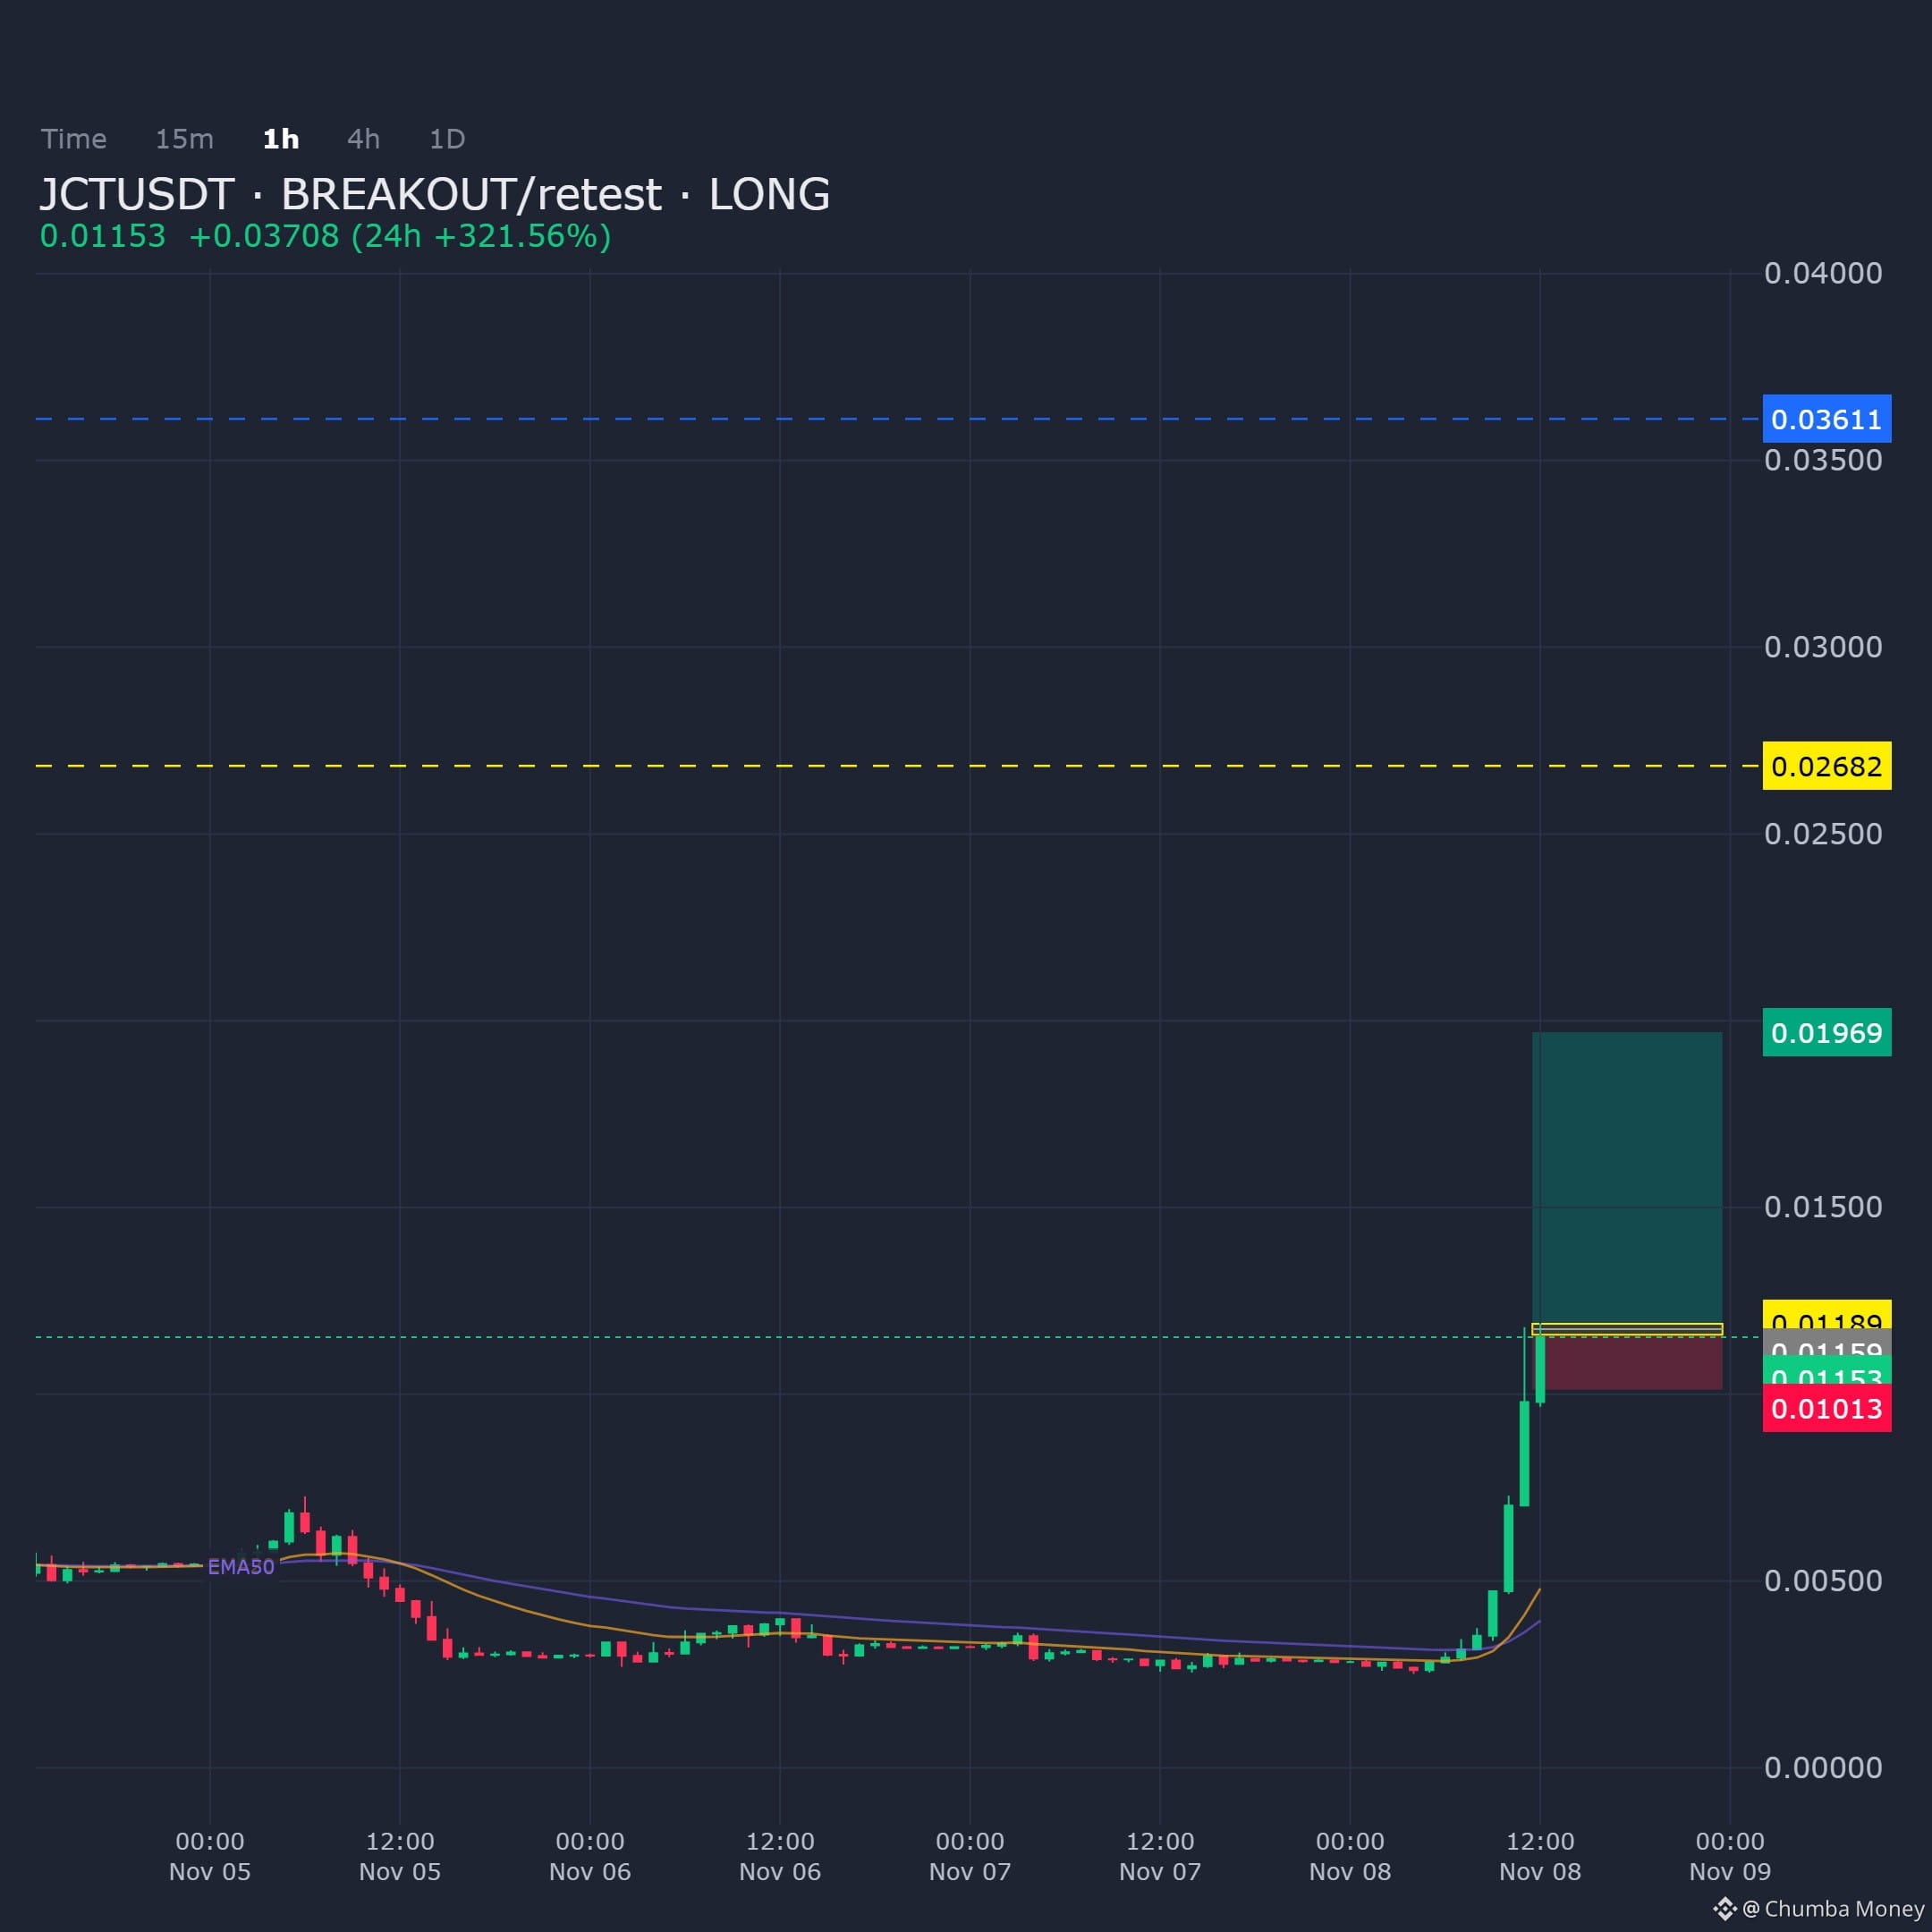
JCTUSDT on the 1H is holding structure into demand, framing a breakout/retest setup for a long bias.
Entry: 0.011594 - 0.011891
Targets: TP1: 0.019691, TP2: 0.026823, TP3: 0.036109
Stop Loss: 0.010125
$JCT
JCTUSDT on the 1H is holding structure into demand, framing a breakout/retest setup for a long bias.
Entry: 0.011594 - 0.011891
Targets: TP1: 0.019691, TP2: 0.026823, TP3: 0.036109
Stop Loss: 0.010125
$JCT
Entry: 0.011594 - 0.011891
Targets: TP1: 0.019691, TP2: 0.026823, TP3: 0.036109
Stop Loss: 0.010125
$JCT
24
·
--
Observation: Amsterdam protesters detained 150 to 200 people at a Microsoft data center construction site. Interpretation: Physical infrastructure faces rising social friction as AI and cloud demand expand. Market context: total crypto market cap fell 3.69% over 24 hours. BTC dominance is 59.96%, ETH 10.75%. BTC at $75,870, down 0.09% in 24 hours and 2.69% over 7 days. ETH at $2,237.37, down 0.23% in 24 hours. SOL at $89.50, down 0.48% in 24 hours and 6.04% over 7 days. Trade-off: data center buildout supports compute demand but invites local opposition and regulatory scrutiny. Risk: infrastructure delays or bans could raise costs for AI-linked crypto sectors. No prediction implied. Data is thin on direct crypto spillover from this single event.
Observation: Amsterdam protesters detained 150 to 200 people at a Microsoft data center construction site. Interpretation: Physical infrastructure faces rising social friction as AI and cloud demand expand. Market context: total crypto market cap fell 3.69% over 24 hours. BTC dominance is 59.96%, ETH 10.75%. BTC at $75,870, down 0.09% in 24 hours and 2.69% over 7 days. ETH at $2,237.37, down 0.23% in 24 hours. SOL at $89.50, down 0.48% in 24 hours and 6.04% over 7 days. Trade-off: data center buildout supports compute demand but invites local opposition and regulatory scrutiny. Risk: infrastructure delays or bans could raise costs for AI-linked crypto sectors. No prediction implied. Data is thin on direct crypto spillover from this single event.
12
·
--
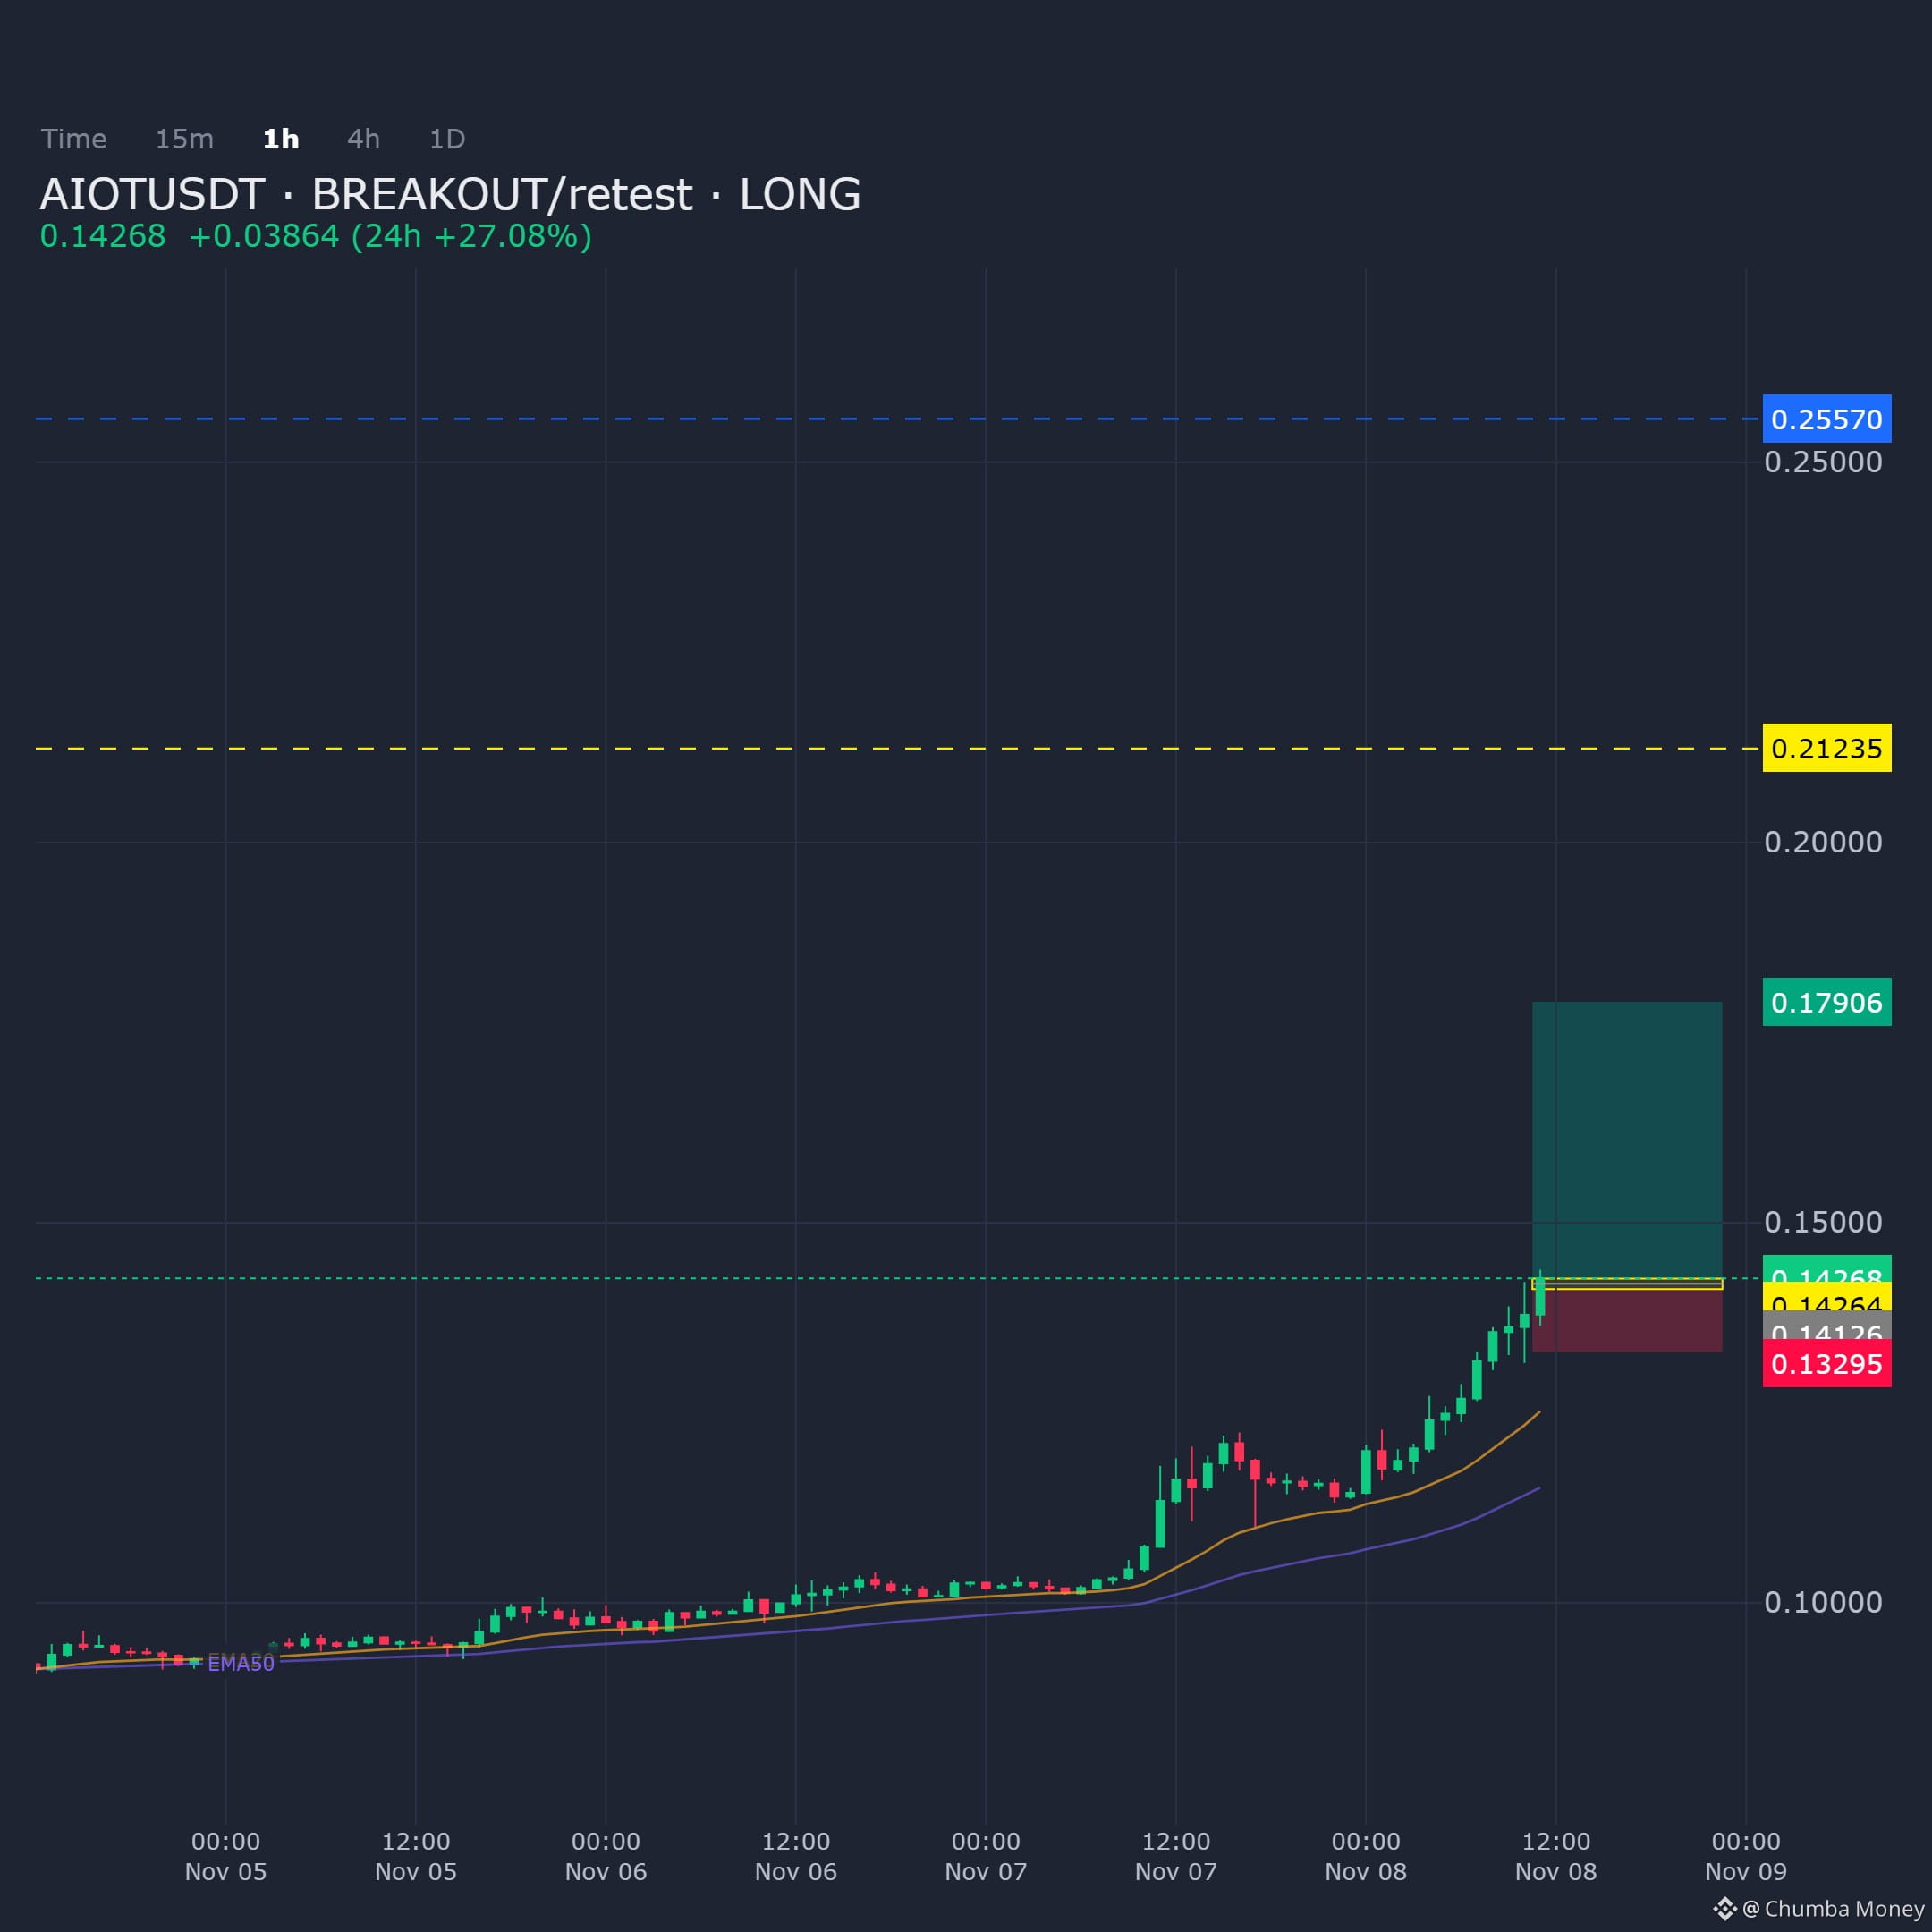
AIOTUSDT on the 1H chart is showing bullish confluence as price approaches the breakout/retest zone. Bias is long pending confirmation at support.
Entry: 0.141256 - 0.142644
Targets: TP1: 0.179058, TP2: 0.21235, TP3: 0.2557
Stop Loss: 0.132951
$AIOT
AIOTUSDT on the 1H chart is showing bullish confluence as price approaches the breakout/retest zone. Bias is long pending confirmation at support.
Entry: 0.141256 - 0.142644
Targets: TP1: 0.179058, TP2: 0.21235, TP3: 0.2557
Stop Loss: 0.132951
$AIOT
Entry: 0.141256 - 0.142644
Targets: TP1: 0.179058, TP2: 0.21235, TP3: 0.2557
Stop Loss: 0.132951
$AIOT
30
·
--
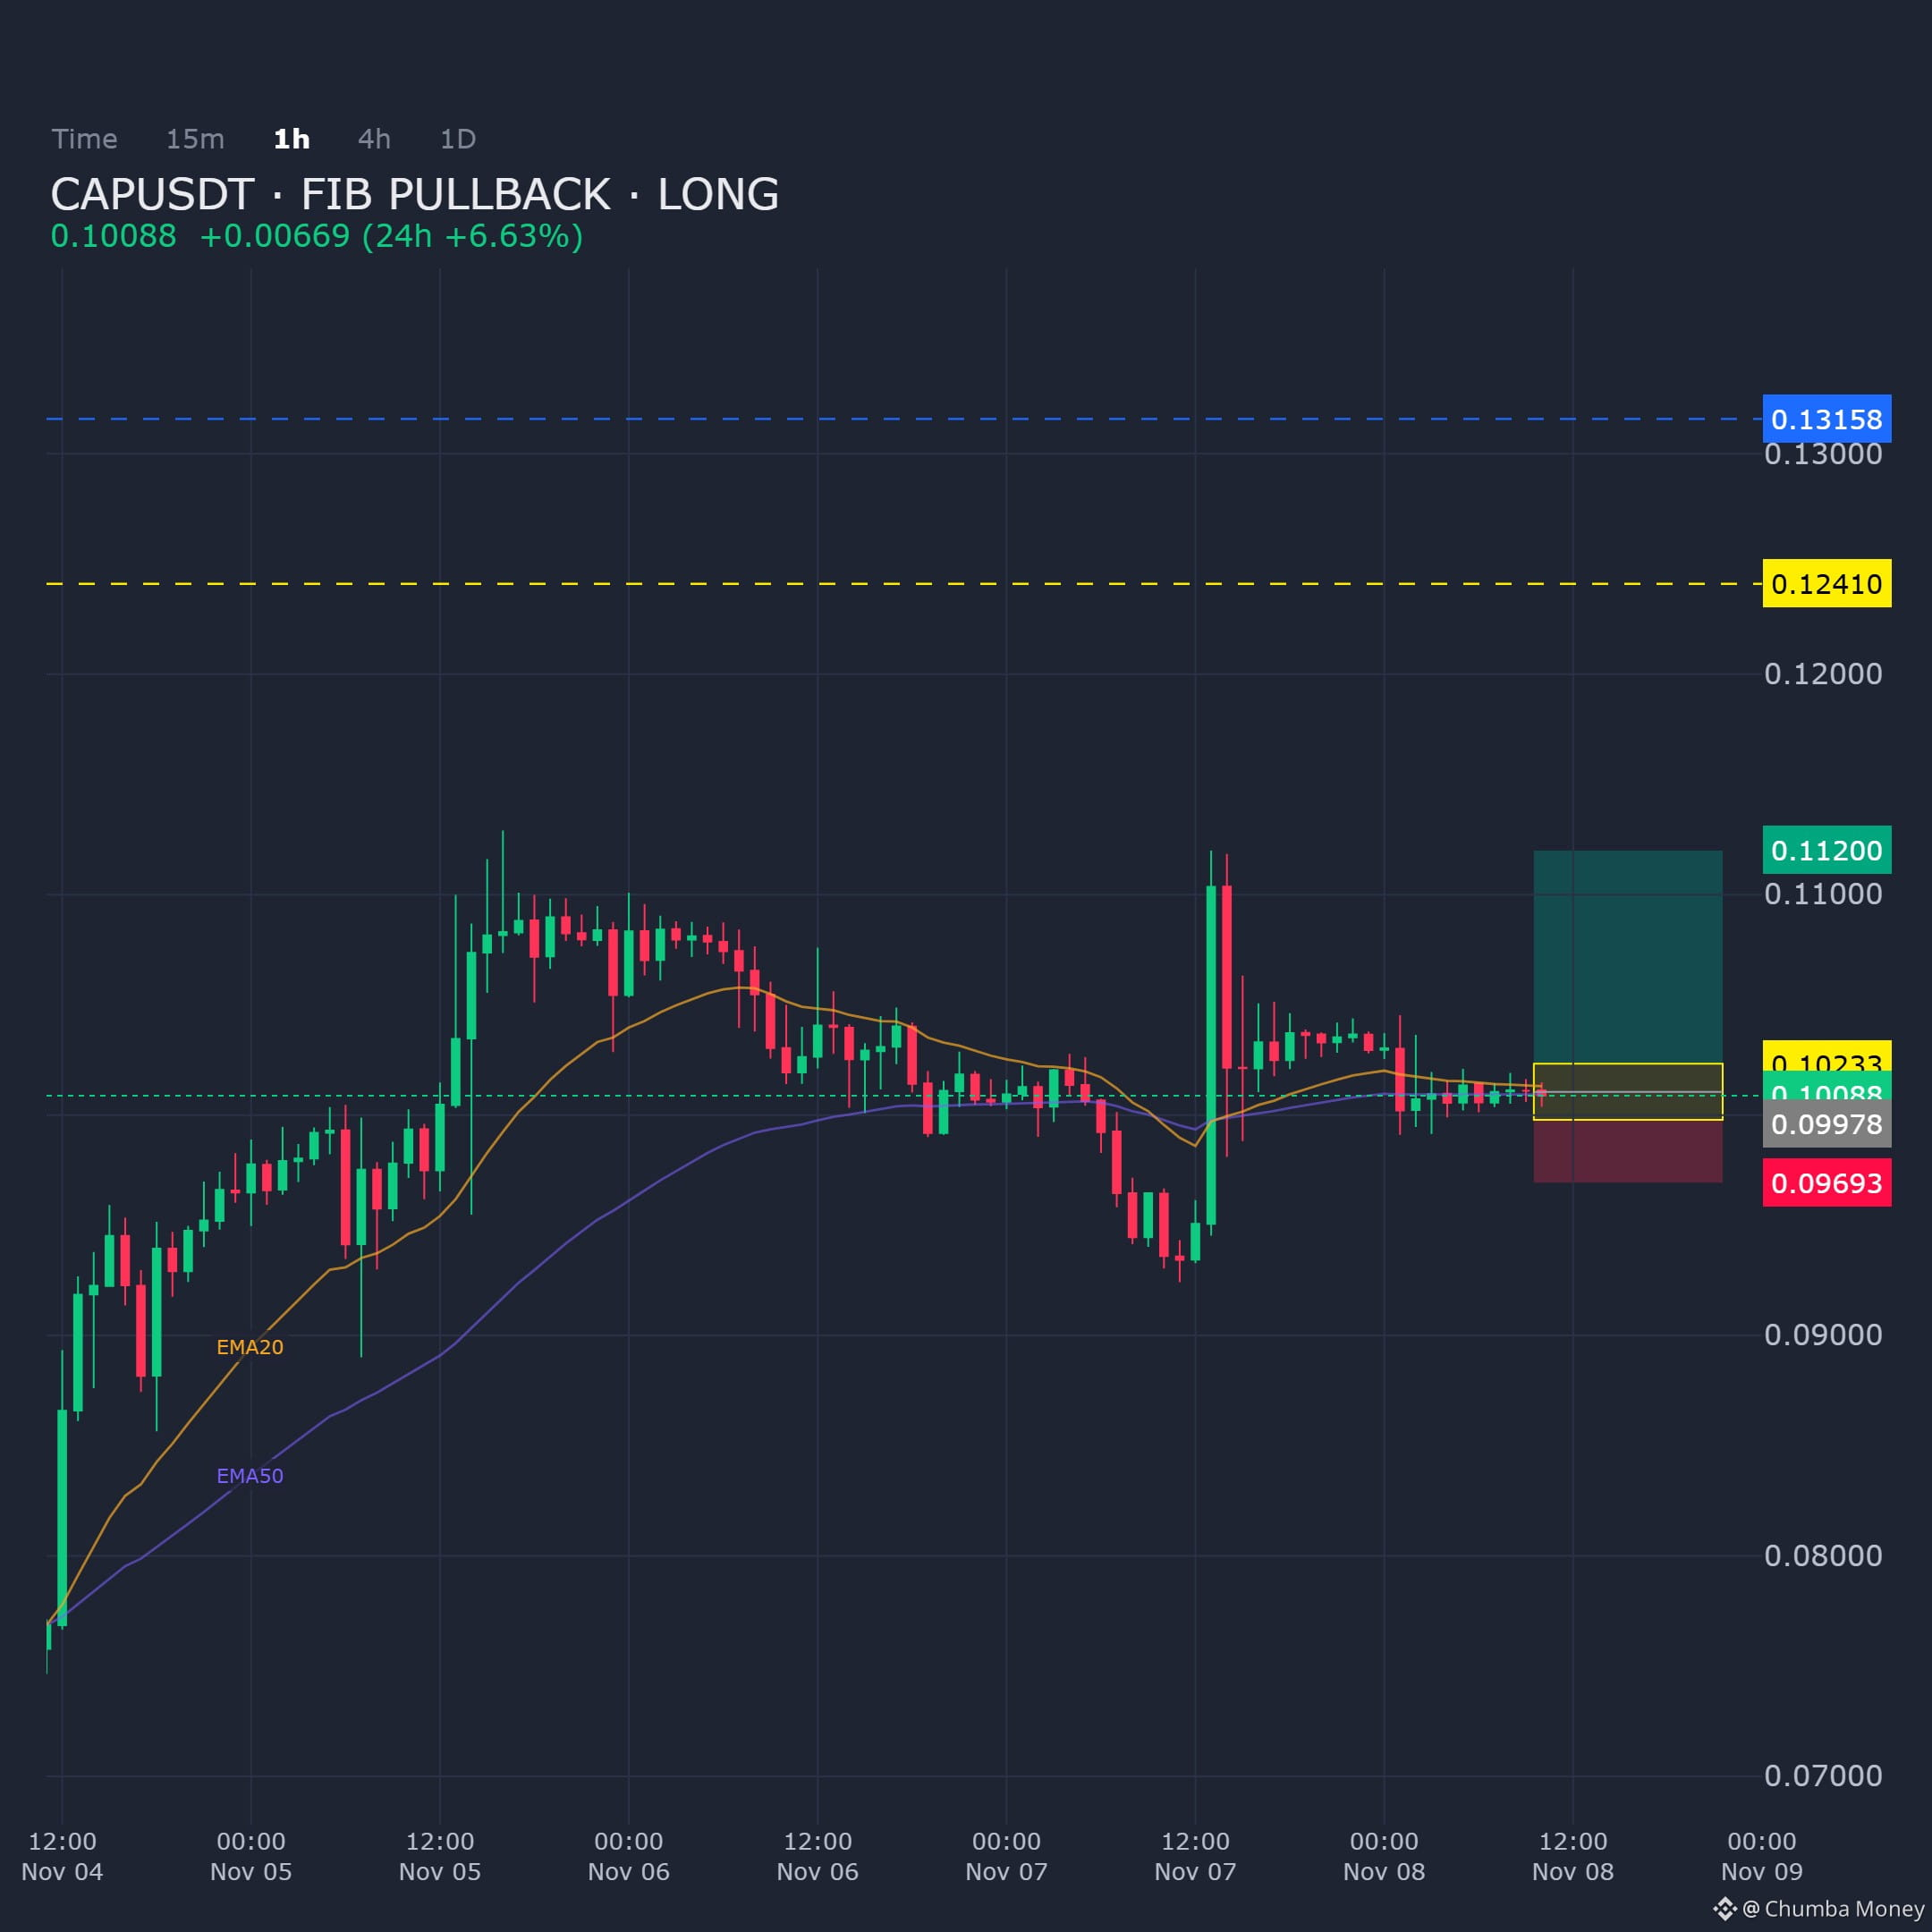
CAPUSDT on the 1H chart shows a Fibonacci pullback aligning with key structure, supporting a long bias in this zone.
Entry: 0.099782 - 0.102327
Targets: TP1: 0.112, TP2: 0.1241, TP3: 0.13158
Stop Loss: 0.096931
$CAP
CAPUSDT on the 1H chart shows a Fibonacci pullback aligning with key structure, supporting a long bias in this zone.
Entry: 0.099782 - 0.102327
Targets: TP1: 0.112, TP2: 0.1241, TP3: 0.13158
Stop Loss: 0.096931
$CAP
Entry: 0.099782 - 0.102327
Targets: TP1: 0.112, TP2: 0.1241, TP3: 0.13158
Stop Loss: 0.096931
$CAP
1
34
·
--
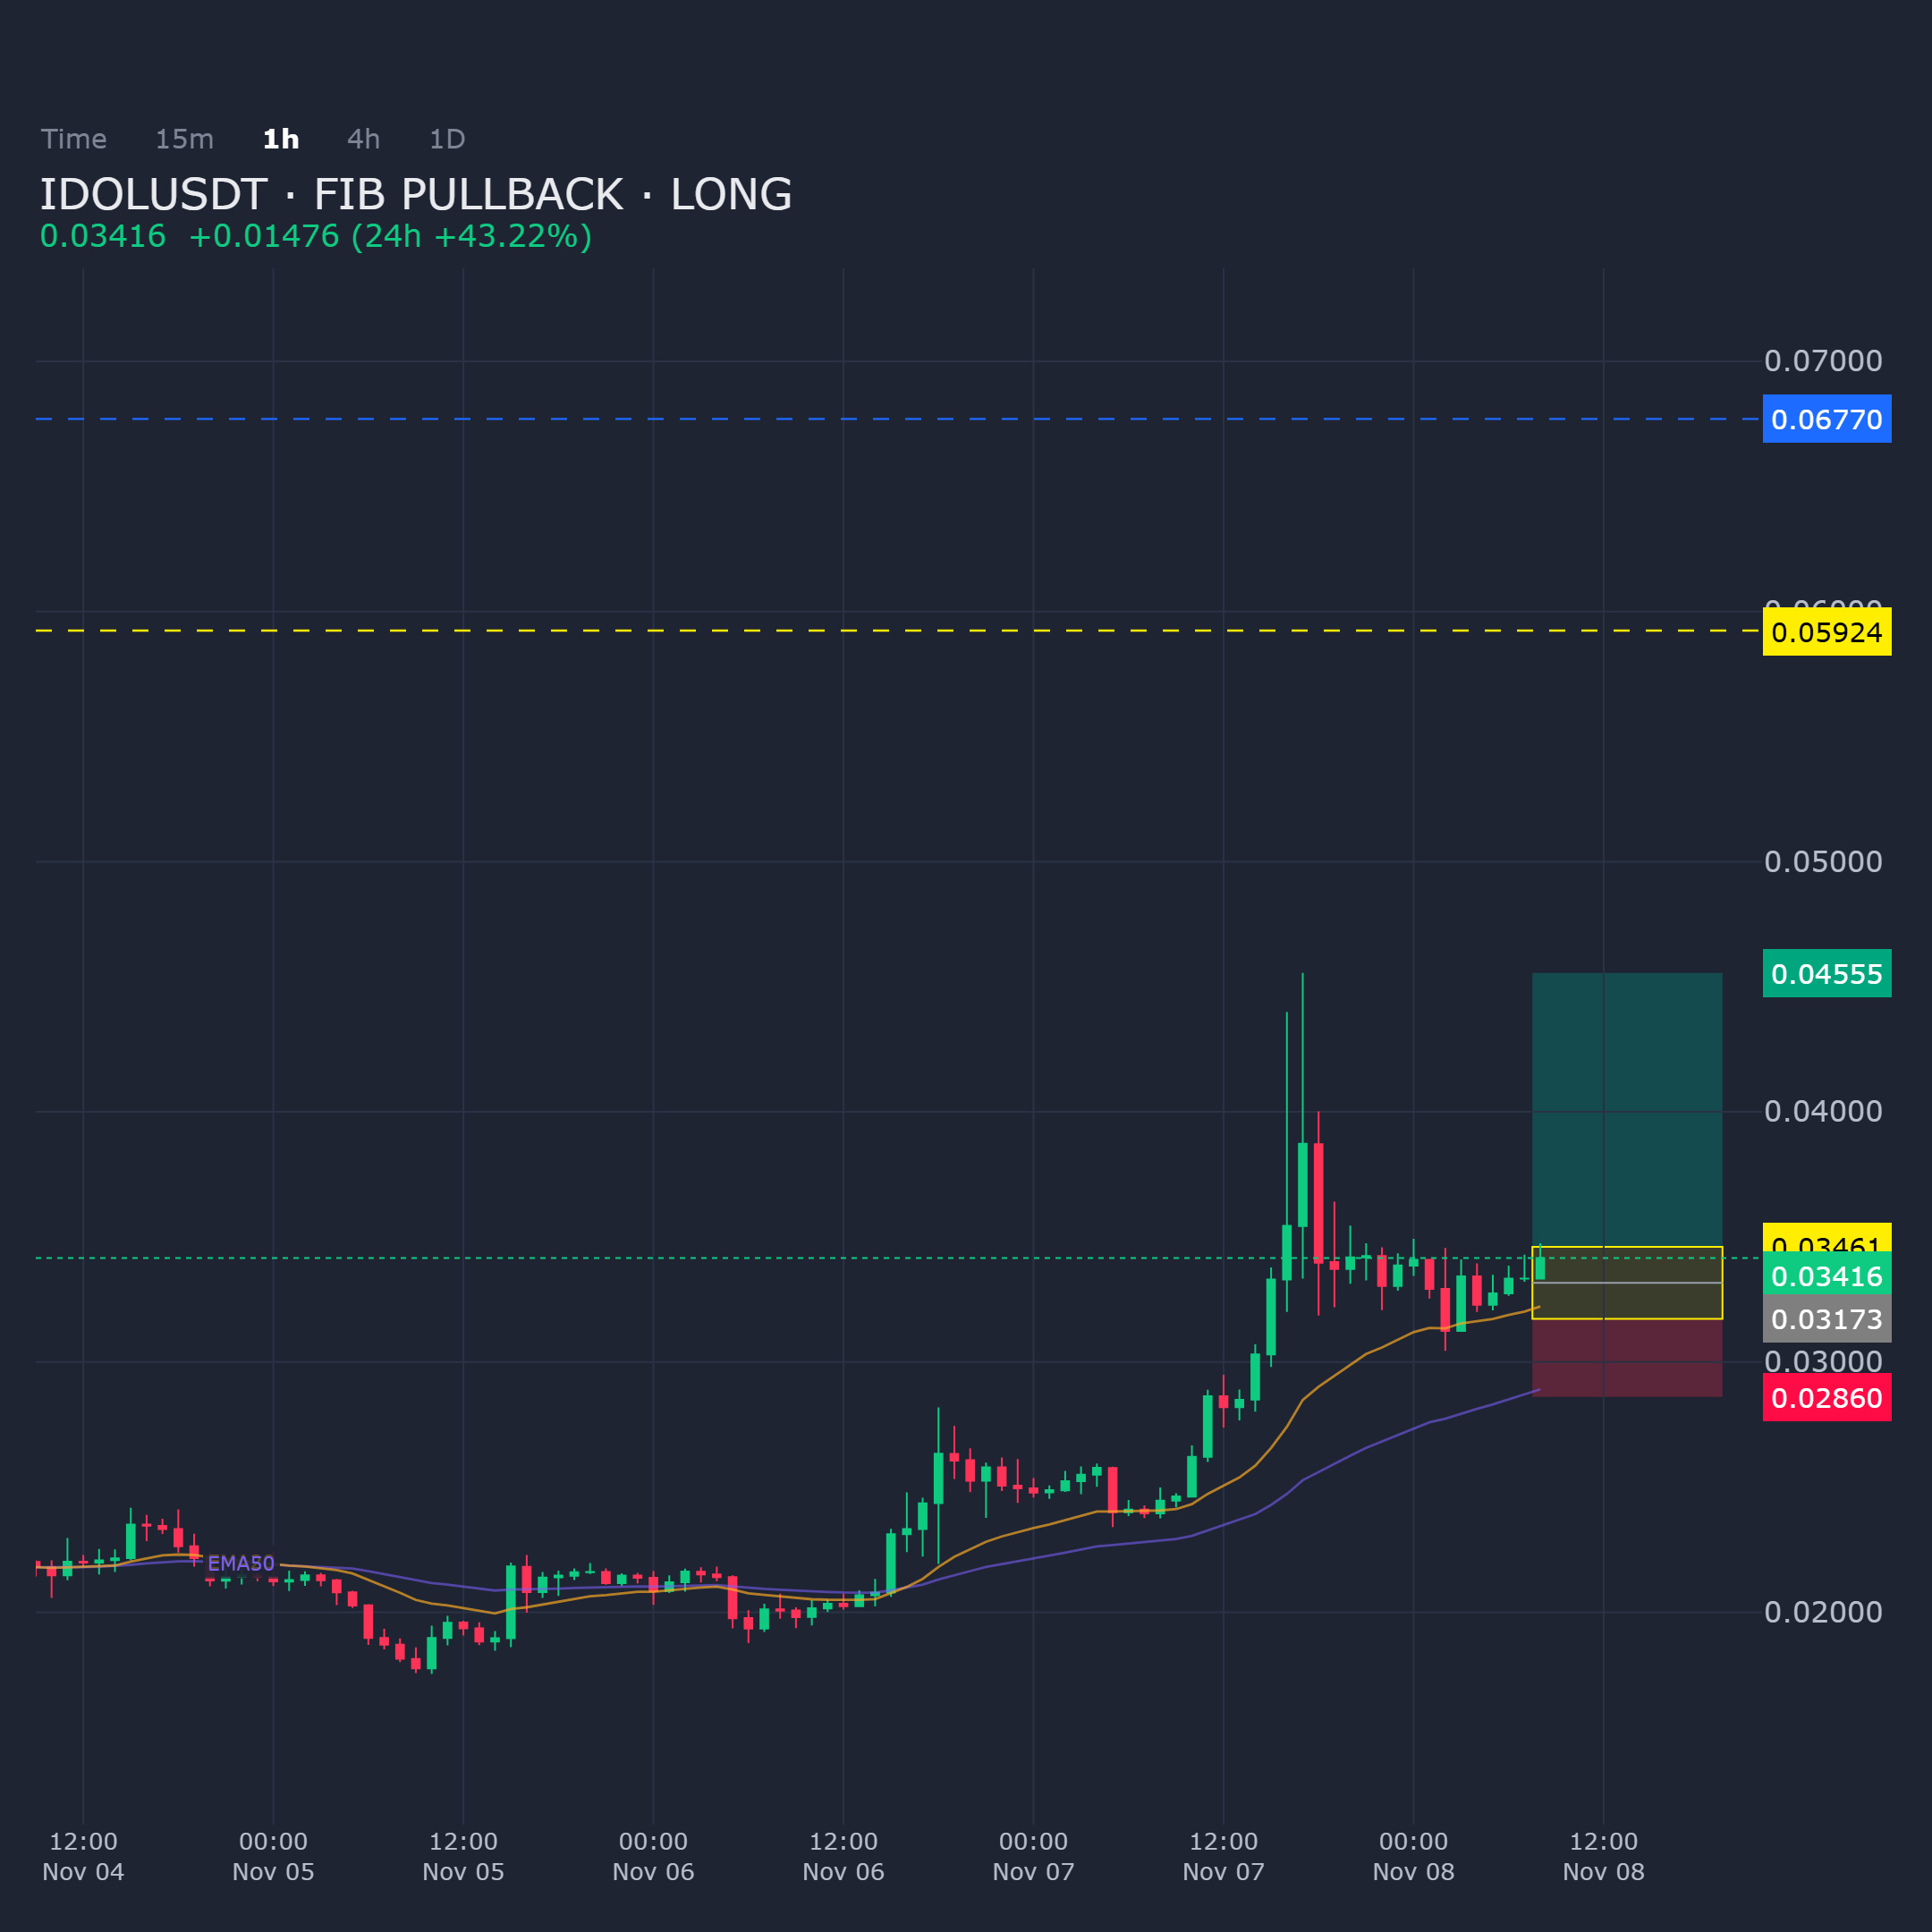
IDOLUSDT on the 1H chart shows bullish confluence at the Fibonacci pullback zone, maintaining a directional long bias.
Entry: 0.031728 - 0.034607
Targets: TP1: 0.04555, TP2: 0.059239, TP3: 0.067701
Stop Loss: 0.028602
$IDOL
IDOLUSDT on the 1H chart shows bullish confluence at the Fibonacci pullback zone, maintaining a directional long bias.
Entry: 0.031728 - 0.034607
Targets: TP1: 0.04555, TP2: 0.059239, TP3: 0.067701
Stop Loss: 0.028602
$IDOL
Entry: 0.031728 - 0.034607
Targets: TP1: 0.04555, TP2: 0.059239, TP3: 0.067701
Stop Loss: 0.028602
$IDOL
43
·
--
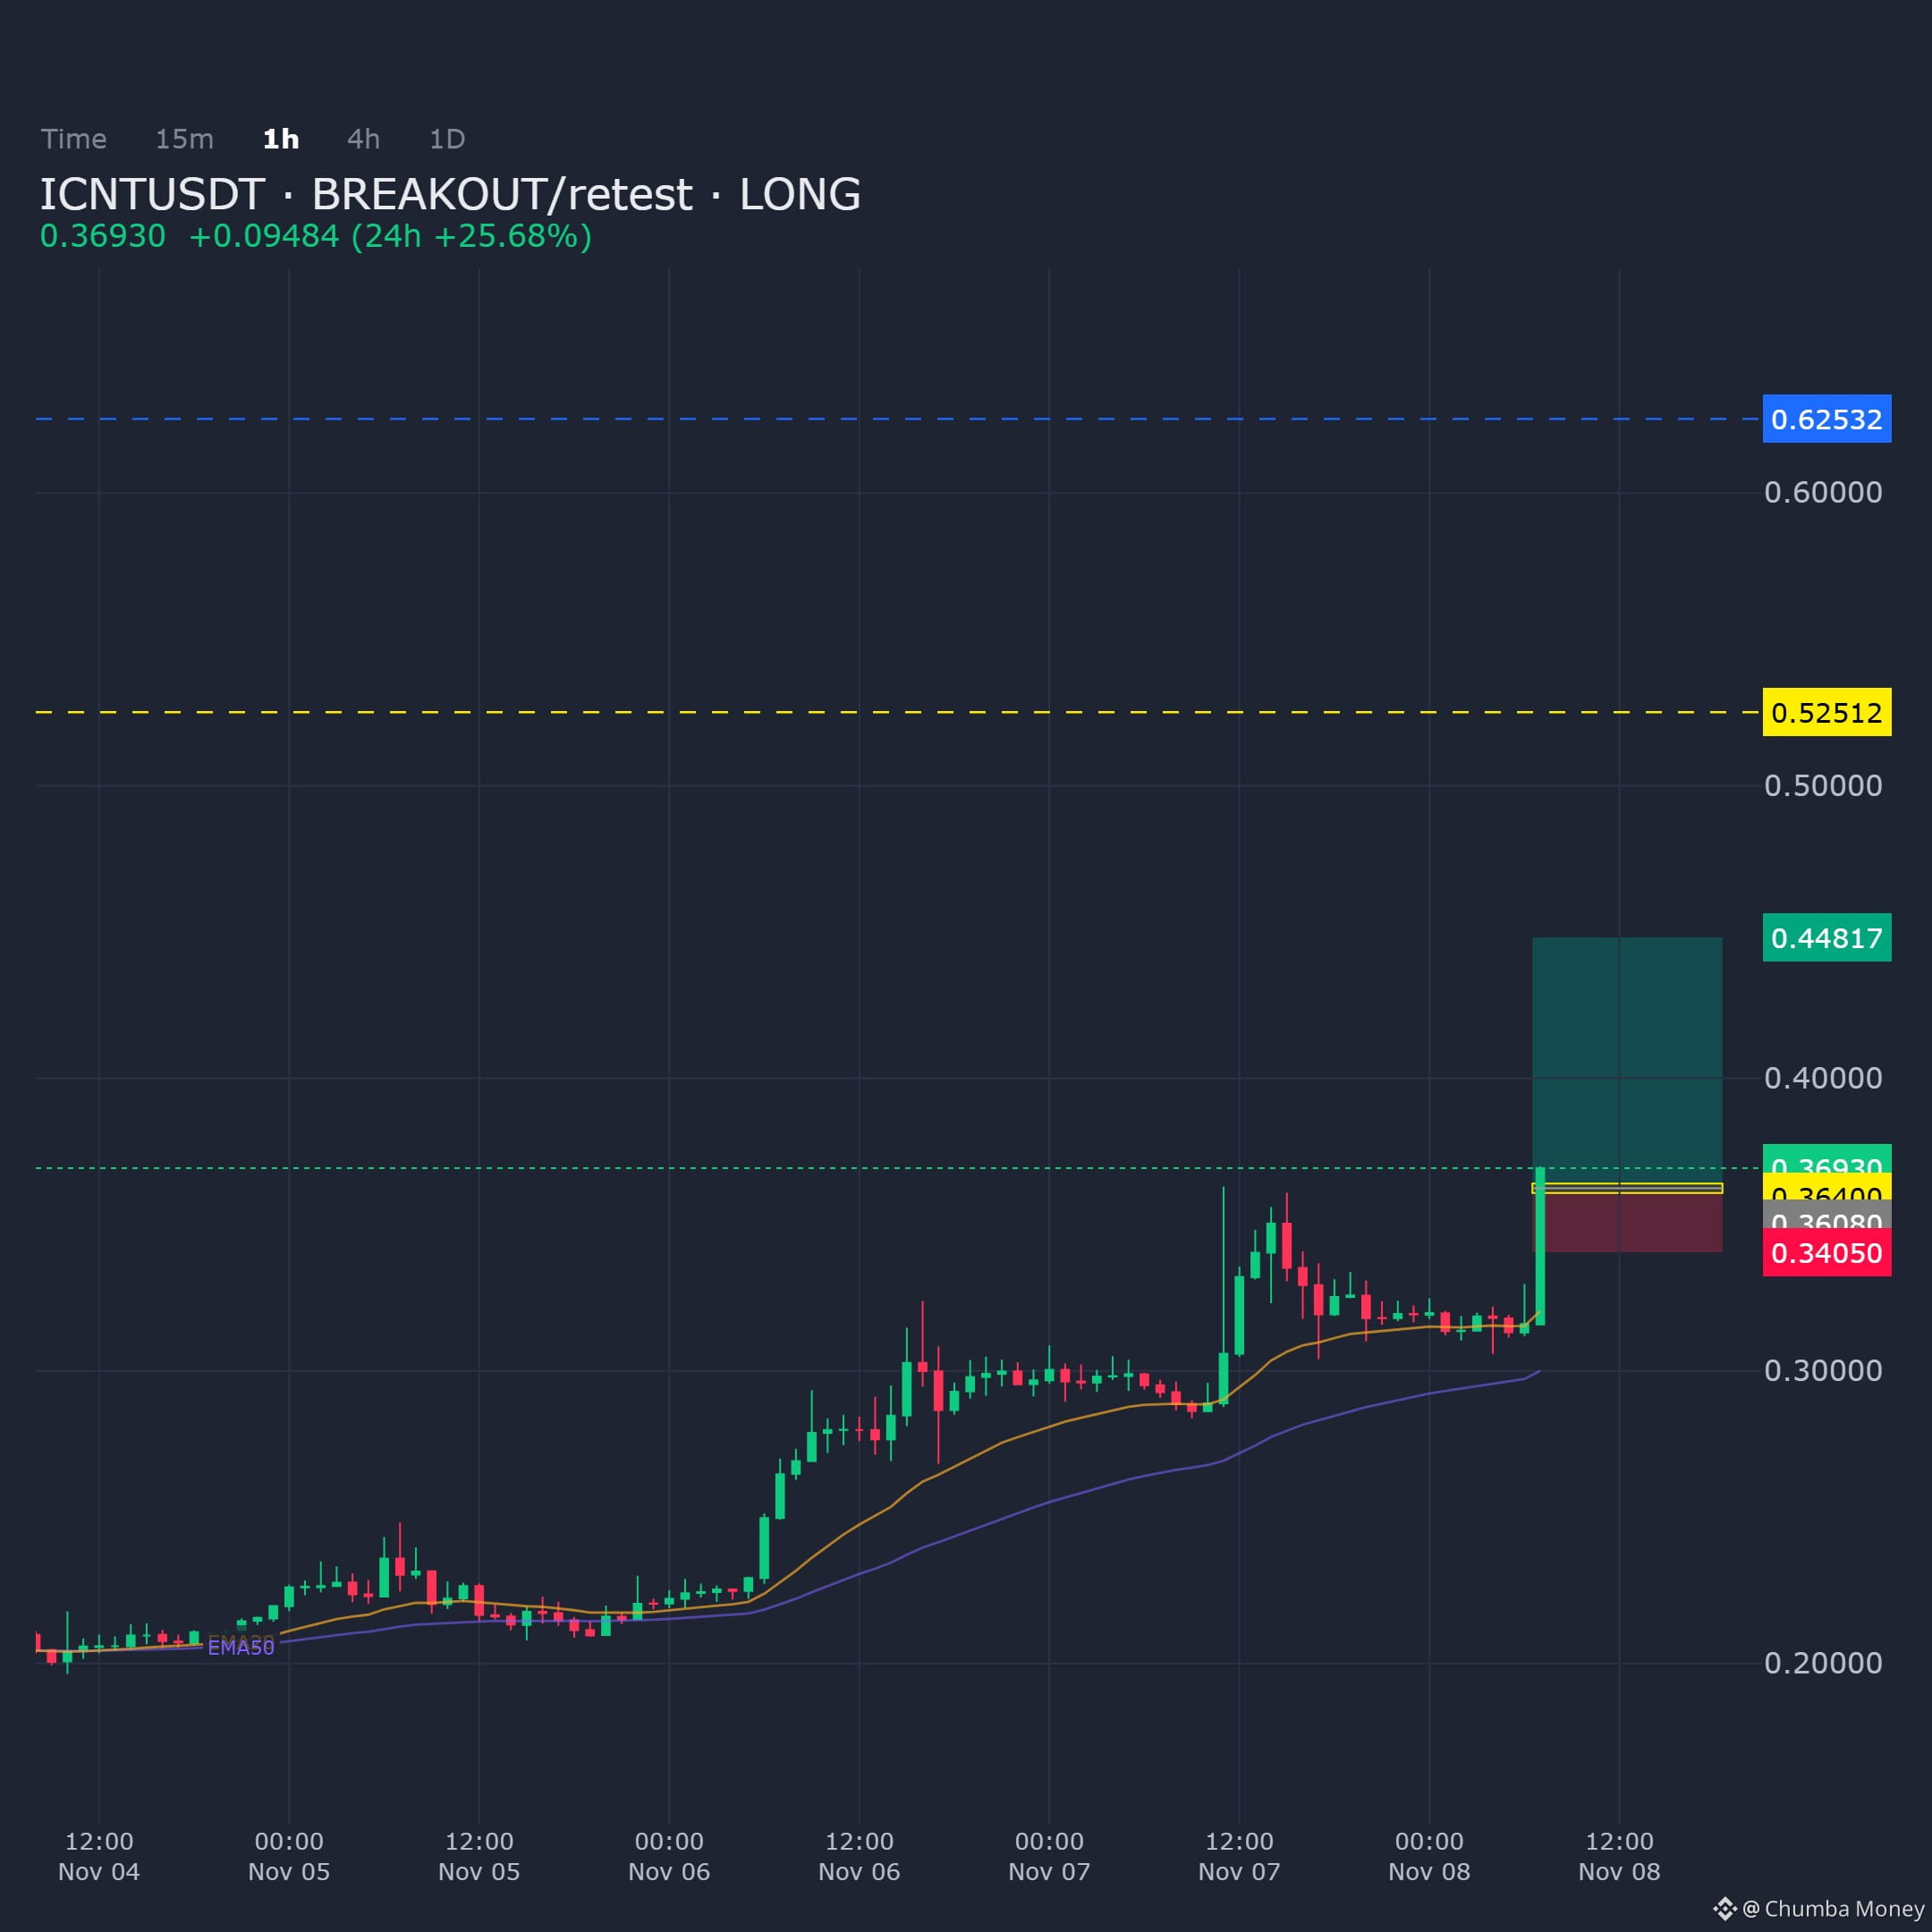
ICNTUSDT is approaching the demand zone on the 1H timeframe. The longer-term bias remains long while this area holds.
Entry: 0.360796 - 0.364002
Targets: TP1: 0.44817, TP2: 0.525124, TP3: 0.625324
Stop Loss: 0.340503
$ICNT
ICNTUSDT is approaching the demand zone on the 1H timeframe. The longer-term bias remains long while this area holds.
Entry: 0.360796 - 0.364002
Targets: TP1: 0.44817, TP2: 0.525124, TP3: 0.625324
Stop Loss: 0.340503
$ICNT
Entry: 0.360796 - 0.364002
Targets: TP1: 0.44817, TP2: 0.525124, TP3: 0.625324
Stop Loss: 0.340503
$ICNT
9
·
--
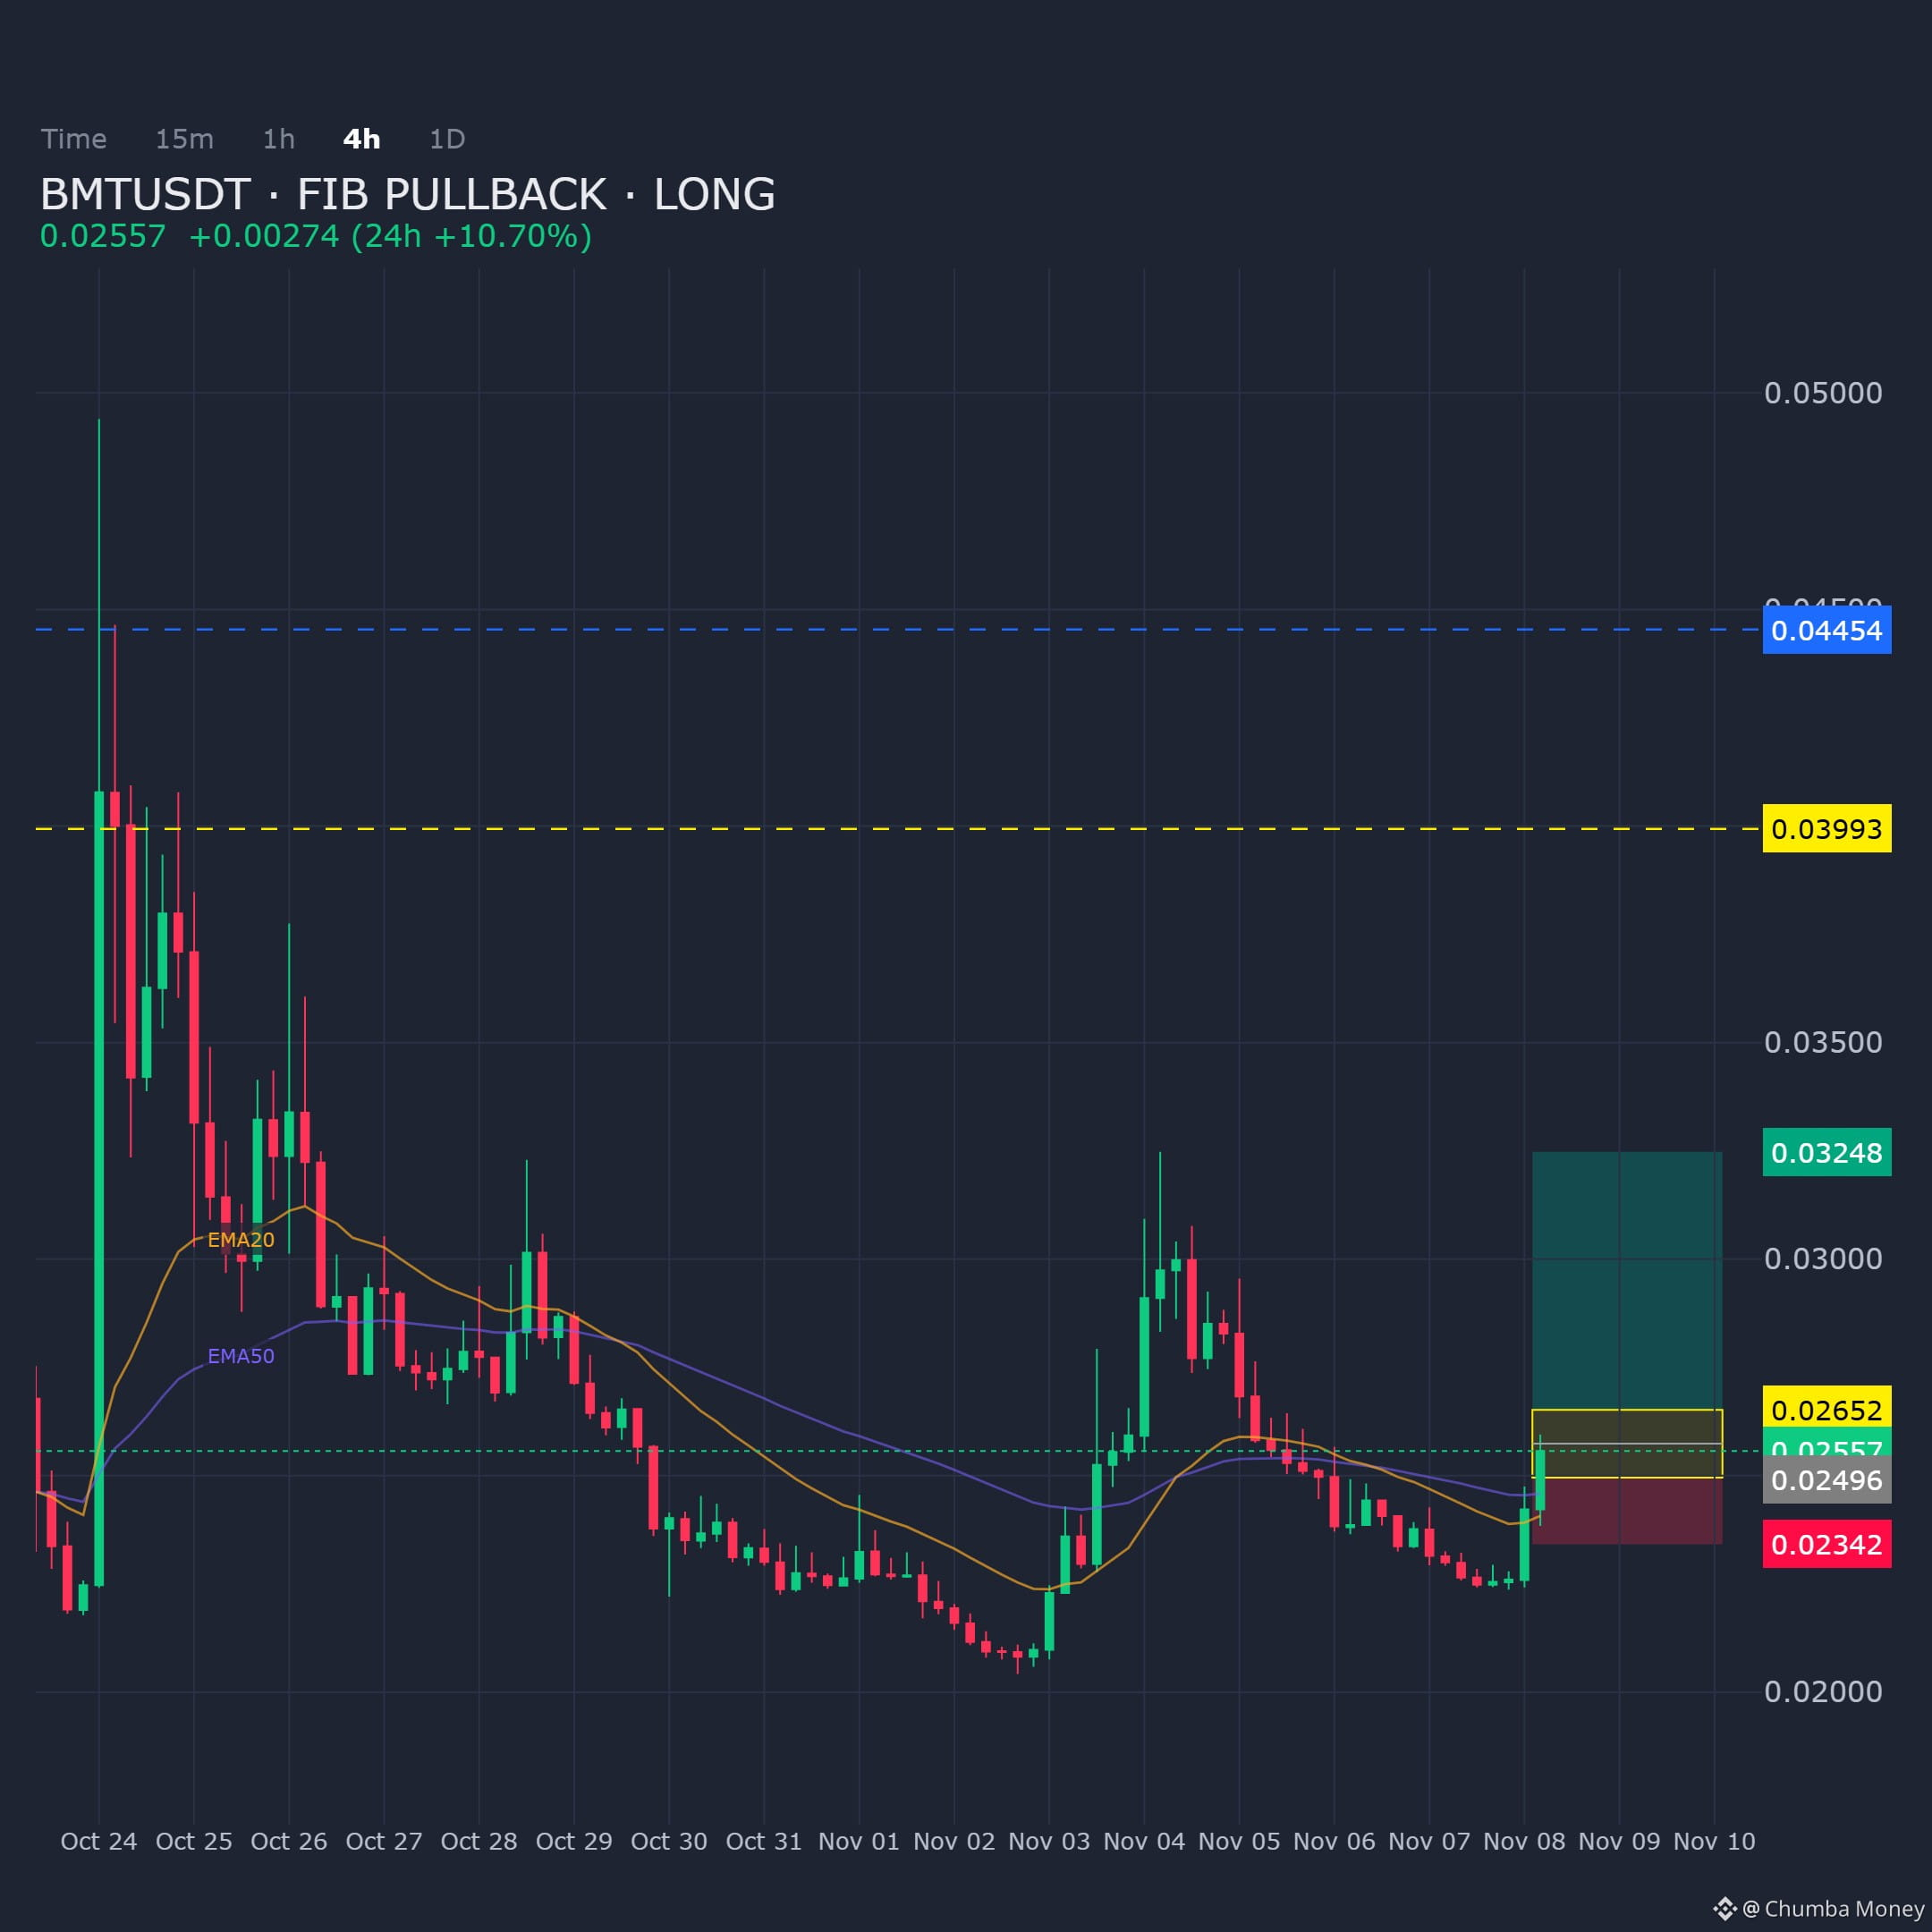
BMTUSDT on the 4H shows a Fibonacci pullback converging with support structure. Bias is long into the defined demand zone.
Entry: 0.024955 - 0.026522
Targets: TP1: 0.03248, TP2: 0.039933, TP3: 0.04454
Stop Loss: 0.023418
Wait for price to enter the zone before committing capital.
$BMT
BMTUSDT on the 4H shows a Fibonacci pullback converging with support structure. Bias is long into the defined demand zone.
Entry: 0.024955 - 0.026522
Targets: TP1: 0.03248, TP2: 0.039933, TP3: 0.04454
Stop Loss: 0.023418
Wait for price to enter the zone before committing capital.
$BMT
Entry: 0.024955 - 0.026522
Targets: TP1: 0.03248, TP2: 0.039933, TP3: 0.04454
Stop Loss: 0.023418
Wait for price to enter the zone before committing capital.
$BMT
10
·
--
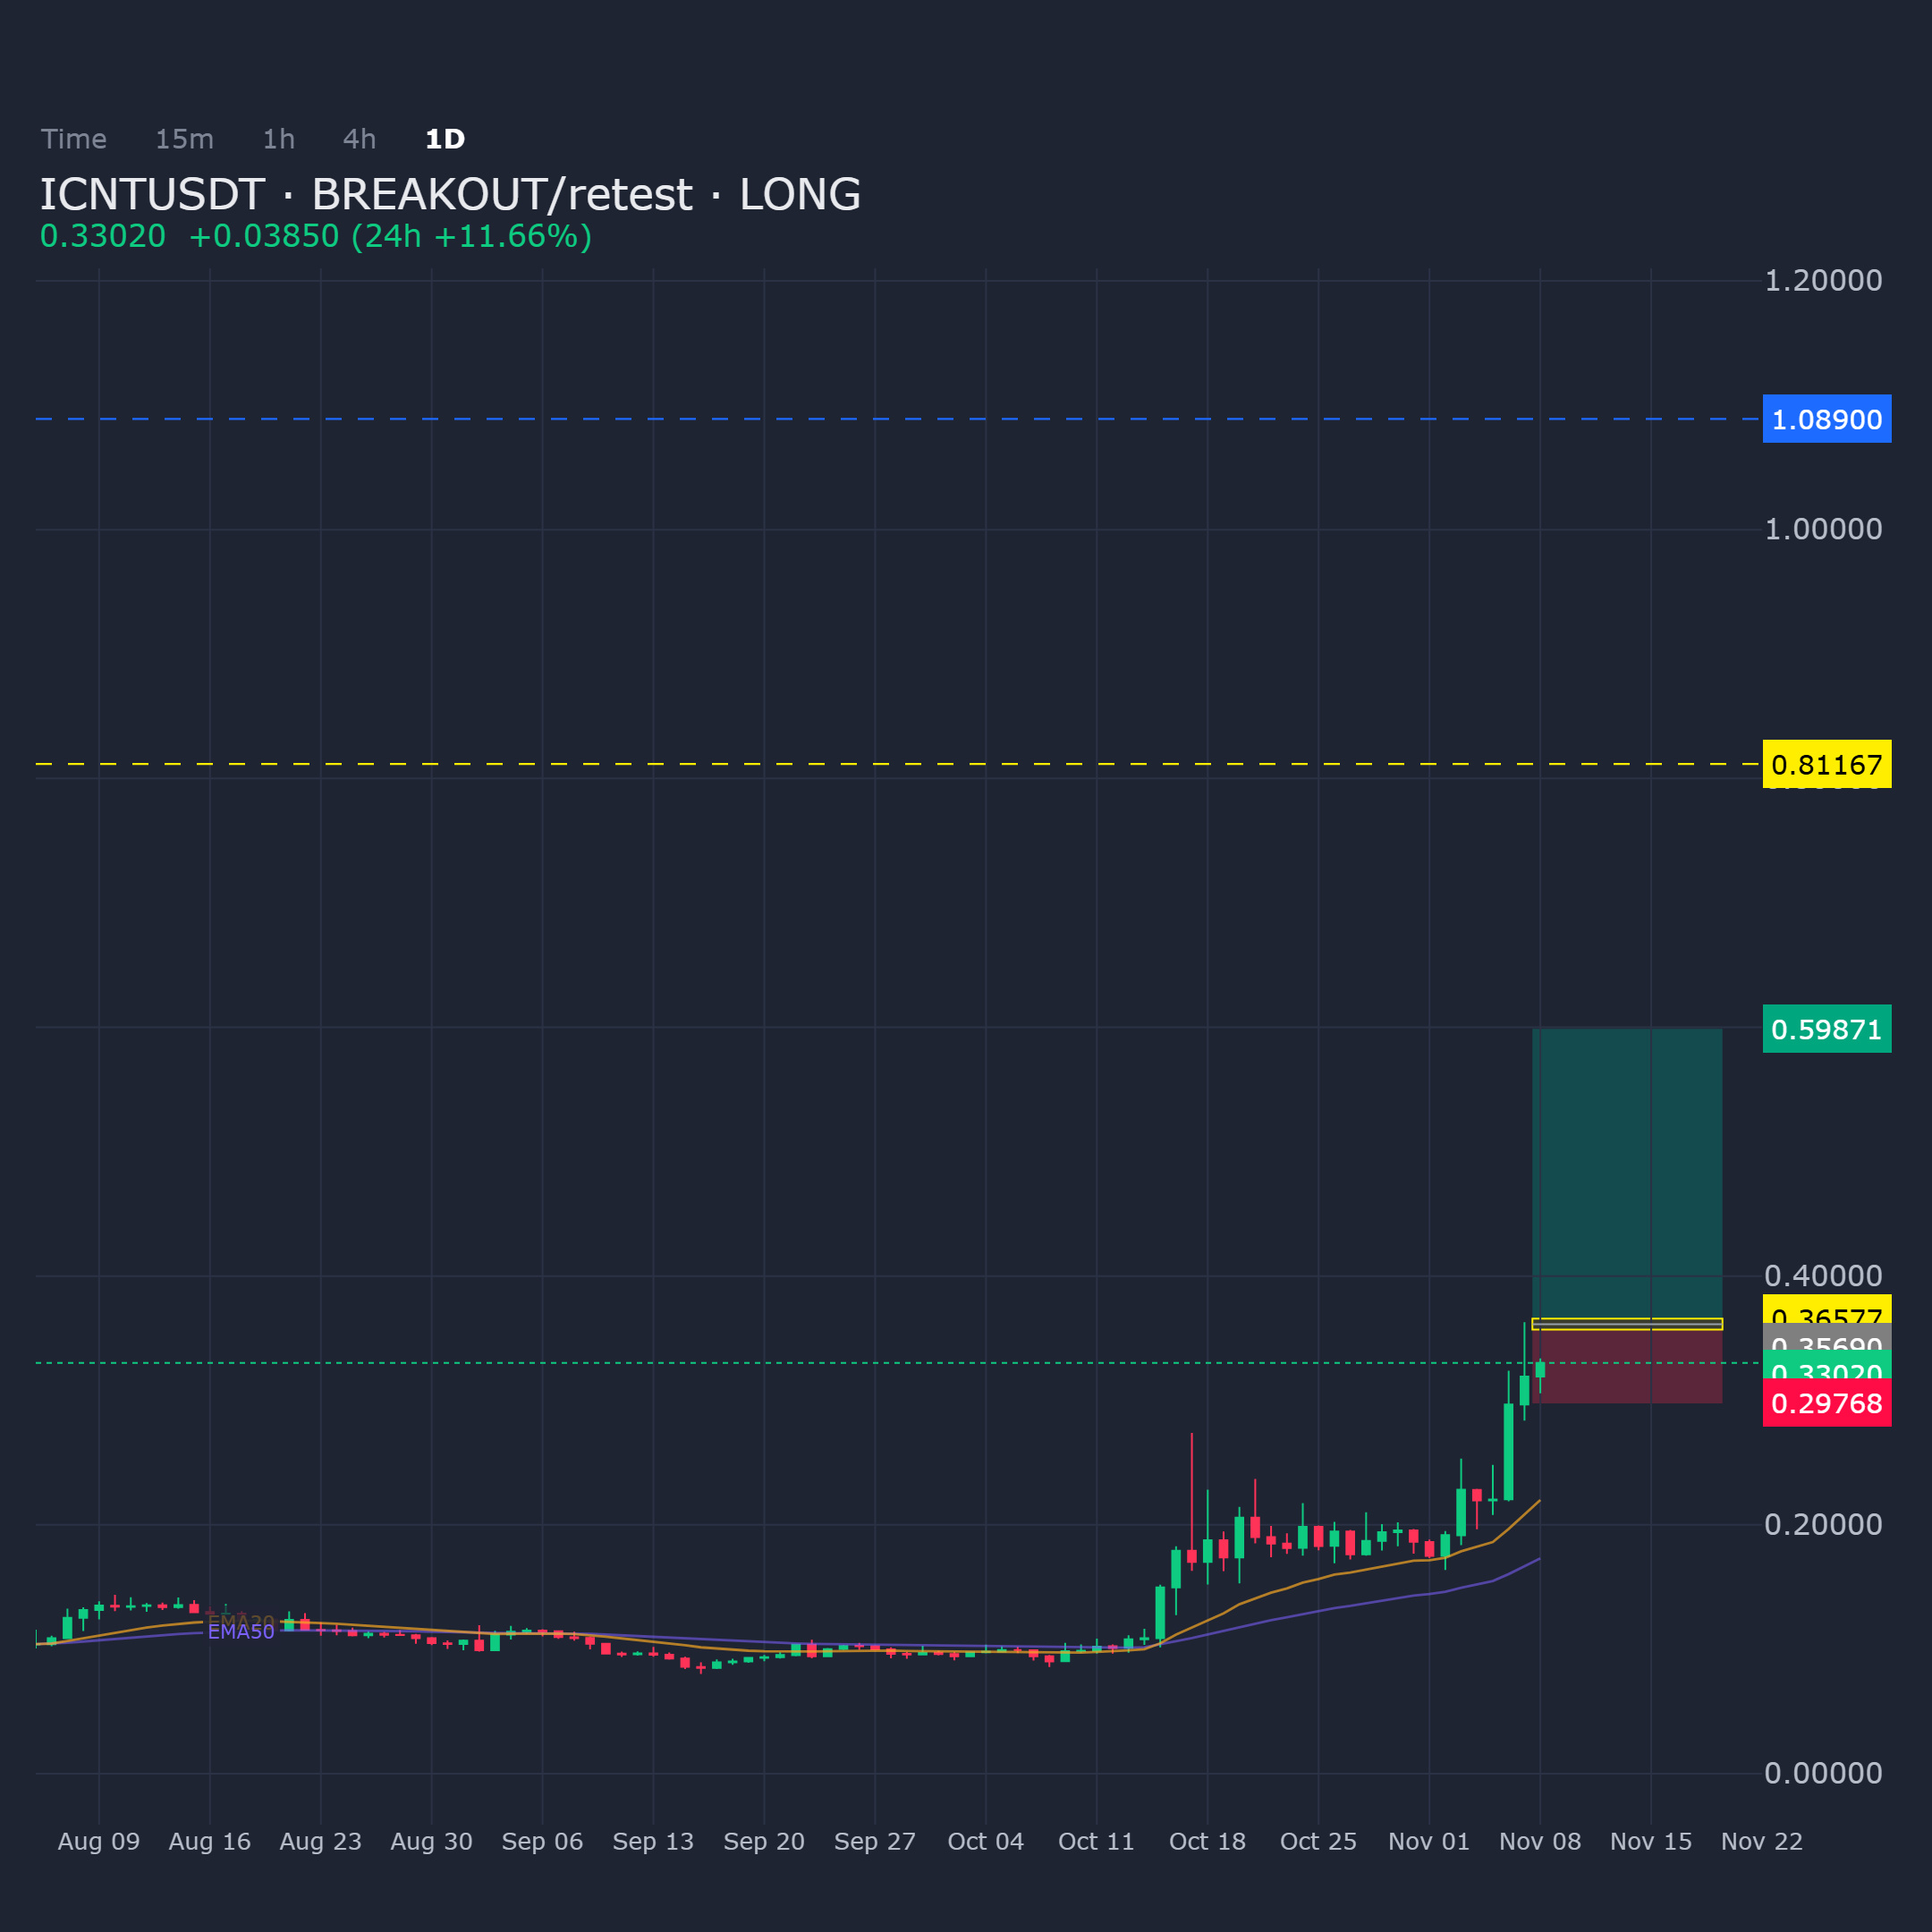
ICNTUSDT Daily BREAKOUT/retest structure. Price is entering the demand zone; long bias remains valid as long as this area holds.
Entry: 0.356899 - 0.365773
Targets: TP1: 0.598705, TP2: 0.811671, TP3: 1.089
Stop Loss: 0.297682
$ICNT
ICNTUSDT Daily BREAKOUT/retest structure. Price is entering the demand zone; long bias remains valid as long as this area holds.
Entry: 0.356899 - 0.365773
Targets: TP1: 0.598705, TP2: 0.811671, TP3: 1.089
Stop Loss: 0.297682
$ICNT
Entry: 0.356899 - 0.365773
Targets: TP1: 0.598705, TP2: 0.811671, TP3: 1.089
Stop Loss: 0.297682
$ICNT
12
·
--
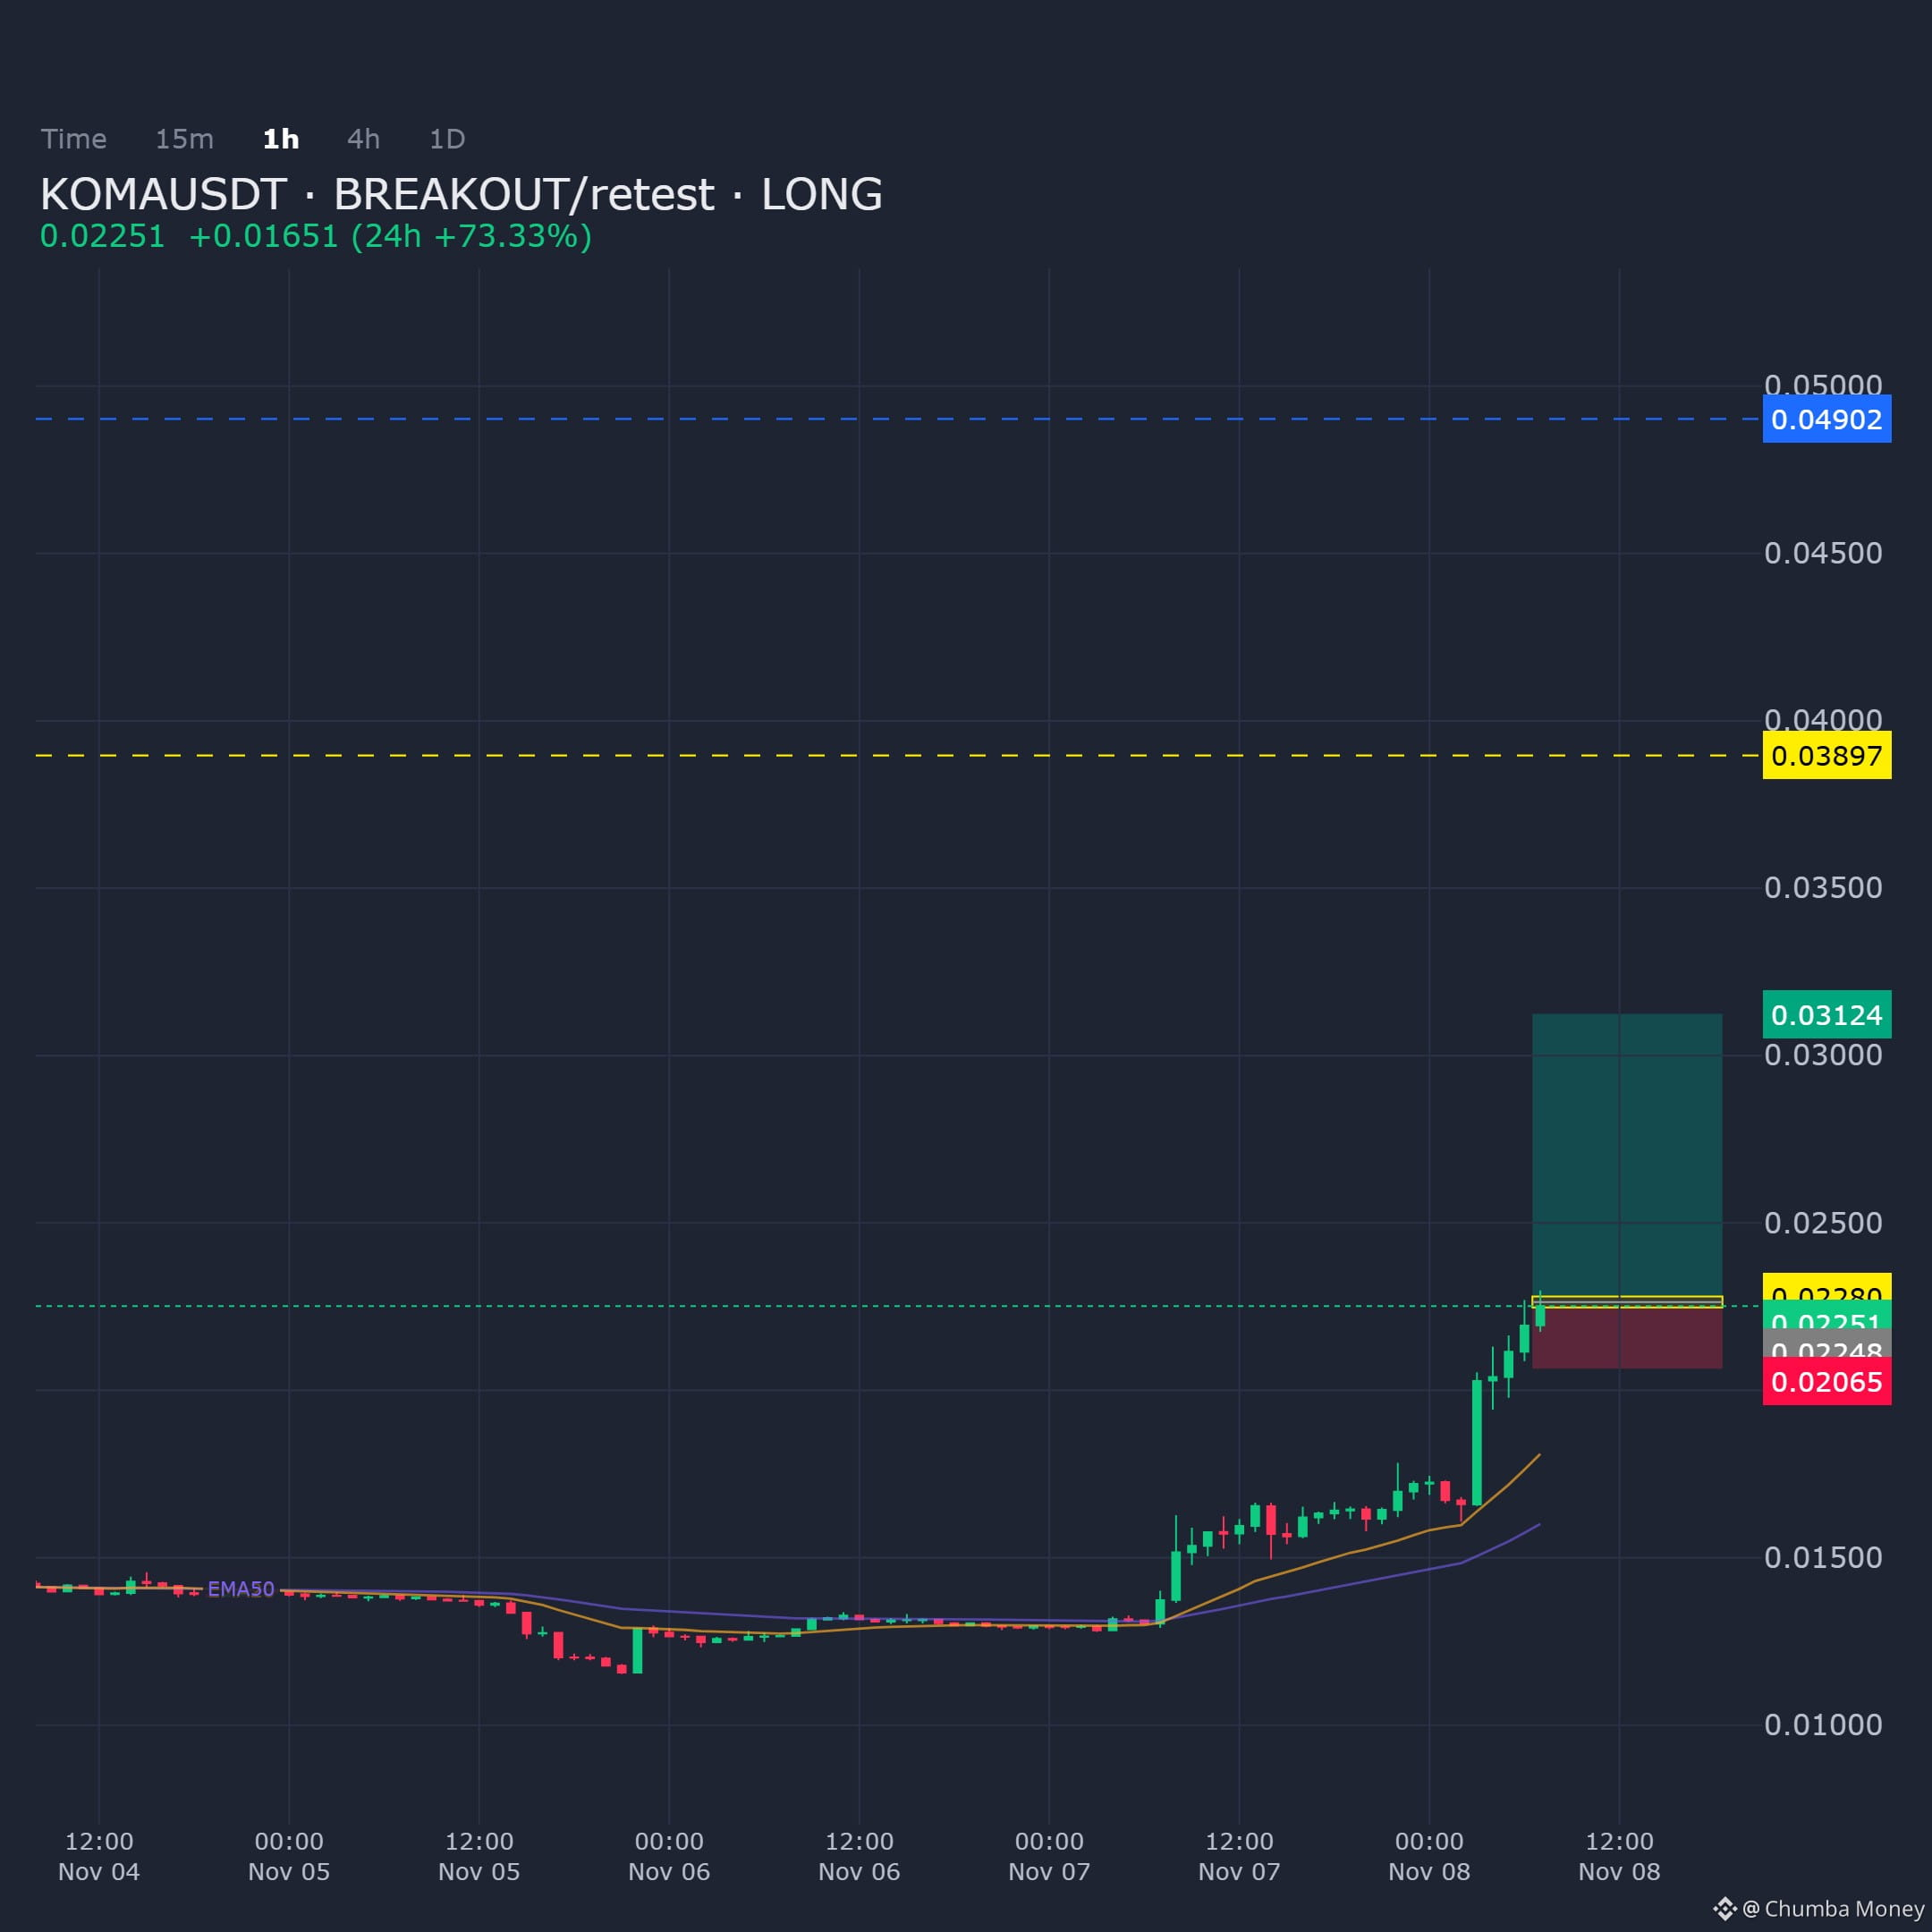
KOMAUSDT on the 1H chart: breakout/retest structure, price pulling into demand with a long bias while the zone holds.
Entry: 0.022479 - 0.022801
Targets: TP1: 0.031245, TP2: 0.038966, TP3: 0.049019
Stop Loss: 0.020646
$KOMA
KOMAUSDT on the 1H chart: breakout/retest structure, price pulling into demand with a long bias while the zone holds.
Entry: 0.022479 - 0.022801
Targets: TP1: 0.031245, TP2: 0.038966, TP3: 0.049019
Stop Loss: 0.020646
$KOMA
Entry: 0.022479 - 0.022801
Targets: TP1: 0.031245, TP2: 0.038966, TP3: 0.049019
Stop Loss: 0.020646
$KOMA
26
·
--
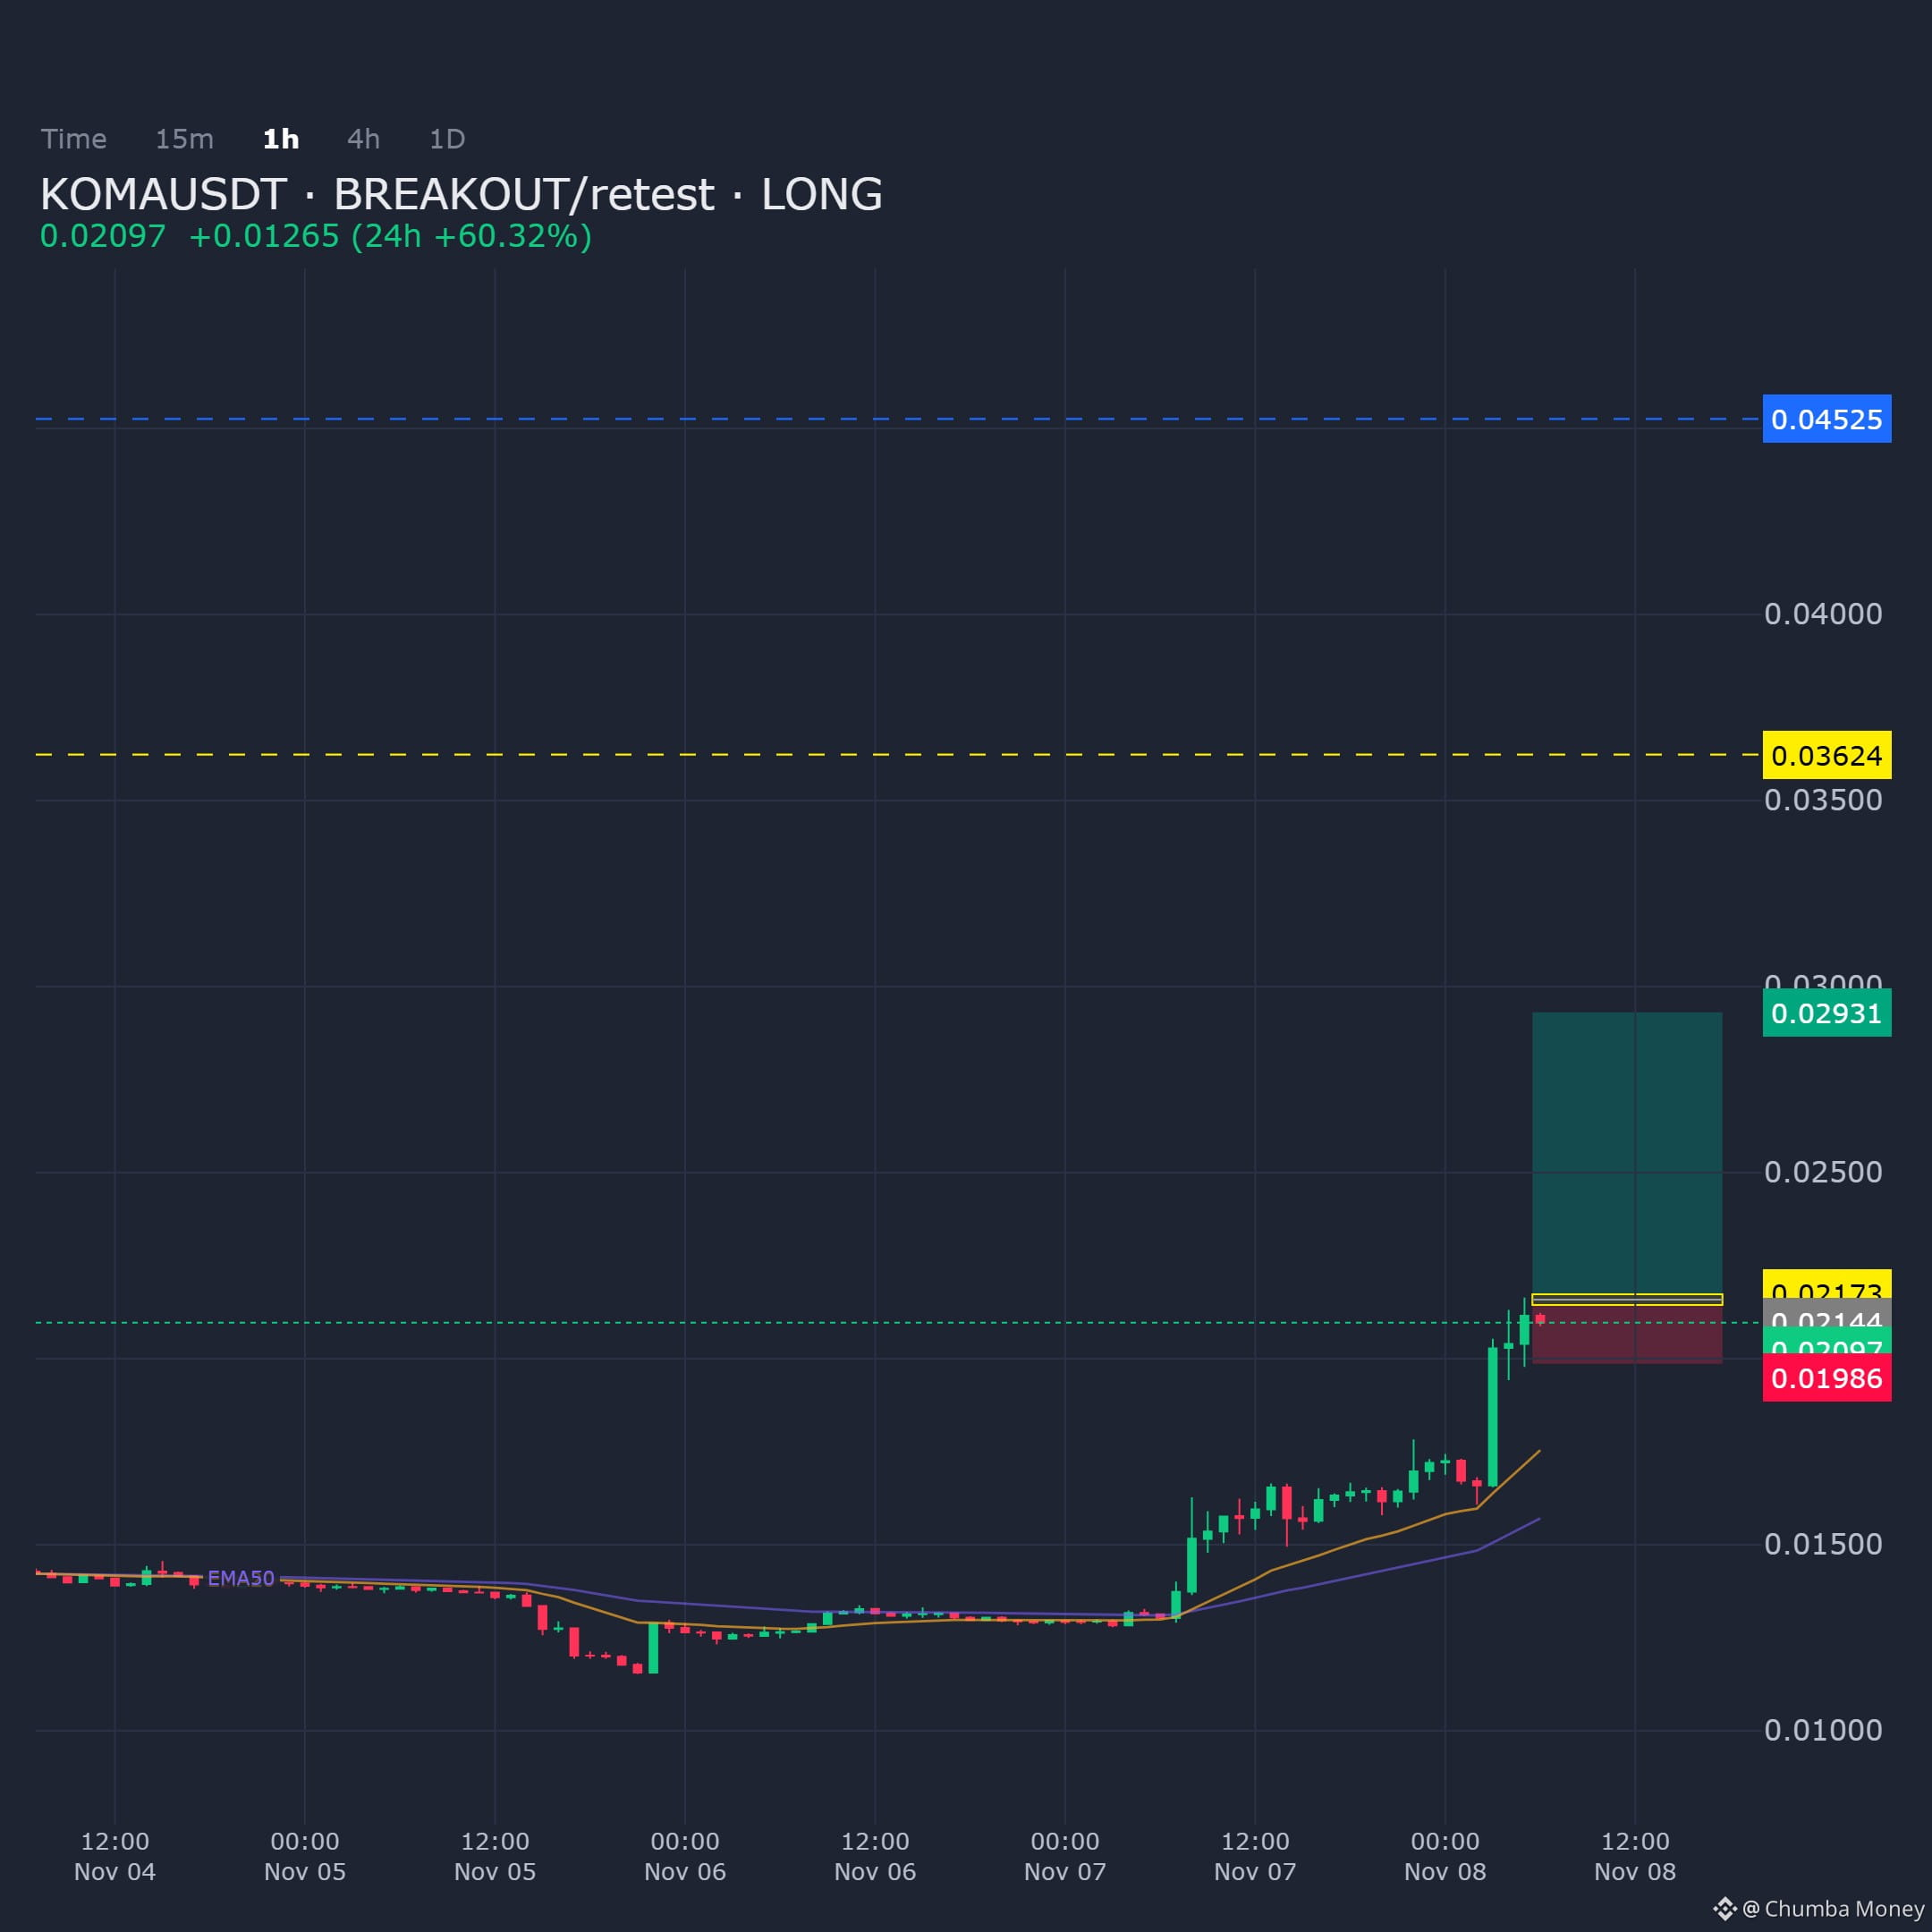
KOMAUSDT on the 1H chart shows price retreating into a demand zone. The long bias remains intact as long as this area continues to hold.
Entry: 0.021445 - 0.021733
Targets: TP1: 0.029309, TP2: 0.036236, TP3: 0.045255
Stop Loss: 0.019862
$KOMA
KOMAUSDT on the 1H chart shows price retreating into a demand zone. The long bias remains intact as long as this area continues to hold.
Entry: 0.021445 - 0.021733
Targets: TP1: 0.029309, TP2: 0.036236, TP3: 0.045255
Stop Loss: 0.019862
$KOMA
Entry: 0.021445 - 0.021733
Targets: TP1: 0.029309, TP2: 0.036236, TP3: 0.045255
Stop Loss: 0.019862
$KOMA
25
·
--

ලිපිය
MEXC TREASURY ACTION AND BINANCE LEADERSHIP SHIFT SUGGEST REGULATORY RISK IS UNDERPRICEDObservation: Total crypto market cap fell 2.66% over 24 hours while BTC dominance held at 59.33%. BTC traded at $75,787, down 0.23% in 24 hours and 2.55% over seven days. ETH was $2,234.91, down 0.55% in 24 hours. SOL was $89.23, down 0.96% in 24 hours and nearly 7% over seven days. Bitcoin ETFs recorded a $1.28 billion outflow week, flipping negative for 2026, the worst since June. The U.S. Treasury moved to cut off MEXC over $16 billion in alleged illicit flows. Binance CFO departed nine days after a record hack, though co-CEO Yi He said the transition was planned six months ago. Separately, every Magnificent Seven stock opted out of the planned OKX-ICE venue. Interpretation: The market is not pricing these events as a single regime shift. MEXC faces a direct Treasury action tied to alleged illicit flows, which is a counterparty and access risk for users of that exchange. Binance leadership change so soon after a record hack raises operational questions regardless of the stated timeline. ETF outflows suggest institutional demand is weakening or rotating, not strengthening. Solana’s 7-day underperformance relative to BTC and ETH indicates risk appetite is narrowing. Falsifiers: If BTC ETF flows turn positive next week, if MEXC reaches a settlement that preserves user access, or if Binance confirms hack remediation and customer funds are unaffected, the risk narrative weakens. If BTC dominance breaks above 60% while alt volumes keep falling, capital is rotating to safety rather than pricing systemic regulatory risk. Takeaway: Regulatory and exchange-specific risks appear underpriced relative to price action. Watch ETF flows, MEXC user migration, and Binance on-chain stability as the next evidence layer.
MEXC TREASURY ACTION AND BINANCE LEADERSHIP SHIFT SUGGEST REGULATORY RISK IS UNDERPRICED
Observation: Total crypto market cap fell 2.66% over 24 hours while BTC dominance held at 59.33%. BTC traded at $75,787, down 0.23% in 24 hours and 2.55% over seven days. ETH was $2,234.91, down 0.55% in 24 hours. SOL was $89.23, down 0.96% in 24 hours and nearly 7% over seven days. Bitcoin ETFs recorded a $1.28 billion outflow week, flipping negative for 2026, the worst since June. The U.S. Treasury moved to cut off MEXC over $16 billion in alleged illicit flows. Binance CFO departed nine days after a record hack, though co-CEO Yi He said the transition was planned six months ago. Separately, every Magnificent Seven stock opted out of the planned OKX-ICE venue. Interpretation: The market is not pricing these events as a single regime shift. MEXC faces a direct Treasury action tied to alleged illicit flows, which is a counterparty and access risk for users of that exchange. Binance leadership change so soon after a record hack raises operational questions regardless of the stated timeline. ETF outflows suggest institutional demand is weakening or rotating, not strengthening. Solana’s 7-day underperformance relative to BTC and ETH indicates risk appetite is narrowing. Falsifiers: If BTC ETF flows turn positive next week, if MEXC reaches a settlement that preserves user access, or if Binance confirms hack remediation and customer funds are unaffected, the risk narrative weakens. If BTC dominance breaks above 60% while alt volumes keep falling, capital is rotating to safety rather than pricing systemic regulatory risk. Takeaway: Regulatory and exchange-specific risks appear underpriced relative to price action. Watch ETF flows, MEXC user migration, and Binance on-chain stability as the next evidence layer.
12
·
--
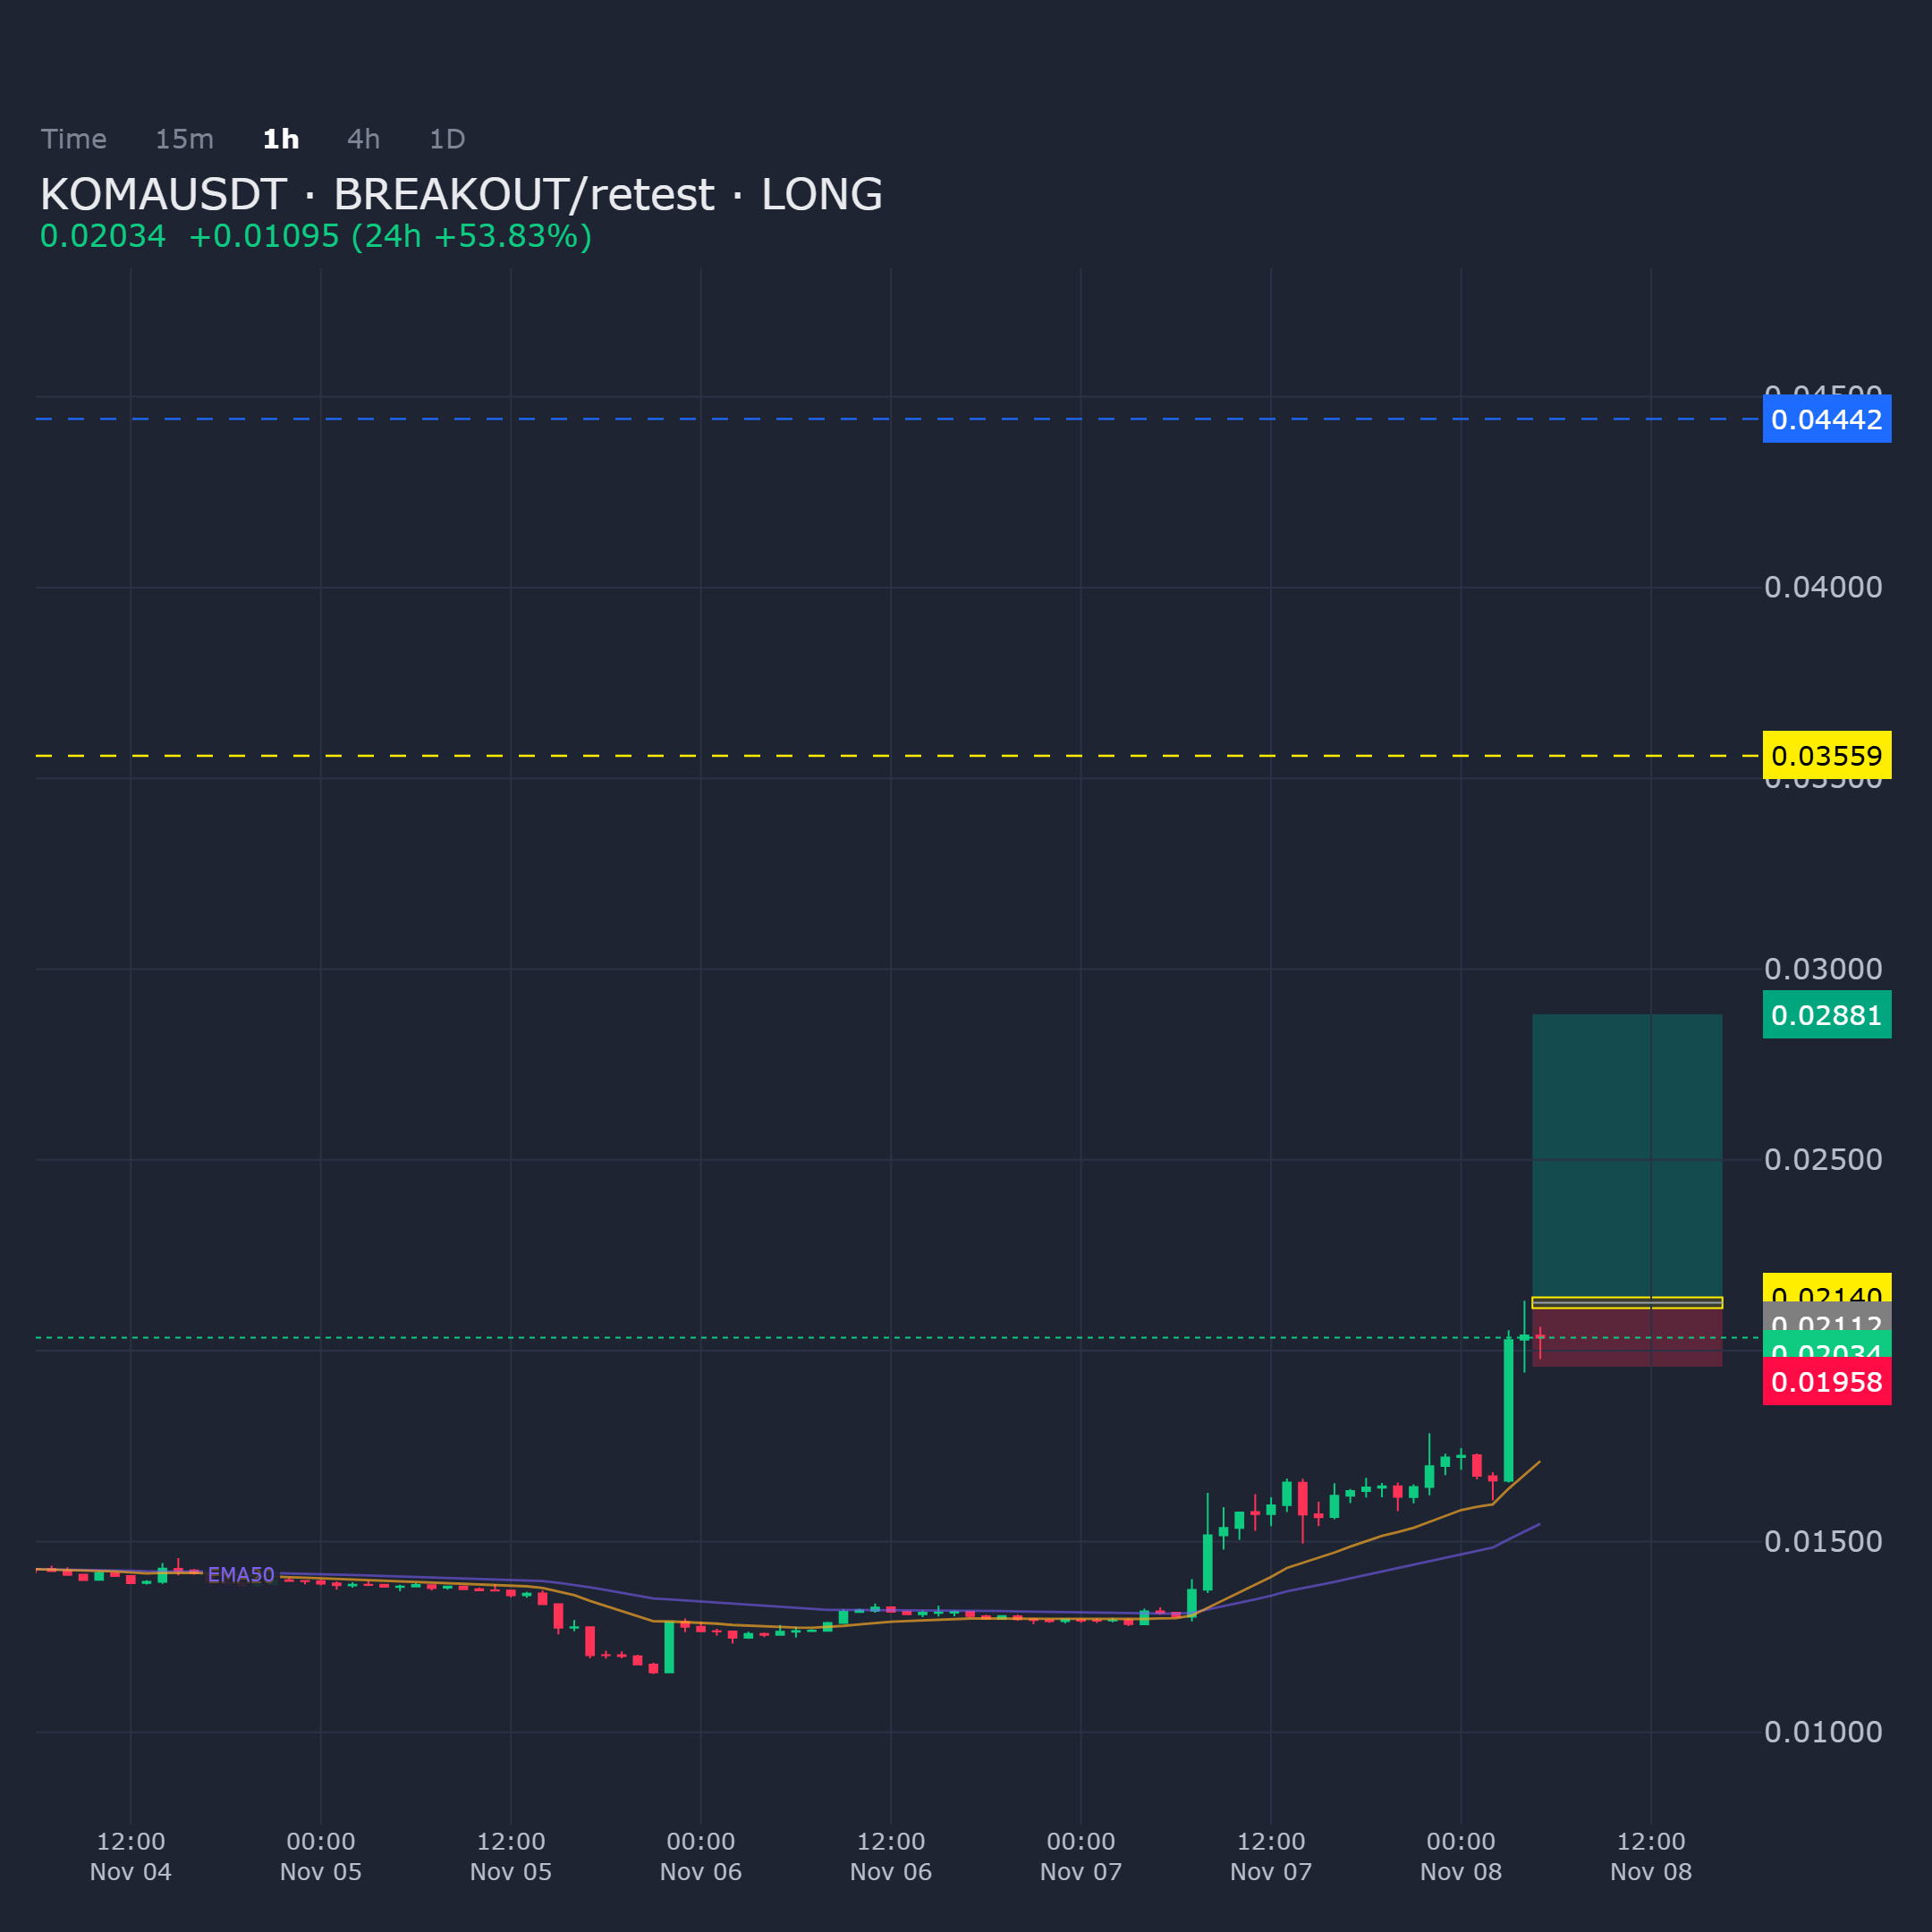
KOMAUSDT 1H structure shows a pending breakout/retest setup at the demand zone; bias remains long while support holds.
Entry: 0.021116 - 0.021398
Targets: TP1: 0.028813, TP2: 0.035592, TP3: 0.044419
Stop Loss: 0.019579
$KOMA
KOMAUSDT 1H structure shows a pending breakout/retest setup at the demand zone; bias remains long while support holds.
Entry: 0.021116 - 0.021398
Targets: TP1: 0.028813, TP2: 0.035592, TP3: 0.044419
Stop Loss: 0.019579
$KOMA
Entry: 0.021116 - 0.021398
Targets: TP1: 0.028813, TP2: 0.035592, TP3: 0.044419
Stop Loss: 0.019579
$KOMA
17
·
--
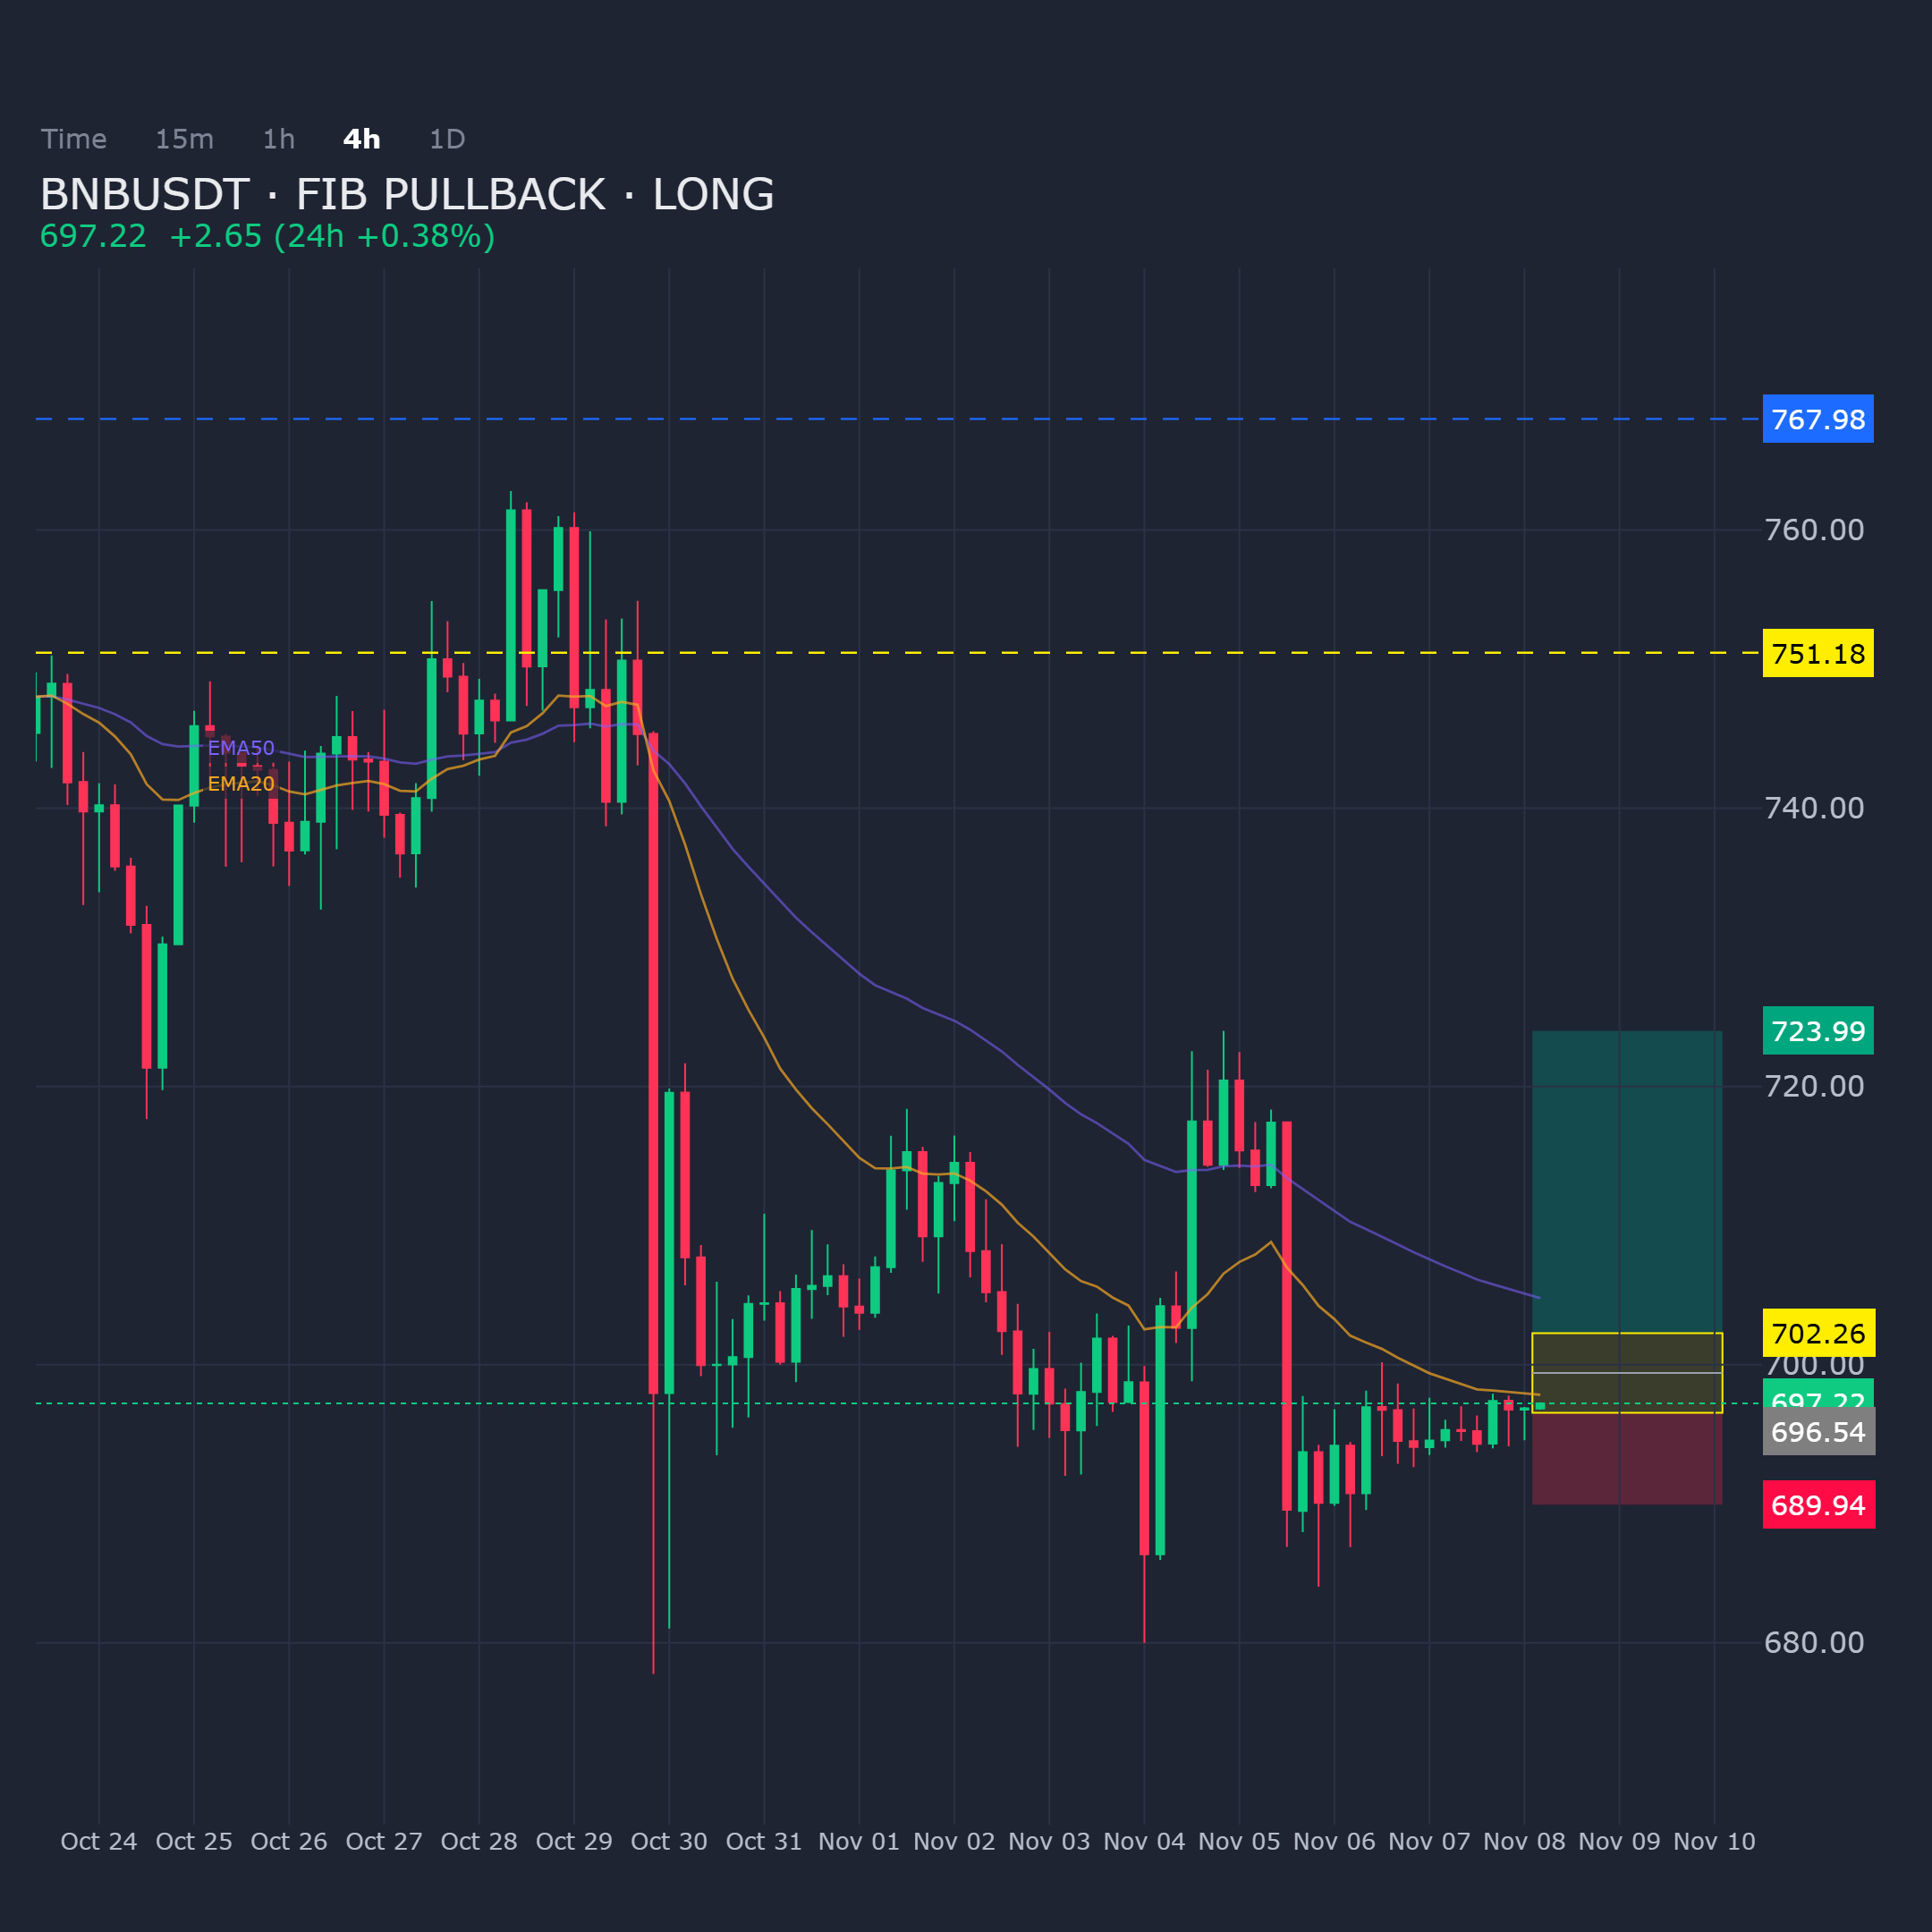
BNBUSDT on the 4H is pulling back into a Fibonacci level with bullish bias still intact. The setup is strictly long if price holds this demand zone.
Entry: 696.54 - 702.26
Targets: TP1: 723.99, TP2: 751.18, TP3: 767.98
Stop Loss: 689.94
$BNB
BNBUSDT on the 4H is pulling back into a Fibonacci level with bullish bias still intact. The setup is strictly long if price holds this demand zone.
Entry: 696.54 - 702.26
Targets: TP1: 723.99, TP2: 751.18, TP3: 767.98
Stop Loss: 689.94
$BNB
Entry: 696.54 - 702.26
Targets: TP1: 723.99, TP2: 751.18, TP3: 767.98
Stop Loss: 689.94
$BNB
1
44
·
--
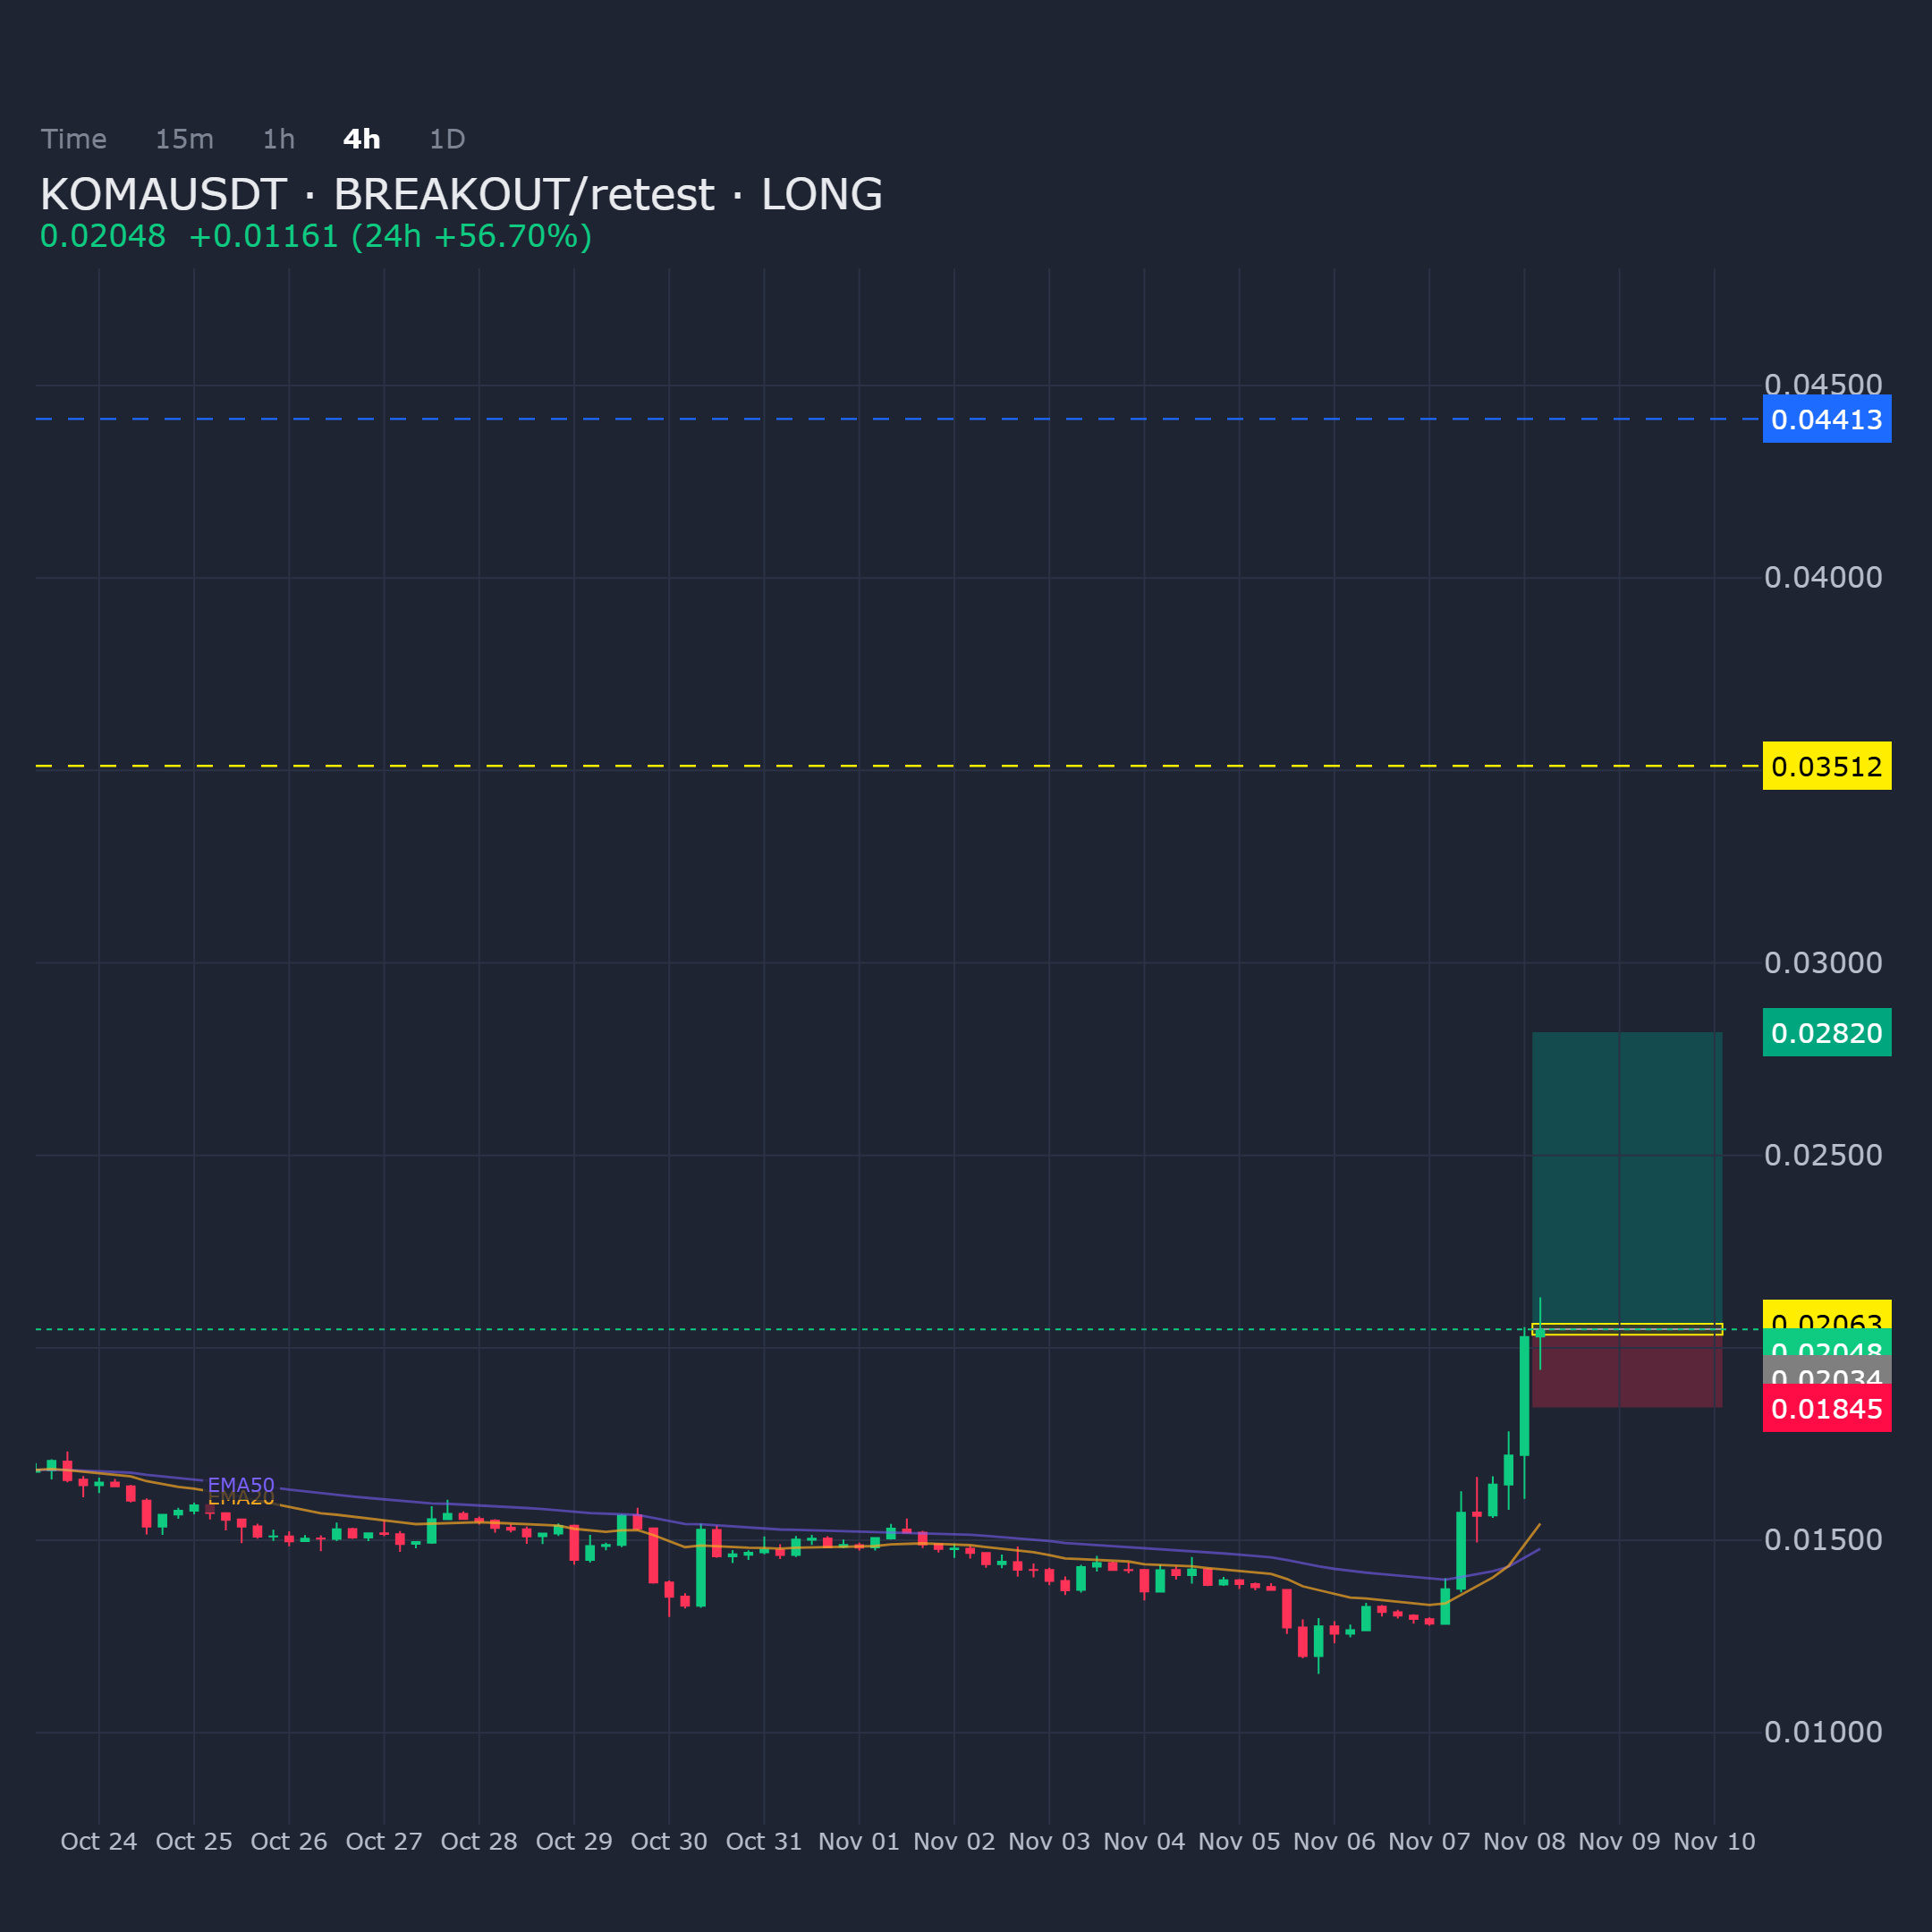
KOMAUSDT on the 4H timeframe is approaching a demand zone following a breakout setup. The bullish structure remains intact as long as this area continues to hold support.
Entry: 0.020339 - 0.020627
Targets: TP1: 0.028197, TP2: 0.035118, TP3: 0.04413
Stop Loss: 0.018454
Wait for the retest into demand before committing capital; manage risk strictly at the invalidation level.
$KOMA
KOMAUSDT on the 4H timeframe is approaching a demand zone following a breakout setup. The bullish structure remains intact as long as this area continues to hold support.
Entry: 0.020339 - 0.020627
Targets: TP1: 0.028197, TP2: 0.035118, TP3: 0.04413
Stop Loss: 0.018454
Wait for the retest into demand before committing capital; manage risk strictly at the invalidation level.
$KOMA
Entry: 0.020339 - 0.020627
Targets: TP1: 0.028197, TP2: 0.035118, TP3: 0.04413
Stop Loss: 0.018454
Wait for the retest into demand before committing capital; manage risk strictly at the invalidation level.
$KOMA
29
·
--
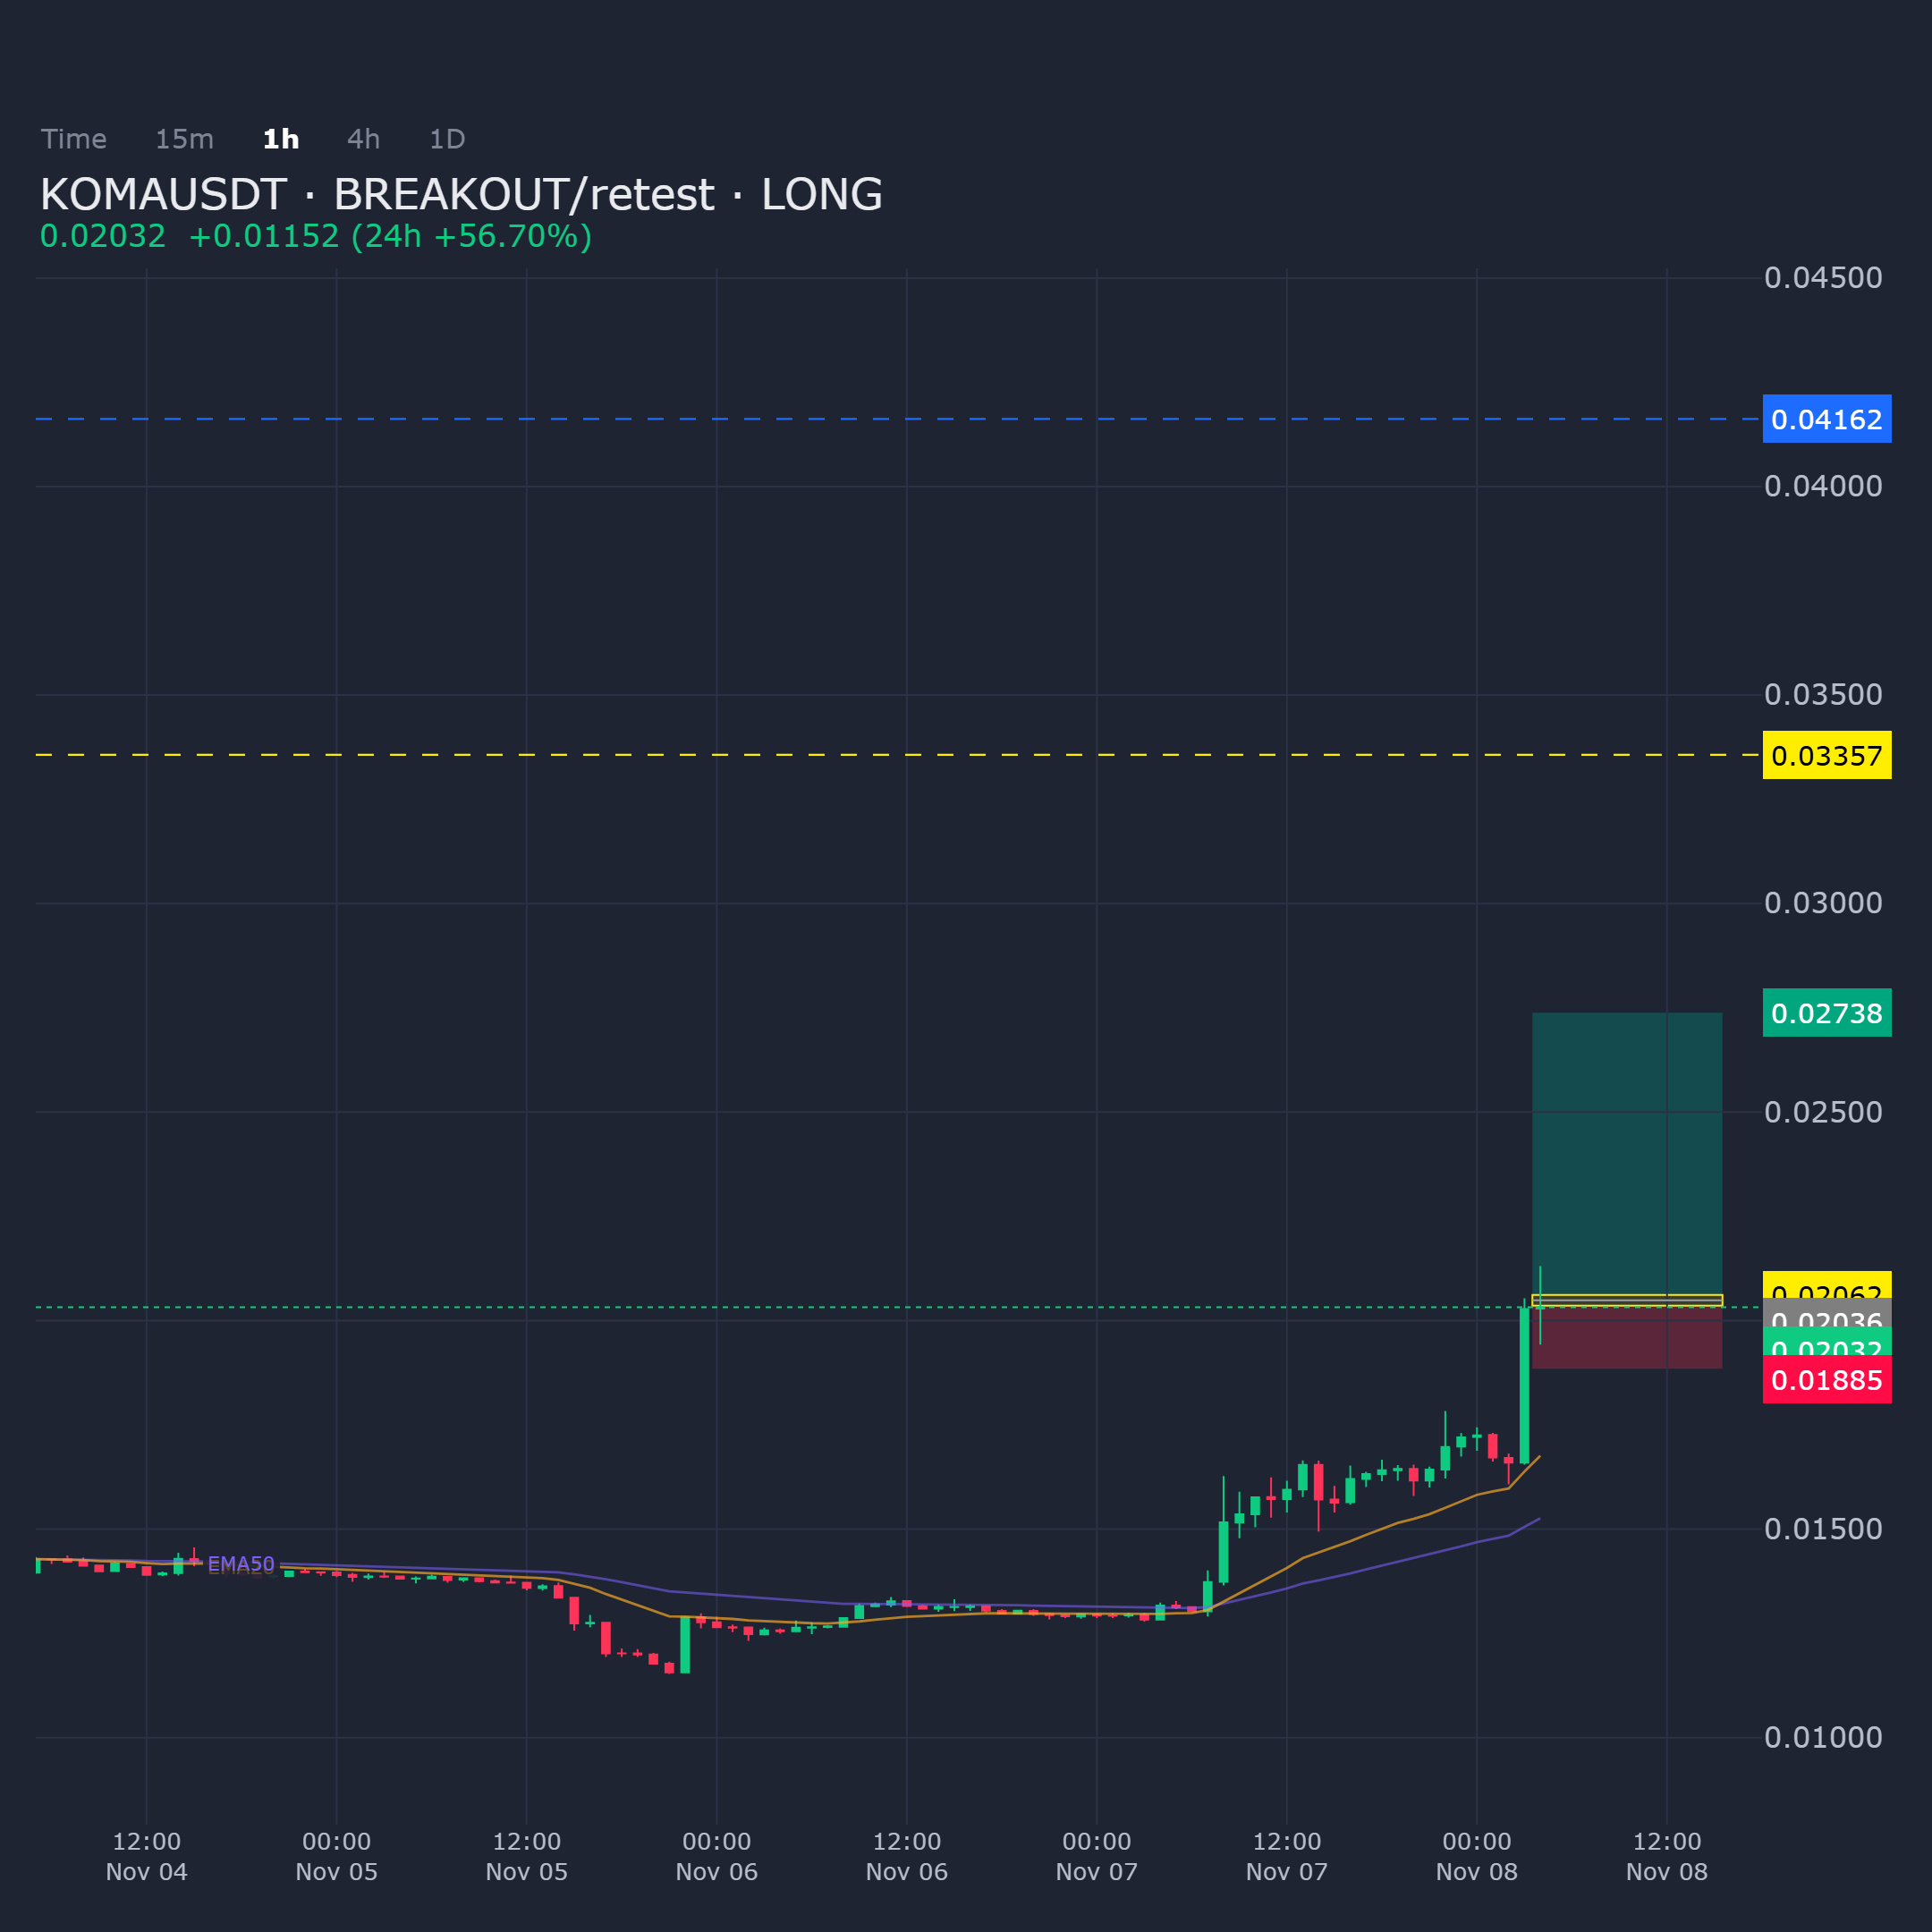
KOMAUSDT on the 1H is approaching a demand zone after the breakout. Bias remains long provided this area holds as support.
Entry: 0.02036 - 0.020618
Targets: TP1: 0.027383, TP2: 0.033568, TP3: 0.041622
Stop Loss: 0.018846
$KOMA
KOMAUSDT on the 1H is approaching a demand zone after the breakout. Bias remains long provided this area holds as support.
Entry: 0.02036 - 0.020618
Targets: TP1: 0.027383, TP2: 0.033568, TP3: 0.041622
Stop Loss: 0.018846
$KOMA
Entry: 0.02036 - 0.020618
Targets: TP1: 0.027383, TP2: 0.033568, TP3: 0.041622
Stop Loss: 0.018846
$KOMA
14
·
--
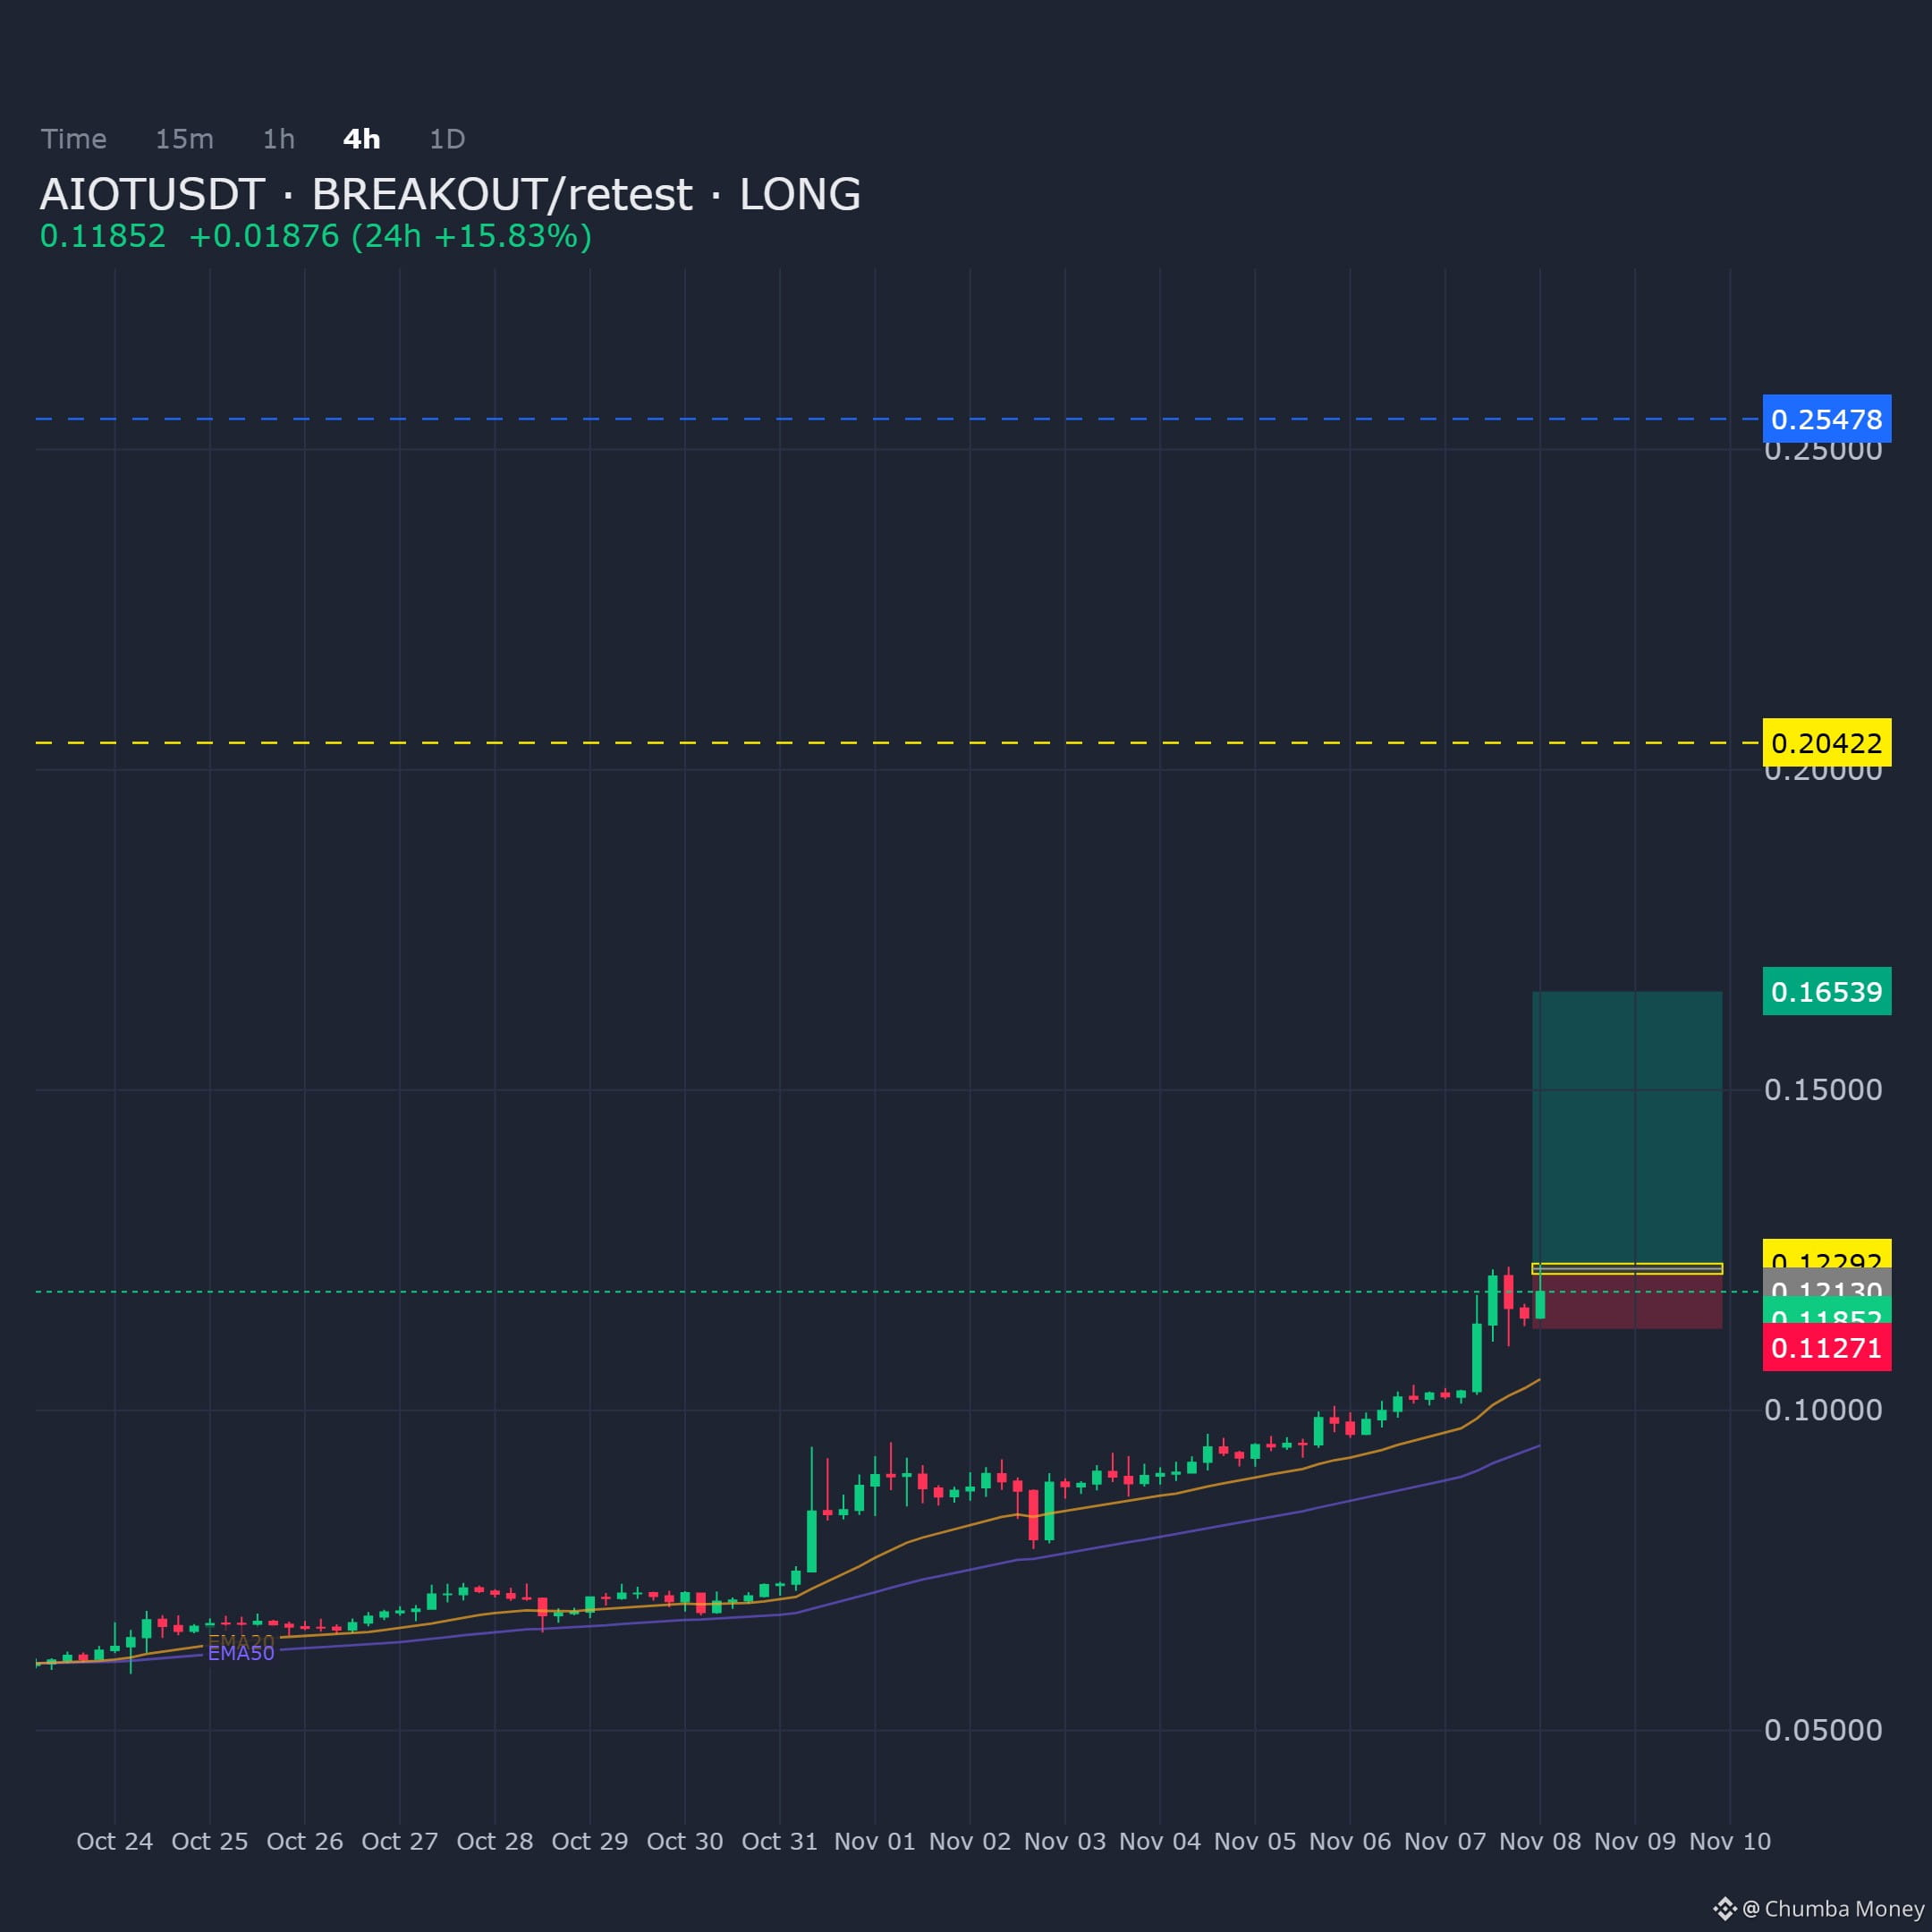
AIOTUSDT on the 4H timeframe shows confluence aligned for a breakout and retest structure with a long bias, currently testing the demand zone.
Entry: 0.121298 - 0.122916
Targets: TP1: 0.165386, TP2: 0.204216, TP3: 0.254776
Stop Loss: 0.112713
$AIOT
AIOTUSDT on the 4H timeframe shows confluence aligned for a breakout and retest structure with a long bias, currently testing the demand zone.
Entry: 0.121298 - 0.122916
Targets: TP1: 0.165386, TP2: 0.204216, TP3: 0.254776
Stop Loss: 0.112713
$AIOT
Entry: 0.121298 - 0.122916
Targets: TP1: 0.165386, TP2: 0.204216, TP3: 0.254776
Stop Loss: 0.112713
$AIOT
30
·
--
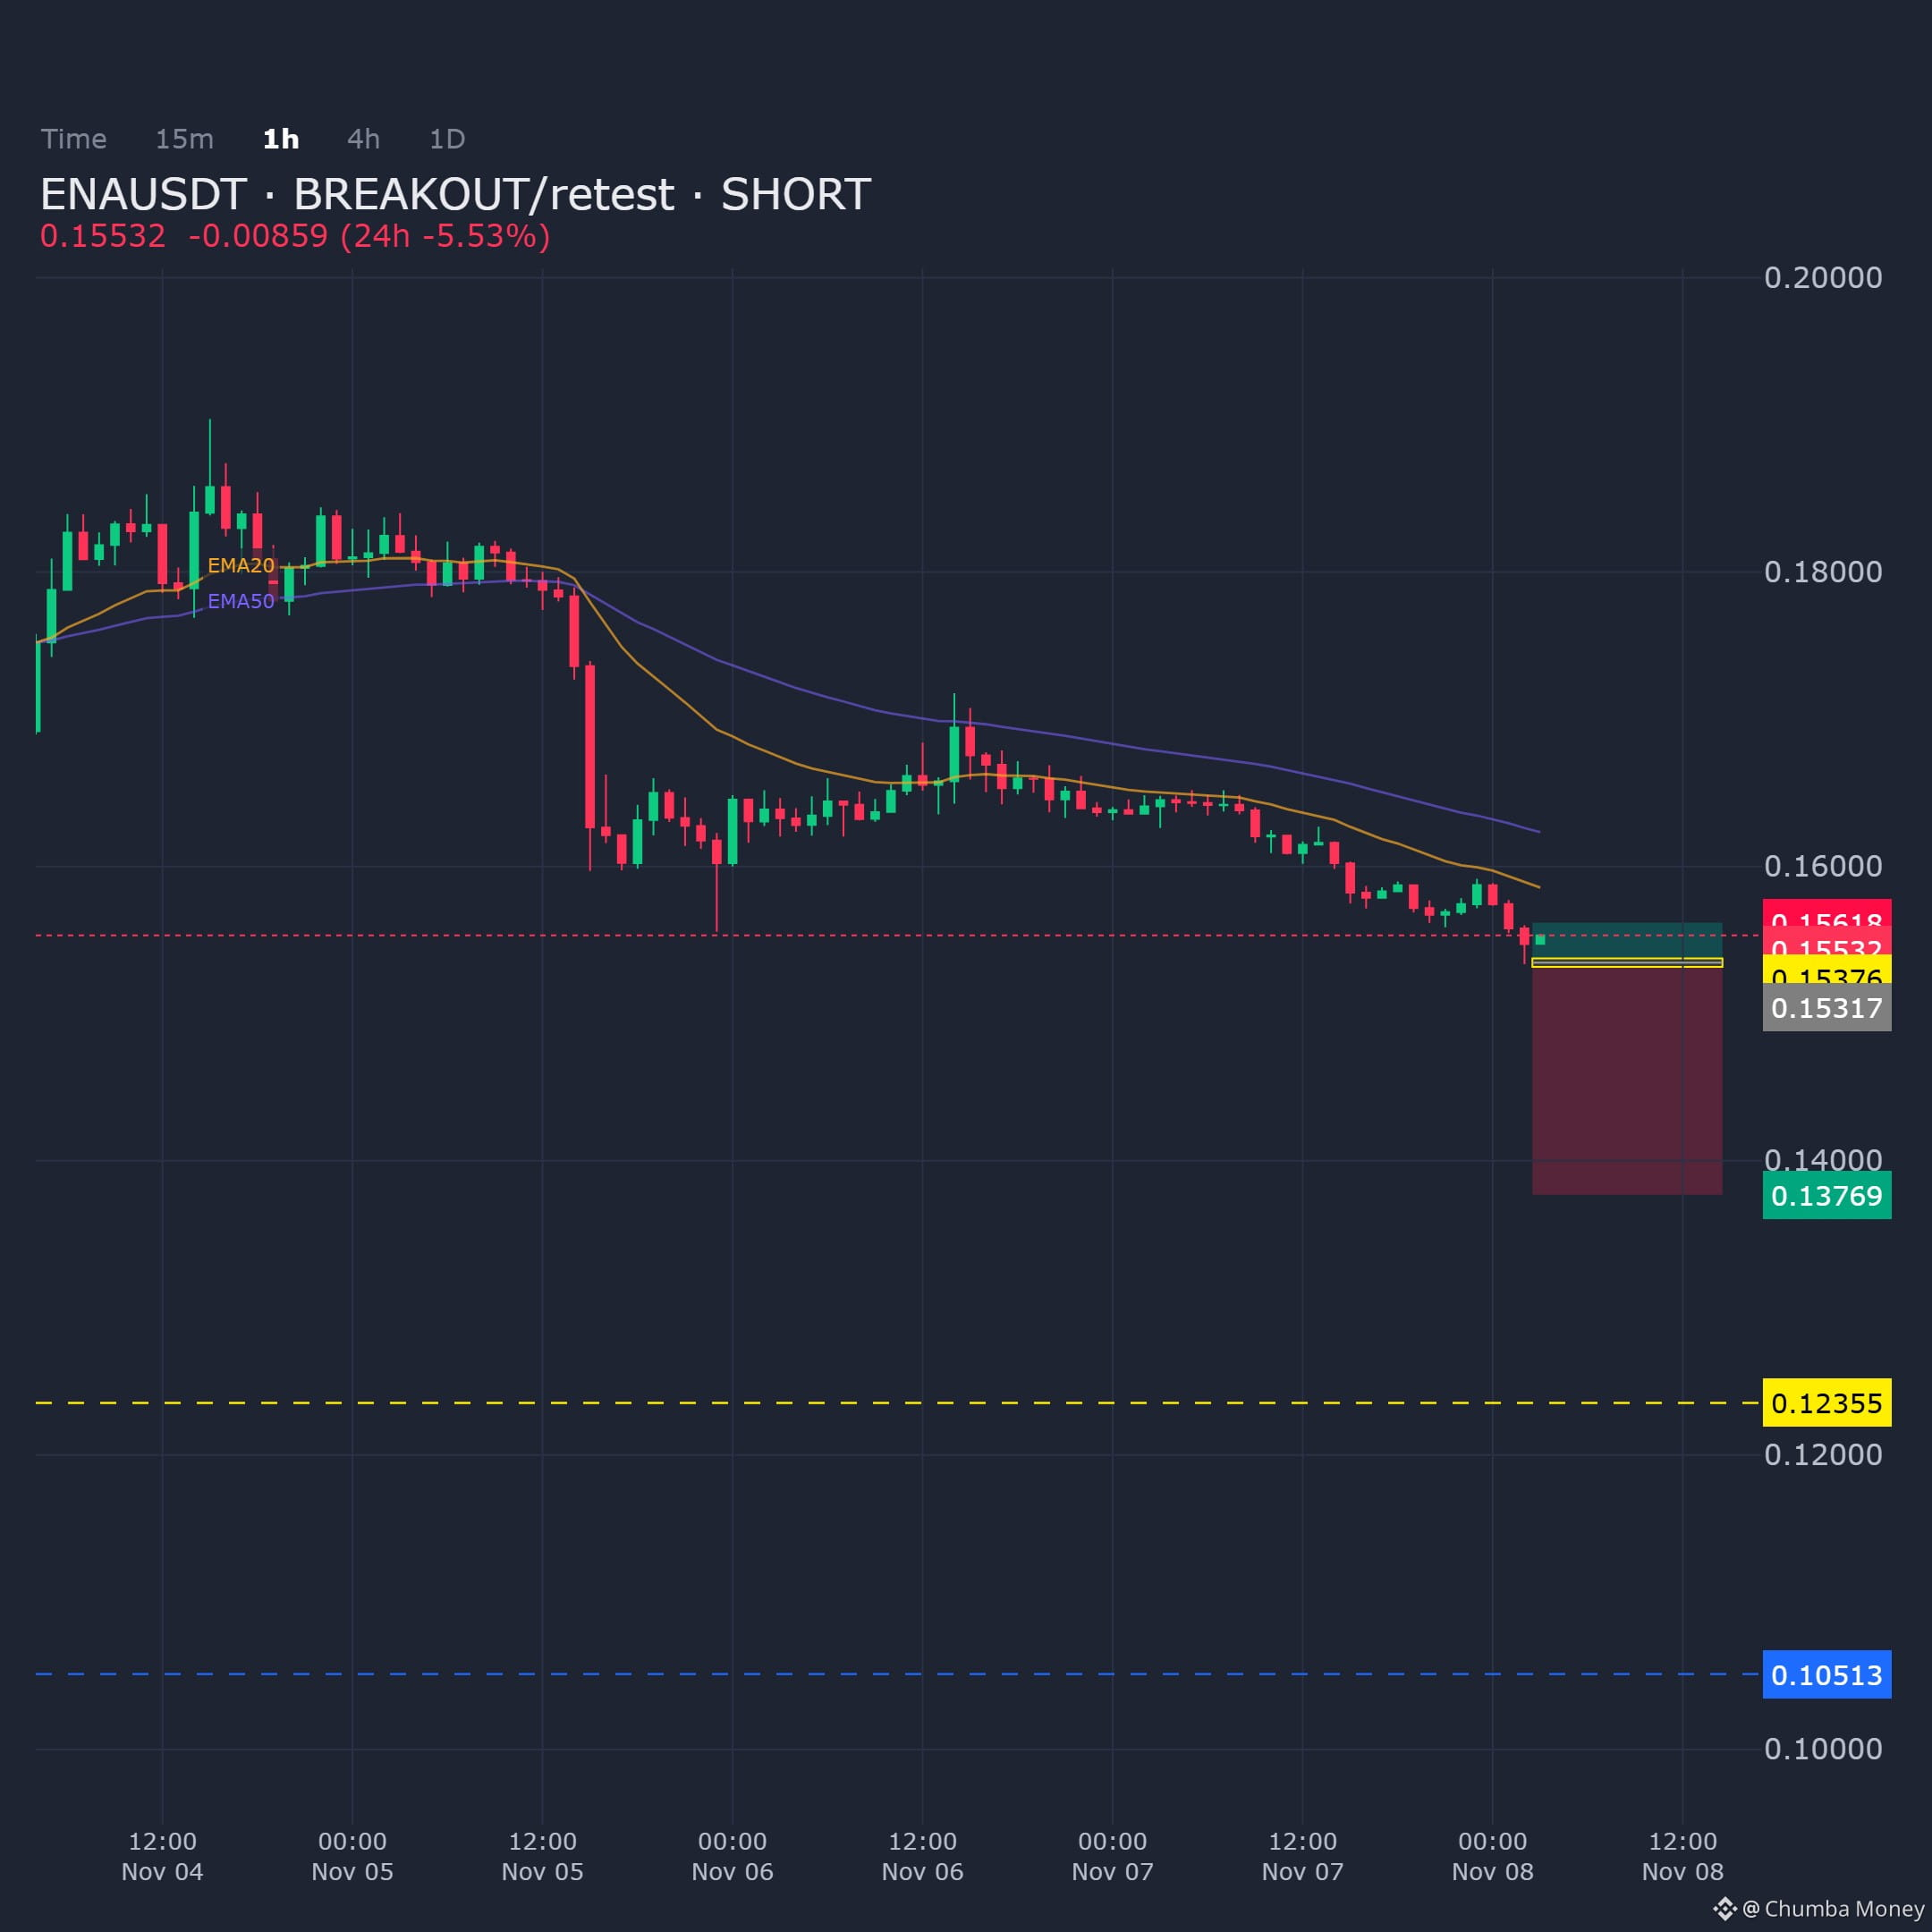
ENAUSDT on the 1H timeframe shows a breakout/retest structure at resistance. Short bias from the supply zone.
Entry: 0.153166 - 0.153755
Targets: TP1: 0.137693, TP2: 0.123546, TP3: 0.105126
Stop Loss: 0.156181
$ENA
ENAUSDT on the 1H timeframe shows a breakout/retest structure at resistance. Short bias from the supply zone.
Entry: 0.153166 - 0.153755
Targets: TP1: 0.137693, TP2: 0.123546, TP3: 0.105126
Stop Loss: 0.156181
$ENA
Entry: 0.153166 - 0.153755
Targets: TP1: 0.137693, TP2: 0.123546, TP3: 0.105126
Stop Loss: 0.156181
$ENA
23
·
--
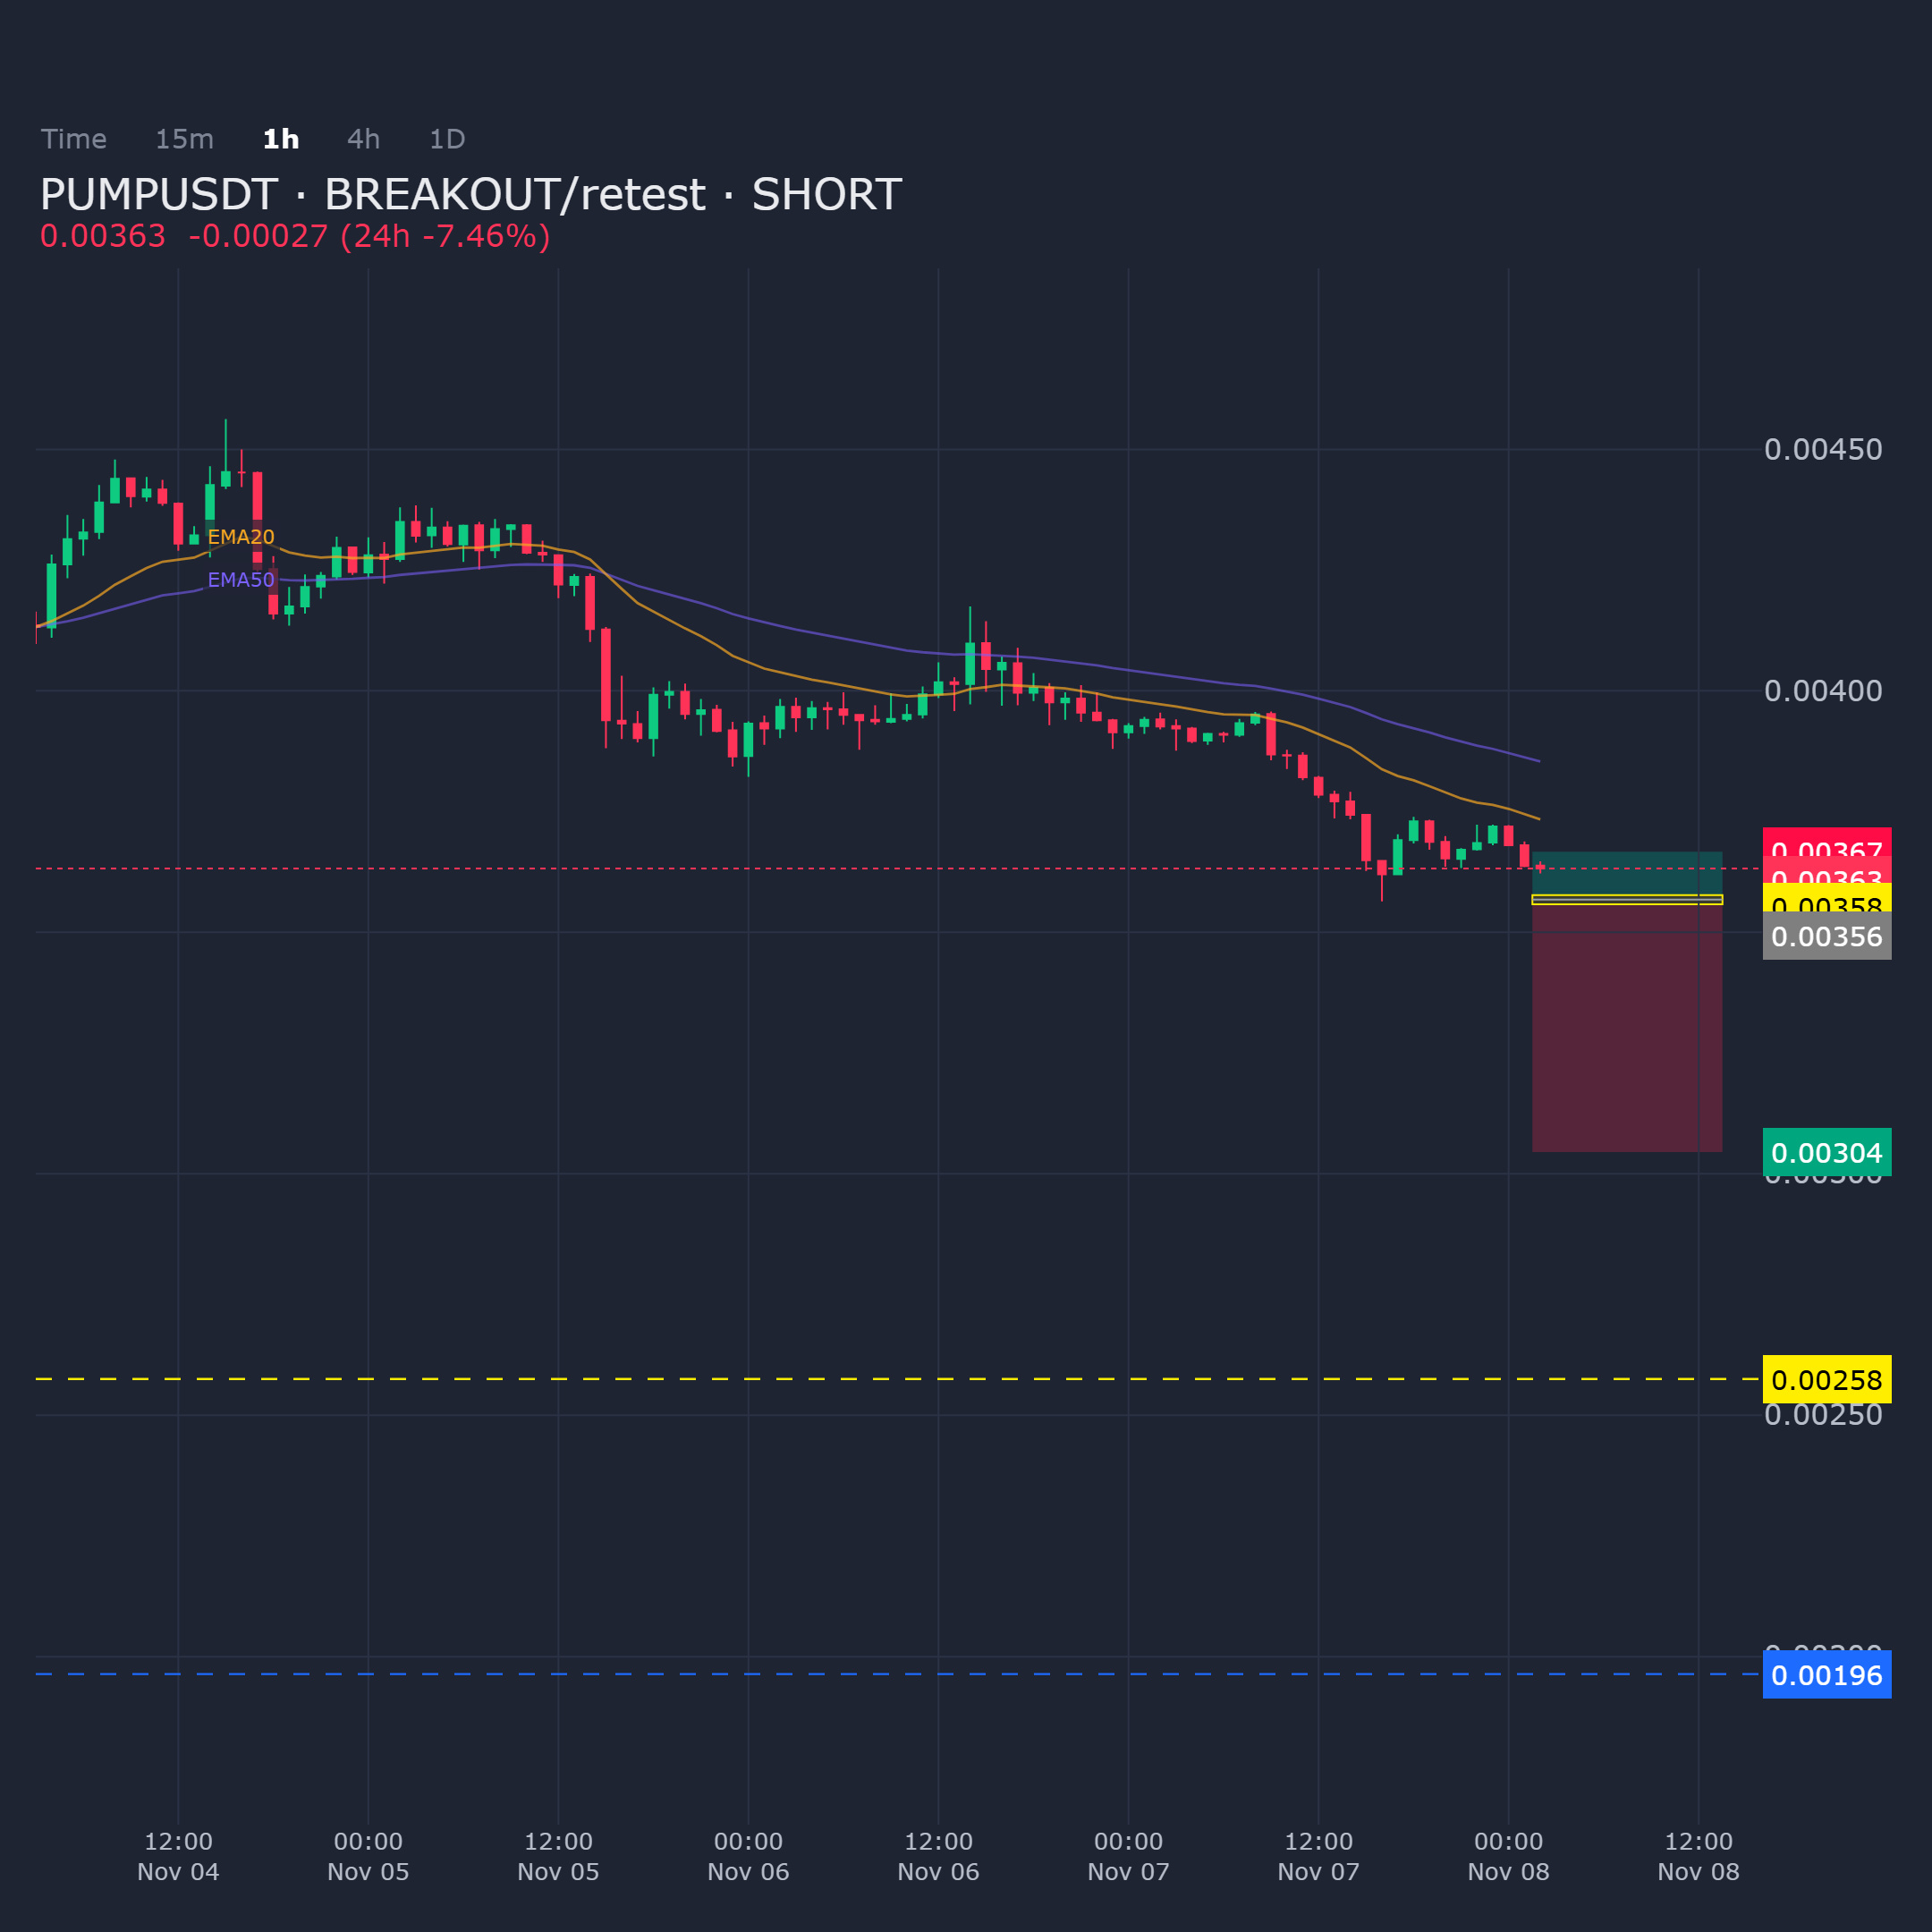
PUMPUSDT on the 1H chart shows price stretched into supply at the breakout/retest zone, bias is short.
Entry: 0.003558 - 0.003577
Targets: TP1: 0.003045, TP2: 0.002575, TP3: 0.001964
Stop Loss: 0.003667
$PUMP
PUMPUSDT on the 1H chart shows price stretched into supply at the breakout/retest zone, bias is short.
Entry: 0.003558 - 0.003577
Targets: TP1: 0.003045, TP2: 0.002575, TP3: 0.001964
Stop Loss: 0.003667
$PUMP
Entry: 0.003558 - 0.003577
Targets: TP1: 0.003045, TP2: 0.002575, TP3: 0.001964
Stop Loss: 0.003667
$PUMP
8
තවත් අන්තර්ගතයන් ගවේෂණය කිරීමට ඇතුල් වන්න
Binance චතුරශ්රය හි ගෝලීය ක්රිප්ටෝ පරිශීලකයින් හා එක්වන්න
⚡️ ක්රිප්ටෝ පිළිබඳ නවතම සහ ප්රයෝජනවත් තොරතුරු ලබා ගන්න.
💬 ලොව විශාලතම ක්රිප්ටෝ හුවමාරුව මගින් විශ්වාස කෙරේ.
👍 සත්යායනය කරන ලද නිර්මාණකරුවන්ගෙන් සැබෑ විදසුන් සොයා ගන්න.
විද්යුත් තැපෑල / දුරකථන අංකය
නැගී එන මාතෘකා
BinanceReopensWithdrawalsForHYPE&APT
25,009 නැරඹීම්
471 සාකච්ඡා කරමින්
Binance Re-Enables Withdrawals for HYPE and APT, Extends List of Restored Assets
Binance News
·18 කැමත්ත දැක්වීම්
·10.5k නැරඹීම්
SouthKoreaDraftLawTargets15To20%ShareholderCap
28,658 නැරඹීම්
337 සාකච්ඡා කරමින්
TradFiForBeginners
137,034 නැරඹීම්
1,453 සාකච්ඡා කරමින්