

Dhali_Crypto
70 පෝස්ටු

Dhali_Crypto
වාර්තා කරන්න
පරිශීලක අවහිර කරන්න
I am a crypto trader.
107 හඹා යමින්
112 හඹා යන්නන්
98 කැමති විය
පෝස්ටු
සියල්ල
උපුටා දැක්වීම්
·
--
ලිපිය
BTCUSD (1H) Technical Analysis: Can Bitcoin Recover or Face Further Downside Rejection?Market Overview & Current Structure
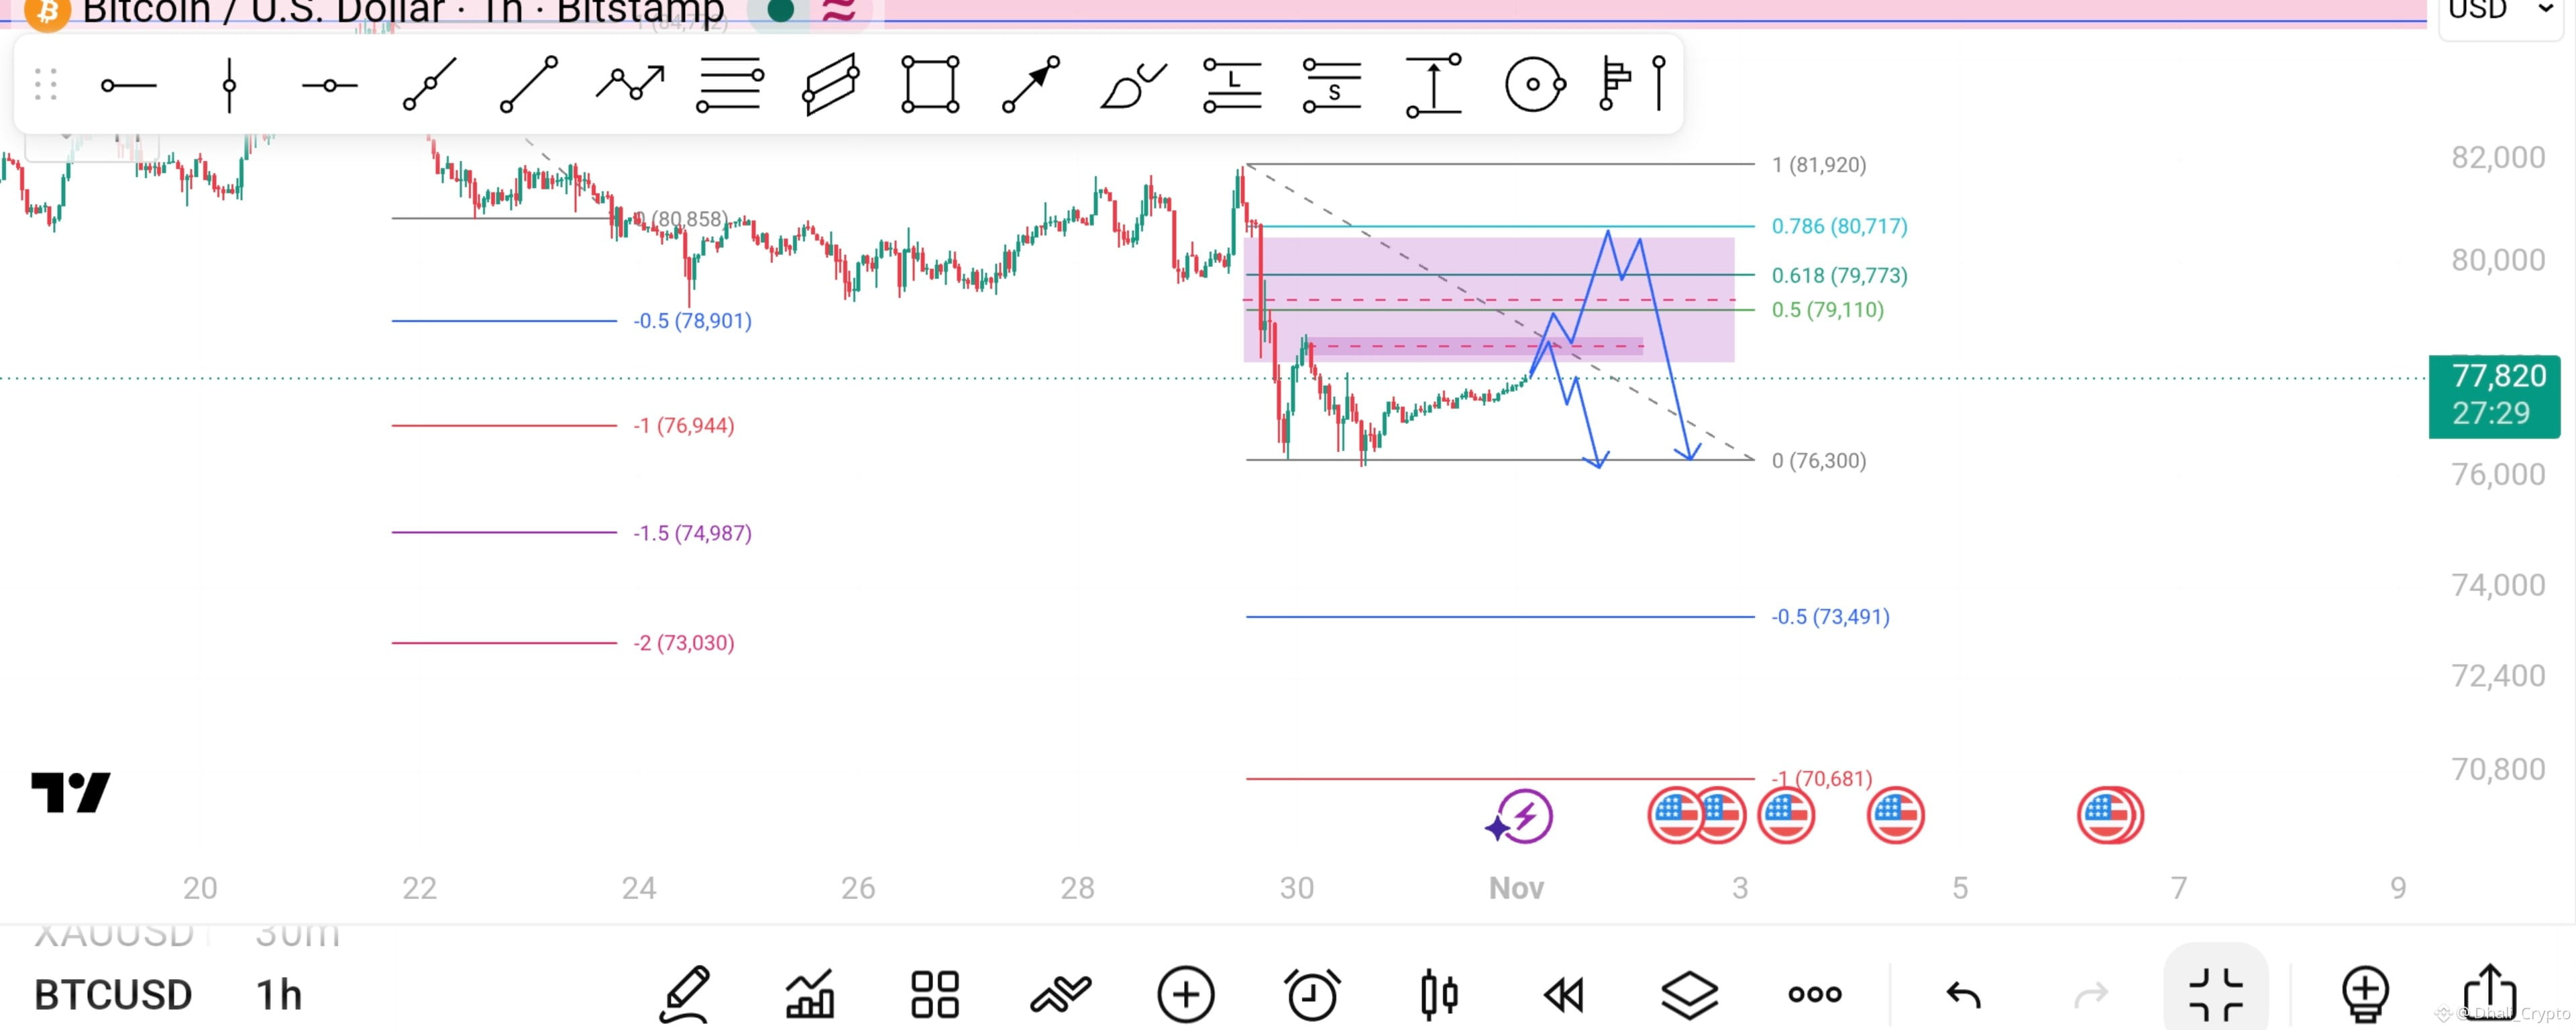
On the 1-hour timeframe, Bitcoin (BTCUSD) experienced an aggressive drop from the recent swing high at $81,920 down to test the local low around $76,300. The price is currently hovering around $77,820, forming a corrective bounce inside a consolidation range.
The overall short-term market structure remains bearish, characterized by lower highs and lower lows. The descending trendline resistance and the Fibonacci retracement levels suggest that this bounce could present a sell-on-rally opportunity before continuation toward deeper targets.
Key Technical Levels
* Resistance Zones (Supply):
* $79,110 (Fib 0.50): Confluence with the downward trendline and key horizontal supply.
* $79,773 – $80,717 (Fib 0.618 – 0.786): Premium golden pocket resistance zone for deep liquidity grabs.
* $81,920 (Swing High / Fib 1.0): Invalidation zone for the short-term bearish outlook.
* Support Zones (Demand / Targets):
* $76,300 (Fib 0.0): Immediate local low and breakdown boundary.
* $73,491 (Fib -0.50 Extension): Primary extension target on a structural breakdown.
* $70,681 (Fib -1.0 Extension): Major medium-term target zone.
Potential Scenarios & Trade Plan
* Scenario 1 (Shallow Pullback & Trendline Rejection):
Price pushes slightly higher toward the $79,110 zone (Fib 0.5) to retest the descending trendline. Bearish rejection signals (e.g., long upper wicks, pin bars) here could trigger the next downward leg toward $76,300.
* Scenario 2 (Deep Retracement / Double Top Trap):
If buyers push through the trendline, look for a deeper retest into the supply block between $79,770 and $80,700 (Fib 0.618–0.786). A failed breakout or a double-top structure in this premium zone provides a high-probability shorting entry targeting the breakdown of $76,300, with downstream targets at $73,491.
Risk Management Note
* Wait for confirmation (rejection candlestick patterns or lower-timeframe shifts) inside the supply zones before taking short positions.
* Keep a tight stop-loss above the invalidation levels and avoid aggressive longs until a clear breakout and retest above the swing high is confirmed.
(Disclaimer: This analysis is for educational and chart study purposes only, not financial advice.)
#BTC $BTC
{future}(BTCUSDT)
BTCUSD (1H) Technical Analysis: Can Bitcoin Recover or Face Further Downside Rejection?
Market Overview & Current Structure
On the 1-hour timeframe, Bitcoin (BTCUSD) experienced an aggressive drop from the recent swing high at $81,920 down to test the local low around $76,300. The price is currently hovering around $77,820, forming a corrective bounce inside a consolidation range.
The overall short-term market structure remains bearish, characterized by lower highs and lower lows. The descending trendline resistance and the Fibonacci retracement levels suggest that this bounce could present a sell-on-rally opportunity before continuation toward deeper targets.
Key Technical Levels
* Resistance Zones (Supply):
* $79,110 (Fib 0.50): Confluence with the downward trendline and key horizontal supply.
* $79,773 – $80,717 (Fib 0.618 – 0.786): Premium golden pocket resistance zone for deep liquidity grabs.
* $81,920 (Swing High / Fib 1.0): Invalidation zone for the short-term bearish outlook.
* Support Zones (Demand / Targets):
* $76,300 (Fib 0.0): Immediate local low and breakdown boundary.
* $73,491 (Fib -0.50 Extension): Primary extension target on a structural breakdown.
* $70,681 (Fib -1.0 Extension): Major medium-term target zone.
Potential Scenarios & Trade Plan
* Scenario 1 (Shallow Pullback & Trendline Rejection):
Price pushes slightly higher toward the $79,110 zone (Fib 0.5) to retest the descending trendline. Bearish rejection signals (e.g., long upper wicks, pin bars) here could trigger the next downward leg toward $76,300.
* Scenario 2 (Deep Retracement / Double Top Trap):
If buyers push through the trendline, look for a deeper retest into the supply block between $79,770 and $80,700 (Fib 0.618–0.786). A failed breakout or a double-top structure in this premium zone provides a high-probability shorting entry targeting the breakdown of $76,300, with downstream targets at $73,491.
Risk Management Note
* Wait for confirmation (rejection candlestick patterns or lower-timeframe shifts) inside the supply zones before taking short positions.
* Keep a tight stop-loss above the invalidation levels and avoid aggressive longs until a clear breakout and retest above the swing high is confirmed.
(Disclaimer: This analysis is for educational and chart study purposes only, not financial advice.)
#BTC $BTC
101
·
--
ලිපිය
NEAR/USDT: Bearish Reversal Setup | Resistance Rejection & 3.90 Target 📉NEAR/USDT — Bearish Continuation Setup 📉
Timeframe: 1H
Exchange: Binance
Bias: Bearish
Setup: Resistance Rejection + Descending Trendline
📊 Market Structure
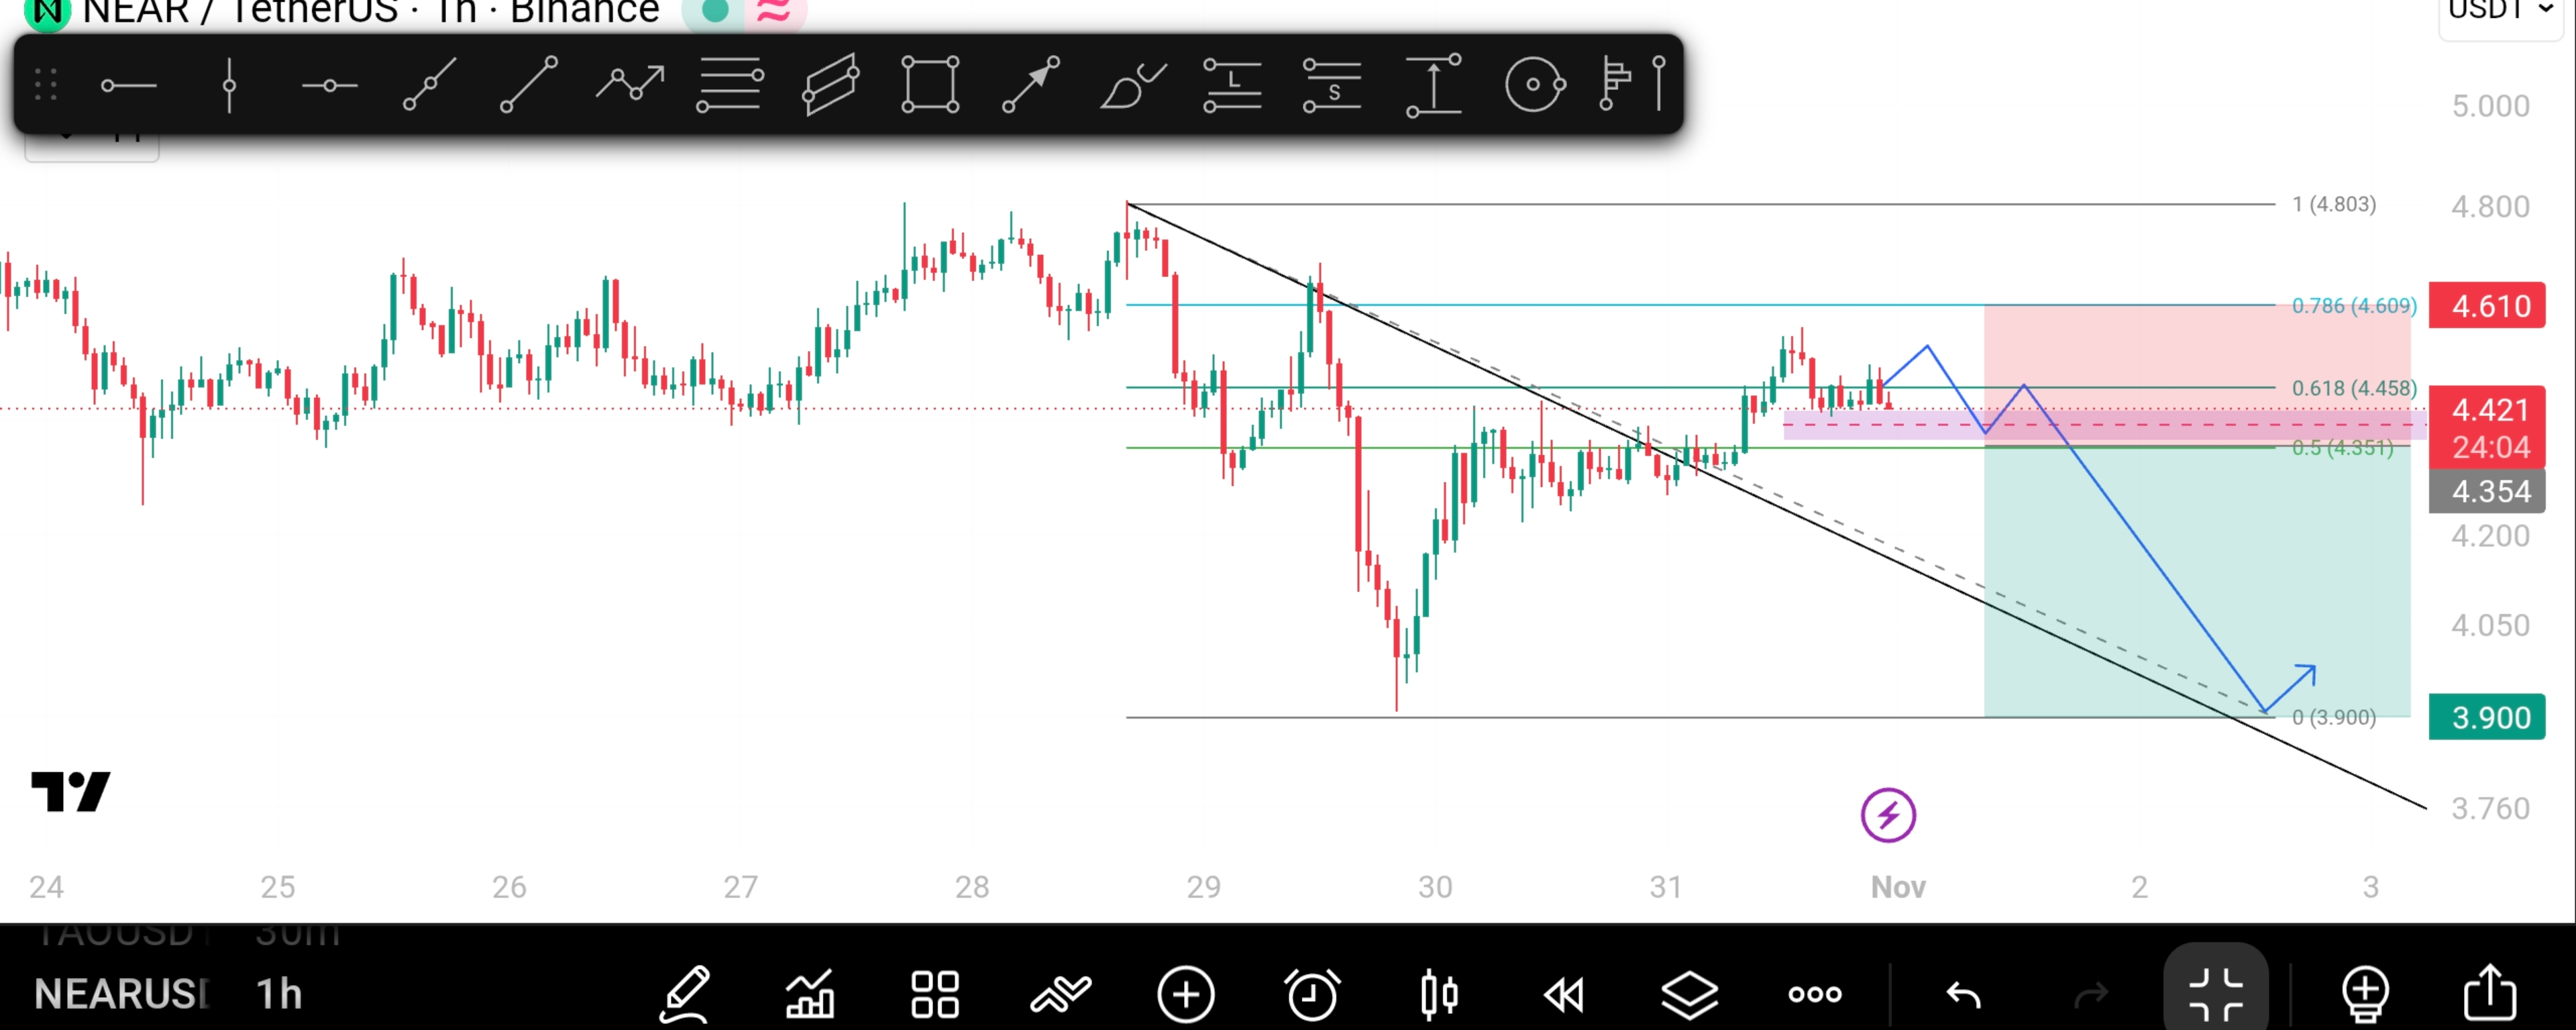
NEAR/USDT is showing a potential bearish continuation setup after a significant price decline from the 4.80 region.
Price has recently experienced a recovery, but it is now approaching a key resistance zone where multiple technical factors align:
- Descending trendline resistance
- Fibonacci retracement resistance
- Previous price reaction zone
This area could become a potential supply zone if buyers fail to establish a strong breakout.
🎯 Key Technical Levels
Level| Price
Major resistance| 4.803
0.786 Fibonacci| 4.609
0.618 Fibonacci| 4.458
0.500 Fibonacci| 4.351
Current price| 4.421
Target zone| 3.900
🔍 Trade Scenario
The primary scenario is to wait for price to retrace into the resistance zone and look for bearish confirmation.
Potential price movement:
1. Price makes a short-term bullish retracement toward the 4.45–4.50 area.
2. Buyers fail to sustain momentum above the resistance zone.
3. Price rejects the descending trendline and resumes its bearish movement.
4. A breakdown below local support could accelerate the move toward 4.20, 4.05, and ultimately 3.90.
The blue projected path illustrates this potential scenario, not a guaranteed price movement.
⚠️ Trade Invalidation
A strong 1H candle close above the resistance zone, followed by a successful retest, could weaken the bearish setup.
A sustained breakout above 4.609 would further challenge the bearish bias, while a move above 4.803 would invalidate the broader bearish structure shown in this analysis.
🧠 Trading Plan
Patience is key. Rather than entering blindly, wait for price action confirmation around the resistance zone.
Focus on:
- Rejection candles
- Bearish market structure
- Volume confirmation
- Risk-to-reward ratio
- Proper stop-loss placement
The idea is simple: Let price reach the resistance zone, wait for confirmation, and then evaluate the potential downside.
This is a technical analysis scenario, not financial advice. Always manage risk and remember that market conditions can change.
#NEARUSDT #NEAR
NEAR/USDT: Bearish Reversal Setup | Resistance Rejection & 3.90 Target 📉
NEAR/USDT — Bearish Continuation Setup 📉
Timeframe: 1H
Exchange: Binance
Bias: Bearish
Setup: Resistance Rejection + Descending Trendline
📊 Market Structure
NEAR/USDT is showing a potential bearish continuation setup after a significant price decline from the 4.80 region.
Price has recently experienced a recovery, but it is now approaching a key resistance zone where multiple technical factors align:
- Descending trendline resistance
- Fibonacci retracement resistance
- Previous price reaction zone
This area could become a potential supply zone if buyers fail to establish a strong breakout.
🎯 Key Technical Levels
Level| Price
Major resistance| 4.803
0.786 Fibonacci| 4.609
0.618 Fibonacci| 4.458
0.500 Fibonacci| 4.351
Current price| 4.421
Target zone| 3.900
🔍 Trade Scenario
The primary scenario is to wait for price to retrace into the resistance zone and look for bearish confirmation.
Potential price movement:
1. Price makes a short-term bullish retracement toward the 4.45–4.50 area.
2. Buyers fail to sustain momentum above the resistance zone.
3. Price rejects the descending trendline and resumes its bearish movement.
4. A breakdown below local support could accelerate the move toward 4.20, 4.05, and ultimately 3.90.
The blue projected path illustrates this potential scenario, not a guaranteed price movement.
⚠️ Trade Invalidation
A strong 1H candle close above the resistance zone, followed by a successful retest, could weaken the bearish setup.
A sustained breakout above 4.609 would further challenge the bearish bias, while a move above 4.803 would invalidate the broader bearish structure shown in this analysis.
🧠 Trading Plan
Patience is key. Rather than entering blindly, wait for price action confirmation around the resistance zone.
Focus on:
- Rejection candles
- Bearish market structure
- Volume confirmation
- Risk-to-reward ratio
- Proper stop-loss placement
The idea is simple: Let price reach the resistance zone, wait for confirmation, and then evaluate the potential downside.
This is a technical analysis scenario, not financial advice. Always manage risk and remember that market conditions can change.
#NEARUSDT #NEAR
1
597
·
--
ලිපිය
ETHUSDT: Ascending Channel Breakdown or One More Relief Rally?ETHUSDT: Is the Rising Channel About to Break Down?
Ethereum is approaching a critical point on the daily timeframe. After a strong recovery from the June lows, price has been moving within a rising channel. However, recent price action suggests that bullish momentum may be weakening.
Let's take a closer look at the key levels and a potential bearish scenario.
📊 Market Structure
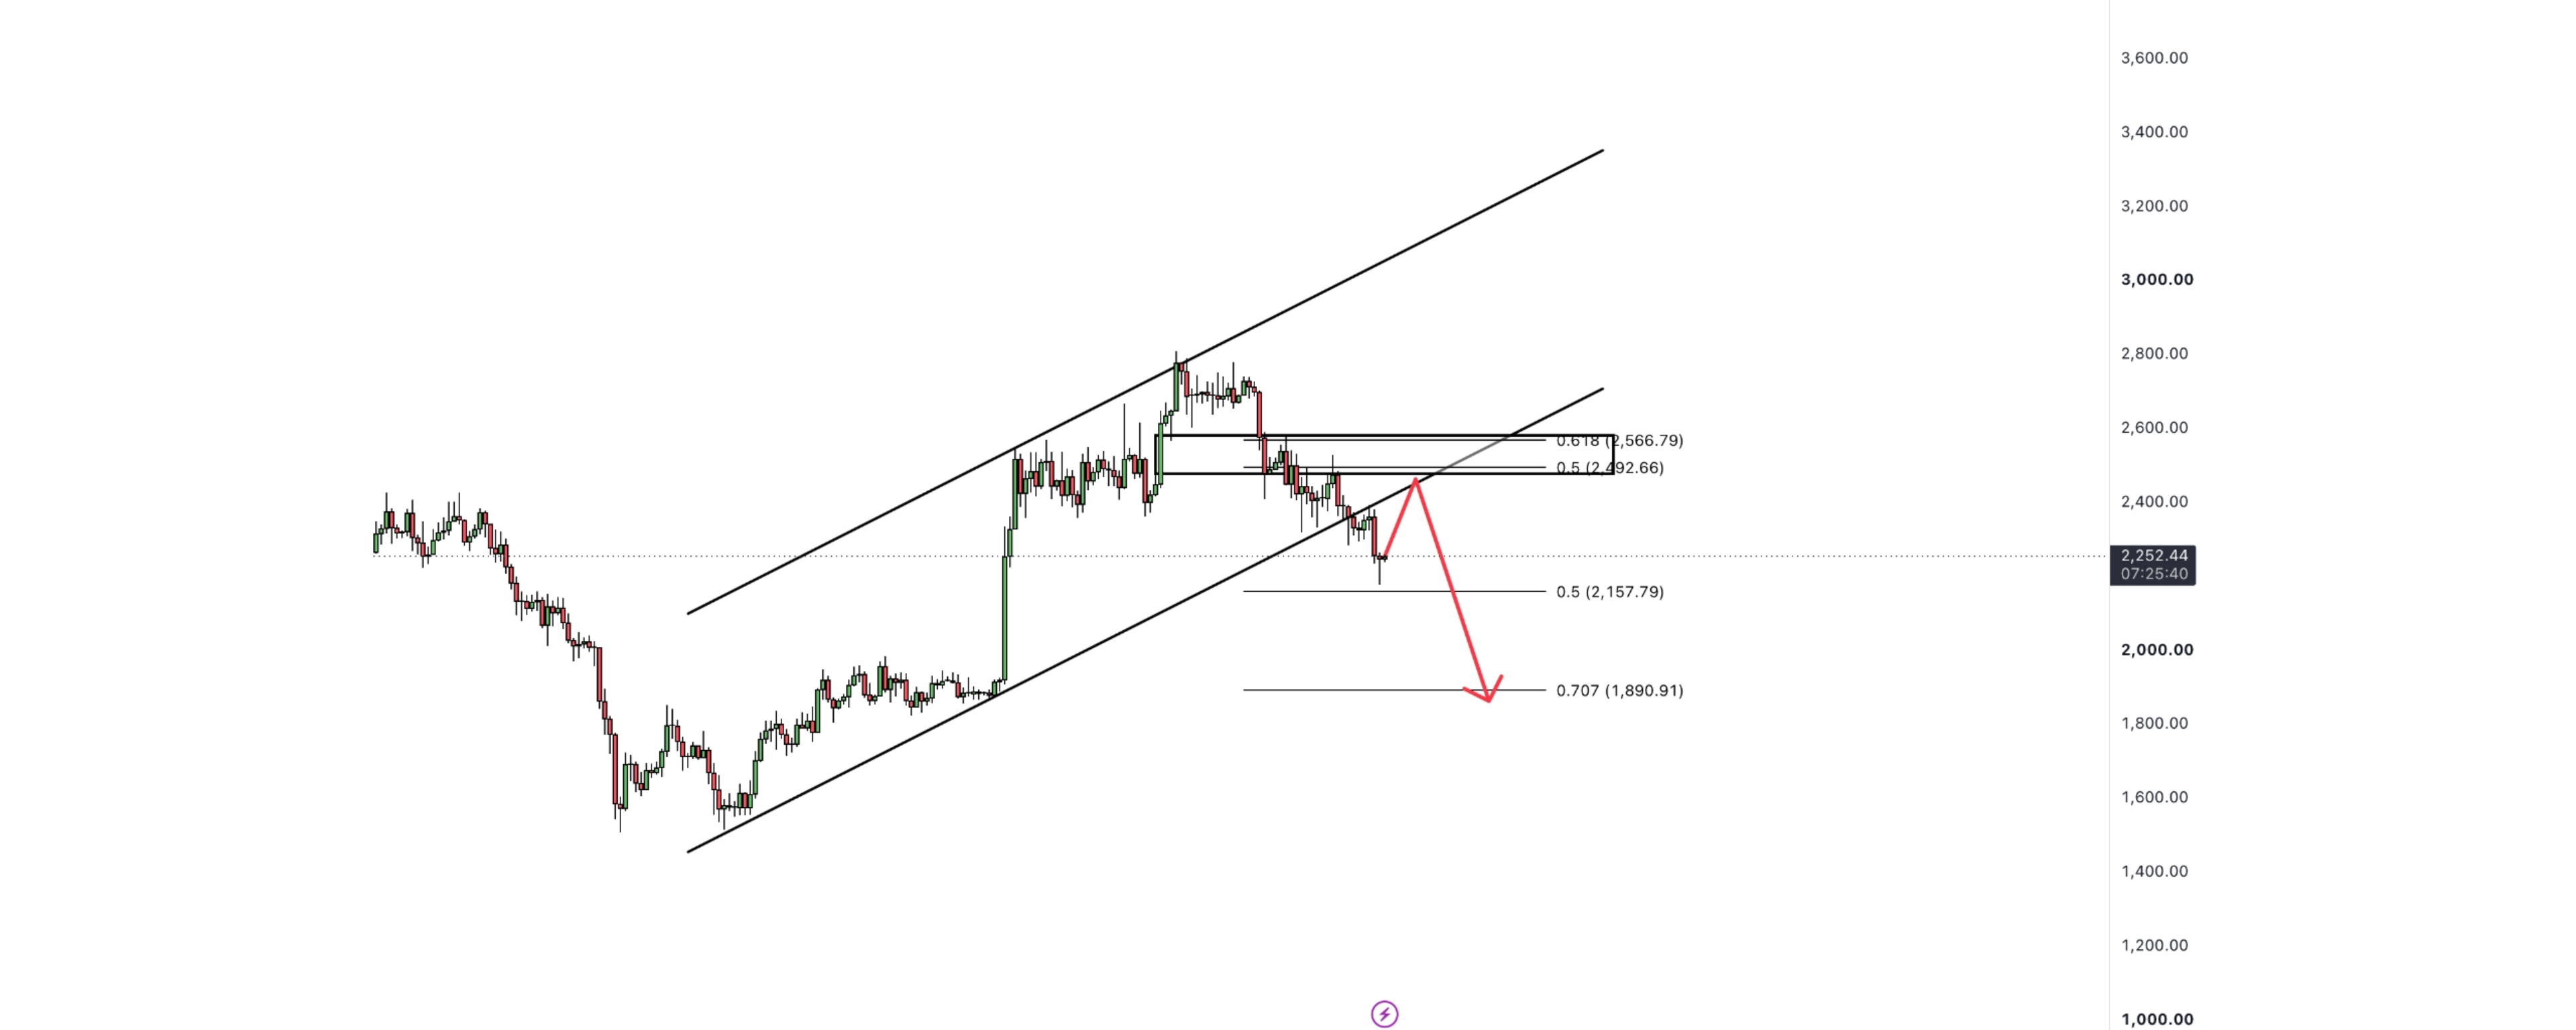
ETH has been trading inside an ascending channel, forming higher highs and higher lows. However, the recent rejection from the $2,800 area has brought price back toward the lower boundary of the channel.
A breakdown below this support could signal a potential shift in market structure from bullish to bearish.
🎯 Key Resistance Zones
If price attempts a recovery, these Fibonacci levels could act as resistance:
- $2,493 – 0.5 Fibonacci level
- $2,567 – 0.618 Fibonacci level
A rejection from this zone could provide further confirmation of bearish momentum.
📉 Bearish Scenario
My primary scenario is a potential relief rally toward the $2,450–$2,500 resistance area, followed by another move lower.
If ETH fails to reclaim this zone and breaks below the ascending channel, the next potential downside target is:
- $2,157 – First key support
- $1,891 – 0.707 Fibonacci level and major downside target
A confirmed breakdown could open the door for a deeper correction.
⚠️ What Would Invalidate This Setup?
A strong daily close above the $2,567–$2,600 resistance zone, followed by a successful retest, would weaken this bearish outlook.
Until then, I will be watching for a possible rejection and continuation to the downside.
📝 Final Thoughts
The market is approaching a decisive area. Rather than chasing price, I am waiting for confirmation around the key resistance and channel support levels.
Patience, confirmation, and risk management remain the priority.
What do you think? Will ETH break down from the ascending channel, or will buyers push price toward $2,600 again?
Share your analysis in the comments!
#ETHUSDT $ETH
ETHUSDT: Ascending Channel Breakdown or One More Relief Rally?
ETHUSDT: Is the Rising Channel About to Break Down?
Ethereum is approaching a critical point on the daily timeframe. After a strong recovery from the June lows, price has been moving within a rising channel. However, recent price action suggests that bullish momentum may be weakening.
Let's take a closer look at the key levels and a potential bearish scenario.
📊 Market Structure
ETH has been trading inside an ascending channel, forming higher highs and higher lows. However, the recent rejection from the $2,800 area has brought price back toward the lower boundary of the channel.
A breakdown below this support could signal a potential shift in market structure from bullish to bearish.
🎯 Key Resistance Zones
If price attempts a recovery, these Fibonacci levels could act as resistance:
- $2,493 – 0.5 Fibonacci level
- $2,567 – 0.618 Fibonacci level
A rejection from this zone could provide further confirmation of bearish momentum.
📉 Bearish Scenario
My primary scenario is a potential relief rally toward the $2,450–$2,500 resistance area, followed by another move lower.
If ETH fails to reclaim this zone and breaks below the ascending channel, the next potential downside target is:
- $2,157 – First key support
- $1,891 – 0.707 Fibonacci level and major downside target
A confirmed breakdown could open the door for a deeper correction.
⚠️ What Would Invalidate This Setup?
A strong daily close above the $2,567–$2,600 resistance zone, followed by a successful retest, would weaken this bearish outlook.
Until then, I will be watching for a possible rejection and continuation to the downside.
📝 Final Thoughts
The market is approaching a decisive area. Rather than chasing price, I am waiting for confirmation around the key resistance and channel support levels.
Patience, confirmation, and risk management remain the priority.
What do you think? Will ETH break down from the ascending channel, or will buyers push price toward $2,600 again?
Share your analysis in the comments!
#ETHUSDT $ETH
2
1
582
·
--
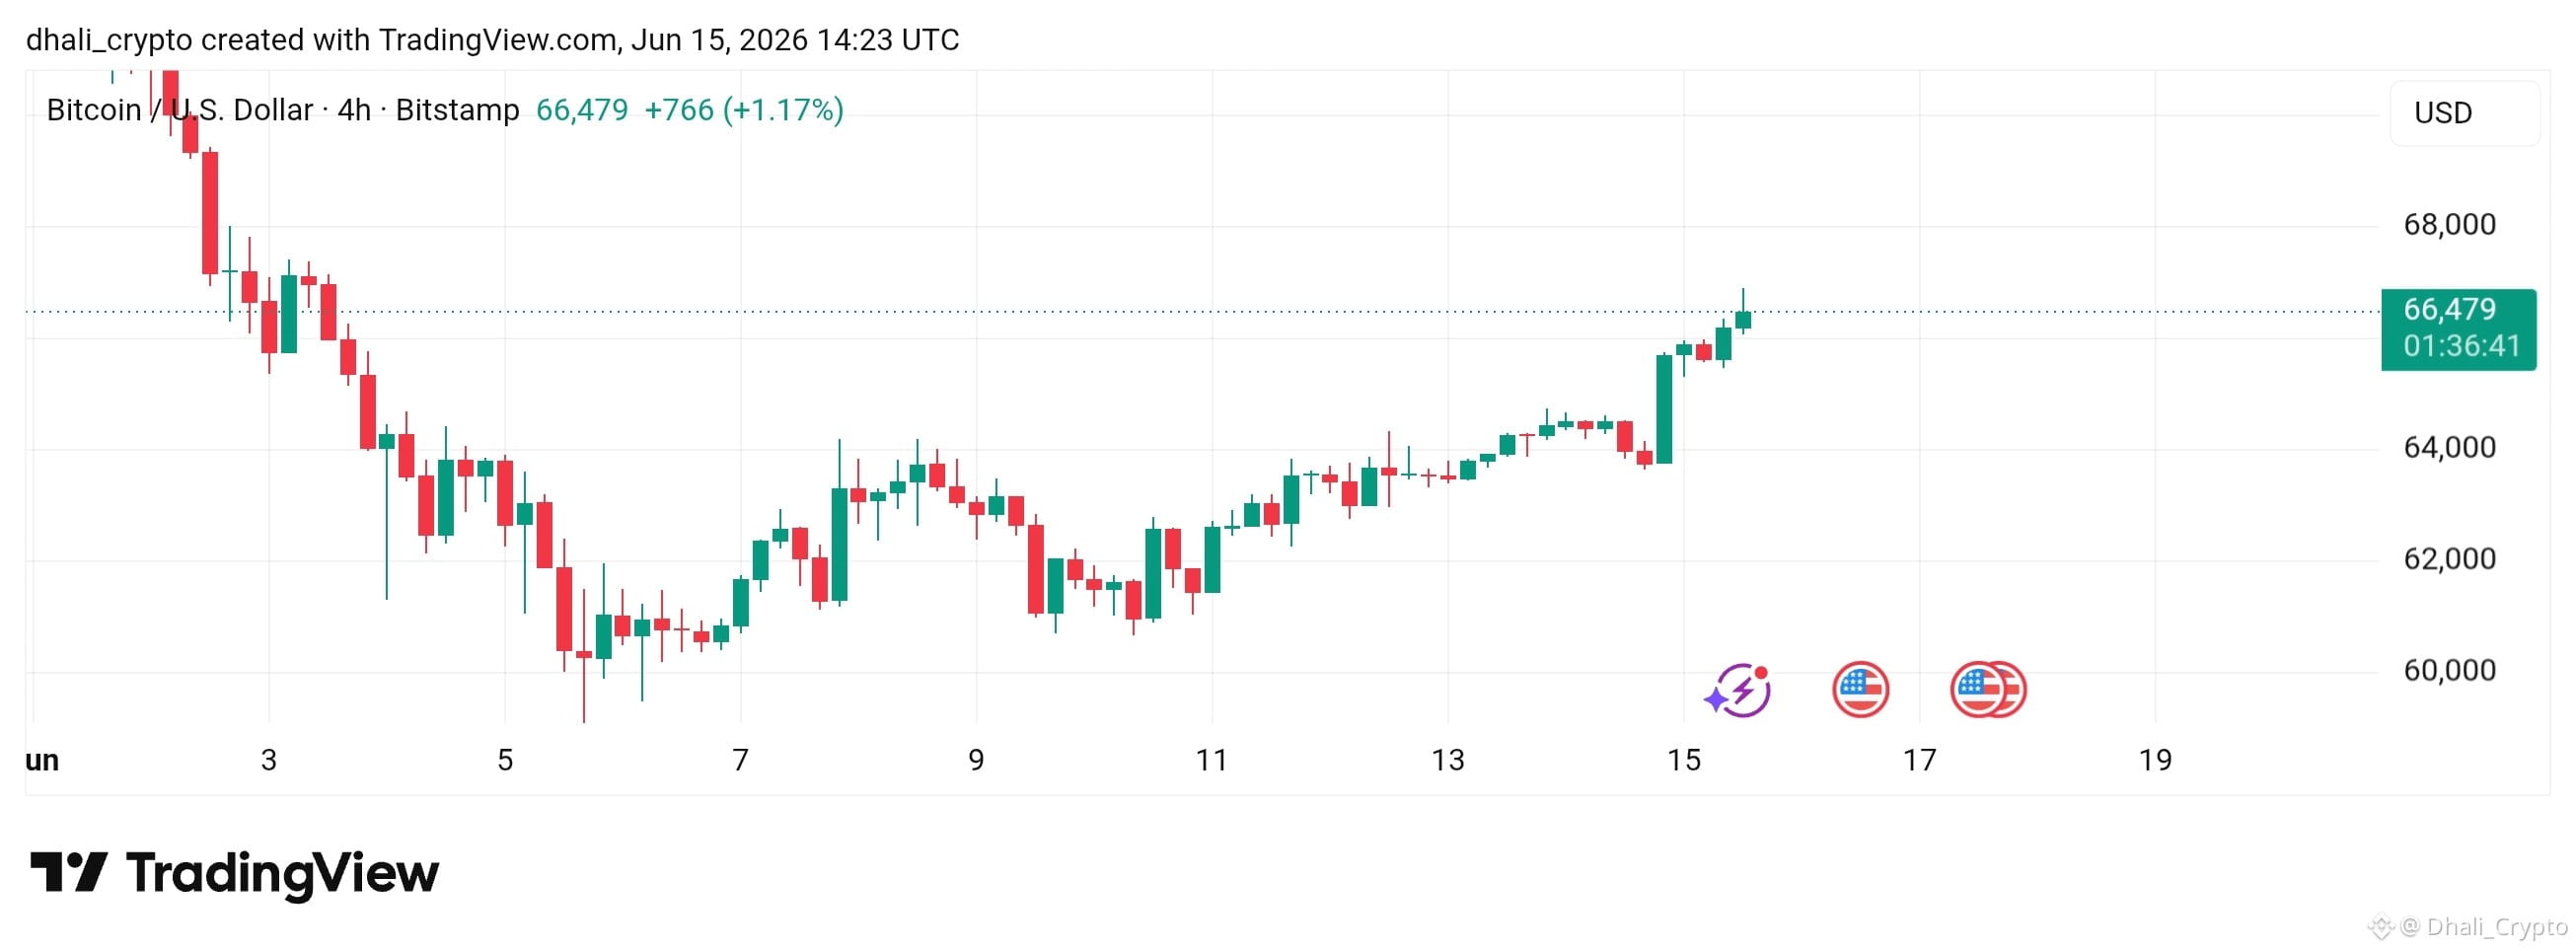
The crypto market is at a crucial crossroads, and all eyes are on the king of crypto, $BTC. After weeks of consolidation, Bitcoin is squeezing into a tight range, signaling that a massive, volatile move is just around the corner.
If you are wondering which direction $BTC will break out, here is the definitive breakdown based on current market structure:
1. The Bullish Case (The Most Likely Direction):
On the daily chart, $ BTC has been forming a strong higher-low pattern, showing that buyers are aggressively defending the support zone. On-chain data also reveals that whale accumulation is at an all-time high, meaning big players are expecting an upward move.
The Target: If $ BTC successfully breaks and closes a daily candle above the immediate resistance level, momentum will skyrocket. This confirmed breakout will likely trigger a massive short-squeeze, driving the price straight toward a new all-time high.
2. The Bearish Reality Check:
No analysis is complete without a backup plan. If $ BTC fails to clear the overhead resistance, we might see a temporary rejection. However, as long as it holds its major weekly support moving average, the overall macro trend remains firmly bullish. A dip to the support level should be seen as a prime "buy-the-dip" opportunity rather than a trend reversal.
How to Play This Move?
Keep a close eye on the volume during the breakout. While waiting for Bitcoin to make its final move, top-tier altcoins like $ETH H and $BNB are also positioning themselves for a major rally, often following Bitcoin's liquidity flow.
What’s your game plan? Are you longing $ BTC here, or waiting for a deeper dip? Let me know your targets in the comments below!
The crypto market is at a crucial crossroads, and all eyes are on the king of crypto, $BTC . After weeks of consolidation, Bitcoin is squeezing into a tight range, signaling that a massive, volatile move is just around the corner.
If you are wondering which direction $BTC will break out, here is the definitive breakdown based on current market structure:
1. The Bullish Case (The Most Likely Direction):
On the daily chart, $ BTC has been forming a strong higher-low pattern, showing that buyers are aggressively defending the support zone. On-chain data also reveals that whale accumulation is at an all-time high, meaning big players are expecting an upward move.
The Target: If $ BTC successfully breaks and closes a daily candle above the immediate resistance level, momentum will skyrocket. This confirmed breakout will likely trigger a massive short-squeeze, driving the price straight toward a new all-time high.
2. The Bearish Reality Check:
No analysis is complete without a backup plan. If $ BTC fails to clear the overhead resistance, we might see a temporary rejection. However, as long as it holds its major weekly support moving average, the overall macro trend remains firmly bullish. A dip to the support level should be seen as a prime "buy-the-dip" opportunity rather than a trend reversal.
How to Play This Move?
Keep a close eye on the volume during the breakout. While waiting for Bitcoin to make its final move, top-tier altcoins like $ETH H and $BNB are also positioning themselves for a major rally, often following Bitcoin's liquidity flow.
What’s your game plan? Are you longing $ BTC here, or waiting for a deeper dip? Let me know your targets in the comments below!

95
·
--
🚀 NEAR/USDT: Bullish Momentum Building? | Long Setup & Key Levels 📈
Hey Binance Square Fam! 👋
Looking at the 15-minute chart for NEAR in 1000006845.jpg, we are seeing a massive surge in buying volume today (+11.32%). After a sharp vertical rally earlier this afternoon, the price is currently entering a healthy consolidation phase.
This consolidation is forming a very clean risk-to-reward setup. Here is my tactical breakdown! 👇
🔍 Technical Breakdown
The Breakout: NEAR launched from its morning baseline under $2.40 and sliced right through local resistance, peaking near $2.493.
Current Action: We are sitting right around $2.469. The price is holding support incredibly well above the $2.455 level, forming a solid accumulation base.
Risk/Reward Setup: As outlined by the long position tool in 1000006845.jpg, bulls are defending this retest zone. If support holds, the macro momentum points toward a massive secondary leg up.
🎯 Trading Setup & Key Levels to Watch
🟢 Entry Zone: Around current levels ($2.455 - $2.470) as it consolidates within the lower red box structure.
🔴 Stop Loss (SL): Invalidation sits tightly just below the recent structure low at $2.443. Keeping a tight stop here protects capital if the breakout turns out to be a fakeout.
🚀 Take Profit (TP): The primary target for this setup is the overhead psychological resistance line at $2.628, with room to stretch up to $2.635.
💡 Summary Sentiment
This is a textbook "breakout and retest" scenario on lower timeframes. By risking a tiny amount down to $2.443, the potential upside toward $2.628 offers a massive risk-to-reward ratio.
What’s your move, traders? Are you longing this NEAR consolidation, or do you think the rally is exhausted? Drop your thoughts below! 👇
#NEAR #NearProtocol #CryptoTrading $ #TechnicalAnalysis #BinanceSquare
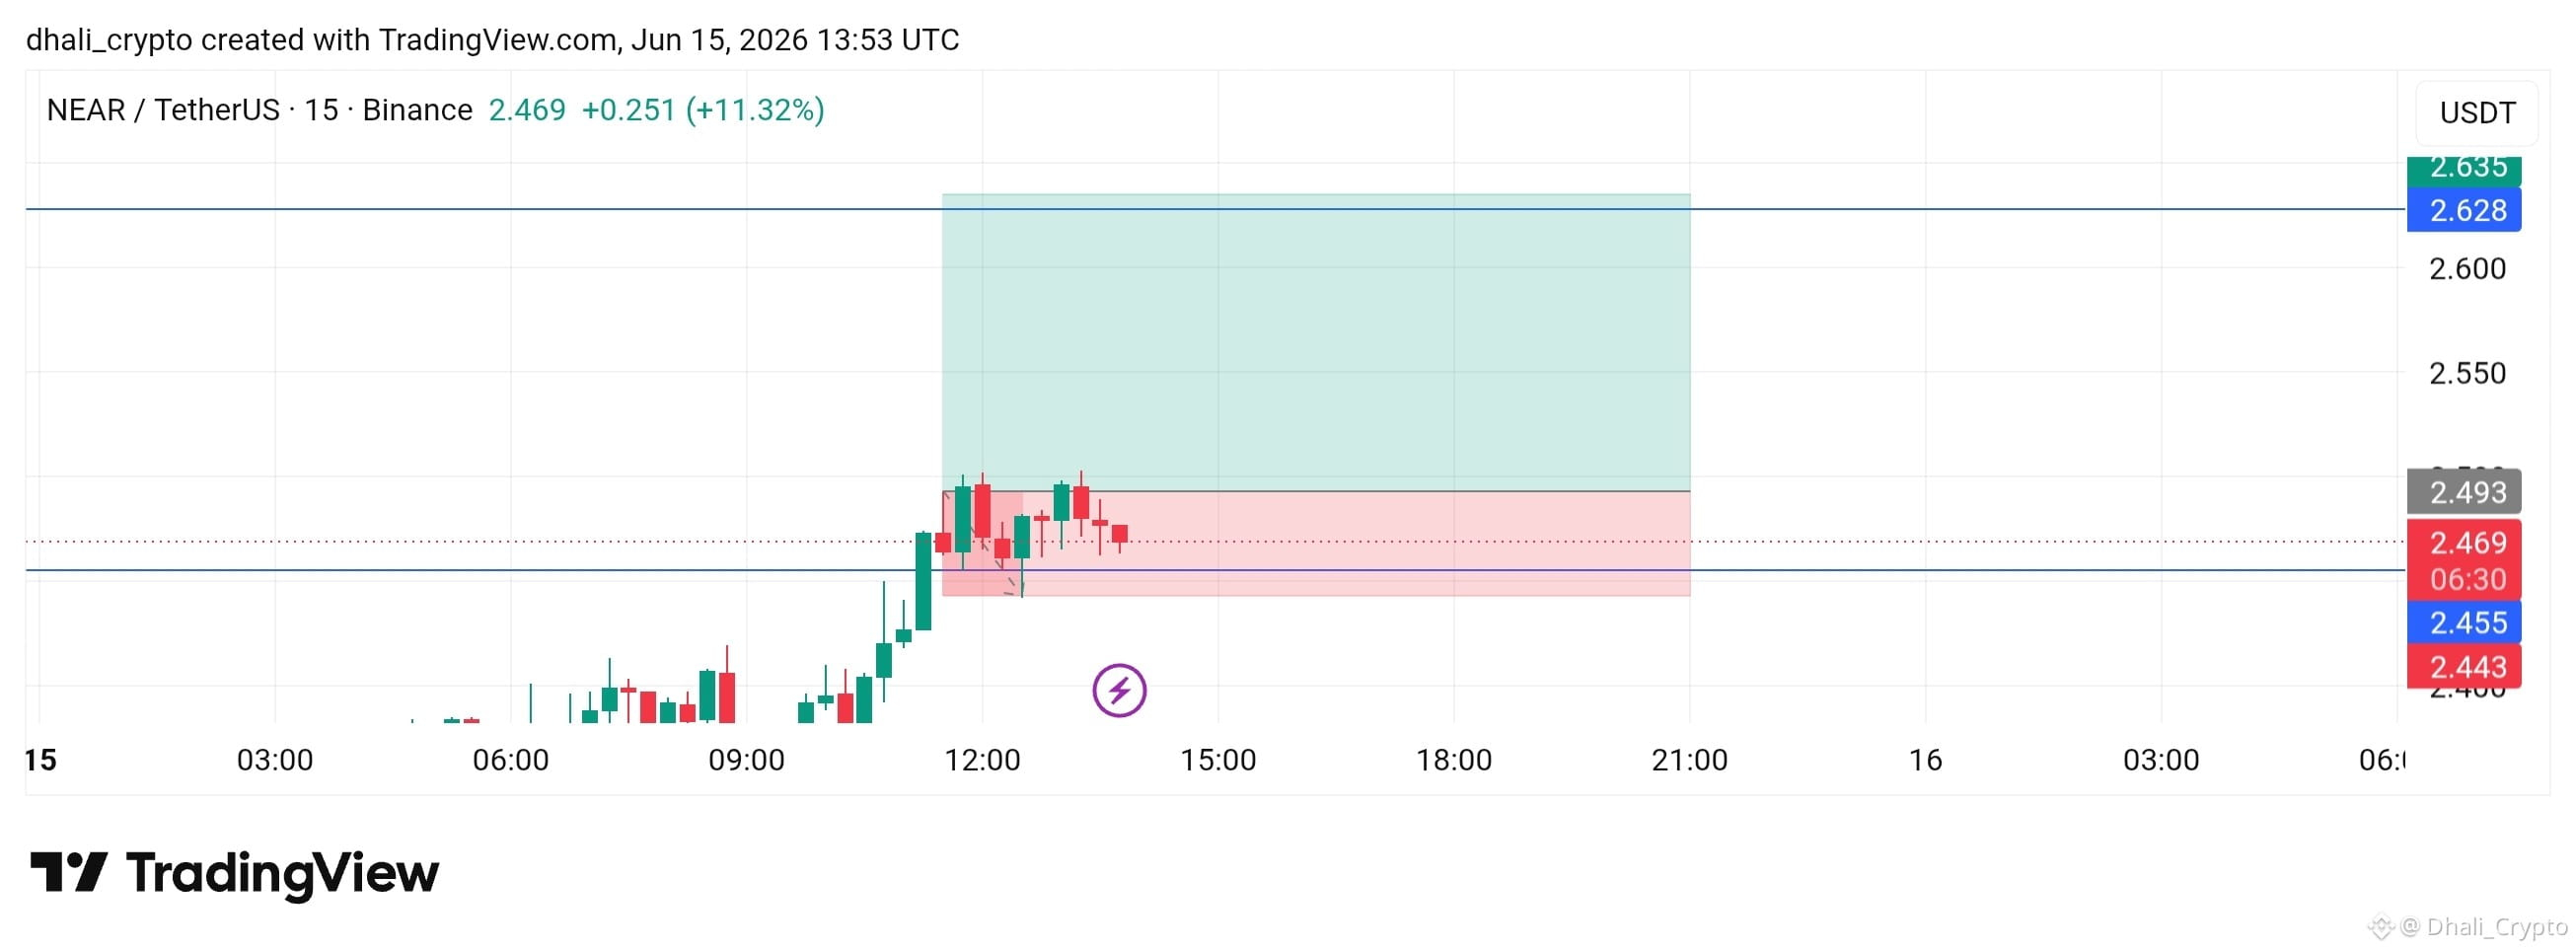
98
·
--
ලිපිය
🚀 ETH/USDT: Is a Relief Rally Brewing? | Key Levels & Long Setup 📈Hey Binance Square Fam! 👋
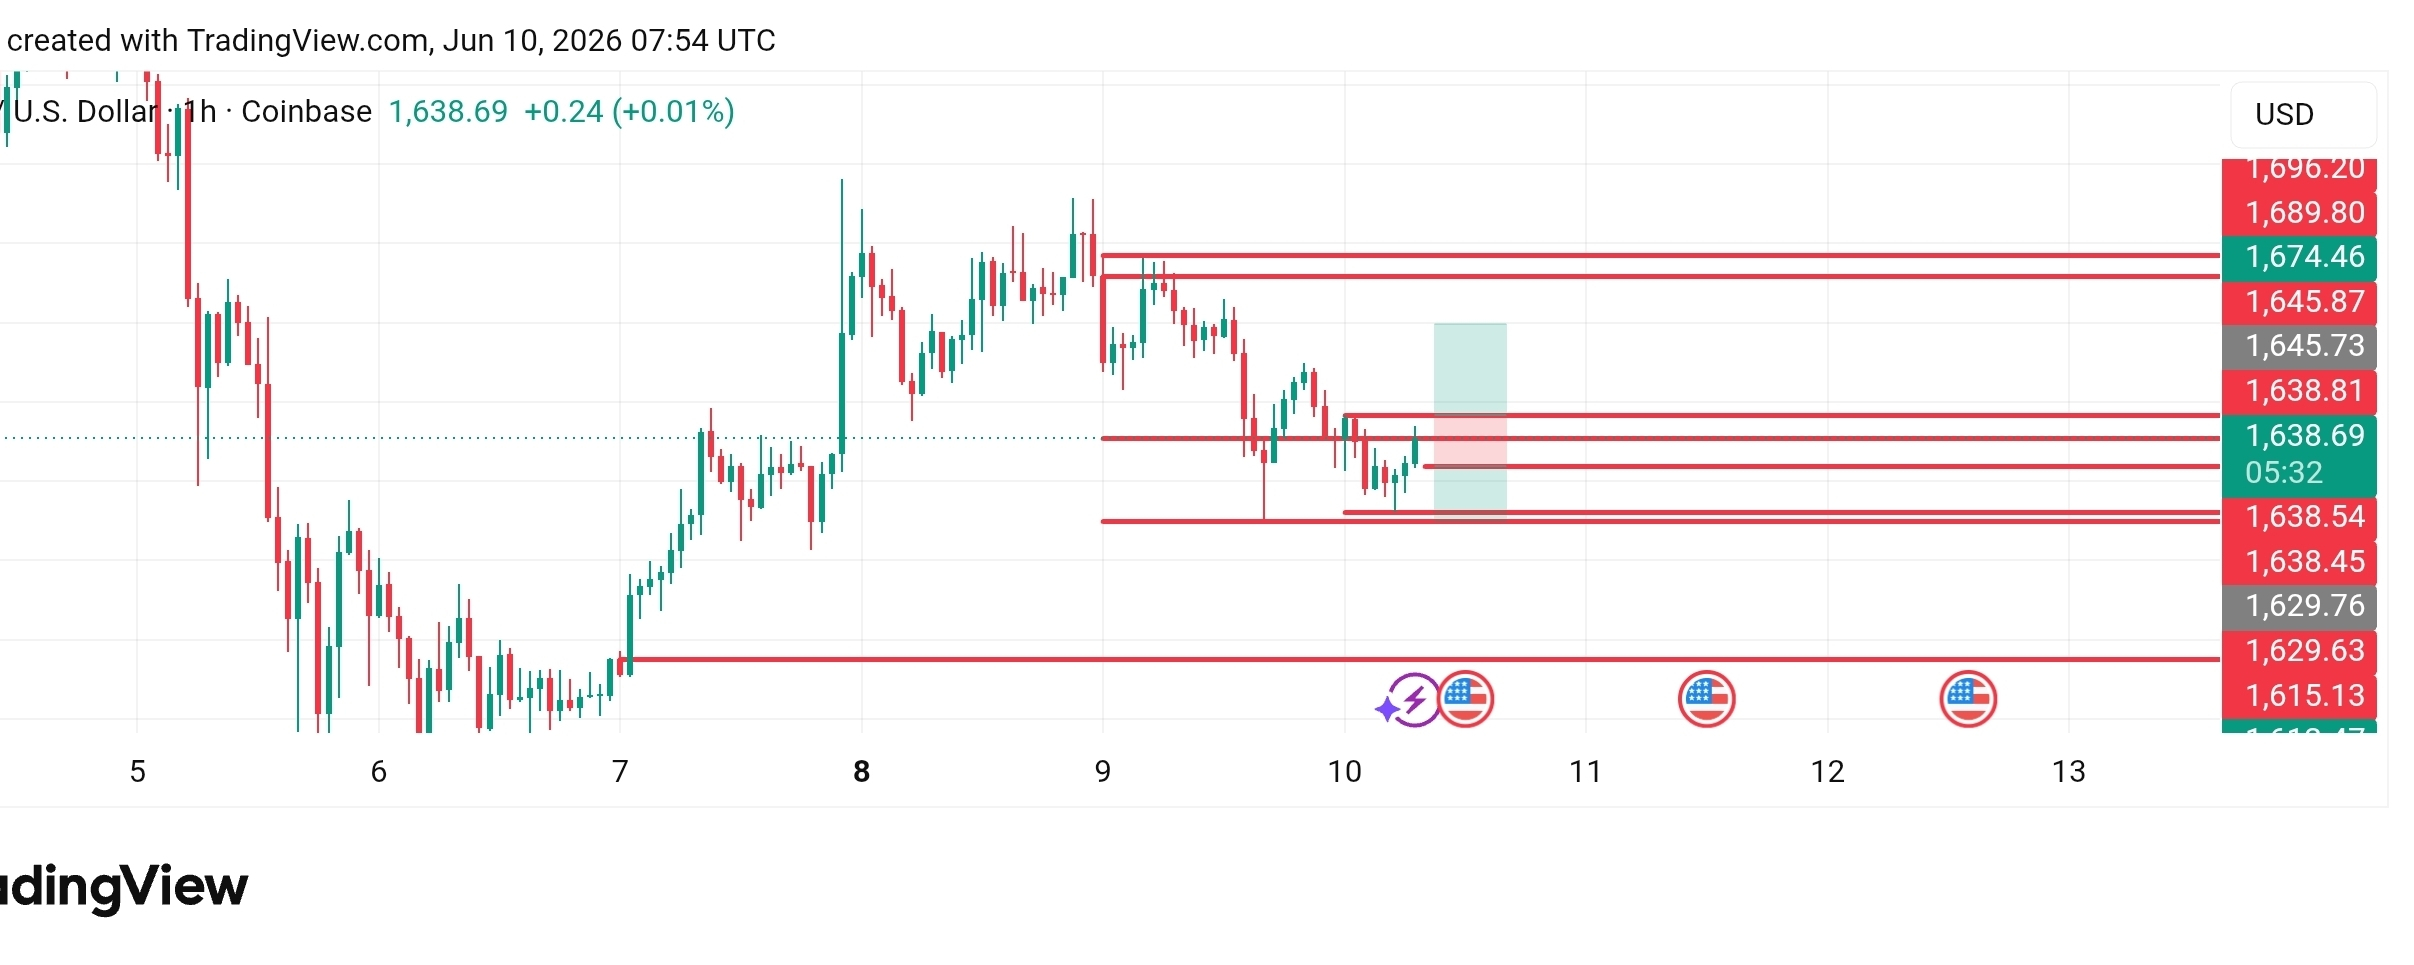
Looking at the current **$ETH** 4-hour chart in **TradingView_Screenshot_1781077759022~2.jpg**, Ethereum has been facing steady selling pressure over the last few days, but we are finally seeing some interesting signs of stabilization around a key support region.
Here is my quick technical breakdown and a potential scalp/swing setup I'm tracking! 👇
### **🔍 Technical Breakdown**
* **The Downtrend:** After breaking below the **$1,645** resistance zone, ETH found a local bottom just under **$1,630** (hitting a low around **$1,629.76**).
* **Current Action:** The price is consolidating right around the **$1,636.56** level. We are seeing a cluster of small-bodied candles, showing that the aggressive selling pressure is exhausting and buyers are starting to step in.
* **Risk/Reward Setup:** As marked by the long position tool on **TradingView_Screenshot_1781077759022~2.jpg**, a tight-risk long setup is forming as the price builds a base.
### **🎯 Trading Setup & Key Levels to Watch**
* **🟢 Entry Zone:** Around current levels (**$1,635 - $1,636**) or on a successful retest of the minor local support.
* **🔴 Stop Loss (SL):** Tight invalidation just below the local swing low at **$1,629**. If it breaks this structure, the next major downside target is sitting all the way down at **$1,612**.
* **🚀 Take Profit (TP):** The primary target is the overhead liquidity and previous structure breakdown point at **$1,645.73**. A clean break above this could spark a quick run back to **$1,674**.
$ETH 💡 Summary Sentiment**
This is a high-probability, low-risk scalp structure. By keeping the stop loss incredibly tight right below **$1,629**, the risk-to-reward ratio looks highly favorable for a quick bounce back up to the minor resistance ceiling.
**What are your thoughts, creators?** Are you buying this micro-dip, or do you expect ETH to break lower toward the $1,612 demand zone? Let me know in the comments! 👇
#ETH #Ethereum #CryptoTrading #TechnicalAnalysis #BinanceSquare
🚀 ETH/USDT: Is a Relief Rally Brewing? | Key Levels & Long Setup 📈
Hey Binance Square Fam! 👋
Looking at the current **$ETH ** 4-hour chart in **TradingView_Screenshot_1781077759022~2.jpg**, Ethereum has been facing steady selling pressure over the last few days, but we are finally seeing some interesting signs of stabilization around a key support region.
Here is my quick technical breakdown and a potential scalp/swing setup I'm tracking! 👇
### **🔍 Technical Breakdown**
* **The Downtrend:** After breaking below the **$1,645** resistance zone, ETH found a local bottom just under **$1,630** (hitting a low around **$1,629.76**).
* **Current Action:** The price is consolidating right around the **$1,636.56** level. We are seeing a cluster of small-bodied candles, showing that the aggressive selling pressure is exhausting and buyers are starting to step in.
* **Risk/Reward Setup:** As marked by the long position tool on **TradingView_Screenshot_1781077759022~2.jpg**, a tight-risk long setup is forming as the price builds a base.
### **🎯 Trading Setup & Key Levels to Watch**
* **🟢 Entry Zone:** Around current levels (**$1,635 - $1,636**) or on a successful retest of the minor local support.
* **🔴 Stop Loss (SL):** Tight invalidation just below the local swing low at **$1,629**. If it breaks this structure, the next major downside target is sitting all the way down at **$1,612**.
* **🚀 Take Profit (TP):** The primary target is the overhead liquidity and previous structure breakdown point at **$1,645.73**. A clean break above this could spark a quick run back to **$1,674**.
$ETH 💡 Summary Sentiment**
This is a high-probability, low-risk scalp structure. By keeping the stop loss incredibly tight right below **$1,629**, the risk-to-reward ratio looks highly favorable for a quick bounce back up to the minor resistance ceiling.
**What are your thoughts, creators?** Are you buying this micro-dip, or do you expect ETH to break lower toward the $1,612 demand zone? Let me know in the comments! 👇
#ETH #Ethereum #CryptoTrading #TechnicalAnalysis #BinanceSquare
90



·
--
1
21
·
--
🚀 The DeFi frontier just got upgraded — @Injective ’s new tools are unlocking true Web3 creation for everyone. With $INJ powering the network, the launch of CreatorPad + native EVM and low-fee, high-speed infrastructure makes building on Injective easier than ever. Dive in, build, and shape the future. #Injective
🚀 The DeFi frontier just got upgraded — @Injective ’s new tools are unlocking true Web3 creation for everyone. With $INJ powering the network, the launch of CreatorPad + native EVM and low-fee, high-speed infrastructure makes building on Injective easier than ever. Dive in, build, and shape the future. #Injective
1
13
·
--
🚀 DeFi is entering a new phase of transparency and efficiency, and @LorenzoProtocol is setting the pace. With smart design, real yield potential, and a strong vision for decentralized banking, $BANK is positioned for long-term impact. #LorenzoProtocol
🚀 DeFi is entering a new phase of transparency and efficiency, and @Lorenzo Protocol is setting the pace. With smart design, real yield potential, and a strong vision for decentralized banking, $BANK is positioned for long-term impact. #LorenzoProtocol
11
·
--
Exploring the future of decentralized finance with @falcon_finance ! 🚀 The innovation behind $FF is setting new standards in speed, security, and user-first design. Excited to see how #FalconFinance transforms the ecosystem!
Exploring the future of decentralized finance with @Falcon Finance ! 🚀 The innovation behind $FF is setting new standards in speed, security, and user-first design. Excited to see how #FalconFinance transforms the ecosystem!
·
--
KITE is reshaping how traders access real-time AI insights! Loving how @GoKiteAI combines speed, accuracy, and automation to level up decisions. Excited to see where $KITE goes next. #KITE
KITE is reshaping how traders access real-time AI insights! Loving how @GoKiteAI combines speed, accuracy, and automation to level up decisions. Excited to see where $KITE goes next. #KITE
22
·
--
🚀 Exploring the future of zk-powered scaling with @LineaEth !
The ecosystem around $LINEA is growing fast — from dApps to cross-chain tools, everything feels smoother and more efficient. Dive into #Linea and discover why developers and users are calling it the next big leap in web3 scalability! 💡🔥
🚀 Exploring the future of zk-powered scaling with @Linea.eth !
The ecosystem around $LINEA is growing fast — from dApps to cross-chain tools, everything feels smoother and more efficient. Dive into #Linea and discover why developers and users are calling it the next big leap in web3 scalability! 💡🔥
The ecosystem around $LINEA is growing fast — from dApps to cross-chain tools, everything feels smoother and more efficient. Dive into #Linea and discover why developers and users are calling it the next big leap in web3 scalability! 💡🔥
·
--
🚀 The YGG Play Launchpad by @YieldGuildGames is now live! Explore and discover your favorite Web3 games from the YGG ecosystem, complete exciting quests, and get early access to new game tokens directly through the Launchpad. A new era of player-powered gaming starts here! #YGGPlay $YGG
🚀 The YGG Play Launchpad by @Yield Guild Games is now live! Explore and discover your favorite Web3 games from the YGG ecosystem, complete exciting quests, and get early access to new game tokens directly through the Launchpad. A new era of player-powered gaming starts here! #YGGPlay $YGG
·
--
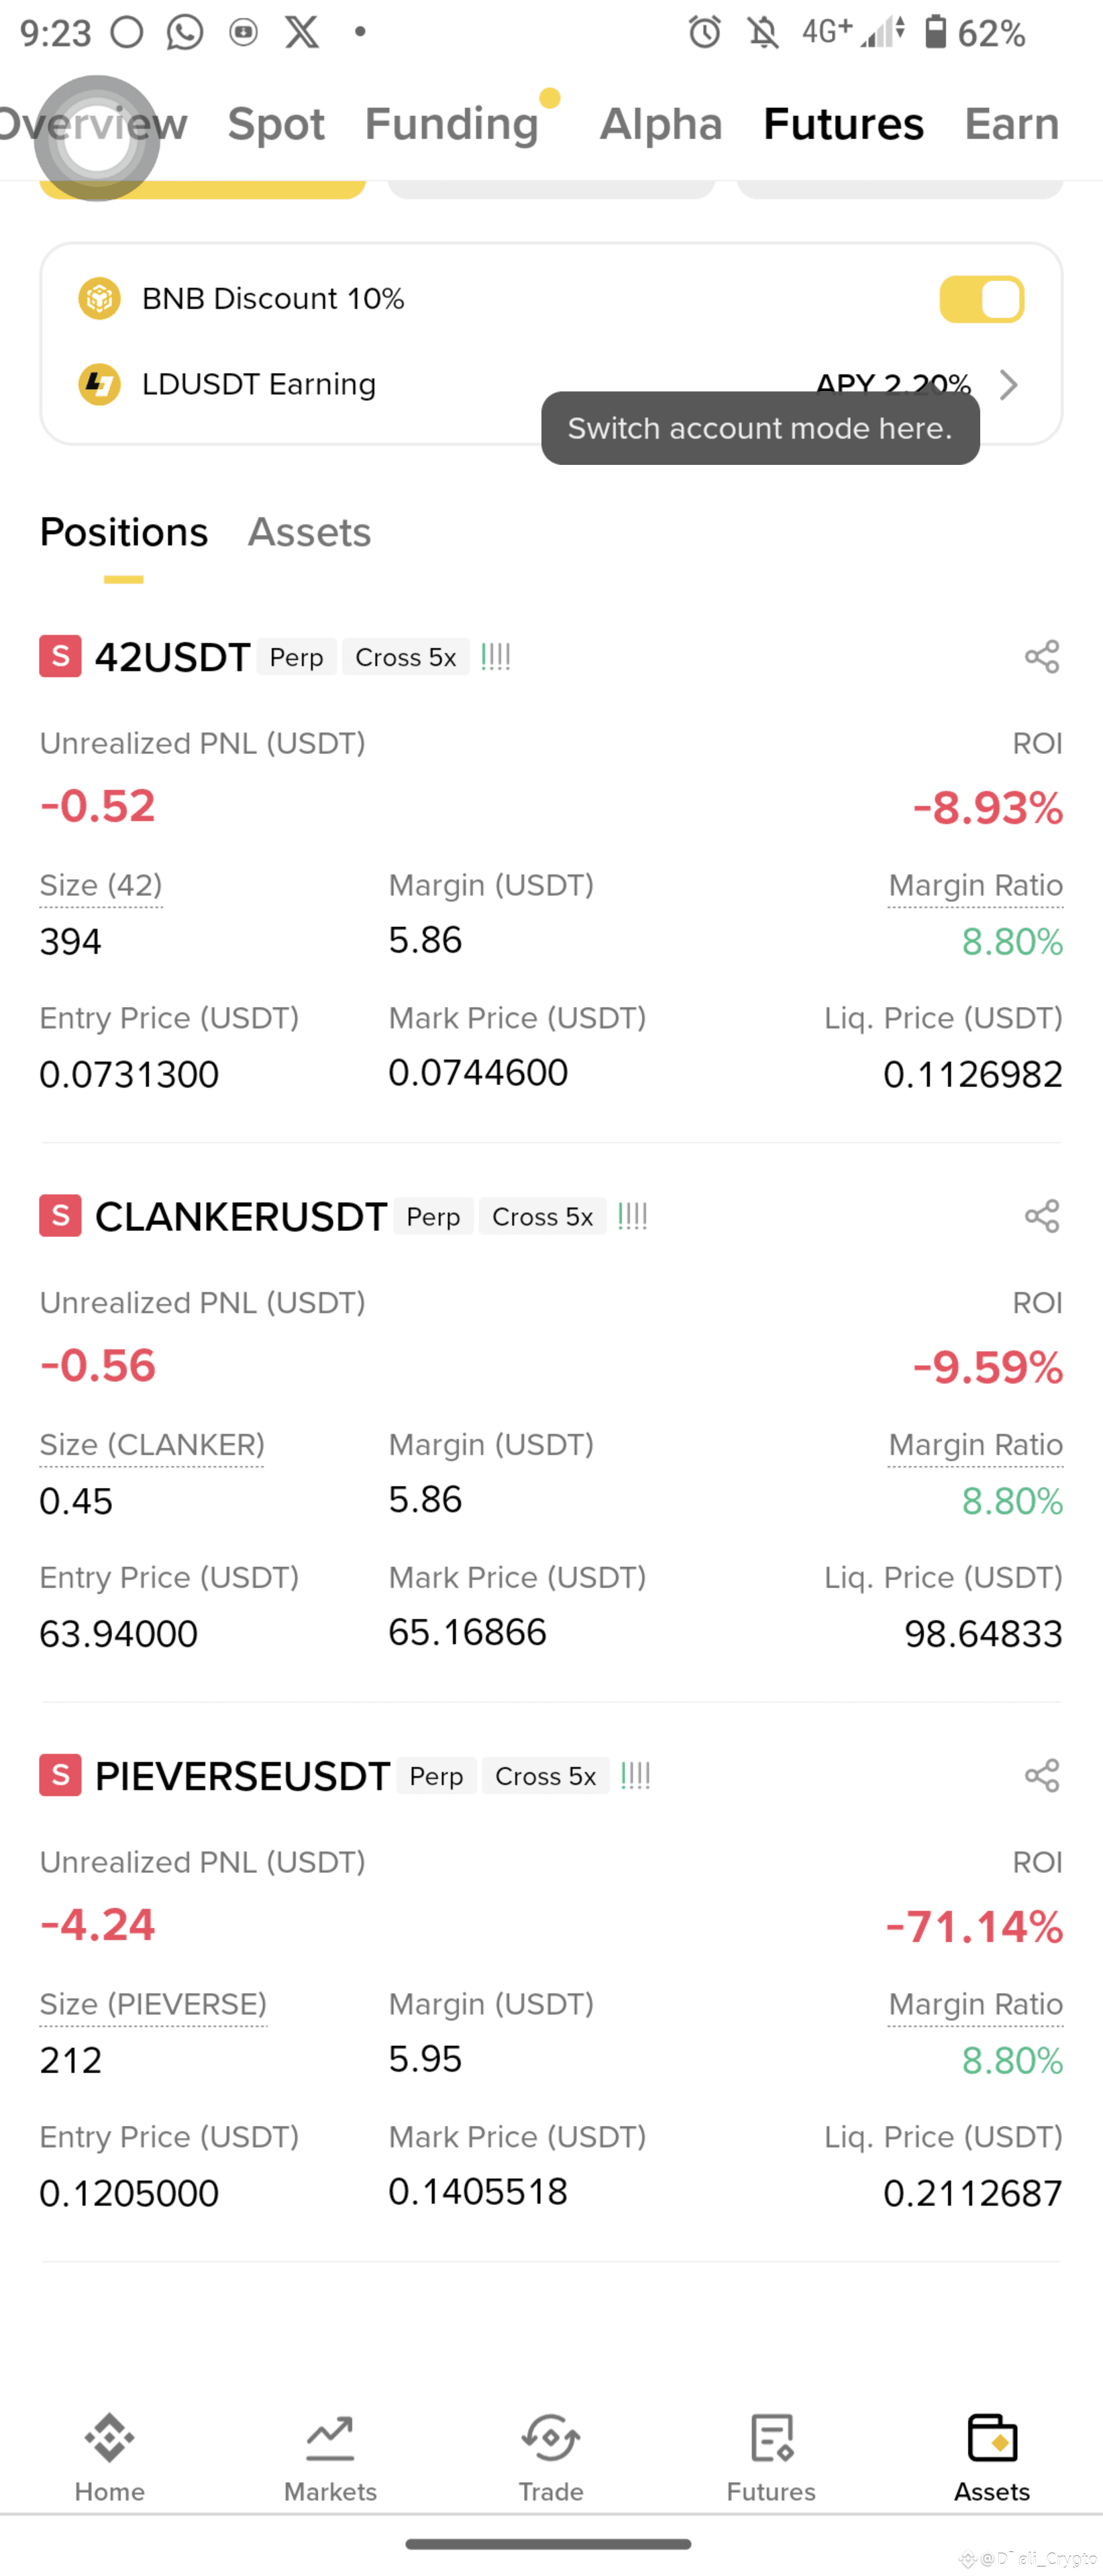
all time market is my against $CLANKER $42 $PIEVERSE
{future}(CLANKERUSDT)
{future}(42USDT)
{future}(PIEVERSEUSDT)
all time market is my against $CLANKER $42 $PIEVERSE
1
1
1
1k
·
--
it's not for me
it's not for me

Savage2654
·
--
ভাইরে ভাই কি মারাত্মক ইভেন্ট ট্রাই করে দেখতে পারেন যদি ভাগ্য পরিবর্তন হয়ে যায়🔥🔥 xpl trading task

·
--
40,000ff+7000xpl
40,000ff+7000xpl

MD Foyes Ahmed
·
--
BAD LUCK 😥😥😥
দুইটি স্পিন করে মাত্র 5 $XPL করে মাত্র 10 $XPL পেলাম। আপনারা কে কত পেয়েছেন জানিয়ে জান কমেন্টে। আপনারা কি অনলি 5$XPL পেয়েছেন 🤔হ#spin #XPL @Plasma
দুইটি স্পিন করে মাত্র 5 $XPL করে মাত্র 10 $XPL পেলাম। আপনারা কে কত পেয়েছেন জানিয়ে জান কমেন্টে। আপনারা কি অনলি 5$XPL পেয়েছেন 🤔হ#spin #XPL @Plasma

1
2
තවත් අන්තර්ගතයන් ගවේෂණය කිරීමට ඇතුල් වන්න
Binance චතුරශ්රය හි ගෝලීය ක්රිප්ටෝ පරිශීලකයින් හා එක්වන්න
⚡️ ක්රිප්ටෝ පිළිබඳ නවතම සහ ප්රයෝජනවත් තොරතුරු ලබා ගන්න.
💬 ලොව විශාලතම ක්රිප්ටෝ හුවමාරුව මගින් විශ්වාස කෙරේ.
👍 සත්යායනය කරන ලද නිර්මාණකරුවන්ගෙන් සැබෑ විදසුන් සොයා ගන්න.
විද්යුත් තැපෑල / දුරකථන අංකය