
CaptainAltcoin
26.5k පෝස්ටු

CaptainAltcoin
වාර්තා කරන්න
පරිශීලක අවහිර කරන්න
Ahoy, crypto sailors! Navigate the stormy seas of the digital world with CaptainAltcoin, your trusty compass for crypto guides, reviews, and news.
7 හඹා යමින්
101.4K+ හඹා යන්නන්
94.1K+ කැමති විය
2 ලාංජනය
පෝස්ටු
ලිපිය
පරිවර්තනය බලන්න
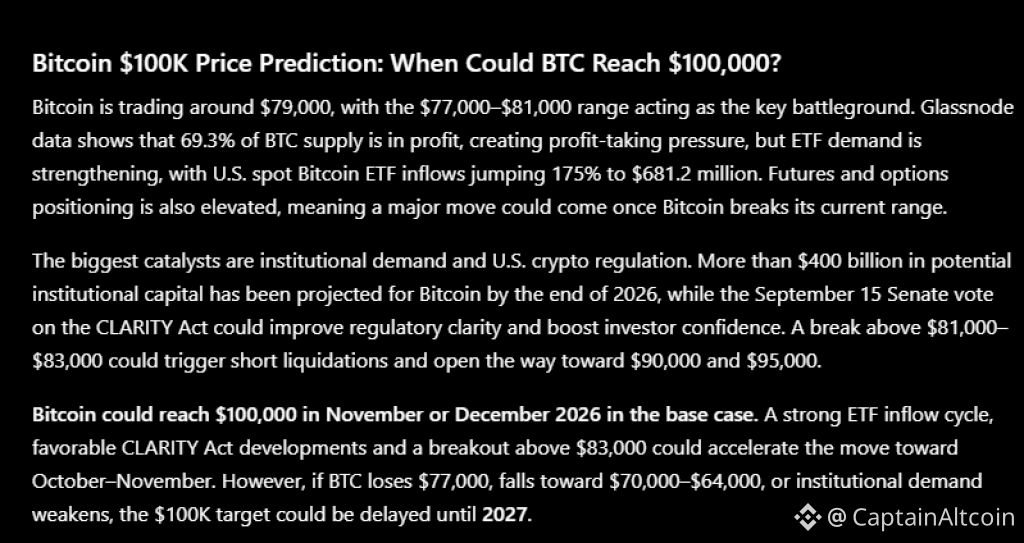
3 AI Models Predict When Bitcoin Price Will Reach $100KThe BTC price remains trapped between $77,000 and $81,000, with BTC up 0.7% at $78,647.30. Trading volume has fallen 16%, and Bitfinex analysts say market activity has moved toward altcoins, with all 29 largest liquid pairs gaining between 1% and 8% from September 1–8, compared with a median 10.2% gain versus 1.4% for Bitcoin.
Glassnode adds a warning: 69.3% of circulating Bitcoin supply is in profit, above its statistical high band. NUPL has reached 10.1%, and the Realized Profit/Loss ratio climbed 39% to 1.0.
With the Bitcoin price only about 27% below $100,000, we asked ChatGPT, Claude and Grok when BTC could finally reach the milestone.
ChatGPT Predicts Bitcoin Price Could Reach $100K in Q4 2026
ChatGPT places the most optimistic timeline on the table, with October-November 2026 as its bullish window and November-December 2026 as its base case. The reasoning starts with the $77,000-$81,000 range.
Source: ChatGPT
Bitcoin price needs to reclaim $81,000, then clear $82,000-$83,000, before the market has a stronger technical path toward $85,000, $90,000 and $95,000. A break above $91,000 would leave BTC less than 10% from $100,000.
Institutional flows provide another part of the argument. US spot Bitcoin ETF inflows increased 175% week-over-week to $681.2 million, up from $247.8 million. ETF MVRV also moved from -0.54 to 1.31, showing ETF holders moved into aggregate profit. Bitwise and UTXO Management have projected more than $400 billion in potential institutional capital through ETFs, corporate treasuries and strategic reserves by the end of 2026.
The major risk is profit-taking. Glassnode’s 69.3% supply-in-profit, NUPL at 10.1% and Hot Capital Share at 30.1%, above its 22.8% upper band, indicate that more price-sensitive capital is active. ChatGPT therefore sees $100K as achievable in late 2026, but a break below $77,000 could push the milestone into 2027.
Claude Sees Bitcoin Price Reaching $100K in Late 2026 or 2027
Claude takes a more cautious view. It points to the same bullish evidence, including the 175% increase in ETF inflows to $681.2 million, negative 25-delta skew at -2.05%, and the potential for more than $400 billion of institutional capital by the end of 2026.
Source: Claude AI
Yet the Bitcoin price remains range-bound, and derivatives positioning is elevated, with futures open interest at $37.1 billion and options open interest at $40.1 billion.
The warning signs are hard to ignore. Bitcoin supply in profit stands at 69.3%, Hot Capital Share has reached 30.1%, and the volatility spread is deeply negative at -20.87%. Coinbase’s prediction market gives BTC only a 23% implied probability of trading above $99,999.99 during 2026. Claude therefore views the market as positioned for a large move but does not treat an upside breakout as guaranteed.
Grok Predicts Bitcoin Price Will Reach $100K in 2027
Grok gives the most conservative timeline, placing the highest-probability window in Q2-Q4 2027. From roughly $78,500-$79,500, Bitcoin price needs another 25%-28% advance to reach $100,000.
Source: Grok AI
Grok points to the 69.3% supply-in-profit reading, 30.1% Hot Capital Share and elevated futures and options open interest as reasons BTC could face another period of consolidation or correction.
Prediction markets also support the cautious view. The provided data puts the probability of BTC reaching $100K during the remainder of 2026 around 23%-30%, rising toward roughly 40%-50% by March 2027, 50%-60% by mid-2027 and above 80% by the end of 2027.
The September 15 Senate cloture vote on the CLARITY Act could become an important catalyst, with passage potentially improving the regulatory environment for institutional participation.
Related Bitcoin News: Bitcoin Price Has 85 Days Before This Historic Buying Window Closes
Which Bitcoin Price Prediction Is Most Realistic?
The three AI models agree on one point: Bitcoin price needs to break the $81,000-$83,000 resistance zone before $100K becomes a near-term target.
ChatGPT offers the earliest timeline, Claude places more weight on the risks surrounding the breakout, and Grok gives 2027 the highest probability.
Based on the supplied data, November-December 2026 looks like the most balanced Bitcoin price prediction. ETF inflows of $681.2 million provide evidence of renewed institutional demand, but 69.3% of supply in profit and elevated leverage create resistance.
If the BTC price clears $83,000 and sustains buying pressure, $90,000 and $95,000 could follow. If $77,000 fails, the $100K target may have to wait until 2027.
Frequently Asked Questions
When will Bitcoin price reach $100,000
The most balanced forecast from the three AI models places the Bitcoin price at $100K around November-December 2026, although Grok sees 2027 as the higher-probability timeline.
What needs to happen for Bitcoin to reach $100K
Bitcoin price needs to break and hold above the $81,000-$83,000 resistance zone, followed by moves toward $90,000 and $95,000. Continued ETF inflows and institutional demand could provide additional buying pressure.
Why could Bitcoin fail to reach $100K in 2026
The biggest risks are profit-taking and elevated leverage. 69.3% of Bitcoin supply is in profit, Hot Capital Share is at 30.1%, and futures and options open interest remain elevated. A break below $77,000 could delay the $100K target into 2027.
Subscribe to our YouTube channel for daily crypto updates, market insights, and expert analysis.
The post 3 AI Models Predict When Bitcoin Price Will Reach $100K appeared first on CaptainAltcoin.
3 AI Models Predict When Bitcoin Price Will Reach $100K
The BTC price remains trapped between $77,000 and $81,000, with BTC up 0.7% at $78,647.30. Trading volume has fallen 16%, and Bitfinex analysts say market activity has moved toward altcoins, with all 29 largest liquid pairs gaining between 1% and 8% from September 1–8, compared with a median 10.2% gain versus 1.4% for Bitcoin.
Glassnode adds a warning: 69.3% of circulating Bitcoin supply is in profit, above its statistical high band. NUPL has reached 10.1%, and the Realized Profit/Loss ratio climbed 39% to 1.0.
With the Bitcoin price only about 27% below $100,000, we asked ChatGPT, Claude and Grok when BTC could finally reach the milestone.
ChatGPT Predicts Bitcoin Price Could Reach $100K in Q4 2026
ChatGPT places the most optimistic timeline on the table, with October-November 2026 as its bullish window and November-December 2026 as its base case. The reasoning starts with the $77,000-$81,000 range.
Source: ChatGPT
Bitcoin price needs to reclaim $81,000, then clear $82,000-$83,000, before the market has a stronger technical path toward $85,000, $90,000 and $95,000. A break above $91,000 would leave BTC less than 10% from $100,000.
Institutional flows provide another part of the argument. US spot Bitcoin ETF inflows increased 175% week-over-week to $681.2 million, up from $247.8 million. ETF MVRV also moved from -0.54 to 1.31, showing ETF holders moved into aggregate profit. Bitwise and UTXO Management have projected more than $400 billion in potential institutional capital through ETFs, corporate treasuries and strategic reserves by the end of 2026.
The major risk is profit-taking. Glassnode’s 69.3% supply-in-profit, NUPL at 10.1% and Hot Capital Share at 30.1%, above its 22.8% upper band, indicate that more price-sensitive capital is active. ChatGPT therefore sees $100K as achievable in late 2026, but a break below $77,000 could push the milestone into 2027.
Claude Sees Bitcoin Price Reaching $100K in Late 2026 or 2027
Claude takes a more cautious view. It points to the same bullish evidence, including the 175% increase in ETF inflows to $681.2 million, negative 25-delta skew at -2.05%, and the potential for more than $400 billion of institutional capital by the end of 2026.
Source: Claude AI
Yet the Bitcoin price remains range-bound, and derivatives positioning is elevated, with futures open interest at $37.1 billion and options open interest at $40.1 billion.
The warning signs are hard to ignore. Bitcoin supply in profit stands at 69.3%, Hot Capital Share has reached 30.1%, and the volatility spread is deeply negative at -20.87%. Coinbase’s prediction market gives BTC only a 23% implied probability of trading above $99,999.99 during 2026. Claude therefore views the market as positioned for a large move but does not treat an upside breakout as guaranteed.
Grok Predicts Bitcoin Price Will Reach $100K in 2027
Grok gives the most conservative timeline, placing the highest-probability window in Q2-Q4 2027. From roughly $78,500-$79,500, Bitcoin price needs another 25%-28% advance to reach $100,000.
Source: Grok AI
Grok points to the 69.3% supply-in-profit reading, 30.1% Hot Capital Share and elevated futures and options open interest as reasons BTC could face another period of consolidation or correction.
Prediction markets also support the cautious view. The provided data puts the probability of BTC reaching $100K during the remainder of 2026 around 23%-30%, rising toward roughly 40%-50% by March 2027, 50%-60% by mid-2027 and above 80% by the end of 2027.
The September 15 Senate cloture vote on the CLARITY Act could become an important catalyst, with passage potentially improving the regulatory environment for institutional participation.
Related Bitcoin News: Bitcoin Price Has 85 Days Before This Historic Buying Window Closes
Which Bitcoin Price Prediction Is Most Realistic?
The three AI models agree on one point: Bitcoin price needs to break the $81,000-$83,000 resistance zone before $100K becomes a near-term target.
ChatGPT offers the earliest timeline, Claude places more weight on the risks surrounding the breakout, and Grok gives 2027 the highest probability.
Based on the supplied data, November-December 2026 looks like the most balanced Bitcoin price prediction. ETF inflows of $681.2 million provide evidence of renewed institutional demand, but 69.3% of supply in profit and elevated leverage create resistance.
If the BTC price clears $83,000 and sustains buying pressure, $90,000 and $95,000 could follow. If $77,000 fails, the $100K target may have to wait until 2027.
Frequently Asked Questions
When will Bitcoin price reach $100,000
The most balanced forecast from the three AI models places the Bitcoin price at $100K around November-December 2026, although Grok sees 2027 as the higher-probability timeline.
What needs to happen for Bitcoin to reach $100K
Bitcoin price needs to break and hold above the $81,000-$83,000 resistance zone, followed by moves toward $90,000 and $95,000. Continued ETF inflows and institutional demand could provide additional buying pressure.
Why could Bitcoin fail to reach $100K in 2026
The biggest risks are profit-taking and elevated leverage. 69.3% of Bitcoin supply is in profit, Hot Capital Share is at 30.1%, and futures and options open interest remain elevated. A break below $77,000 could delay the $100K target into 2027.
Subscribe to our YouTube channel for daily crypto updates, market insights, and expert analysis.
The post 3 AI Models Predict When Bitcoin Price Will Reach $100K appeared first on CaptainAltcoin.
Glassnode adds a warning: 69.3% of circulating Bitcoin supply is in profit, above its statistical high band. NUPL has reached 10.1%, and the Realized Profit/Loss ratio climbed 39% to 1.0.
With the Bitcoin price only about 27% below $100,000, we asked ChatGPT, Claude and Grok when BTC could finally reach the milestone.
ChatGPT Predicts Bitcoin Price Could Reach $100K in Q4 2026
ChatGPT places the most optimistic timeline on the table, with October-November 2026 as its bullish window and November-December 2026 as its base case. The reasoning starts with the $77,000-$81,000 range.
Source: ChatGPT
Bitcoin price needs to reclaim $81,000, then clear $82,000-$83,000, before the market has a stronger technical path toward $85,000, $90,000 and $95,000. A break above $91,000 would leave BTC less than 10% from $100,000.
Institutional flows provide another part of the argument. US spot Bitcoin ETF inflows increased 175% week-over-week to $681.2 million, up from $247.8 million. ETF MVRV also moved from -0.54 to 1.31, showing ETF holders moved into aggregate profit. Bitwise and UTXO Management have projected more than $400 billion in potential institutional capital through ETFs, corporate treasuries and strategic reserves by the end of 2026.
The major risk is profit-taking. Glassnode’s 69.3% supply-in-profit, NUPL at 10.1% and Hot Capital Share at 30.1%, above its 22.8% upper band, indicate that more price-sensitive capital is active. ChatGPT therefore sees $100K as achievable in late 2026, but a break below $77,000 could push the milestone into 2027.
Claude Sees Bitcoin Price Reaching $100K in Late 2026 or 2027
Claude takes a more cautious view. It points to the same bullish evidence, including the 175% increase in ETF inflows to $681.2 million, negative 25-delta skew at -2.05%, and the potential for more than $400 billion of institutional capital by the end of 2026.
Source: Claude AI
Yet the Bitcoin price remains range-bound, and derivatives positioning is elevated, with futures open interest at $37.1 billion and options open interest at $40.1 billion.
The warning signs are hard to ignore. Bitcoin supply in profit stands at 69.3%, Hot Capital Share has reached 30.1%, and the volatility spread is deeply negative at -20.87%. Coinbase’s prediction market gives BTC only a 23% implied probability of trading above $99,999.99 during 2026. Claude therefore views the market as positioned for a large move but does not treat an upside breakout as guaranteed.
Grok Predicts Bitcoin Price Will Reach $100K in 2027
Grok gives the most conservative timeline, placing the highest-probability window in Q2-Q4 2027. From roughly $78,500-$79,500, Bitcoin price needs another 25%-28% advance to reach $100,000.
Source: Grok AI
Grok points to the 69.3% supply-in-profit reading, 30.1% Hot Capital Share and elevated futures and options open interest as reasons BTC could face another period of consolidation or correction.
Prediction markets also support the cautious view. The provided data puts the probability of BTC reaching $100K during the remainder of 2026 around 23%-30%, rising toward roughly 40%-50% by March 2027, 50%-60% by mid-2027 and above 80% by the end of 2027.
The September 15 Senate cloture vote on the CLARITY Act could become an important catalyst, with passage potentially improving the regulatory environment for institutional participation.
Related Bitcoin News: Bitcoin Price Has 85 Days Before This Historic Buying Window Closes
Which Bitcoin Price Prediction Is Most Realistic?
The three AI models agree on one point: Bitcoin price needs to break the $81,000-$83,000 resistance zone before $100K becomes a near-term target.
ChatGPT offers the earliest timeline, Claude places more weight on the risks surrounding the breakout, and Grok gives 2027 the highest probability.
Based on the supplied data, November-December 2026 looks like the most balanced Bitcoin price prediction. ETF inflows of $681.2 million provide evidence of renewed institutional demand, but 69.3% of supply in profit and elevated leverage create resistance.
If the BTC price clears $83,000 and sustains buying pressure, $90,000 and $95,000 could follow. If $77,000 fails, the $100K target may have to wait until 2027.
Frequently Asked Questions
When will Bitcoin price reach $100,000
The most balanced forecast from the three AI models places the Bitcoin price at $100K around November-December 2026, although Grok sees 2027 as the higher-probability timeline.
What needs to happen for Bitcoin to reach $100K
Bitcoin price needs to break and hold above the $81,000-$83,000 resistance zone, followed by moves toward $90,000 and $95,000. Continued ETF inflows and institutional demand could provide additional buying pressure.
Why could Bitcoin fail to reach $100K in 2026
The biggest risks are profit-taking and elevated leverage. 69.3% of Bitcoin supply is in profit, Hot Capital Share is at 30.1%, and futures and options open interest remain elevated. A break below $77,000 could delay the $100K target into 2027.
Subscribe to our YouTube channel for daily crypto updates, market insights, and expert analysis.
The post 3 AI Models Predict When Bitcoin Price Will Reach $100K appeared first on CaptainAltcoin.
50

ලිපිය
පරිවර්තනය බලන්න
XRP Price Battles $1.70 Resistance, DigiTap Is Chasing Its Own 10x Path From a $0.0589 Presale EntryXRP is back on breakout watch after its powerful August recovery pushed the token as high as the $1.70 region. The price has since consolidated around $1.40, leaving bulls with a clear challenge: reclaim the $1.50 to $1.55 area before another attack on $1.70.
For buyers chasing a much earlier entry, DigiTap ($TAP) presents a different setup. $TAP remains in presale at $0.0589, more than $11.37 million has been raised and over 350 million tokens have been sold. With Round 4 of 10 already more than 80% complete, DigiTap is chasing its own path toward the kind of percentage gains that become harder for established large-cap tokens to deliver.
XRP needs to reclaim $1.50 before $1.70
XRP’s August rebound demonstrated how quickly momentum can return to a major cryptocurrency. The token climbed from around $1 to approximately $1.70 before pulling back, and recent trading has left XRP near $1.40.
The technical roadmap now looks relatively clear. XRP has support around $1.35, while the $1.50 to $1.55 region forms the next significant resistance zone. Clearing that range could put the August high near $1.70 back into focus.
ETF demand adds another catalyst. U.S. spot XRP ETFs attracted $110.49 million during the week ending August 28, their strongest weekly inflow of 2026. Continued institutional demand could help XRP make another attempt at its recent highs.
However, XRP is already one of crypto’s largest assets. That scale gives it deep liquidity and an established market, but it also means buyers looking for a 5x or 10x move need dramatically more capital to enter.
DigiTap starts from just $0.0589
That is where DigiTap offers a completely different proposition. Instead of trying to multiply from an established multi-billion-dollar valuation, $TAP has not yet reached public exchanges.
DigiTap currently costs $0.0589 in Round 4, with the next presale price increasing to $0.0594. More than $11.37 million has been raised and over 350 million $TAP have already been sold, showing substantial demand before exchange trading begins.
A 10x move from the current $0.0589 presale price would put $TAP around $0.589. Before that becomes the bigger target, buyers have a much nearer price marker to watch. DigiTap’s listing price is $0.14, more than double the current presale entry.
For retail buyers searching for asymmetric upside, that creates a simple contrast. XRP is trying to revisit an established resistance level, while DigiTap buyers are entering before the token has even formed its first public-market chart.
DigiTap has a live product behind the early entry
DigiTap’s 10x narrative is not built around token price alone. Its beta app is already downloadable through the App Store and Google Play, giving the presale a working-product angle before $TAP reaches exchanges.
The app combines crypto wallets, fiat functionality and cards in one ecosystem while supporting more than 100 crypto assets. DigiTap’s Basic Wallet Plan can be accessed without KYC documentation, while its virtual card connects crypto holdings with everyday spending.
That puts DigiTap directly into the growing crypto-payments narrative. Stablecoin cards are increasingly being used as a bridge between digital assets and traditional payment networks, with annual stablecoin card spending forecast to reach $50 billion by 2028.
Rather than waiting for that market to mature before building a product, DigiTap already has its beta app available while its token remains at presale pricing.
Fixed supply strengthens the 10x narrative
$TAP has a fixed 2 billion token supply, with just 1% allocated to the team and locked for five years. Staking rewards come from a dedicated 180 million $TAP pool rather than new token issuance.
Utility includes cashback, fee discounts and VIP benefits, while DigiTap plans to use 50% of app fee profits for open-market $TAP buybacks and burns.
XRP targets $1.70 while DigiTap hunts a bigger multiple
XRP reclaiming $1.70 would confirm another major step in its 2026 recovery. The immediate challenge is getting through $1.50 to $1.55 and rebuilding enough momentum to retest its August high.
DigiTap sits much earlier on the curve. $TAP is still $0.0589, Round 4 is over 80% sold and the next price rises to $0.0594 before its $0.14 listing price.
For buyers chasing a potential 10x path, DigiTap combines that earlier entry with a downloadable app, 350 million+ tokens already sold and a fixed 2 billion maximum supply. XRP may be fighting to reclaim $1.70, but DigiTap is still waiting for its first public exchange chart to begin.
VISIT DIGITAP OFFICIAL WEBSITE
What resistance does XRP need to break?
XRP first needs to reclaim the $1.50 to $1.55 region before the August high around $1.70 becomes the next major target.
What would a 10x move from $0.0589 put TAP at?
A 10x move from DigiTap’s current $0.0589 presale price would mathematically put $TAP at approximately $0.589.
What is DigiTap’s next presale price?
$TAP currently costs $0.0589, with the next presale price increasing to $0.0594 as Round 4 progresses.
DISCLAIMER: CAPTAINALTCOIN DOES NOT ENDORSE INVESTING IN ANY PROJECT MENTIONED IN SPONSORED ARTICLES. EXERCISE CAUTION AND DO THOROUGH RESEARCH BEFORE INVESTING YOUR MONEY. CaptainAltcoin takes no responsibility for its accuracy or quality. This content was not written by CaptainAltcoin’s team. We strongly advise readers to do their own thorough research before interacting with any featured companies. The information provided is not financial or legal advice. Neither CaptainAltcoin nor any third party recommends buying or selling any financial products. Investing in crypto assets is high-risk; consider the potential for loss. Any investment decisions made based on this content are at the sole risk of the readCaptainAltcoin is not liable for any damages or losses from using or relying on this content.
The post XRP Price Battles $1.70 Resistance, DigiTap Is Chasing Its Own 10x Path From a $0.0589 Presale Entry appeared first on CaptainAltcoin.
XRP Price Battles $1.70 Resistance, DigiTap Is Chasing Its Own 10x Path From a $0.0589 Presale Entry
XRP is back on breakout watch after its powerful August recovery pushed the token as high as the $1.70 region. The price has since consolidated around $1.40, leaving bulls with a clear challenge: reclaim the $1.50 to $1.55 area before another attack on $1.70.
For buyers chasing a much earlier entry, DigiTap ($TAP) presents a different setup. $TAP remains in presale at $0.0589, more than $11.37 million has been raised and over 350 million tokens have been sold. With Round 4 of 10 already more than 80% complete, DigiTap is chasing its own path toward the kind of percentage gains that become harder for established large-cap tokens to deliver.
XRP needs to reclaim $1.50 before $1.70
XRP’s August rebound demonstrated how quickly momentum can return to a major cryptocurrency. The token climbed from around $1 to approximately $1.70 before pulling back, and recent trading has left XRP near $1.40.
The technical roadmap now looks relatively clear. XRP has support around $1.35, while the $1.50 to $1.55 region forms the next significant resistance zone. Clearing that range could put the August high near $1.70 back into focus.
ETF demand adds another catalyst. U.S. spot XRP ETFs attracted $110.49 million during the week ending August 28, their strongest weekly inflow of 2026. Continued institutional demand could help XRP make another attempt at its recent highs.
However, XRP is already one of crypto’s largest assets. That scale gives it deep liquidity and an established market, but it also means buyers looking for a 5x or 10x move need dramatically more capital to enter.
DigiTap starts from just $0.0589
That is where DigiTap offers a completely different proposition. Instead of trying to multiply from an established multi-billion-dollar valuation, $TAP has not yet reached public exchanges.
DigiTap currently costs $0.0589 in Round 4, with the next presale price increasing to $0.0594. More than $11.37 million has been raised and over 350 million $TAP have already been sold, showing substantial demand before exchange trading begins.
A 10x move from the current $0.0589 presale price would put $TAP around $0.589. Before that becomes the bigger target, buyers have a much nearer price marker to watch. DigiTap’s listing price is $0.14, more than double the current presale entry.
For retail buyers searching for asymmetric upside, that creates a simple contrast. XRP is trying to revisit an established resistance level, while DigiTap buyers are entering before the token has even formed its first public-market chart.
DigiTap has a live product behind the early entry
DigiTap’s 10x narrative is not built around token price alone. Its beta app is already downloadable through the App Store and Google Play, giving the presale a working-product angle before $TAP reaches exchanges.
The app combines crypto wallets, fiat functionality and cards in one ecosystem while supporting more than 100 crypto assets. DigiTap’s Basic Wallet Plan can be accessed without KYC documentation, while its virtual card connects crypto holdings with everyday spending.
That puts DigiTap directly into the growing crypto-payments narrative. Stablecoin cards are increasingly being used as a bridge between digital assets and traditional payment networks, with annual stablecoin card spending forecast to reach $50 billion by 2028.
Rather than waiting for that market to mature before building a product, DigiTap already has its beta app available while its token remains at presale pricing.
Fixed supply strengthens the 10x narrative
$TAP has a fixed 2 billion token supply, with just 1% allocated to the team and locked for five years. Staking rewards come from a dedicated 180 million $TAP pool rather than new token issuance.
Utility includes cashback, fee discounts and VIP benefits, while DigiTap plans to use 50% of app fee profits for open-market $TAP buybacks and burns.
XRP targets $1.70 while DigiTap hunts a bigger multiple
XRP reclaiming $1.70 would confirm another major step in its 2026 recovery. The immediate challenge is getting through $1.50 to $1.55 and rebuilding enough momentum to retest its August high.
DigiTap sits much earlier on the curve. $TAP is still $0.0589, Round 4 is over 80% sold and the next price rises to $0.0594 before its $0.14 listing price.
For buyers chasing a potential 10x path, DigiTap combines that earlier entry with a downloadable app, 350 million+ tokens already sold and a fixed 2 billion maximum supply. XRP may be fighting to reclaim $1.70, but DigiTap is still waiting for its first public exchange chart to begin.
VISIT DIGITAP OFFICIAL WEBSITE
What resistance does XRP need to break?
XRP first needs to reclaim the $1.50 to $1.55 region before the August high around $1.70 becomes the next major target.
What would a 10x move from $0.0589 put TAP at?
A 10x move from DigiTap’s current $0.0589 presale price would mathematically put $TAP at approximately $0.589.
What is DigiTap’s next presale price?
$TAP currently costs $0.0589, with the next presale price increasing to $0.0594 as Round 4 progresses.
DISCLAIMER: CAPTAINALTCOIN DOES NOT ENDORSE INVESTING IN ANY PROJECT MENTIONED IN SPONSORED ARTICLES. EXERCISE CAUTION AND DO THOROUGH RESEARCH BEFORE INVESTING YOUR MONEY. CaptainAltcoin takes no responsibility for its accuracy or quality. This content was not written by CaptainAltcoin’s team. We strongly advise readers to do their own thorough research before interacting with any featured companies. The information provided is not financial or legal advice. Neither CaptainAltcoin nor any third party recommends buying or selling any financial products. Investing in crypto assets is high-risk; consider the potential for loss. Any investment decisions made based on this content are at the sole risk of the readCaptainAltcoin is not liable for any damages or losses from using or relying on this content.
The post XRP Price Battles $1.70 Resistance, DigiTap Is Chasing Its Own 10x Path From a $0.0589 Presale Entry appeared first on CaptainAltcoin.
For buyers chasing a much earlier entry, DigiTap ($TAP) presents a different setup. $TAP remains in presale at $0.0589, more than $11.37 million has been raised and over 350 million tokens have been sold. With Round 4 of 10 already more than 80% complete, DigiTap is chasing its own path toward the kind of percentage gains that become harder for established large-cap tokens to deliver.
XRP needs to reclaim $1.50 before $1.70
XRP’s August rebound demonstrated how quickly momentum can return to a major cryptocurrency. The token climbed from around $1 to approximately $1.70 before pulling back, and recent trading has left XRP near $1.40.
The technical roadmap now looks relatively clear. XRP has support around $1.35, while the $1.50 to $1.55 region forms the next significant resistance zone. Clearing that range could put the August high near $1.70 back into focus.
ETF demand adds another catalyst. U.S. spot XRP ETFs attracted $110.49 million during the week ending August 28, their strongest weekly inflow of 2026. Continued institutional demand could help XRP make another attempt at its recent highs.
However, XRP is already one of crypto’s largest assets. That scale gives it deep liquidity and an established market, but it also means buyers looking for a 5x or 10x move need dramatically more capital to enter.
DigiTap starts from just $0.0589
That is where DigiTap offers a completely different proposition. Instead of trying to multiply from an established multi-billion-dollar valuation, $TAP has not yet reached public exchanges.
DigiTap currently costs $0.0589 in Round 4, with the next presale price increasing to $0.0594. More than $11.37 million has been raised and over 350 million $TAP have already been sold, showing substantial demand before exchange trading begins.
A 10x move from the current $0.0589 presale price would put $TAP around $0.589. Before that becomes the bigger target, buyers have a much nearer price marker to watch. DigiTap’s listing price is $0.14, more than double the current presale entry.
For retail buyers searching for asymmetric upside, that creates a simple contrast. XRP is trying to revisit an established resistance level, while DigiTap buyers are entering before the token has even formed its first public-market chart.
DigiTap has a live product behind the early entry
DigiTap’s 10x narrative is not built around token price alone. Its beta app is already downloadable through the App Store and Google Play, giving the presale a working-product angle before $TAP reaches exchanges.
The app combines crypto wallets, fiat functionality and cards in one ecosystem while supporting more than 100 crypto assets. DigiTap’s Basic Wallet Plan can be accessed without KYC documentation, while its virtual card connects crypto holdings with everyday spending.
That puts DigiTap directly into the growing crypto-payments narrative. Stablecoin cards are increasingly being used as a bridge between digital assets and traditional payment networks, with annual stablecoin card spending forecast to reach $50 billion by 2028.
Rather than waiting for that market to mature before building a product, DigiTap already has its beta app available while its token remains at presale pricing.
Fixed supply strengthens the 10x narrative
$TAP has a fixed 2 billion token supply, with just 1% allocated to the team and locked for five years. Staking rewards come from a dedicated 180 million $TAP pool rather than new token issuance.
Utility includes cashback, fee discounts and VIP benefits, while DigiTap plans to use 50% of app fee profits for open-market $TAP buybacks and burns.
XRP targets $1.70 while DigiTap hunts a bigger multiple
XRP reclaiming $1.70 would confirm another major step in its 2026 recovery. The immediate challenge is getting through $1.50 to $1.55 and rebuilding enough momentum to retest its August high.
DigiTap sits much earlier on the curve. $TAP is still $0.0589, Round 4 is over 80% sold and the next price rises to $0.0594 before its $0.14 listing price.
For buyers chasing a potential 10x path, DigiTap combines that earlier entry with a downloadable app, 350 million+ tokens already sold and a fixed 2 billion maximum supply. XRP may be fighting to reclaim $1.70, but DigiTap is still waiting for its first public exchange chart to begin.
VISIT DIGITAP OFFICIAL WEBSITE
What resistance does XRP need to break?
XRP first needs to reclaim the $1.50 to $1.55 region before the August high around $1.70 becomes the next major target.
What would a 10x move from $0.0589 put TAP at?
A 10x move from DigiTap’s current $0.0589 presale price would mathematically put $TAP at approximately $0.589.
What is DigiTap’s next presale price?
$TAP currently costs $0.0589, with the next presale price increasing to $0.0594 as Round 4 progresses.
DISCLAIMER: CAPTAINALTCOIN DOES NOT ENDORSE INVESTING IN ANY PROJECT MENTIONED IN SPONSORED ARTICLES. EXERCISE CAUTION AND DO THOROUGH RESEARCH BEFORE INVESTING YOUR MONEY. CaptainAltcoin takes no responsibility for its accuracy or quality. This content was not written by CaptainAltcoin’s team. We strongly advise readers to do their own thorough research before interacting with any featured companies. The information provided is not financial or legal advice. Neither CaptainAltcoin nor any third party recommends buying or selling any financial products. Investing in crypto assets is high-risk; consider the potential for loss. Any investment decisions made based on this content are at the sole risk of the readCaptainAltcoin is not liable for any damages or losses from using or relying on this content.
The post XRP Price Battles $1.70 Resistance, DigiTap Is Chasing Its Own 10x Path From a $0.0589 Presale Entry appeared first on CaptainAltcoin.
104
පරිවර්තනය බලන්න
Gold Price Forecast: Analyst Predicts $5,000 Gold By Mid-OctoberGold has pushed above $4,390 an ounce as a weaker US dollar gives the metal room to recover, even as investors weigh hotter inflation risks and rising expectations for a Federal Reserve rate hike.
The dollar has fallen to a four-month low, giving the gold price a key source of support ahead of US PPI and CPI data. Markets are assigning about a 60% probability to a Fed rate hike on September 16, making Thursday’s PPI and Friday’s CPI releases crucial for the next move.
Also, oil prices have reached their highest level in more than three months as US-Iran tensions intensify. With the gold price reacting from $4,364.60, analyst Rashad Hajiyev sees a path toward $4,900-$5,000 by early to mid-October.
Gold Price Chart Shows a Potential Breakout Pattern
We had a look at the chart, and the technical setup behind Hajiyev’s forecast is clear. Gold fell from the February-March highs above $5,500 toward a June-July base near $3,900-$4,000 before reversing higher in August. That recovery carried the gold price toward roughly $4,700 before sellers pushed it back toward the $4,300-$4,400 area.
My view on gold for the next 4-6 weeks with immediate target of $4.9 – 5k by early to mid October… pic.twitter.com/OPEpWaJ1Dc
— Rashad Hajiyev (@hajiyev_rashad) September 9, 2026
The latest structure resembles a symmetrical triangle, with a descending resistance line connecting the August high near $4,700 to lower highs around $4,500-$4,600.
Also, rising support connects the August and September lows, creating a narrowing range. The chart shows gold trading close to $4,390, almost directly around the middle of this structure. A breakout above the descending trendline would open the door toward $4,700 first, followed by the $4,900-$5,000 region marked by the analyst’s projected path.
Hajiyev’s forecast is therefore based on more than a round-number target. His chart maps several potential stages: $4,512, $4,566, $4,695.59, $4,770.72, $4,891 and finally $5,015.
From $4,390, a move to $5,000 would represent a gain of about 13.9%. The key requirement is for gold to escape the triangle and establish support above its previous resistance levels.
What Is Driving the Gold Price Right Now?
Ole Hansen’s analysis presents a more balanced picture. Gold is trapped between two competing forces: higher Treasury yields and stronger rate-hike expectations are pressuring the non-yielding metal, but a weaker dollar, resilient ETF and futures demand, and elevated geopolitical risk are helping limit downside pressure.
Gold rangebound as weaker dollar offsets rate-hike and inflation risks. Gold traders – and the algorithmic programmes that account for a significant share of day-to-day activity – are currently struggling to determine which of several competing themes will ultimately set the… pic.twitter.com/2NsjNRVYKs
— Ole S Hansen (@Ole_S_Hansen) September 9, 2026
The inflation data could decide which force wins. Core PPI is forecast at 0.3% month-on-month, up from 0.2%, with headline PPI expected at 0.4% versus 0.0% previously. US unemployment claims are forecast at 205,000, compared with 206,000 previously.
Core CPI is expected at 0.2% month-on-month and 2.4% year-on-year, compared with 2.5% previously for the annual figure. Headline CPI is projected at 0.4% month-on-month and 3.4% year-on-year.
Inflation Data Could Decide the Next Gold Price Move
The message from Hansen’s analysis is that gold needs a catalyst to escape its current range. A hotter-than-expected PPI or CPI reading could reinforce expectations for a Fed hike, keep Treasury yields elevated and make it harder for the gold price to break higher. That would leave the triangle intact and increase the importance of the lower trendline.
A softer inflation report would create the opposite setup. If inflation comes in below forecasts, markets could reduce rate-hike expectations, easing pressure from Treasury yields. Combined with the weaker dollar, that could give gold enough fuel to challenge the $4,512 and $4,566 resistance levels.
The geopolitical backdrop also matters. Intensifying US-Iran tensions and higher oil prices create additional inflation uncertainty, but they can also strengthen demand for gold as a portfolio diversifier. This leaves the September 16 Fed decision as the major event after this week’s data.
Related Gold Price: Gold Price Warning: A Supply Problem the Market Isn’t Ready For
Our Gold Price Prediction: $5,015 Is the Final Bullish Target
The gold price is reacting from $4,364.60, making $4,512 the first upside objective. A daily move through that level would put $4,566 next. If buyers push beyond $4,566, the chart points to $4,695.59, followed by $4,770.72.
A sustained break above those levels would strengthen the case for $4,891, with $5,015 becoming the final target in the bullish path. From $4,390 to $5,015, gold would need to rise approximately 14.2%.
The immediate risk is a breakdown below the rising support line around the $4,300-$4,350 region. For now, the technical structure keeps the $5,000 forecast alive, but inflation data and Treasury yields will determine whether the gold price can turn the projected path into an actual breakout.
Frequently Asked Questions
Can gold reach $5,000 by mid-October
Yes, the bullish technical setup points to $5,000-$5,015 as a possible target if gold breaks above $4,566 and continues through $4,695.59, $4,770.72 and $4,891.
What could push the gold price higher
A weaker US dollar, softer US inflation data, lower Treasury yields and elevated geopolitical tensions could support gold by reducing pressure from Fed rate-hike expectations and increasing demand for the precious metal.
Will a Fed rate hike hurt the gold price
A Fed rate hike could pressure gold because higher interest rates and Treasury yields increase the opportunity cost of holding a non-yielding asset. A hotter CPI or PPI reading could therefore create additional resistance for the gold price.
Subscribe to our YouTube channel for daily crypto updates, market insights, and expert analysis.
The post Gold Price Forecast: Analyst Predicts $5,000 Gold by Mid-October appeared first on CaptainAltcoin.
Gold Price Forecast: Analyst Predicts $5,000 Gold By Mid-October
Gold has pushed above $4,390 an ounce as a weaker US dollar gives the metal room to recover, even as investors weigh hotter inflation risks and rising expectations for a Federal Reserve rate hike.
The dollar has fallen to a four-month low, giving the gold price a key source of support ahead of US PPI and CPI data. Markets are assigning about a 60% probability to a Fed rate hike on September 16, making Thursday’s PPI and Friday’s CPI releases crucial for the next move.
Also, oil prices have reached their highest level in more than three months as US-Iran tensions intensify. With the gold price reacting from $4,364.60, analyst Rashad Hajiyev sees a path toward $4,900-$5,000 by early to mid-October.
Gold Price Chart Shows a Potential Breakout Pattern
We had a look at the chart, and the technical setup behind Hajiyev’s forecast is clear. Gold fell from the February-March highs above $5,500 toward a June-July base near $3,900-$4,000 before reversing higher in August. That recovery carried the gold price toward roughly $4,700 before sellers pushed it back toward the $4,300-$4,400 area.
My view on gold for the next 4-6 weeks with immediate target of $4.9 – 5k by early to mid October… pic.twitter.com/OPEpWaJ1Dc
— Rashad Hajiyev (@hajiyev_rashad) September 9, 2026
The latest structure resembles a symmetrical triangle, with a descending resistance line connecting the August high near $4,700 to lower highs around $4,500-$4,600.
Also, rising support connects the August and September lows, creating a narrowing range. The chart shows gold trading close to $4,390, almost directly around the middle of this structure. A breakout above the descending trendline would open the door toward $4,700 first, followed by the $4,900-$5,000 region marked by the analyst’s projected path.
Hajiyev’s forecast is therefore based on more than a round-number target. His chart maps several potential stages: $4,512, $4,566, $4,695.59, $4,770.72, $4,891 and finally $5,015.
From $4,390, a move to $5,000 would represent a gain of about 13.9%. The key requirement is for gold to escape the triangle and establish support above its previous resistance levels.
What Is Driving the Gold Price Right Now?
Ole Hansen’s analysis presents a more balanced picture. Gold is trapped between two competing forces: higher Treasury yields and stronger rate-hike expectations are pressuring the non-yielding metal, but a weaker dollar, resilient ETF and futures demand, and elevated geopolitical risk are helping limit downside pressure.
Gold rangebound as weaker dollar offsets rate-hike and inflation risks. Gold traders – and the algorithmic programmes that account for a significant share of day-to-day activity – are currently struggling to determine which of several competing themes will ultimately set the… pic.twitter.com/2NsjNRVYKs
— Ole S Hansen (@Ole_S_Hansen) September 9, 2026
The inflation data could decide which force wins. Core PPI is forecast at 0.3% month-on-month, up from 0.2%, with headline PPI expected at 0.4% versus 0.0% previously. US unemployment claims are forecast at 205,000, compared with 206,000 previously.
Core CPI is expected at 0.2% month-on-month and 2.4% year-on-year, compared with 2.5% previously for the annual figure. Headline CPI is projected at 0.4% month-on-month and 3.4% year-on-year.
Inflation Data Could Decide the Next Gold Price Move
The message from Hansen’s analysis is that gold needs a catalyst to escape its current range. A hotter-than-expected PPI or CPI reading could reinforce expectations for a Fed hike, keep Treasury yields elevated and make it harder for the gold price to break higher. That would leave the triangle intact and increase the importance of the lower trendline.
A softer inflation report would create the opposite setup. If inflation comes in below forecasts, markets could reduce rate-hike expectations, easing pressure from Treasury yields. Combined with the weaker dollar, that could give gold enough fuel to challenge the $4,512 and $4,566 resistance levels.
The geopolitical backdrop also matters. Intensifying US-Iran tensions and higher oil prices create additional inflation uncertainty, but they can also strengthen demand for gold as a portfolio diversifier. This leaves the September 16 Fed decision as the major event after this week’s data.
Related Gold Price: Gold Price Warning: A Supply Problem the Market Isn’t Ready For
Our Gold Price Prediction: $5,015 Is the Final Bullish Target
The gold price is reacting from $4,364.60, making $4,512 the first upside objective. A daily move through that level would put $4,566 next. If buyers push beyond $4,566, the chart points to $4,695.59, followed by $4,770.72.
A sustained break above those levels would strengthen the case for $4,891, with $5,015 becoming the final target in the bullish path. From $4,390 to $5,015, gold would need to rise approximately 14.2%.
The immediate risk is a breakdown below the rising support line around the $4,300-$4,350 region. For now, the technical structure keeps the $5,000 forecast alive, but inflation data and Treasury yields will determine whether the gold price can turn the projected path into an actual breakout.
Frequently Asked Questions
Can gold reach $5,000 by mid-October
Yes, the bullish technical setup points to $5,000-$5,015 as a possible target if gold breaks above $4,566 and continues through $4,695.59, $4,770.72 and $4,891.
What could push the gold price higher
A weaker US dollar, softer US inflation data, lower Treasury yields and elevated geopolitical tensions could support gold by reducing pressure from Fed rate-hike expectations and increasing demand for the precious metal.
Will a Fed rate hike hurt the gold price
A Fed rate hike could pressure gold because higher interest rates and Treasury yields increase the opportunity cost of holding a non-yielding asset. A hotter CPI or PPI reading could therefore create additional resistance for the gold price.
Subscribe to our YouTube channel for daily crypto updates, market insights, and expert analysis.
The post Gold Price Forecast: Analyst Predicts $5,000 Gold by Mid-October appeared first on CaptainAltcoin.
The dollar has fallen to a four-month low, giving the gold price a key source of support ahead of US PPI and CPI data. Markets are assigning about a 60% probability to a Fed rate hike on September 16, making Thursday’s PPI and Friday’s CPI releases crucial for the next move.
Also, oil prices have reached their highest level in more than three months as US-Iran tensions intensify. With the gold price reacting from $4,364.60, analyst Rashad Hajiyev sees a path toward $4,900-$5,000 by early to mid-October.
Gold Price Chart Shows a Potential Breakout Pattern
We had a look at the chart, and the technical setup behind Hajiyev’s forecast is clear. Gold fell from the February-March highs above $5,500 toward a June-July base near $3,900-$4,000 before reversing higher in August. That recovery carried the gold price toward roughly $4,700 before sellers pushed it back toward the $4,300-$4,400 area.
My view on gold for the next 4-6 weeks with immediate target of $4.9 – 5k by early to mid October… pic.twitter.com/OPEpWaJ1Dc
— Rashad Hajiyev (@hajiyev_rashad) September 9, 2026
The latest structure resembles a symmetrical triangle, with a descending resistance line connecting the August high near $4,700 to lower highs around $4,500-$4,600.
Also, rising support connects the August and September lows, creating a narrowing range. The chart shows gold trading close to $4,390, almost directly around the middle of this structure. A breakout above the descending trendline would open the door toward $4,700 first, followed by the $4,900-$5,000 region marked by the analyst’s projected path.
Hajiyev’s forecast is therefore based on more than a round-number target. His chart maps several potential stages: $4,512, $4,566, $4,695.59, $4,770.72, $4,891 and finally $5,015.
From $4,390, a move to $5,000 would represent a gain of about 13.9%. The key requirement is for gold to escape the triangle and establish support above its previous resistance levels.
What Is Driving the Gold Price Right Now?
Ole Hansen’s analysis presents a more balanced picture. Gold is trapped between two competing forces: higher Treasury yields and stronger rate-hike expectations are pressuring the non-yielding metal, but a weaker dollar, resilient ETF and futures demand, and elevated geopolitical risk are helping limit downside pressure.
Gold rangebound as weaker dollar offsets rate-hike and inflation risks. Gold traders – and the algorithmic programmes that account for a significant share of day-to-day activity – are currently struggling to determine which of several competing themes will ultimately set the… pic.twitter.com/2NsjNRVYKs
— Ole S Hansen (@Ole_S_Hansen) September 9, 2026
The inflation data could decide which force wins. Core PPI is forecast at 0.3% month-on-month, up from 0.2%, with headline PPI expected at 0.4% versus 0.0% previously. US unemployment claims are forecast at 205,000, compared with 206,000 previously.
Core CPI is expected at 0.2% month-on-month and 2.4% year-on-year, compared with 2.5% previously for the annual figure. Headline CPI is projected at 0.4% month-on-month and 3.4% year-on-year.
Inflation Data Could Decide the Next Gold Price Move
The message from Hansen’s analysis is that gold needs a catalyst to escape its current range. A hotter-than-expected PPI or CPI reading could reinforce expectations for a Fed hike, keep Treasury yields elevated and make it harder for the gold price to break higher. That would leave the triangle intact and increase the importance of the lower trendline.
A softer inflation report would create the opposite setup. If inflation comes in below forecasts, markets could reduce rate-hike expectations, easing pressure from Treasury yields. Combined with the weaker dollar, that could give gold enough fuel to challenge the $4,512 and $4,566 resistance levels.
The geopolitical backdrop also matters. Intensifying US-Iran tensions and higher oil prices create additional inflation uncertainty, but they can also strengthen demand for gold as a portfolio diversifier. This leaves the September 16 Fed decision as the major event after this week’s data.
Related Gold Price: Gold Price Warning: A Supply Problem the Market Isn’t Ready For
Our Gold Price Prediction: $5,015 Is the Final Bullish Target
The gold price is reacting from $4,364.60, making $4,512 the first upside objective. A daily move through that level would put $4,566 next. If buyers push beyond $4,566, the chart points to $4,695.59, followed by $4,770.72.
A sustained break above those levels would strengthen the case for $4,891, with $5,015 becoming the final target in the bullish path. From $4,390 to $5,015, gold would need to rise approximately 14.2%.
The immediate risk is a breakdown below the rising support line around the $4,300-$4,350 region. For now, the technical structure keeps the $5,000 forecast alive, but inflation data and Treasury yields will determine whether the gold price can turn the projected path into an actual breakout.
Frequently Asked Questions
Can gold reach $5,000 by mid-October
Yes, the bullish technical setup points to $5,000-$5,015 as a possible target if gold breaks above $4,566 and continues through $4,695.59, $4,770.72 and $4,891.
What could push the gold price higher
A weaker US dollar, softer US inflation data, lower Treasury yields and elevated geopolitical tensions could support gold by reducing pressure from Fed rate-hike expectations and increasing demand for the precious metal.
Will a Fed rate hike hurt the gold price
A Fed rate hike could pressure gold because higher interest rates and Treasury yields increase the opportunity cost of holding a non-yielding asset. A hotter CPI or PPI reading could therefore create additional resistance for the gold price.
Subscribe to our YouTube channel for daily crypto updates, market insights, and expert analysis.
The post Gold Price Forecast: Analyst Predicts $5,000 Gold by Mid-October appeared first on CaptainAltcoin.
135
ලිපිය
පරිවර්තනය බලන්න
This Trader Just Made an (Un)Realistic XRP Price PredictionXRP price is trading around $1.43, up roughly 3% over the past 24 hours as the token continues its recovery from the September lows. But even though much of the market is focused on will XRP can reclaim $1.50 or eventually return to its previous highs, one prominent member of the XRP community is looking much further ahead.
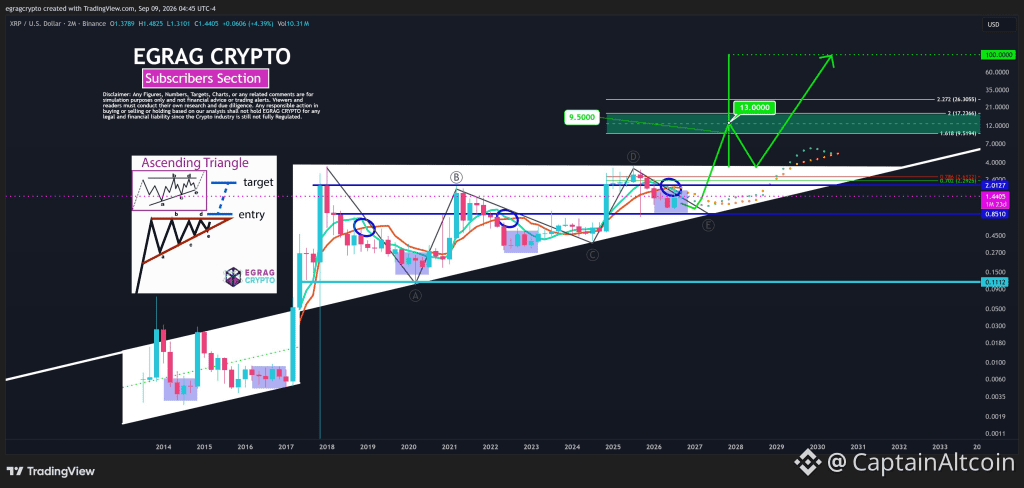
EGRAG CRYPTO has published another long-term XRP chart, and this one carries an extraordinary final target: $100 per XRP.
Calling the current structure a “Macro Launch Base,” EGRAG argues that patience is the most difficult part of trading a multi-year setup. His thesis is that XRP’s long consolidation is part of a much larger structure that could eventually produce several major rallies, first toward intermediate targets and, in his most optimistic scenario, all the way to $100.
The chart is certainly ambitious. But once XRP’s circulating supply and the market capitalization required at $100 are taken into account, the final target becomes considerably harder to justify.
EGRAG CRYPTO Says XRP Is Building a Macro Launch Base
EGRAG’s chart uses two-month XRP/USD candles, giving it an unusually long-term perspective stretching back to 2013.
The centerpiece is a huge ascending structure defined by a rising white support line underneath price and a series of major resistance areas above it.
EGRAG compares the current setup with an ascending triangle, where price repeatedly tests horizontal resistance while its lows rise over time. The thesis is that continued compression eventually produces an upside breakout.
The chart also marks several historical areas where XRP consolidated around its moving averages before making a larger move. EGRAG appears to view the current 2026 consolidation as another version of that process.
XRP is around $1.44 on his chart, sitting below a major resistance band near $2.00–$2.30. Above that, the chart marks Fibonacci levels around $2.30 and $2.61, making this entire region an important hurdle before the much larger targets become relevant.
His projected path initially allows XRP to move lower toward the rising macro support area before accelerating higher.
Source: X/@egragcrypto
That’s an important detail: EGRAG isn’t calling for XRP to travel directly from $1.43 to $100.
XRP Price Targets at $9.50, $13 and $26
The next portion of EGRAG’s roadmap is where the forecast becomes much more aggressive.
His first major green target is approximately $9.50, corresponding closely with the 1.618 Fibonacci extension shown at $9.5194.
Above there, he marks $13 as another important target. The chart then contains higher Fibonacci extensions around $17.24 and $26.31.
In percentage terms, even the first of these targets would be enormous.
A move from $1.43 to $9.50 would represent an increase of roughly 564%. Reaching $13 would require an advance of about 809%.
EGRAG then draws a substantial correction after the initial macro rally, followed by another advance that eventually reaches his ultimate $100 XRP target.
So the chart effectively proposes several stages: XRP first needs to survive its current consolidation, break through the $2–$3 region, enter price discovery toward $9.50–$13, potentially reach the higher extension levels, undergo another major correction and then begin a subsequent rally toward $100.
That is a very different proposition from saying XRP is about to reach $100 during its current recovery.
The Big Problem With a $100 XRP Price Prediction
This is where market capitalization becomes impossible to ignore.
There is also an important correction to make regarding XRP’s current valuation. At $1.43, XRP’s market cap is roughly $89.6 billion, not $900 billion. CoinGecko currently estimates around 62.75 billion XRP in circulation.
Market capitalization is calculated by multiplying price by circulating supply.
Using today’s circulating supply as a simplified baseline:
62.75 billion XRP × $100 = approximately $6.27 trillion.
That means EGRAG’s final target would require XRP to reach a market capitalization of more than $6 trillion if circulating supply remained around its current level.
And because XRP has a maximum supply of 100 billion tokens, the fully diluted valuation at $100 would be close to $10 trillion.
For comparison, Bitcoin currently has a market capitalization of only around $1.59 trillion at a price near $79,000.
At today’s circulating supplies, therefore, a $100 XRP would be worth nearly four times Bitcoin’s current market capitalization.
That doesn’t make $100 mathematically impossible. Crypto market capitalization can grow substantially over long periods, and Bitcoin itself was once worth a tiny fraction of its current valuation.
But it does show the scale of adoption and capital repricing required.
Read also: 3 AI Giants Predict XRP Price at the Peak of the Next Bull Run
What Would More Realistic XRP Targets Look Like?
EGRAG’s intermediate targets are easier to discuss than $100.
Using approximately 62.75 billion circulating XRP as a rough baseline, $5 XRP would correspond to a $314 billion market cap, $10 to roughly $627 billion, $13 to about $816 billion, and $20 to approximately $1.25 trillion.
Those are already enormous valuations, but they provide useful context.
A $10 XRP, for example, would require the asset to become worth roughly 40% of Bitcoin’s current market cap. A $20 XRP would put it much closer to Bitcoin’s present $1.59 trillion valuation.
Then comes $100 at more than $6.2 trillion.
And these calculations actually understate the potential future valuation requirement if more XRP enters circulation. CoinGecko currently lists roughly 62.75 billion XRP circulating against a total supply close to 100 billion.
There is another nuance: market cap is not the same thing as the amount of money that must literally flow into XRP. A cryptocurrency does not need $6 trillion of fresh purchases to gain $6 trillion in market capitalization. Market cap simply multiplies the latest market price by circulating supply.
Even so, maintaining XRP at $100 across tens of billions of circulating tokens would represent an extraordinary valuation.
Subscribe to our YouTube channel for daily crypto updates, market insights, and expert analysis.
The post This Trader Just Made an (Un)Realistic XRP Price Prediction appeared first on CaptainAltcoin.
This Trader Just Made an (Un)Realistic XRP Price Prediction
XRP price is trading around $1.43, up roughly 3% over the past 24 hours as the token continues its recovery from the September lows. But even though much of the market is focused on will XRP can reclaim $1.50 or eventually return to its previous highs, one prominent member of the XRP community is looking much further ahead.
EGRAG CRYPTO has published another long-term XRP chart, and this one carries an extraordinary final target: $100 per XRP.
Calling the current structure a “Macro Launch Base,” EGRAG argues that patience is the most difficult part of trading a multi-year setup. His thesis is that XRP’s long consolidation is part of a much larger structure that could eventually produce several major rallies, first toward intermediate targets and, in his most optimistic scenario, all the way to $100.
The chart is certainly ambitious. But once XRP’s circulating supply and the market capitalization required at $100 are taken into account, the final target becomes considerably harder to justify.
EGRAG CRYPTO Says XRP Is Building a Macro Launch Base
EGRAG’s chart uses two-month XRP/USD candles, giving it an unusually long-term perspective stretching back to 2013.
The centerpiece is a huge ascending structure defined by a rising white support line underneath price and a series of major resistance areas above it.
EGRAG compares the current setup with an ascending triangle, where price repeatedly tests horizontal resistance while its lows rise over time. The thesis is that continued compression eventually produces an upside breakout.
The chart also marks several historical areas where XRP consolidated around its moving averages before making a larger move. EGRAG appears to view the current 2026 consolidation as another version of that process.
XRP is around $1.44 on his chart, sitting below a major resistance band near $2.00–$2.30. Above that, the chart marks Fibonacci levels around $2.30 and $2.61, making this entire region an important hurdle before the much larger targets become relevant.
His projected path initially allows XRP to move lower toward the rising macro support area before accelerating higher.
Source: X/@egragcrypto
That’s an important detail: EGRAG isn’t calling for XRP to travel directly from $1.43 to $100.
XRP Price Targets at $9.50, $13 and $26
The next portion of EGRAG’s roadmap is where the forecast becomes much more aggressive.
His first major green target is approximately $9.50, corresponding closely with the 1.618 Fibonacci extension shown at $9.5194.
Above there, he marks $13 as another important target. The chart then contains higher Fibonacci extensions around $17.24 and $26.31.
In percentage terms, even the first of these targets would be enormous.
A move from $1.43 to $9.50 would represent an increase of roughly 564%. Reaching $13 would require an advance of about 809%.
EGRAG then draws a substantial correction after the initial macro rally, followed by another advance that eventually reaches his ultimate $100 XRP target.
So the chart effectively proposes several stages: XRP first needs to survive its current consolidation, break through the $2–$3 region, enter price discovery toward $9.50–$13, potentially reach the higher extension levels, undergo another major correction and then begin a subsequent rally toward $100.
That is a very different proposition from saying XRP is about to reach $100 during its current recovery.
The Big Problem With a $100 XRP Price Prediction
This is where market capitalization becomes impossible to ignore.
There is also an important correction to make regarding XRP’s current valuation. At $1.43, XRP’s market cap is roughly $89.6 billion, not $900 billion. CoinGecko currently estimates around 62.75 billion XRP in circulation.
Market capitalization is calculated by multiplying price by circulating supply.
Using today’s circulating supply as a simplified baseline:
62.75 billion XRP × $100 = approximately $6.27 trillion.
That means EGRAG’s final target would require XRP to reach a market capitalization of more than $6 trillion if circulating supply remained around its current level.
And because XRP has a maximum supply of 100 billion tokens, the fully diluted valuation at $100 would be close to $10 trillion.
For comparison, Bitcoin currently has a market capitalization of only around $1.59 trillion at a price near $79,000.
At today’s circulating supplies, therefore, a $100 XRP would be worth nearly four times Bitcoin’s current market capitalization.
That doesn’t make $100 mathematically impossible. Crypto market capitalization can grow substantially over long periods, and Bitcoin itself was once worth a tiny fraction of its current valuation.
But it does show the scale of adoption and capital repricing required.
Read also: 3 AI Giants Predict XRP Price at the Peak of the Next Bull Run
What Would More Realistic XRP Targets Look Like?
EGRAG’s intermediate targets are easier to discuss than $100.
Using approximately 62.75 billion circulating XRP as a rough baseline, $5 XRP would correspond to a $314 billion market cap, $10 to roughly $627 billion, $13 to about $816 billion, and $20 to approximately $1.25 trillion.
Those are already enormous valuations, but they provide useful context.
A $10 XRP, for example, would require the asset to become worth roughly 40% of Bitcoin’s current market cap. A $20 XRP would put it much closer to Bitcoin’s present $1.59 trillion valuation.
Then comes $100 at more than $6.2 trillion.
And these calculations actually understate the potential future valuation requirement if more XRP enters circulation. CoinGecko currently lists roughly 62.75 billion XRP circulating against a total supply close to 100 billion.
There is another nuance: market cap is not the same thing as the amount of money that must literally flow into XRP. A cryptocurrency does not need $6 trillion of fresh purchases to gain $6 trillion in market capitalization. Market cap simply multiplies the latest market price by circulating supply.
Even so, maintaining XRP at $100 across tens of billions of circulating tokens would represent an extraordinary valuation.
Subscribe to our YouTube channel for daily crypto updates, market insights, and expert analysis.
The post This Trader Just Made an (Un)Realistic XRP Price Prediction appeared first on CaptainAltcoin.
EGRAG CRYPTO has published another long-term XRP chart, and this one carries an extraordinary final target: $100 per XRP.
Calling the current structure a “Macro Launch Base,” EGRAG argues that patience is the most difficult part of trading a multi-year setup. His thesis is that XRP’s long consolidation is part of a much larger structure that could eventually produce several major rallies, first toward intermediate targets and, in his most optimistic scenario, all the way to $100.
The chart is certainly ambitious. But once XRP’s circulating supply and the market capitalization required at $100 are taken into account, the final target becomes considerably harder to justify.
EGRAG CRYPTO Says XRP Is Building a Macro Launch Base
EGRAG’s chart uses two-month XRP/USD candles, giving it an unusually long-term perspective stretching back to 2013.
The centerpiece is a huge ascending structure defined by a rising white support line underneath price and a series of major resistance areas above it.
EGRAG compares the current setup with an ascending triangle, where price repeatedly tests horizontal resistance while its lows rise over time. The thesis is that continued compression eventually produces an upside breakout.
The chart also marks several historical areas where XRP consolidated around its moving averages before making a larger move. EGRAG appears to view the current 2026 consolidation as another version of that process.
XRP is around $1.44 on his chart, sitting below a major resistance band near $2.00–$2.30. Above that, the chart marks Fibonacci levels around $2.30 and $2.61, making this entire region an important hurdle before the much larger targets become relevant.
His projected path initially allows XRP to move lower toward the rising macro support area before accelerating higher.
Source: X/@egragcrypto
That’s an important detail: EGRAG isn’t calling for XRP to travel directly from $1.43 to $100.
XRP Price Targets at $9.50, $13 and $26
The next portion of EGRAG’s roadmap is where the forecast becomes much more aggressive.
His first major green target is approximately $9.50, corresponding closely with the 1.618 Fibonacci extension shown at $9.5194.
Above there, he marks $13 as another important target. The chart then contains higher Fibonacci extensions around $17.24 and $26.31.
In percentage terms, even the first of these targets would be enormous.
A move from $1.43 to $9.50 would represent an increase of roughly 564%. Reaching $13 would require an advance of about 809%.
EGRAG then draws a substantial correction after the initial macro rally, followed by another advance that eventually reaches his ultimate $100 XRP target.
So the chart effectively proposes several stages: XRP first needs to survive its current consolidation, break through the $2–$3 region, enter price discovery toward $9.50–$13, potentially reach the higher extension levels, undergo another major correction and then begin a subsequent rally toward $100.
That is a very different proposition from saying XRP is about to reach $100 during its current recovery.
The Big Problem With a $100 XRP Price Prediction
This is where market capitalization becomes impossible to ignore.
There is also an important correction to make regarding XRP’s current valuation. At $1.43, XRP’s market cap is roughly $89.6 billion, not $900 billion. CoinGecko currently estimates around 62.75 billion XRP in circulation.
Market capitalization is calculated by multiplying price by circulating supply.
Using today’s circulating supply as a simplified baseline:
62.75 billion XRP × $100 = approximately $6.27 trillion.
That means EGRAG’s final target would require XRP to reach a market capitalization of more than $6 trillion if circulating supply remained around its current level.
And because XRP has a maximum supply of 100 billion tokens, the fully diluted valuation at $100 would be close to $10 trillion.
For comparison, Bitcoin currently has a market capitalization of only around $1.59 trillion at a price near $79,000.
At today’s circulating supplies, therefore, a $100 XRP would be worth nearly four times Bitcoin’s current market capitalization.
That doesn’t make $100 mathematically impossible. Crypto market capitalization can grow substantially over long periods, and Bitcoin itself was once worth a tiny fraction of its current valuation.
But it does show the scale of adoption and capital repricing required.
Read also: 3 AI Giants Predict XRP Price at the Peak of the Next Bull Run
What Would More Realistic XRP Targets Look Like?
EGRAG’s intermediate targets are easier to discuss than $100.
Using approximately 62.75 billion circulating XRP as a rough baseline, $5 XRP would correspond to a $314 billion market cap, $10 to roughly $627 billion, $13 to about $816 billion, and $20 to approximately $1.25 trillion.
Those are already enormous valuations, but they provide useful context.
A $10 XRP, for example, would require the asset to become worth roughly 40% of Bitcoin’s current market cap. A $20 XRP would put it much closer to Bitcoin’s present $1.59 trillion valuation.
Then comes $100 at more than $6.2 trillion.
And these calculations actually understate the potential future valuation requirement if more XRP enters circulation. CoinGecko currently lists roughly 62.75 billion XRP circulating against a total supply close to 100 billion.
There is another nuance: market cap is not the same thing as the amount of money that must literally flow into XRP. A cryptocurrency does not need $6 trillion of fresh purchases to gain $6 trillion in market capitalization. Market cap simply multiplies the latest market price by circulating supply.
Even so, maintaining XRP at $100 across tens of billions of circulating tokens would represent an extraordinary valuation.
Subscribe to our YouTube channel for daily crypto updates, market insights, and expert analysis.
The post This Trader Just Made an (Un)Realistic XRP Price Prediction appeared first on CaptainAltcoin.
149
සත්යායනය කළ
පරිවර්තනය බලන්න
Hunter Biden’s LAPTOP Memecoin Crashes 98% Within Minutes of LaunchHunter Biden’s newly launched LAPTOP memecoin suffered an extraordinary collapse shortly after trading began Wednesday, with the token falling roughly 98% from its initial quoted price as thin liquidity produced extreme volatility.
LAPTOP launched September 9 on Base, the Ethereum Layer 2 network incubated by Coinbase. Biden has described the token as a way of reclaiming the laptop controversy that followed him for years, framing the project around “resilience, redemption, and recovery.”
But the market’s first reaction was anything but stable.
LAPTOP reportedly opened near $200 before plunging to around $4.36 within its first hour, a decline of approximately 97.8%. The opening quote briefly implied an enormous valuation, but the lack of deep liquidity makes that number highly misleading.
LAPTOP’s $200 Billion Opening Valuation Wasn’t What It Seemed
LAPTOP has a total supply of 1 billion tokens, according to the project’s published tokenomics. The project says 35% of that supply is unlocked at token generation, with the remainder becoming available over a 36-month period.
At a quoted price close to $200, multiplying that price by the full 1 billion-token supply produces a theoretical fully diluted valuation approaching $200 billion.
After LAPTOP collapsed toward $4–$5, that figure fell to roughly $4–$5 billion.
THIS IS INSANE Hunter Biden's memecoin, $LAPTOP crashed 98% within minutes of its launch. It was supposed to compensate the $TRUMP losers pic.twitter.com/j7UtLBtc55
— Ash Crypto (@AshCrypto) September 9, 2026
Neither number should be confused with the amount of capital actually invested in the token.
The reported liquidity was tiny compared with those theoretical valuations. On-chain observers pointed to only about $83,000 in USDC liquidity in the official Aerodrome pool and roughly $380,000 in USDC in a Uniswap pool around the early trading period.
That matters enormously.
With shallow liquidity, relatively small trades can move a token’s quoted price dramatically. A handful of trades at $200 can therefore create a headline-grabbing theoretical valuation without anything remotely close to $200 billion actually entering the market.
The same caution applies to the token’s multibillion-dollar FDV after the crash.
Wintermute Receives 2.5 Million LAPTOP Tokens
Adding another layer to the chaotic launch, on-chain observers reported that Wintermute received 2.5 million LAPTOP tokens from a project-linked multisig address.
The transfer appears to be related to market-making activity rather than an ordinary investor allocation. Reporting based on on-chain monitoring also identified allocations of 15.5 million LAPTOP to GSR Markets and 5 million to G20, potentially putting the combined market-making allocation at 23 million tokens, or 2.3% of total supply.
Claims that Wintermute is simply “dumping” the tokens need more caution.
Wintermute received 2.5M $LAPTOP from the Laptop Token team and is now dumping it on-chain. So far, Wintermute has sold 466,255 $LAPTOP ($2.08M) at an average price of $4.47.https://t.co/Dhh7ZfDOuu pic.twitter.com/At9EgpLVSf
— Lookonchain (@lookonchain) September 9, 2026
On-chain transfers to exchanges or sales by a market maker do not necessarily represent a directional bet against the asset. Market makers routinely buy and sell inventory across venues to provide liquidity and manage exposure.
One circulating on-chain analysis claims Wintermute sold 466,255 LAPTOP for approximately $2.08 million at an average price near $4.47. If accurate, that activity would account for less than one-fifth of the 2.5 million-token allocation it received.
Without fuller information about Wintermute’s arrangement with the LAPTOP project, its hedges and activity across other venues, those sales alone don’t establish that Wintermute is exiting its entire position.
LAPTOP Was Supposed to Give Something Back to TRUMP Losers
One of the most unusual aspects of LAPTOP is its connection to Donald Trump’s TRUMP memecoin.
Biden has openly criticized TRUMP and said part of LAPTOP’s supply would be distributed to people who lost money trading the president’s token.
According to the project’s structure, 20% of LAPTOP’s 1 billion-token supply is reserved for community airdrops, including eligible TRUMP holders and subscribers to Biden’s Substack. Another 30% goes to founders under lockup and vesting conditions, while 30% is connected to a prediction mechanism.
The idea was therefore not literally to reimburse every TRUMP holder for their losses dollar-for-dollar. Instead, selected qualifying wallets are supposed to receive LAPTOP tokens.
Biden himself warned buyers before launch not to assume he or the project’s other participants would make the token appreciate in value.
That warning became particularly relevant almost immediately after trading opened.
For more crypto news and price predictions, click here.
Subscribe to our YouTube channel for daily crypto updates, market insights, and expert analysis.
The post Hunter Biden’s LAPTOP Memecoin Crashes 98% Within Minutes of Launch appeared first on CaptainAltcoin.
Hunter Biden’s LAPTOP Memecoin Crashes 98% Within Minutes of Launch
Hunter Biden’s newly launched LAPTOP memecoin suffered an extraordinary collapse shortly after trading began Wednesday, with the token falling roughly 98% from its initial quoted price as thin liquidity produced extreme volatility.
LAPTOP launched September 9 on Base, the Ethereum Layer 2 network incubated by Coinbase. Biden has described the token as a way of reclaiming the laptop controversy that followed him for years, framing the project around “resilience, redemption, and recovery.”
But the market’s first reaction was anything but stable.
LAPTOP reportedly opened near $200 before plunging to around $4.36 within its first hour, a decline of approximately 97.8%. The opening quote briefly implied an enormous valuation, but the lack of deep liquidity makes that number highly misleading.
LAPTOP’s $200 Billion Opening Valuation Wasn’t What It Seemed
LAPTOP has a total supply of 1 billion tokens, according to the project’s published tokenomics. The project says 35% of that supply is unlocked at token generation, with the remainder becoming available over a 36-month period.
At a quoted price close to $200, multiplying that price by the full 1 billion-token supply produces a theoretical fully diluted valuation approaching $200 billion.
After LAPTOP collapsed toward $4–$5, that figure fell to roughly $4–$5 billion.
THIS IS INSANE Hunter Biden's memecoin, $LAPTOP crashed 98% within minutes of its launch. It was supposed to compensate the $TRUMP losers pic.twitter.com/j7UtLBtc55
— Ash Crypto (@AshCrypto) September 9, 2026
Neither number should be confused with the amount of capital actually invested in the token.
The reported liquidity was tiny compared with those theoretical valuations. On-chain observers pointed to only about $83,000 in USDC liquidity in the official Aerodrome pool and roughly $380,000 in USDC in a Uniswap pool around the early trading period.
That matters enormously.
With shallow liquidity, relatively small trades can move a token’s quoted price dramatically. A handful of trades at $200 can therefore create a headline-grabbing theoretical valuation without anything remotely close to $200 billion actually entering the market.
The same caution applies to the token’s multibillion-dollar FDV after the crash.
Wintermute Receives 2.5 Million LAPTOP Tokens
Adding another layer to the chaotic launch, on-chain observers reported that Wintermute received 2.5 million LAPTOP tokens from a project-linked multisig address.
The transfer appears to be related to market-making activity rather than an ordinary investor allocation. Reporting based on on-chain monitoring also identified allocations of 15.5 million LAPTOP to GSR Markets and 5 million to G20, potentially putting the combined market-making allocation at 23 million tokens, or 2.3% of total supply.
Claims that Wintermute is simply “dumping” the tokens need more caution.
Wintermute received 2.5M $LAPTOP from the Laptop Token team and is now dumping it on-chain. So far, Wintermute has sold 466,255 $LAPTOP ($2.08M) at an average price of $4.47.https://t.co/Dhh7ZfDOuu pic.twitter.com/At9EgpLVSf
— Lookonchain (@lookonchain) September 9, 2026
On-chain transfers to exchanges or sales by a market maker do not necessarily represent a directional bet against the asset. Market makers routinely buy and sell inventory across venues to provide liquidity and manage exposure.
One circulating on-chain analysis claims Wintermute sold 466,255 LAPTOP for approximately $2.08 million at an average price near $4.47. If accurate, that activity would account for less than one-fifth of the 2.5 million-token allocation it received.
Without fuller information about Wintermute’s arrangement with the LAPTOP project, its hedges and activity across other venues, those sales alone don’t establish that Wintermute is exiting its entire position.
LAPTOP Was Supposed to Give Something Back to TRUMP Losers
One of the most unusual aspects of LAPTOP is its connection to Donald Trump’s TRUMP memecoin.
Biden has openly criticized TRUMP and said part of LAPTOP’s supply would be distributed to people who lost money trading the president’s token.
According to the project’s structure, 20% of LAPTOP’s 1 billion-token supply is reserved for community airdrops, including eligible TRUMP holders and subscribers to Biden’s Substack. Another 30% goes to founders under lockup and vesting conditions, while 30% is connected to a prediction mechanism.
The idea was therefore not literally to reimburse every TRUMP holder for their losses dollar-for-dollar. Instead, selected qualifying wallets are supposed to receive LAPTOP tokens.
Biden himself warned buyers before launch not to assume he or the project’s other participants would make the token appreciate in value.
That warning became particularly relevant almost immediately after trading opened.
For more crypto news and price predictions, click here.
Subscribe to our YouTube channel for daily crypto updates, market insights, and expert analysis.
The post Hunter Biden’s LAPTOP Memecoin Crashes 98% Within Minutes of Launch appeared first on CaptainAltcoin.
LAPTOP launched September 9 on Base, the Ethereum Layer 2 network incubated by Coinbase. Biden has described the token as a way of reclaiming the laptop controversy that followed him for years, framing the project around “resilience, redemption, and recovery.”
But the market’s first reaction was anything but stable.
LAPTOP reportedly opened near $200 before plunging to around $4.36 within its first hour, a decline of approximately 97.8%. The opening quote briefly implied an enormous valuation, but the lack of deep liquidity makes that number highly misleading.
LAPTOP’s $200 Billion Opening Valuation Wasn’t What It Seemed
LAPTOP has a total supply of 1 billion tokens, according to the project’s published tokenomics. The project says 35% of that supply is unlocked at token generation, with the remainder becoming available over a 36-month period.
At a quoted price close to $200, multiplying that price by the full 1 billion-token supply produces a theoretical fully diluted valuation approaching $200 billion.
After LAPTOP collapsed toward $4–$5, that figure fell to roughly $4–$5 billion.
THIS IS INSANE Hunter Biden's memecoin, $LAPTOP crashed 98% within minutes of its launch. It was supposed to compensate the $TRUMP losers pic.twitter.com/j7UtLBtc55
— Ash Crypto (@AshCrypto) September 9, 2026
Neither number should be confused with the amount of capital actually invested in the token.
The reported liquidity was tiny compared with those theoretical valuations. On-chain observers pointed to only about $83,000 in USDC liquidity in the official Aerodrome pool and roughly $380,000 in USDC in a Uniswap pool around the early trading period.
That matters enormously.
With shallow liquidity, relatively small trades can move a token’s quoted price dramatically. A handful of trades at $200 can therefore create a headline-grabbing theoretical valuation without anything remotely close to $200 billion actually entering the market.
The same caution applies to the token’s multibillion-dollar FDV after the crash.
Wintermute Receives 2.5 Million LAPTOP Tokens
Adding another layer to the chaotic launch, on-chain observers reported that Wintermute received 2.5 million LAPTOP tokens from a project-linked multisig address.
The transfer appears to be related to market-making activity rather than an ordinary investor allocation. Reporting based on on-chain monitoring also identified allocations of 15.5 million LAPTOP to GSR Markets and 5 million to G20, potentially putting the combined market-making allocation at 23 million tokens, or 2.3% of total supply.
Claims that Wintermute is simply “dumping” the tokens need more caution.
Wintermute received 2.5M $LAPTOP from the Laptop Token team and is now dumping it on-chain. So far, Wintermute has sold 466,255 $LAPTOP ($2.08M) at an average price of $4.47.https://t.co/Dhh7ZfDOuu pic.twitter.com/At9EgpLVSf
— Lookonchain (@lookonchain) September 9, 2026
On-chain transfers to exchanges or sales by a market maker do not necessarily represent a directional bet against the asset. Market makers routinely buy and sell inventory across venues to provide liquidity and manage exposure.
One circulating on-chain analysis claims Wintermute sold 466,255 LAPTOP for approximately $2.08 million at an average price near $4.47. If accurate, that activity would account for less than one-fifth of the 2.5 million-token allocation it received.
Without fuller information about Wintermute’s arrangement with the LAPTOP project, its hedges and activity across other venues, those sales alone don’t establish that Wintermute is exiting its entire position.
LAPTOP Was Supposed to Give Something Back to TRUMP Losers
One of the most unusual aspects of LAPTOP is its connection to Donald Trump’s TRUMP memecoin.
Biden has openly criticized TRUMP and said part of LAPTOP’s supply would be distributed to people who lost money trading the president’s token.
According to the project’s structure, 20% of LAPTOP’s 1 billion-token supply is reserved for community airdrops, including eligible TRUMP holders and subscribers to Biden’s Substack. Another 30% goes to founders under lockup and vesting conditions, while 30% is connected to a prediction mechanism.
The idea was therefore not literally to reimburse every TRUMP holder for their losses dollar-for-dollar. Instead, selected qualifying wallets are supposed to receive LAPTOP tokens.
Biden himself warned buyers before launch not to assume he or the project’s other participants would make the token appreciate in value.
That warning became particularly relevant almost immediately after trading opened.
For more crypto news and price predictions, click here.
Subscribe to our YouTube channel for daily crypto updates, market insights, and expert analysis.
The post Hunter Biden’s LAPTOP Memecoin Crashes 98% Within Minutes of Launch appeared first on CaptainAltcoin.
534
සත්යායනය කළ

ලිපිය
පරිවර්තනය බලන්න
EDGE Markets Partners With Splash Sports to Bring 24/7 Banking to the $21 Million NFL Survivor Co...Powered by EDGE Connect, Splash Sports players now have access to 24/7/365 fund movement, daily deposit limits of up to $1 million as they compete for Splash Sports’ $21 million guaranteed NFL Survivor contest
NEW YORK, Sept. 9, 2026 /PRNewswire/ — EDGE Markets, a financial services company purpose-built for prediction markets, gaming, and crypto, today announced a partnership with Splash Sports, the leading skill-based social sports gaming platform, to facilitate Splash’s marquee $21 million NFL survivor contest.
The agreement brings EDGE Connect, a private closed-loop settlement network, to the Splash Sports platform. This enables eligible EDGE Boost customers to fund their Splash Sports accounts with up to $1 million a day. Beyond its marquee $21 million NFL Survivor contest, Splash Sports runs contests at a range of price points, including a $3 million guaranteed contest and entries as low as $5, giving players multiple ways to compete.
Traditional account funding methods can involve lower transaction limits, processing delays and fees, which are particularly inconvenient for players moving money on nights, weekends and around Sunday kickoffs. EDGE Boost gives eligible Splash Sports users daily deposit limits of up to $1 million, real-time fund movement and a dedicated account that separates gaming capital from everyday finances. That speed matters most in Splash Sports’ 2026 NFL Survivor contest, which carries a $21 million guaranteed prize contest, a $1,000 fee per entry and up to 150 entries per player, with a new marketplace for buying and selling entry stakes and Team Entries for groups, both of which can require players to move money quickly all season.
“Capital should move on the player’s schedule, not the banks,” said Seni Thomas, Founder and CEO of EDGE Markets. “Splash Sports players are entering more lineups, trading stakes and racing Sunday deadlines, and EDGE gets them there with up to a million dollars a day, immediately.”
Splash Sports is seeing that same demand for speed from its own players. Entries are piling up ahead of the September 13 deadline. The new Marketplace and Team Entries features mean players are moving money in and out of the contest throughout the season, not just once at sign-up.
“Our players are managing more entries and more moving pieces than ever, especially with the Marketplace and Team Entries we launched this season,” said TJ Ross, Co-Founder and Co-CEO of Splash Sports. “Our players shouldn’t have to wait on their bank to keep playing. EDGE Markets makes sure the money moves just as fast as everything else we’ve built.”
This partnership builds on momentum following EDGE Markets’ recently announced partnerships with Kalshi, Polymarket and ProphetX, making Splash Sports the latest platform to adopt EDGE Connect. EDGE Markets recently closed a $29 million Series A round led by CoinFund, with participation from Indicator Ventures, Mantis VC, Stepstone Group and Bullpen Capital, to accelerate its buildout across prediction markets and gaming. Since launching EDGE Boost, the company has processed more than $2 billion in transactions.
About EDGE MarketsEDGE Markets is a U.S. financial services company that empowers users with financial transparency, supporting emerging verticals such as betting, gaming and casinos. Its original product, EDGE Boost, is the first responsible financial platform for smart bettors. It is the first betting-only debit card account that is FDIC and/or NCUA deposit insurance up to $10,000,000 or more through Cross River Bank, Member FDIC, and Participating Institutions.1
About Splash SportsSplash Sports is the leading skill-based social sports gaming platform, enabling friends and communities to compete for real money. Founded in 2021, the company has since acquired and integrated RunYourPool and OfficeFootballPool. Splash Sports operates across 35-plus states and Canada with more than 2 million active users. The company is backed by Dream Ventures, Accomplice, Boston Seed Capital, Elysian Park Ventures and Velvet Sea Ventures.
Media ContactsJustine Sacco / justine@edgemarkets.ioEdgemarkets@greenbrier.partners Andrew Bard / splashsports@dkcnews.com
1 Deposit accounts are held at Cross River Bank, Member FDIC, and are insured up to $250,000 per depositor. Through our relationship with IntraFi® Network Deposits℠, funds may be eligible for additional FDIC insurance coverage by being distributed across participating network banks, up to $10,000,000 in aggregate for consumer accounts enrolled in the applicable program. FDIC insurance coverage is subject to applicable terms and conditions, including account structure, account ownership categories and regulatory requirements. The EDGE Boost Visa® Debit Card is issued by Cross River Bank, Member FDIC, pursuant to a license from Visa U.S.A. Inc., and is not available to all residents of U.S. territories. Account limits and other applicable terms are described in our Terms of Service and Cardholder Agreement and CRB Account Agreement.
The post EDGE Markets Partners with Splash Sports to Bring 24/7 Banking to the $21 Million NFL Survivor Contest appeared first on CaptainAltcoin.
EDGE Markets Partners With Splash Sports to Bring 24/7 Banking to the $21 Million NFL Survivor Co...
Powered by EDGE Connect, Splash Sports players now have access to 24/7/365 fund movement, daily deposit limits of up to $1 million as they compete for Splash Sports’ $21 million guaranteed NFL Survivor contest
NEW YORK, Sept. 9, 2026 /PRNewswire/ — EDGE Markets, a financial services company purpose-built for prediction markets, gaming, and crypto, today announced a partnership with Splash Sports, the leading skill-based social sports gaming platform, to facilitate Splash’s marquee $21 million NFL survivor contest.
The agreement brings EDGE Connect, a private closed-loop settlement network, to the Splash Sports platform. This enables eligible EDGE Boost customers to fund their Splash Sports accounts with up to $1 million a day. Beyond its marquee $21 million NFL Survivor contest, Splash Sports runs contests at a range of price points, including a $3 million guaranteed contest and entries as low as $5, giving players multiple ways to compete.
Traditional account funding methods can involve lower transaction limits, processing delays and fees, which are particularly inconvenient for players moving money on nights, weekends and around Sunday kickoffs. EDGE Boost gives eligible Splash Sports users daily deposit limits of up to $1 million, real-time fund movement and a dedicated account that separates gaming capital from everyday finances. That speed matters most in Splash Sports’ 2026 NFL Survivor contest, which carries a $21 million guaranteed prize contest, a $1,000 fee per entry and up to 150 entries per player, with a new marketplace for buying and selling entry stakes and Team Entries for groups, both of which can require players to move money quickly all season.
“Capital should move on the player’s schedule, not the banks,” said Seni Thomas, Founder and CEO of EDGE Markets. “Splash Sports players are entering more lineups, trading stakes and racing Sunday deadlines, and EDGE gets them there with up to a million dollars a day, immediately.”
Splash Sports is seeing that same demand for speed from its own players. Entries are piling up ahead of the September 13 deadline. The new Marketplace and Team Entries features mean players are moving money in and out of the contest throughout the season, not just once at sign-up.
“Our players are managing more entries and more moving pieces than ever, especially with the Marketplace and Team Entries we launched this season,” said TJ Ross, Co-Founder and Co-CEO of Splash Sports. “Our players shouldn’t have to wait on their bank to keep playing. EDGE Markets makes sure the money moves just as fast as everything else we’ve built.”
This partnership builds on momentum following EDGE Markets’ recently announced partnerships with Kalshi, Polymarket and ProphetX, making Splash Sports the latest platform to adopt EDGE Connect. EDGE Markets recently closed a $29 million Series A round led by CoinFund, with participation from Indicator Ventures, Mantis VC, Stepstone Group and Bullpen Capital, to accelerate its buildout across prediction markets and gaming. Since launching EDGE Boost, the company has processed more than $2 billion in transactions.
About EDGE MarketsEDGE Markets is a U.S. financial services company that empowers users with financial transparency, supporting emerging verticals such as betting, gaming and casinos. Its original product, EDGE Boost, is the first responsible financial platform for smart bettors. It is the first betting-only debit card account that is FDIC and/or NCUA deposit insurance up to $10,000,000 or more through Cross River Bank, Member FDIC, and Participating Institutions.1
About Splash SportsSplash Sports is the leading skill-based social sports gaming platform, enabling friends and communities to compete for real money. Founded in 2021, the company has since acquired and integrated RunYourPool and OfficeFootballPool. Splash Sports operates across 35-plus states and Canada with more than 2 million active users. The company is backed by Dream Ventures, Accomplice, Boston Seed Capital, Elysian Park Ventures and Velvet Sea Ventures.
Media ContactsJustine Sacco / justine@edgemarkets.ioEdgemarkets@greenbrier.partners Andrew Bard / splashsports@dkcnews.com
1 Deposit accounts are held at Cross River Bank, Member FDIC, and are insured up to $250,000 per depositor. Through our relationship with IntraFi® Network Deposits℠, funds may be eligible for additional FDIC insurance coverage by being distributed across participating network banks, up to $10,000,000 in aggregate for consumer accounts enrolled in the applicable program. FDIC insurance coverage is subject to applicable terms and conditions, including account structure, account ownership categories and regulatory requirements. The EDGE Boost Visa® Debit Card is issued by Cross River Bank, Member FDIC, pursuant to a license from Visa U.S.A. Inc., and is not available to all residents of U.S. territories. Account limits and other applicable terms are described in our Terms of Service and Cardholder Agreement and CRB Account Agreement.
The post EDGE Markets Partners with Splash Sports to Bring 24/7 Banking to the $21 Million NFL Survivor Contest appeared first on CaptainAltcoin.
NEW YORK, Sept. 9, 2026 /PRNewswire/ — EDGE Markets, a financial services company purpose-built for prediction markets, gaming, and crypto, today announced a partnership with Splash Sports, the leading skill-based social sports gaming platform, to facilitate Splash’s marquee $21 million NFL survivor contest.
The agreement brings EDGE Connect, a private closed-loop settlement network, to the Splash Sports platform. This enables eligible EDGE Boost customers to fund their Splash Sports accounts with up to $1 million a day. Beyond its marquee $21 million NFL Survivor contest, Splash Sports runs contests at a range of price points, including a $3 million guaranteed contest and entries as low as $5, giving players multiple ways to compete.
Traditional account funding methods can involve lower transaction limits, processing delays and fees, which are particularly inconvenient for players moving money on nights, weekends and around Sunday kickoffs. EDGE Boost gives eligible Splash Sports users daily deposit limits of up to $1 million, real-time fund movement and a dedicated account that separates gaming capital from everyday finances. That speed matters most in Splash Sports’ 2026 NFL Survivor contest, which carries a $21 million guaranteed prize contest, a $1,000 fee per entry and up to 150 entries per player, with a new marketplace for buying and selling entry stakes and Team Entries for groups, both of which can require players to move money quickly all season.
“Capital should move on the player’s schedule, not the banks,” said Seni Thomas, Founder and CEO of EDGE Markets. “Splash Sports players are entering more lineups, trading stakes and racing Sunday deadlines, and EDGE gets them there with up to a million dollars a day, immediately.”
Splash Sports is seeing that same demand for speed from its own players. Entries are piling up ahead of the September 13 deadline. The new Marketplace and Team Entries features mean players are moving money in and out of the contest throughout the season, not just once at sign-up.
“Our players are managing more entries and more moving pieces than ever, especially with the Marketplace and Team Entries we launched this season,” said TJ Ross, Co-Founder and Co-CEO of Splash Sports. “Our players shouldn’t have to wait on their bank to keep playing. EDGE Markets makes sure the money moves just as fast as everything else we’ve built.”
This partnership builds on momentum following EDGE Markets’ recently announced partnerships with Kalshi, Polymarket and ProphetX, making Splash Sports the latest platform to adopt EDGE Connect. EDGE Markets recently closed a $29 million Series A round led by CoinFund, with participation from Indicator Ventures, Mantis VC, Stepstone Group and Bullpen Capital, to accelerate its buildout across prediction markets and gaming. Since launching EDGE Boost, the company has processed more than $2 billion in transactions.
About EDGE MarketsEDGE Markets is a U.S. financial services company that empowers users with financial transparency, supporting emerging verticals such as betting, gaming and casinos. Its original product, EDGE Boost, is the first responsible financial platform for smart bettors. It is the first betting-only debit card account that is FDIC and/or NCUA deposit insurance up to $10,000,000 or more through Cross River Bank, Member FDIC, and Participating Institutions.1
About Splash SportsSplash Sports is the leading skill-based social sports gaming platform, enabling friends and communities to compete for real money. Founded in 2021, the company has since acquired and integrated RunYourPool and OfficeFootballPool. Splash Sports operates across 35-plus states and Canada with more than 2 million active users. The company is backed by Dream Ventures, Accomplice, Boston Seed Capital, Elysian Park Ventures and Velvet Sea Ventures.
Media ContactsJustine Sacco / justine@edgemarkets.ioEdgemarkets@greenbrier.partners Andrew Bard / splashsports@dkcnews.com
1 Deposit accounts are held at Cross River Bank, Member FDIC, and are insured up to $250,000 per depositor. Through our relationship with IntraFi® Network Deposits℠, funds may be eligible for additional FDIC insurance coverage by being distributed across participating network banks, up to $10,000,000 in aggregate for consumer accounts enrolled in the applicable program. FDIC insurance coverage is subject to applicable terms and conditions, including account structure, account ownership categories and regulatory requirements. The EDGE Boost Visa® Debit Card is issued by Cross River Bank, Member FDIC, pursuant to a license from Visa U.S.A. Inc., and is not available to all residents of U.S. territories. Account limits and other applicable terms are described in our Terms of Service and Cardholder Agreement and CRB Account Agreement.
The post EDGE Markets Partners with Splash Sports to Bring 24/7 Banking to the $21 Million NFL Survivor Contest appeared first on CaptainAltcoin.
1
2.2k
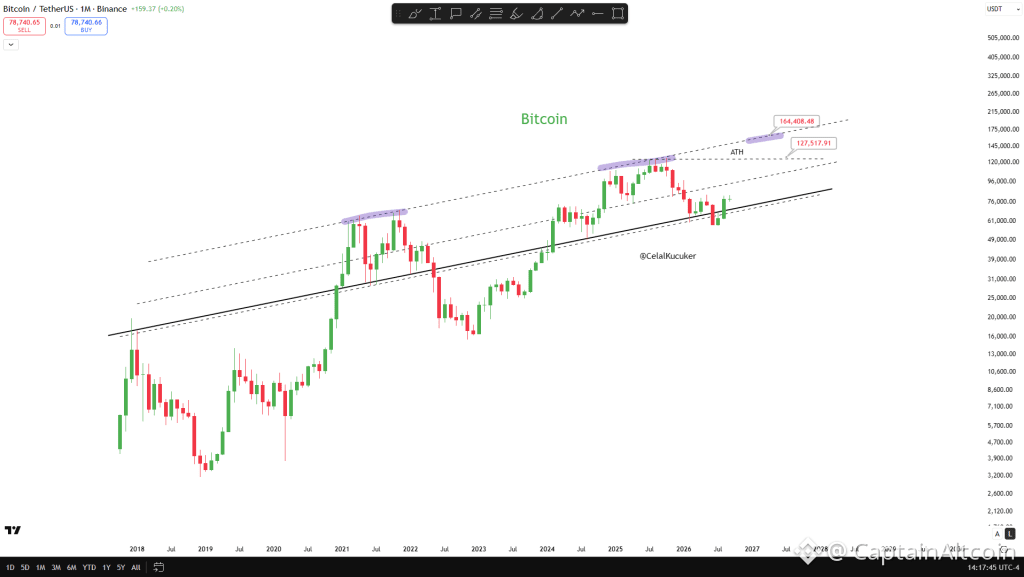
ලිපිය
Bitcoin මිල පුවත්: විශ්ලේෂකයෙකු $80K සිට $160K දක්වා මාර්ගයක් සකස් කරයිBitcoin මිල නැවතත් $80,000 කලාපයට එල්ලවෙමින් තිබෙන අතර, ආයෝජනවාදී (bullish) තත්වය වැඩිහිටියිමින් පවතී. BTC ගනුදෙනු වන්නේ ආසන්න වශයෙන් $79,400 වටා වන අතර, 2026 අඩුතම අගයන්ගෙන් ලැබූ ප්රබල ප්රතිසාධනයෙන් පසු මානසික $80,000 සීමාව කරා වෙළඳපොල ඉතා කෙටි දුරකින් පවතී.
අපි නිතිපතා අනුගමනය කරන විශ්ලේෂකයන්ගෙන් එක් අයෙකු වන Celal Küçüker විශ්වාස කරන්නේ ප්රකෘතිය අවසානයේදී තවදුරටත් වඩා විශාල දෙයක් දක්වා වර්ධනය විය හැකි බවයි. ඔහුගේ නවතම දැක්ම තුළ Küçüker පැවසුවේ, ඉදිරි මාස කිහිපය තුළ Bitcoin නව සියලුකාලීන ඉහළම අගයට ළඟා විය හැකි බවයි; ඔහුගේ පුළුල් BTC ඉලක්කය ලෙස $160,000 සඳහන් කළේය.
Bitcoin මිල පුවත්: විශ්ලේෂකයෙකු $80K සිට $160K දක්වා මාර්ගයක් සකස් කරයි
Bitcoin මිල නැවතත් $80,000 කලාපයට එල්ලවෙමින් තිබෙන අතර, ආයෝජනවාදී (bullish) තත්වය වැඩිහිටියිමින් පවතී. BTC ගනුදෙනු වන්නේ ආසන්න වශයෙන් $79,400 වටා වන අතර, 2026 අඩුතම අගයන්ගෙන් ලැබූ ප්රබල ප්රතිසාධනයෙන් පසු මානසික $80,000 සීමාව කරා වෙළඳපොල ඉතා කෙටි දුරකින් පවතී.
අපි නිතිපතා අනුගමනය කරන විශ්ලේෂකයන්ගෙන් එක් අයෙකු වන Celal Küçüker විශ්වාස කරන්නේ ප්රකෘතිය අවසානයේදී තවදුරටත් වඩා විශාල දෙයක් දක්වා වර්ධනය විය හැකි බවයි. ඔහුගේ නවතම දැක්ම තුළ Küçüker පැවසුවේ, ඉදිරි මාස කිහිපය තුළ Bitcoin නව සියලුකාලීන ඉහළම අගයට ළඟා විය හැකි බවයි; ඔහුගේ පුළුල් BTC ඉලක්කය ලෙස $160,000 සඳහන් කළේය.
අපි නිතිපතා අනුගමනය කරන විශ්ලේෂකයන්ගෙන් එක් අයෙකු වන Celal Küçüker විශ්වාස කරන්නේ ප්රකෘතිය අවසානයේදී තවදුරටත් වඩා විශාල දෙයක් දක්වා වර්ධනය විය හැකි බවයි. ඔහුගේ නවතම දැක්ම තුළ Küçüker පැවසුවේ, ඉදිරි මාස කිහිපය තුළ Bitcoin නව සියලුකාලීන ඉහළම අගයට ළඟා විය හැකි බවයි; ඔහුගේ පුළුල් BTC ඉලක්කය ලෙස $160,000 සඳහන් කළේය.
1
193
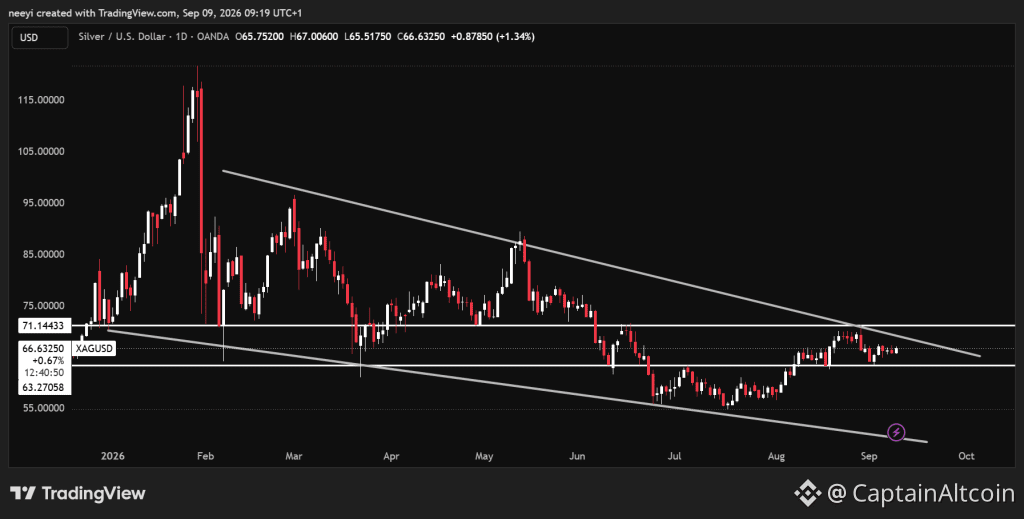
ලිපිය
පරිවර්තනය බලන්න
Silver Price Warning: This Correction May Not Be Over YetSilver price is nearing a technical area that has repeatedly stopped recovery attempts since January. DeepValue Signals believes the latest rebound has not confirmed a fresh upward move, and the wider chart presents an equally cautious picture. Several support levels could now determine whether silver steadies or enters another deeper correction.
The next reaction around $64.5 to $63 may provide the clearest clue. Silver could preserve its recovery structure above that area, though a confirmed breakdown would expose much lower levels.
DeepValue Signals Says Silver Has Not Confirmed a Strong Recovery
Crypto and commodities analyst DeepValue Signals recently examined silver after its price moved back toward $67. That level was positioned directly beneath a rising red trend structure visible on the analyst’s chart.
Silver needed to reclaim that structure to confirm that buyers had regained control. The required confirmation never appeared, which left the latest upward move looking more like a temporary recovery inside a correction.
A look at the chart shows silver struggling below the red resistance area. Price climbed from the lower region but failed to establish a convincing move above $67. That failure keeps several lower support levels relevant.
$SILVER So far, silver is not confirming the setup from this morning. When I flagged ~$67, that level sat right underneath the rising red structure. As long as we remain below that area, the short-term action still feels corrective rather than impulsive to me… I’d now want… https://t.co/F32TEe3sxl pic.twitter.com/8rlxuE9At0
— DeepValue Signals (@DVSignals) September 8, 2026
DeepValue Signals identified these main areas:
Silver must first defend the region between $65.5 and $64.5.
Stronger structural support appears between $63 and $62.5.
A clear loss of $62.5 could extend the current correction.
The distinction between corrective and impulsive price action matters here. An impulsive move normally breaks resistance decisively and continues higher. Corrective action often produces temporary rebounds that remain below an important technical barrier.
Silver currently appears closer to the second situation based on the analyst’s chart. Buyers still have time to change that picture, though they would need to recover $67 and remain above the rising red structure.
Silver Price Support Could Decide Whether the Decline Continues
Silver’s immediate direction depends heavily on how price behaves around the first support region. A recovery from $65.5 to $64.5 would show that buyers remain active below the recent rebound.
Stronger pressure could send silver toward the next structural area between $63 and $62.5. That zone carries more importance because it has helped preserve the broader setup.
Silver Price Area Technical Meaning Possible Reaction Above $67 Buyers reclaim nearby resistance Recovery could become more convincing $65.5 to $64.5 First short term support region Buyers may attempt another rebound $63 to $62.5 Main structural support region Holding could protect the broader setup Below $62.5 Structural support breaks cleanly The correction could continue lower
A brief move beneath support would not necessarily confirm the bearish case. Silver would need to remain below the zone and fail to recover it before the breakdown carried greater weight.
Silver Price Remains Trapped Inside a Descending Channel
A look at silver price also shows an interesting pattern. Silver has traded inside a descending channel since reaching its last all time high near $121 during January.
XAGUSD / TradingView.com
The price has continued to form lower highs and lower lows since that peak. The upper boundary of the channel acts as resistance, and the lower boundary provides support.
Previous encounters with the upper boundary have produced declines toward the channel’s base. That sequence has repeated several times, which makes the current position especially important.
Silver price is once again close to the upper section of the channel near $68 to $71. Another rejection from that region could return price toward $63, where the channel support and DeepValue Signals’ structural zone become relevant.
A breakdown beneath $63 would weaken the pattern further. Silver could then move below $54 during the coming days if sellers maintain control and price follows the existing channel toward its lower boundary.
Read Also: 3 Reasons Kaspa Is Back on Crypto Traders’ Radar
Silver Price Faces 2 Clear Scenarios From Here
The bullish scenario requires silver to defend $64.5 and recover above $67. A stronger confirmation would arrive if price breaks the descending channel resistance between $68 and $71. Such a move would challenge the sequence of lower highs that has controlled the chart since January.
The bearish scenario begins with another rejection near the channel’s upper boundary. Silver could then revisit $64.5 before testing the stronger support between $63 and $62.5. A clean breakdown there could open the path below $54.
Silver therefore remains caught between a nearby recovery opportunity and a broader bearish structure. The next test around $67 may reveal whether buyers can finally break the pattern or whether the correction still has another stage ahead.
FAQs
Is silver rarer than gold?
Gold is scarcer and rarer than silver by total geological abundance in the Earth’s crust.
Is it better to invest in silver or gold?
Neither gold nor silver is universally “better”; gold is better for long-term stability and wealth preservation, while silver offers higher growth potential through industrial demand but comes with much greater price swings.
Subscribe to our YouTube channel for daily crypto updates, market insights, and expert analysis.
The post Silver Price Warning: This Correction May Not Be Over Yet appeared first on CaptainAltcoin.
Silver Price Warning: This Correction May Not Be Over Yet
Silver price is nearing a technical area that has repeatedly stopped recovery attempts since January. DeepValue Signals believes the latest rebound has not confirmed a fresh upward move, and the wider chart presents an equally cautious picture. Several support levels could now determine whether silver steadies or enters another deeper correction.
The next reaction around $64.5 to $63 may provide the clearest clue. Silver could preserve its recovery structure above that area, though a confirmed breakdown would expose much lower levels.
DeepValue Signals Says Silver Has Not Confirmed a Strong Recovery
Crypto and commodities analyst DeepValue Signals recently examined silver after its price moved back toward $67. That level was positioned directly beneath a rising red trend structure visible on the analyst’s chart.
Silver needed to reclaim that structure to confirm that buyers had regained control. The required confirmation never appeared, which left the latest upward move looking more like a temporary recovery inside a correction.
A look at the chart shows silver struggling below the red resistance area. Price climbed from the lower region but failed to establish a convincing move above $67. That failure keeps several lower support levels relevant.
$SILVER So far, silver is not confirming the setup from this morning. When I flagged ~$67, that level sat right underneath the rising red structure. As long as we remain below that area, the short-term action still feels corrective rather than impulsive to me… I’d now want… https://t.co/F32TEe3sxl pic.twitter.com/8rlxuE9At0
— DeepValue Signals (@DVSignals) September 8, 2026
DeepValue Signals identified these main areas:
Silver must first defend the region between $65.5 and $64.5.
Stronger structural support appears between $63 and $62.5.
A clear loss of $62.5 could extend the current correction.
The distinction between corrective and impulsive price action matters here. An impulsive move normally breaks resistance decisively and continues higher. Corrective action often produces temporary rebounds that remain below an important technical barrier.
Silver currently appears closer to the second situation based on the analyst’s chart. Buyers still have time to change that picture, though they would need to recover $67 and remain above the rising red structure.
Silver Price Support Could Decide Whether the Decline Continues
Silver’s immediate direction depends heavily on how price behaves around the first support region. A recovery from $65.5 to $64.5 would show that buyers remain active below the recent rebound.
Stronger pressure could send silver toward the next structural area between $63 and $62.5. That zone carries more importance because it has helped preserve the broader setup.
Silver Price Area Technical Meaning Possible Reaction Above $67 Buyers reclaim nearby resistance Recovery could become more convincing $65.5 to $64.5 First short term support region Buyers may attempt another rebound $63 to $62.5 Main structural support region Holding could protect the broader setup Below $62.5 Structural support breaks cleanly The correction could continue lower
A brief move beneath support would not necessarily confirm the bearish case. Silver would need to remain below the zone and fail to recover it before the breakdown carried greater weight.
Silver Price Remains Trapped Inside a Descending Channel
A look at silver price also shows an interesting pattern. Silver has traded inside a descending channel since reaching its last all time high near $121 during January.
XAGUSD / TradingView.com
The price has continued to form lower highs and lower lows since that peak. The upper boundary of the channel acts as resistance, and the lower boundary provides support.
Previous encounters with the upper boundary have produced declines toward the channel’s base. That sequence has repeated several times, which makes the current position especially important.
Silver price is once again close to the upper section of the channel near $68 to $71. Another rejection from that region could return price toward $63, where the channel support and DeepValue Signals’ structural zone become relevant.
A breakdown beneath $63 would weaken the pattern further. Silver could then move below $54 during the coming days if sellers maintain control and price follows the existing channel toward its lower boundary.
Read Also: 3 Reasons Kaspa Is Back on Crypto Traders’ Radar
Silver Price Faces 2 Clear Scenarios From Here
The bullish scenario requires silver to defend $64.5 and recover above $67. A stronger confirmation would arrive if price breaks the descending channel resistance between $68 and $71. Such a move would challenge the sequence of lower highs that has controlled the chart since January.
The bearish scenario begins with another rejection near the channel’s upper boundary. Silver could then revisit $64.5 before testing the stronger support between $63 and $62.5. A clean breakdown there could open the path below $54.
Silver therefore remains caught between a nearby recovery opportunity and a broader bearish structure. The next test around $67 may reveal whether buyers can finally break the pattern or whether the correction still has another stage ahead.
FAQs
Is silver rarer than gold?
Gold is scarcer and rarer than silver by total geological abundance in the Earth’s crust.
Is it better to invest in silver or gold?
Neither gold nor silver is universally “better”; gold is better for long-term stability and wealth preservation, while silver offers higher growth potential through industrial demand but comes with much greater price swings.
Subscribe to our YouTube channel for daily crypto updates, market insights, and expert analysis.
The post Silver Price Warning: This Correction May Not Be Over Yet appeared first on CaptainAltcoin.
The next reaction around $64.5 to $63 may provide the clearest clue. Silver could preserve its recovery structure above that area, though a confirmed breakdown would expose much lower levels.
DeepValue Signals Says Silver Has Not Confirmed a Strong Recovery
Crypto and commodities analyst DeepValue Signals recently examined silver after its price moved back toward $67. That level was positioned directly beneath a rising red trend structure visible on the analyst’s chart.
Silver needed to reclaim that structure to confirm that buyers had regained control. The required confirmation never appeared, which left the latest upward move looking more like a temporary recovery inside a correction.
A look at the chart shows silver struggling below the red resistance area. Price climbed from the lower region but failed to establish a convincing move above $67. That failure keeps several lower support levels relevant.
$SILVER So far, silver is not confirming the setup from this morning. When I flagged ~$67, that level sat right underneath the rising red structure. As long as we remain below that area, the short-term action still feels corrective rather than impulsive to me… I’d now want… https://t.co/F32TEe3sxl pic.twitter.com/8rlxuE9At0
— DeepValue Signals (@DVSignals) September 8, 2026
DeepValue Signals identified these main areas:
Silver must first defend the region between $65.5 and $64.5.
Stronger structural support appears between $63 and $62.5.
A clear loss of $62.5 could extend the current correction.
The distinction between corrective and impulsive price action matters here. An impulsive move normally breaks resistance decisively and continues higher. Corrective action often produces temporary rebounds that remain below an important technical barrier.
Silver currently appears closer to the second situation based on the analyst’s chart. Buyers still have time to change that picture, though they would need to recover $67 and remain above the rising red structure.
Silver Price Support Could Decide Whether the Decline Continues
Silver’s immediate direction depends heavily on how price behaves around the first support region. A recovery from $65.5 to $64.5 would show that buyers remain active below the recent rebound.
Stronger pressure could send silver toward the next structural area between $63 and $62.5. That zone carries more importance because it has helped preserve the broader setup.
Silver Price Area Technical Meaning Possible Reaction Above $67 Buyers reclaim nearby resistance Recovery could become more convincing $65.5 to $64.5 First short term support region Buyers may attempt another rebound $63 to $62.5 Main structural support region Holding could protect the broader setup Below $62.5 Structural support breaks cleanly The correction could continue lower
A brief move beneath support would not necessarily confirm the bearish case. Silver would need to remain below the zone and fail to recover it before the breakdown carried greater weight.
Silver Price Remains Trapped Inside a Descending Channel
A look at silver price also shows an interesting pattern. Silver has traded inside a descending channel since reaching its last all time high near $121 during January.
XAGUSD / TradingView.com
The price has continued to form lower highs and lower lows since that peak. The upper boundary of the channel acts as resistance, and the lower boundary provides support.
Previous encounters with the upper boundary have produced declines toward the channel’s base. That sequence has repeated several times, which makes the current position especially important.
Silver price is once again close to the upper section of the channel near $68 to $71. Another rejection from that region could return price toward $63, where the channel support and DeepValue Signals’ structural zone become relevant.
A breakdown beneath $63 would weaken the pattern further. Silver could then move below $54 during the coming days if sellers maintain control and price follows the existing channel toward its lower boundary.
Read Also: 3 Reasons Kaspa Is Back on Crypto Traders’ Radar
Silver Price Faces 2 Clear Scenarios From Here
The bullish scenario requires silver to defend $64.5 and recover above $67. A stronger confirmation would arrive if price breaks the descending channel resistance between $68 and $71. Such a move would challenge the sequence of lower highs that has controlled the chart since January.
The bearish scenario begins with another rejection near the channel’s upper boundary. Silver could then revisit $64.5 before testing the stronger support between $63 and $62.5. A clean breakdown there could open the path below $54.
Silver therefore remains caught between a nearby recovery opportunity and a broader bearish structure. The next test around $67 may reveal whether buyers can finally break the pattern or whether the correction still has another stage ahead.
FAQs
Is silver rarer than gold?
Gold is scarcer and rarer than silver by total geological abundance in the Earth’s crust.
Is it better to invest in silver or gold?
Neither gold nor silver is universally “better”; gold is better for long-term stability and wealth preservation, while silver offers higher growth potential through industrial demand but comes with much greater price swings.
Subscribe to our YouTube channel for daily crypto updates, market insights, and expert analysis.
The post Silver Price Warning: This Correction May Not Be Over Yet appeared first on CaptainAltcoin.
120
ලිපිය
පරිවර්තනය බලන්න
Cardano Price Prediction: This ADA Bounce Could Have More Room to RunCardano price has returned to a level that has blocked its recovery since June. ADA now trades close to $0.23, and its reaction around that resistance could decide whether the current bounce extends or ends with another pullback.
Technical analyst More Crypto Online believes the ADA bounce remains intact. Cardano also has several September developments involving network upgrades, governance, real world adoption, and possible futures trading. Those events provide useful context, but the chart still holds the clearest clues about the next Cardano price move.
More Crypto Online explained that the bounce on the ADA chart remains valid. The analyst identified a break above $0.23 as the next objective for buyers.
A look at the 4 day Cardano chart shows ADA trading near $0.225. The price has recovered from its June low near $0.13 and now moves inside an ascending channel.
The channel’s lower boundary has helped buyers defend several higher lows. However, its upper boundary now meets the $0.23 resistance area.
@Morecryptoonl / X
The chart places the 23.6% Fibonacci retracement at $0.230862. This nearly matches the resistance that has controlled Cardano price since June.
More Crypto Online’s outlook means the recovery structure remains active. ADA still needs a confirmed breakout because another rejection could send the price back toward lower support.
Cardano’s September Upgrades Could Improve Network Performance
Cardano released node version 11.1.1 on September 7. The software removed outdated code and corrected technical issues before the planned Dijkstra upgrade.
Dijkstra is designed to improve Cardano’s speed and transaction capacity. Node version 11.2 is also expected soon, which should open a public test network for broader testing.
Leios has produced early test results that were about 6 times faster than before. However, Cardano developers still need to resolve questions surrounding future validator rewards.
The main technical developments include:
Node version 11.1.1 prepared Cardano for Dijkstra.
Node version 11.2 should introduce public network testing.
Leios testing produced about 6 times greater performance.
Future validator payments still require a sustainable model.
Validators confirm transactions and protect the blockchain. Cardano therefore needs enough network fees and rewards to keep them active once the early reserve funds decline.
Cardano Governance Narrowly Avoided An Operational Problem
Four positions on Cardano’s 7 member Constitutional Committee required renewal before September 6. The vote passed by only 0.18%.
Failure would have left the committee without enough members to operate. Treasury access and future upgrades could have faced delays as a result.
The Constitutional Committee reviews whether governance proposals comply with Cardano’s network constitution. Its continued operation allows treasury decisions and protocol planning to proceed.
Elections for 2 more leadership positions are scheduled between September 14 and September 25. Those votes will provide another important test for Cardano’s decentralized governance process.
Cardano Expands Its Real World Use And Market Access
Blockforce is using Cardano to track 500,000 supply chain records for fashion exporters in Brazil. The project demonstrates how the network can record and verify commercial information outside regular cryptocurrency transfers.
Cardano also appeared at a Dubai crypto conference on September 9. Discussions focused on bringing assets such as property and bonds onto blockchain networks before a larger launch planned for October 1.
Kraken has also applied to offer ADA futures trading in the United States. Approval would expand regulated access to Cardano price movements, although futures also allow market participants to trade against ADA.
These developments cannot guarantee higher prices. Their value will depend on adoption, network activity, and successful execution over time.
Cardano Price Prediction Depends On The $0.23 Breakout
Cardano used $0.23 as support before June and traded mainly between that level and $0.29. The June breakdown turned $0.23 into resistance, which explains why the current test matters.
A confirmed breakout could return ADA to its former range and open the path toward $0.29. Cardano would then need to clear the $0.29 to $0.30 region before targeting higher Fibonacci levels.
ADA Scenario Important Condition Possible Price Target Bullish Recovery ADA breaks and holds above $0.23 $0.29 Stronger Breakout ADA clears the $0.29 to $0.30 zone $0.315 Extended Rally ADA breaks above $0.315 with strong demand $0.406 to $0.43 Mild Pullback ADA fails near $0.23 but holds the channel $0.203 to $0.188 Bearish Breakdown ADA loses the ascending channel $0.175 to $0.157
The Elliott Wave labels show a possible A, B, C recovery inside the ascending channel. Wave C could carry ADA toward $0.315 if buyers first overcome $0.23 and $0.30.
Cardano’s chart places higher Fibonacci targets at $0.315422 and $0.405916. Those levels broadly support possible upside targets around $0.315 and $0.43.
Read Also: 3 Reasons Kaspa Is Back on Crypto Traders’ Radar
Another rejection would make $0.202827 the first support to watch. Greater selling pressure could expose $0.188383, $0.174968, and $0.157499.
A deeper bearish path toward $0.095 also appears on the chart. That outcome would become more likely only if ADA loses the ascending channel and every nearby support level.
FAQs
Will Cardano ADA reach $10?
Cardano (ADA) reaching $10 is considered highly unlikely by mainstream market forecasts in the near future, though some analysts and community members view it as a long-term possibility.
Will Cardano hit $1 in 2026?
Cardano hitting $1 in 2026 is considered unlikely by most market analysts, with current trading prices hovering around $0.20.
Subscribe to our YouTube channel for daily crypto updates, market insights, and expert analysis.
The post Cardano Price Prediction: This ADA Bounce Could Have More Room to Run appeared first on CaptainAltcoin.
Cardano Price Prediction: This ADA Bounce Could Have More Room to Run
Cardano price has returned to a level that has blocked its recovery since June. ADA now trades close to $0.23, and its reaction around that resistance could decide whether the current bounce extends or ends with another pullback.
Technical analyst More Crypto Online believes the ADA bounce remains intact. Cardano also has several September developments involving network upgrades, governance, real world adoption, and possible futures trading. Those events provide useful context, but the chart still holds the clearest clues about the next Cardano price move.
More Crypto Online explained that the bounce on the ADA chart remains valid. The analyst identified a break above $0.23 as the next objective for buyers.
A look at the 4 day Cardano chart shows ADA trading near $0.225. The price has recovered from its June low near $0.13 and now moves inside an ascending channel.
The channel’s lower boundary has helped buyers defend several higher lows. However, its upper boundary now meets the $0.23 resistance area.
@Morecryptoonl / X
The chart places the 23.6% Fibonacci retracement at $0.230862. This nearly matches the resistance that has controlled Cardano price since June.
More Crypto Online’s outlook means the recovery structure remains active. ADA still needs a confirmed breakout because another rejection could send the price back toward lower support.
Cardano’s September Upgrades Could Improve Network Performance
Cardano released node version 11.1.1 on September 7. The software removed outdated code and corrected technical issues before the planned Dijkstra upgrade.
Dijkstra is designed to improve Cardano’s speed and transaction capacity. Node version 11.2 is also expected soon, which should open a public test network for broader testing.
Leios has produced early test results that were about 6 times faster than before. However, Cardano developers still need to resolve questions surrounding future validator rewards.
The main technical developments include:
Node version 11.1.1 prepared Cardano for Dijkstra.
Node version 11.2 should introduce public network testing.
Leios testing produced about 6 times greater performance.
Future validator payments still require a sustainable model.
Validators confirm transactions and protect the blockchain. Cardano therefore needs enough network fees and rewards to keep them active once the early reserve funds decline.
Cardano Governance Narrowly Avoided An Operational Problem
Four positions on Cardano’s 7 member Constitutional Committee required renewal before September 6. The vote passed by only 0.18%.
Failure would have left the committee without enough members to operate. Treasury access and future upgrades could have faced delays as a result.
The Constitutional Committee reviews whether governance proposals comply with Cardano’s network constitution. Its continued operation allows treasury decisions and protocol planning to proceed.
Elections for 2 more leadership positions are scheduled between September 14 and September 25. Those votes will provide another important test for Cardano’s decentralized governance process.
Cardano Expands Its Real World Use And Market Access
Blockforce is using Cardano to track 500,000 supply chain records for fashion exporters in Brazil. The project demonstrates how the network can record and verify commercial information outside regular cryptocurrency transfers.
Cardano also appeared at a Dubai crypto conference on September 9. Discussions focused on bringing assets such as property and bonds onto blockchain networks before a larger launch planned for October 1.
Kraken has also applied to offer ADA futures trading in the United States. Approval would expand regulated access to Cardano price movements, although futures also allow market participants to trade against ADA.
These developments cannot guarantee higher prices. Their value will depend on adoption, network activity, and successful execution over time.
Cardano Price Prediction Depends On The $0.23 Breakout
Cardano used $0.23 as support before June and traded mainly between that level and $0.29. The June breakdown turned $0.23 into resistance, which explains why the current test matters.
A confirmed breakout could return ADA to its former range and open the path toward $0.29. Cardano would then need to clear the $0.29 to $0.30 region before targeting higher Fibonacci levels.
ADA Scenario Important Condition Possible Price Target Bullish Recovery ADA breaks and holds above $0.23 $0.29 Stronger Breakout ADA clears the $0.29 to $0.30 zone $0.315 Extended Rally ADA breaks above $0.315 with strong demand $0.406 to $0.43 Mild Pullback ADA fails near $0.23 but holds the channel $0.203 to $0.188 Bearish Breakdown ADA loses the ascending channel $0.175 to $0.157
The Elliott Wave labels show a possible A, B, C recovery inside the ascending channel. Wave C could carry ADA toward $0.315 if buyers first overcome $0.23 and $0.30.
Cardano’s chart places higher Fibonacci targets at $0.315422 and $0.405916. Those levels broadly support possible upside targets around $0.315 and $0.43.
Read Also: 3 Reasons Kaspa Is Back on Crypto Traders’ Radar
Another rejection would make $0.202827 the first support to watch. Greater selling pressure could expose $0.188383, $0.174968, and $0.157499.
A deeper bearish path toward $0.095 also appears on the chart. That outcome would become more likely only if ADA loses the ascending channel and every nearby support level.
FAQs
Will Cardano ADA reach $10?
Cardano (ADA) reaching $10 is considered highly unlikely by mainstream market forecasts in the near future, though some analysts and community members view it as a long-term possibility.
Will Cardano hit $1 in 2026?
Cardano hitting $1 in 2026 is considered unlikely by most market analysts, with current trading prices hovering around $0.20.
Subscribe to our YouTube channel for daily crypto updates, market insights, and expert analysis.
The post Cardano Price Prediction: This ADA Bounce Could Have More Room to Run appeared first on CaptainAltcoin.
Technical analyst More Crypto Online believes the ADA bounce remains intact. Cardano also has several September developments involving network upgrades, governance, real world adoption, and possible futures trading. Those events provide useful context, but the chart still holds the clearest clues about the next Cardano price move.
More Crypto Online explained that the bounce on the ADA chart remains valid. The analyst identified a break above $0.23 as the next objective for buyers.
A look at the 4 day Cardano chart shows ADA trading near $0.225. The price has recovered from its June low near $0.13 and now moves inside an ascending channel.
The channel’s lower boundary has helped buyers defend several higher lows. However, its upper boundary now meets the $0.23 resistance area.
@Morecryptoonl / X
The chart places the 23.6% Fibonacci retracement at $0.230862. This nearly matches the resistance that has controlled Cardano price since June.
More Crypto Online’s outlook means the recovery structure remains active. ADA still needs a confirmed breakout because another rejection could send the price back toward lower support.
Cardano’s September Upgrades Could Improve Network Performance
Cardano released node version 11.1.1 on September 7. The software removed outdated code and corrected technical issues before the planned Dijkstra upgrade.
Dijkstra is designed to improve Cardano’s speed and transaction capacity. Node version 11.2 is also expected soon, which should open a public test network for broader testing.
Leios has produced early test results that were about 6 times faster than before. However, Cardano developers still need to resolve questions surrounding future validator rewards.
The main technical developments include:
Node version 11.1.1 prepared Cardano for Dijkstra.
Node version 11.2 should introduce public network testing.
Leios testing produced about 6 times greater performance.
Future validator payments still require a sustainable model.
Validators confirm transactions and protect the blockchain. Cardano therefore needs enough network fees and rewards to keep them active once the early reserve funds decline.
Cardano Governance Narrowly Avoided An Operational Problem
Four positions on Cardano’s 7 member Constitutional Committee required renewal before September 6. The vote passed by only 0.18%.
Failure would have left the committee without enough members to operate. Treasury access and future upgrades could have faced delays as a result.
The Constitutional Committee reviews whether governance proposals comply with Cardano’s network constitution. Its continued operation allows treasury decisions and protocol planning to proceed.
Elections for 2 more leadership positions are scheduled between September 14 and September 25. Those votes will provide another important test for Cardano’s decentralized governance process.
Cardano Expands Its Real World Use And Market Access
Blockforce is using Cardano to track 500,000 supply chain records for fashion exporters in Brazil. The project demonstrates how the network can record and verify commercial information outside regular cryptocurrency transfers.
Cardano also appeared at a Dubai crypto conference on September 9. Discussions focused on bringing assets such as property and bonds onto blockchain networks before a larger launch planned for October 1.
Kraken has also applied to offer ADA futures trading in the United States. Approval would expand regulated access to Cardano price movements, although futures also allow market participants to trade against ADA.
These developments cannot guarantee higher prices. Their value will depend on adoption, network activity, and successful execution over time.
Cardano Price Prediction Depends On The $0.23 Breakout
Cardano used $0.23 as support before June and traded mainly between that level and $0.29. The June breakdown turned $0.23 into resistance, which explains why the current test matters.
A confirmed breakout could return ADA to its former range and open the path toward $0.29. Cardano would then need to clear the $0.29 to $0.30 region before targeting higher Fibonacci levels.
ADA Scenario Important Condition Possible Price Target Bullish Recovery ADA breaks and holds above $0.23 $0.29 Stronger Breakout ADA clears the $0.29 to $0.30 zone $0.315 Extended Rally ADA breaks above $0.315 with strong demand $0.406 to $0.43 Mild Pullback ADA fails near $0.23 but holds the channel $0.203 to $0.188 Bearish Breakdown ADA loses the ascending channel $0.175 to $0.157
The Elliott Wave labels show a possible A, B, C recovery inside the ascending channel. Wave C could carry ADA toward $0.315 if buyers first overcome $0.23 and $0.30.
Cardano’s chart places higher Fibonacci targets at $0.315422 and $0.405916. Those levels broadly support possible upside targets around $0.315 and $0.43.
Read Also: 3 Reasons Kaspa Is Back on Crypto Traders’ Radar
Another rejection would make $0.202827 the first support to watch. Greater selling pressure could expose $0.188383, $0.174968, and $0.157499.
A deeper bearish path toward $0.095 also appears on the chart. That outcome would become more likely only if ADA loses the ascending channel and every nearby support level.
FAQs
Will Cardano ADA reach $10?
Cardano (ADA) reaching $10 is considered highly unlikely by mainstream market forecasts in the near future, though some analysts and community members view it as a long-term possibility.
Will Cardano hit $1 in 2026?
Cardano hitting $1 in 2026 is considered unlikely by most market analysts, with current trading prices hovering around $0.20.
Subscribe to our YouTube channel for daily crypto updates, market insights, and expert analysis.
The post Cardano Price Prediction: This ADA Bounce Could Have More Room to Run appeared first on CaptainAltcoin.
1
271
පරිවර්තනය බලන්න
GGBR Inc. Announces New Trust-Based Collateral Structure for Goldfish TokensThe GGBR Trust now holds 1,000,000 ounces of in-situ gold from the Happy 2 Mine claims; every Goldfish token holder is a beneficiary of the Trust
GGBR Inc. (d/b/a Goldfish), the technical developer and operator of gold-backed digital tokens, today announced the completion of a restructuring of the collateral supporting its Goldfish tokens. Effective August 19, 2026, Goldfish tokens are backed by the GGBR Trust (the “Trust”), which holds 1,000,000 troy ounces of in-situ gold derived from the Happy 2 Mine claims. All holders of Goldfish tokens are beneficiaries of the Trust.
The new structure replaces the prior lease-based arrangement under which Goldfish tokens were supported by tokens issued by a third party. Under the Trust structure, the gold resource is held directly for the benefit of token holders rather than through an intermediary token layer.
Key elements of the Trust structure:
Direct beneficial interest. Each Goldfish token holder is a beneficiary of the GGBR Trust in proportion to tokens held.
1,000,000 troy ounces of in-situ gold. The Trust’s corpus consists of 1,000,000 troy ounces of in-situ gold from the Happy 2 Mine claims, which are supported by a NI-43-101 instrument that was prepared with respect to the Happy 2 Mine by a registered geologist in June 2013 and updated by R&D Adventures, LLC in 2026.
Independent trustee. The Trust is administered by Le Petit Bouffant, Ltd, an independent trustee, under a trust agreement dated August 19, 2026.
Transparency. A trustee certification of the trust agreement, the resource documentation, and the Trust’s holdings is available by request through goldfishgold.com.
“Moving the collateral into a trust held for the benefit of token holders is the simplest and most direct way to give Goldfish holders what they actually want: a clear, enforceable claim on the gold behind their tokens,” said Colin Breeze, General Counsel of GGBR Inc. “We removed a layer between the holder and the asset.”
“We are very happy to partner and support the GGBR opportunity” said Jean Howard, principal of Fluent Technologies LLC, owner of the Happy 2 Mine claims.
Goldfish token holders do not need to take any action; existing tokens are automatically covered by the Trust structure. Updated documentation, including the revised token terms, is posted at goldfishgold.com.
About GGBR Inc. (Goldfish)
GGBR Inc. issues gold-backed digital tokens supported by in-situ gold held in the GGBR Trust for the benefit of token holders. The company is based in Cheyenne, Wyoming.
Each Goldfish Gold token (GGBR) represents 1/1000th of a troy ounce and is pegged in real-time to the London Bullion Market Association (LBMA) Gold Spot Price, giving users direct, premium-free exposure to gold’s historic role as the ultimate safe-haven asset during uncertain times.
Learn more about Goldfish or purchase GGBR tokens directly at goldfishgold.com.
About the Happy 2 Mine Claims
The claims are part of a 320-acre public land site in Pinal County, Arizona consisting of 16 claims located 25 miles east of the city of Eloy, Arizona.
Forward-Looking Statements
This press release contains forward-looking statements, including statements regarding the Trust structure, the gold resource held by the Trust, and the benefits of the restructuring to token holders. In-situ gold represents a mineral resource in the ground and has not been extracted, refined, or delivered; resource estimates are subject to geological, engineering, permitting, and economic uncertainty and may differ materially from quantities ultimately recovered. Forward-looking statements are based on current expectations and are subject to risks and uncertainties that could cause actual results to differ materially. GGBR Inc. undertakes no obligation to update any forward-looking statement except as required by law.
This press release is for informational purposes only and does not constitute an offer to sell or a solicitation of an offer to buy any token or security in any jurisdiction.
Media Contact
Peter Mikhailenok, GGBR Inc.
info@goldfishgold.com
The post GGBR Inc. Announces New Trust-Based Collateral Structure for Goldfish Tokens appeared first on CaptainAltcoin.
GGBR Inc. Announces New Trust-Based Collateral Structure for Goldfish Tokens
The GGBR Trust now holds 1,000,000 ounces of in-situ gold from the Happy 2 Mine claims; every Goldfish token holder is a beneficiary of the Trust
GGBR Inc. (d/b/a Goldfish), the technical developer and operator of gold-backed digital tokens, today announced the completion of a restructuring of the collateral supporting its Goldfish tokens. Effective August 19, 2026, Goldfish tokens are backed by the GGBR Trust (the “Trust”), which holds 1,000,000 troy ounces of in-situ gold derived from the Happy 2 Mine claims. All holders of Goldfish tokens are beneficiaries of the Trust.
The new structure replaces the prior lease-based arrangement under which Goldfish tokens were supported by tokens issued by a third party. Under the Trust structure, the gold resource is held directly for the benefit of token holders rather than through an intermediary token layer.
Key elements of the Trust structure:
Direct beneficial interest. Each Goldfish token holder is a beneficiary of the GGBR Trust in proportion to tokens held.
1,000,000 troy ounces of in-situ gold. The Trust’s corpus consists of 1,000,000 troy ounces of in-situ gold from the Happy 2 Mine claims, which are supported by a NI-43-101 instrument that was prepared with respect to the Happy 2 Mine by a registered geologist in June 2013 and updated by R&D Adventures, LLC in 2026.
Independent trustee. The Trust is administered by Le Petit Bouffant, Ltd, an independent trustee, under a trust agreement dated August 19, 2026.
Transparency. A trustee certification of the trust agreement, the resource documentation, and the Trust’s holdings is available by request through goldfishgold.com.
“Moving the collateral into a trust held for the benefit of token holders is the simplest and most direct way to give Goldfish holders what they actually want: a clear, enforceable claim on the gold behind their tokens,” said Colin Breeze, General Counsel of GGBR Inc. “We removed a layer between the holder and the asset.”
“We are very happy to partner and support the GGBR opportunity” said Jean Howard, principal of Fluent Technologies LLC, owner of the Happy 2 Mine claims.
Goldfish token holders do not need to take any action; existing tokens are automatically covered by the Trust structure. Updated documentation, including the revised token terms, is posted at goldfishgold.com.
About GGBR Inc. (Goldfish)
GGBR Inc. issues gold-backed digital tokens supported by in-situ gold held in the GGBR Trust for the benefit of token holders. The company is based in Cheyenne, Wyoming.
Each Goldfish Gold token (GGBR) represents 1/1000th of a troy ounce and is pegged in real-time to the London Bullion Market Association (LBMA) Gold Spot Price, giving users direct, premium-free exposure to gold’s historic role as the ultimate safe-haven asset during uncertain times.
Learn more about Goldfish or purchase GGBR tokens directly at goldfishgold.com.
About the Happy 2 Mine Claims
The claims are part of a 320-acre public land site in Pinal County, Arizona consisting of 16 claims located 25 miles east of the city of Eloy, Arizona.
Forward-Looking Statements
This press release contains forward-looking statements, including statements regarding the Trust structure, the gold resource held by the Trust, and the benefits of the restructuring to token holders. In-situ gold represents a mineral resource in the ground and has not been extracted, refined, or delivered; resource estimates are subject to geological, engineering, permitting, and economic uncertainty and may differ materially from quantities ultimately recovered. Forward-looking statements are based on current expectations and are subject to risks and uncertainties that could cause actual results to differ materially. GGBR Inc. undertakes no obligation to update any forward-looking statement except as required by law.
This press release is for informational purposes only and does not constitute an offer to sell or a solicitation of an offer to buy any token or security in any jurisdiction.
Media Contact
Peter Mikhailenok, GGBR Inc.
info@goldfishgold.com
The post GGBR Inc. Announces New Trust-Based Collateral Structure for Goldfish Tokens appeared first on CaptainAltcoin.
GGBR Inc. (d/b/a Goldfish), the technical developer and operator of gold-backed digital tokens, today announced the completion of a restructuring of the collateral supporting its Goldfish tokens. Effective August 19, 2026, Goldfish tokens are backed by the GGBR Trust (the “Trust”), which holds 1,000,000 troy ounces of in-situ gold derived from the Happy 2 Mine claims. All holders of Goldfish tokens are beneficiaries of the Trust.
The new structure replaces the prior lease-based arrangement under which Goldfish tokens were supported by tokens issued by a third party. Under the Trust structure, the gold resource is held directly for the benefit of token holders rather than through an intermediary token layer.
Key elements of the Trust structure:
Direct beneficial interest. Each Goldfish token holder is a beneficiary of the GGBR Trust in proportion to tokens held.
1,000,000 troy ounces of in-situ gold. The Trust’s corpus consists of 1,000,000 troy ounces of in-situ gold from the Happy 2 Mine claims, which are supported by a NI-43-101 instrument that was prepared with respect to the Happy 2 Mine by a registered geologist in June 2013 and updated by R&D Adventures, LLC in 2026.
Independent trustee. The Trust is administered by Le Petit Bouffant, Ltd, an independent trustee, under a trust agreement dated August 19, 2026.
Transparency. A trustee certification of the trust agreement, the resource documentation, and the Trust’s holdings is available by request through goldfishgold.com.
“Moving the collateral into a trust held for the benefit of token holders is the simplest and most direct way to give Goldfish holders what they actually want: a clear, enforceable claim on the gold behind their tokens,” said Colin Breeze, General Counsel of GGBR Inc. “We removed a layer between the holder and the asset.”
“We are very happy to partner and support the GGBR opportunity” said Jean Howard, principal of Fluent Technologies LLC, owner of the Happy 2 Mine claims.
Goldfish token holders do not need to take any action; existing tokens are automatically covered by the Trust structure. Updated documentation, including the revised token terms, is posted at goldfishgold.com.
About GGBR Inc. (Goldfish)
GGBR Inc. issues gold-backed digital tokens supported by in-situ gold held in the GGBR Trust for the benefit of token holders. The company is based in Cheyenne, Wyoming.
Each Goldfish Gold token (GGBR) represents 1/1000th of a troy ounce and is pegged in real-time to the London Bullion Market Association (LBMA) Gold Spot Price, giving users direct, premium-free exposure to gold’s historic role as the ultimate safe-haven asset during uncertain times.
Learn more about Goldfish or purchase GGBR tokens directly at goldfishgold.com.
About the Happy 2 Mine Claims
The claims are part of a 320-acre public land site in Pinal County, Arizona consisting of 16 claims located 25 miles east of the city of Eloy, Arizona.
Forward-Looking Statements
This press release contains forward-looking statements, including statements regarding the Trust structure, the gold resource held by the Trust, and the benefits of the restructuring to token holders. In-situ gold represents a mineral resource in the ground and has not been extracted, refined, or delivered; resource estimates are subject to geological, engineering, permitting, and economic uncertainty and may differ materially from quantities ultimately recovered. Forward-looking statements are based on current expectations and are subject to risks and uncertainties that could cause actual results to differ materially. GGBR Inc. undertakes no obligation to update any forward-looking statement except as required by law.
This press release is for informational purposes only and does not constitute an offer to sell or a solicitation of an offer to buy any token or security in any jurisdiction.
Media Contact
Peter Mikhailenok, GGBR Inc.
info@goldfishgold.com
The post GGBR Inc. Announces New Trust-Based Collateral Structure for Goldfish Tokens appeared first on CaptainAltcoin.
114
පරිවර්තනය බලන්න
3 Reasons Kaspa Is Back on Crypto Traders’ RadarKaspa has suddenly become popular again after one of its strongest short-term moves in months. The KAS price is trading around $0.03521 after pumping almost 30% over the past week, with the rally briefly taking the price above $0.037. Market data shows KAS traded around $0.0275 at the beginning of September before accelerating significantly over the past several days.
Popular crypto analyst MissCrypto recently drew attention to three developments that could be helping put Kaspa back on traders’ radar: growing activity following the Toccata upgrade, easier access to KAS mining through KuCoin, and progress toward a public DAGKnight testnet.
These developments don’t necessarily explain every part of the recent price rally, but they give KAS traders several fundamental catalysts to watch while speculative interest returns.
1. Toccata Is Starting to Change What Can Be Built on Kaspa
The first reason is Toccata.
Kaspa activated the Toccata upgrade on mainnet on June 30, 2026, expanding what developers can build directly on the Layer 1 network.
One of the biggest additions was covenants.
In simple terms, covenants allow developers to place programmable conditions on how coins can subsequently be spent. They aren’t identical to Ethereum’s general-purpose smart contracts, but they give Kaspa substantially more programmability at the base layer.
That matters for a network historically known primarily for its BlockDAG architecture, Proof-of-Work security and fast transaction processing.
According to the figures shared by MissCrypto, Kaspa is now processing more than 15,000 covenant transactions per day, which represents an increase of roughly 1,322% compared with the previous month.
If that measurement holds across the same definition and methodology, the growth would indicate that developers and users are already experimenting with the functionality Toccata introduced.
Was geht denn bei $KAS ab? 1⃣ Toccata ist seit Ende Juni 2026 live. Das Upgrade brachte Covenants auf Kaspa L1, also Kaspas eigene Variante von Smart Contracts:über 15K Covenant-Transaktionen pro Tag+1.322 % gegenüber dem Vormonat 2⃣ KuCoin-Adoption mit Kampagne… pic.twitter.com/s8ZxcVe8Bt
— MissCrypto (@MissCryptoGER) September 8, 2026
The bigger question is whether covenant activity can develop into applications with sustained usage. A temporary jump in transactions is interesting; consistent activity over several months would be considerably more important for the long-term KAS story.
Read also: Kaspa Just Changed What Developers Can Build on KAS
2. KuCoin Has Made KAS Mining More Accessible
MissCrypto’s second point concerns mining accessibility.
Since August 25, KuCoin has offered users a way to gain exposure to KAS mining through its mining platform without purchasing and operating their own physical ASIC equipment.
That’s potentially important because Kaspa remains a Proof-of-Work network.
Mining KAS directly normally involves specialized hardware, electricity costs, cooling, maintenance and enough technical knowledge to operate the equipment efficiently. A hosted or platform-based option reduces several of those barriers.
It doesn’t fundamentally change Kaspa’s protocol, and easier mining access shouldn’t automatically be interpreted as increased demand for KAS.
What it does do is broaden the number of people who can participate economically in Kaspa’s mining ecosystem without building their own mining operation.
For an asset attempting to regain market attention, additional accessibility through a major centralized exchange ecosystem can help put KAS in front of a larger group of crypto users.
3. DAGKnight Is Getting Closer
The third development may ultimately be the most important technologically: DAGKnight.
DAGKnight has been part of Kaspa’s longer-term roadmap and is designed to advance the network’s consensus architecture beyond its existing GHOSTDAG framework.
MissCrypto points to an important development from August 31, when work toward launching and operating a public DAGKnight testnet appeared as a concrete development item.
The distinction here is crucial.
DAGKnight is not running on Kaspa mainnet.
A public testnet would instead provide an environment where the technology can be deployed, tested and observed under more realistic conditions before any potential mainnet implementation.
That’s why the recent development work matters without needing to overstate it. Moving toward a public testnet would turn DAGKnight from a largely research-and-development narrative into something developers and the wider community can begin evaluating more directly.
If the public testing phase eventually proves successful, attention would naturally turn toward what is required before DAGKnight could become part of Kaspa’s production network.
Is Kaspa Finally Making a Comeback?
KAS has certainly given traders a reason to look at it again.
From approximately $0.0275 at the beginning of September, KAS climbed above $0.037 during the latest rally, before settling around the $0.035 area. September 7 alone produced a gain of more than 13%, accompanied by trading volume above $100 million on the market tracked by Investing.com.
But the three developments MissCrypto identified operate on very different timelines.
Toccata is already live, so covenant usage can be measured now. KuCoin’s mining offering improves accessibility but doesn’t by itself guarantee greater KAS demand. DAGKnight could be the biggest technological catalyst of the three, but it remains a future development and shouldn’t be treated as a completed mainnet upgrade.
There are also other pieces of the Kaspa ecosystem developing in parallel, including efforts to build DeFi infrastructure around the network.
For now, the approximately 30% weekly KAS rally appears to be happening at an interesting moment: Toccata has moved Kaspa beyond its old functionality, new avenues for participating in the ecosystem are appearing, and one of the project’s most anticipated technical developments is moving closer to public testing.
Subscribe to our YouTube channel for daily crypto updates, market insights, and expert analysis.
The post 3 Reasons Kaspa Is Back on Crypto Traders’ Radar appeared first on CaptainAltcoin.
3 Reasons Kaspa Is Back on Crypto Traders’ Radar
Kaspa has suddenly become popular again after one of its strongest short-term moves in months. The KAS price is trading around $0.03521 after pumping almost 30% over the past week, with the rally briefly taking the price above $0.037. Market data shows KAS traded around $0.0275 at the beginning of September before accelerating significantly over the past several days.
Popular crypto analyst MissCrypto recently drew attention to three developments that could be helping put Kaspa back on traders’ radar: growing activity following the Toccata upgrade, easier access to KAS mining through KuCoin, and progress toward a public DAGKnight testnet.
These developments don’t necessarily explain every part of the recent price rally, but they give KAS traders several fundamental catalysts to watch while speculative interest returns.
1. Toccata Is Starting to Change What Can Be Built on Kaspa
The first reason is Toccata.
Kaspa activated the Toccata upgrade on mainnet on June 30, 2026, expanding what developers can build directly on the Layer 1 network.
One of the biggest additions was covenants.
In simple terms, covenants allow developers to place programmable conditions on how coins can subsequently be spent. They aren’t identical to Ethereum’s general-purpose smart contracts, but they give Kaspa substantially more programmability at the base layer.
That matters for a network historically known primarily for its BlockDAG architecture, Proof-of-Work security and fast transaction processing.
According to the figures shared by MissCrypto, Kaspa is now processing more than 15,000 covenant transactions per day, which represents an increase of roughly 1,322% compared with the previous month.
If that measurement holds across the same definition and methodology, the growth would indicate that developers and users are already experimenting with the functionality Toccata introduced.
Was geht denn bei $KAS ab? 1⃣ Toccata ist seit Ende Juni 2026 live. Das Upgrade brachte Covenants auf Kaspa L1, also Kaspas eigene Variante von Smart Contracts:über 15K Covenant-Transaktionen pro Tag+1.322 % gegenüber dem Vormonat 2⃣ KuCoin-Adoption mit Kampagne… pic.twitter.com/s8ZxcVe8Bt
— MissCrypto (@MissCryptoGER) September 8, 2026
The bigger question is whether covenant activity can develop into applications with sustained usage. A temporary jump in transactions is interesting; consistent activity over several months would be considerably more important for the long-term KAS story.
Read also: Kaspa Just Changed What Developers Can Build on KAS
2. KuCoin Has Made KAS Mining More Accessible
MissCrypto’s second point concerns mining accessibility.
Since August 25, KuCoin has offered users a way to gain exposure to KAS mining through its mining platform without purchasing and operating their own physical ASIC equipment.
That’s potentially important because Kaspa remains a Proof-of-Work network.
Mining KAS directly normally involves specialized hardware, electricity costs, cooling, maintenance and enough technical knowledge to operate the equipment efficiently. A hosted or platform-based option reduces several of those barriers.
It doesn’t fundamentally change Kaspa’s protocol, and easier mining access shouldn’t automatically be interpreted as increased demand for KAS.
What it does do is broaden the number of people who can participate economically in Kaspa’s mining ecosystem without building their own mining operation.
For an asset attempting to regain market attention, additional accessibility through a major centralized exchange ecosystem can help put KAS in front of a larger group of crypto users.
3. DAGKnight Is Getting Closer
The third development may ultimately be the most important technologically: DAGKnight.
DAGKnight has been part of Kaspa’s longer-term roadmap and is designed to advance the network’s consensus architecture beyond its existing GHOSTDAG framework.
MissCrypto points to an important development from August 31, when work toward launching and operating a public DAGKnight testnet appeared as a concrete development item.
The distinction here is crucial.
DAGKnight is not running on Kaspa mainnet.
A public testnet would instead provide an environment where the technology can be deployed, tested and observed under more realistic conditions before any potential mainnet implementation.
That’s why the recent development work matters without needing to overstate it. Moving toward a public testnet would turn DAGKnight from a largely research-and-development narrative into something developers and the wider community can begin evaluating more directly.
If the public testing phase eventually proves successful, attention would naturally turn toward what is required before DAGKnight could become part of Kaspa’s production network.
Is Kaspa Finally Making a Comeback?
KAS has certainly given traders a reason to look at it again.
From approximately $0.0275 at the beginning of September, KAS climbed above $0.037 during the latest rally, before settling around the $0.035 area. September 7 alone produced a gain of more than 13%, accompanied by trading volume above $100 million on the market tracked by Investing.com.
But the three developments MissCrypto identified operate on very different timelines.
Toccata is already live, so covenant usage can be measured now. KuCoin’s mining offering improves accessibility but doesn’t by itself guarantee greater KAS demand. DAGKnight could be the biggest technological catalyst of the three, but it remains a future development and shouldn’t be treated as a completed mainnet upgrade.
There are also other pieces of the Kaspa ecosystem developing in parallel, including efforts to build DeFi infrastructure around the network.
For now, the approximately 30% weekly KAS rally appears to be happening at an interesting moment: Toccata has moved Kaspa beyond its old functionality, new avenues for participating in the ecosystem are appearing, and one of the project’s most anticipated technical developments is moving closer to public testing.
Subscribe to our YouTube channel for daily crypto updates, market insights, and expert analysis.
The post 3 Reasons Kaspa Is Back on Crypto Traders’ Radar appeared first on CaptainAltcoin.
Popular crypto analyst MissCrypto recently drew attention to three developments that could be helping put Kaspa back on traders’ radar: growing activity following the Toccata upgrade, easier access to KAS mining through KuCoin, and progress toward a public DAGKnight testnet.
These developments don’t necessarily explain every part of the recent price rally, but they give KAS traders several fundamental catalysts to watch while speculative interest returns.
1. Toccata Is Starting to Change What Can Be Built on Kaspa
The first reason is Toccata.
Kaspa activated the Toccata upgrade on mainnet on June 30, 2026, expanding what developers can build directly on the Layer 1 network.
One of the biggest additions was covenants.
In simple terms, covenants allow developers to place programmable conditions on how coins can subsequently be spent. They aren’t identical to Ethereum’s general-purpose smart contracts, but they give Kaspa substantially more programmability at the base layer.
That matters for a network historically known primarily for its BlockDAG architecture, Proof-of-Work security and fast transaction processing.
According to the figures shared by MissCrypto, Kaspa is now processing more than 15,000 covenant transactions per day, which represents an increase of roughly 1,322% compared with the previous month.
If that measurement holds across the same definition and methodology, the growth would indicate that developers and users are already experimenting with the functionality Toccata introduced.
Was geht denn bei $KAS ab? 1⃣ Toccata ist seit Ende Juni 2026 live. Das Upgrade brachte Covenants auf Kaspa L1, also Kaspas eigene Variante von Smart Contracts:über 15K Covenant-Transaktionen pro Tag+1.322 % gegenüber dem Vormonat 2⃣ KuCoin-Adoption mit Kampagne… pic.twitter.com/s8ZxcVe8Bt
— MissCrypto (@MissCryptoGER) September 8, 2026
The bigger question is whether covenant activity can develop into applications with sustained usage. A temporary jump in transactions is interesting; consistent activity over several months would be considerably more important for the long-term KAS story.
Read also: Kaspa Just Changed What Developers Can Build on KAS
2. KuCoin Has Made KAS Mining More Accessible
MissCrypto’s second point concerns mining accessibility.
Since August 25, KuCoin has offered users a way to gain exposure to KAS mining through its mining platform without purchasing and operating their own physical ASIC equipment.
That’s potentially important because Kaspa remains a Proof-of-Work network.
Mining KAS directly normally involves specialized hardware, electricity costs, cooling, maintenance and enough technical knowledge to operate the equipment efficiently. A hosted or platform-based option reduces several of those barriers.
It doesn’t fundamentally change Kaspa’s protocol, and easier mining access shouldn’t automatically be interpreted as increased demand for KAS.
What it does do is broaden the number of people who can participate economically in Kaspa’s mining ecosystem without building their own mining operation.
For an asset attempting to regain market attention, additional accessibility through a major centralized exchange ecosystem can help put KAS in front of a larger group of crypto users.
3. DAGKnight Is Getting Closer
The third development may ultimately be the most important technologically: DAGKnight.
DAGKnight has been part of Kaspa’s longer-term roadmap and is designed to advance the network’s consensus architecture beyond its existing GHOSTDAG framework.
MissCrypto points to an important development from August 31, when work toward launching and operating a public DAGKnight testnet appeared as a concrete development item.
The distinction here is crucial.
DAGKnight is not running on Kaspa mainnet.
A public testnet would instead provide an environment where the technology can be deployed, tested and observed under more realistic conditions before any potential mainnet implementation.
That’s why the recent development work matters without needing to overstate it. Moving toward a public testnet would turn DAGKnight from a largely research-and-development narrative into something developers and the wider community can begin evaluating more directly.
If the public testing phase eventually proves successful, attention would naturally turn toward what is required before DAGKnight could become part of Kaspa’s production network.
Is Kaspa Finally Making a Comeback?
KAS has certainly given traders a reason to look at it again.
From approximately $0.0275 at the beginning of September, KAS climbed above $0.037 during the latest rally, before settling around the $0.035 area. September 7 alone produced a gain of more than 13%, accompanied by trading volume above $100 million on the market tracked by Investing.com.
But the three developments MissCrypto identified operate on very different timelines.
Toccata is already live, so covenant usage can be measured now. KuCoin’s mining offering improves accessibility but doesn’t by itself guarantee greater KAS demand. DAGKnight could be the biggest technological catalyst of the three, but it remains a future development and shouldn’t be treated as a completed mainnet upgrade.
There are also other pieces of the Kaspa ecosystem developing in parallel, including efforts to build DeFi infrastructure around the network.
For now, the approximately 30% weekly KAS rally appears to be happening at an interesting moment: Toccata has moved Kaspa beyond its old functionality, new avenues for participating in the ecosystem are appearing, and one of the project’s most anticipated technical developments is moving closer to public testing.
Subscribe to our YouTube channel for daily crypto updates, market insights, and expert analysis.
The post 3 Reasons Kaspa Is Back on Crypto Traders’ Radar appeared first on CaptainAltcoin.
257
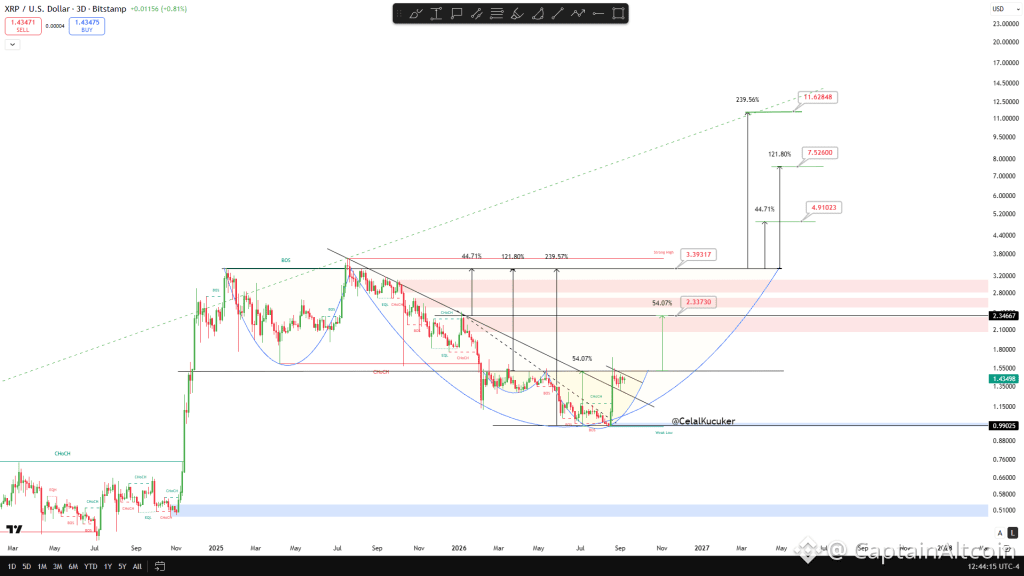
ලිපිය
ඊළඟ Bull Run එකේ තරුව විය හැකි XRP මිලක්—විශ්ලේෂකයා පවසයිපසුගිය පැය 24 තුළ XRP මිල ආසන්න වශයෙන් 2% කින් ඉහළ ගොස් ඇති අතර, ගැනුම්කරුවන් ඔවුන්ගේ මෑතකාලීන යථා තත්ත්වය තවදුරටත් දිගු කිරීමට උත්සාහ කරන බැවින් ටෝකනය නැවත ආසන්න වශයෙන් $1.42 වෙත ගෙන එයි. වර්තමාන වෙළඳපල දත්ත අනුව පැය 24 පරාසය ආසන්න වශයෙන් $1.38 සිට $1.45 දක්වා වන අතර, පසුගිය සතිය තුළ XRP මිල 5% කට වඩා ද ඉහළ ගොස් ඇත.
CaptainAltcoin හි අපි නිතර ආවරණය කරන විශ්ලේෂකයෙකු වන Celal Küçüker විසින් ප්රකාශයට පත් කළ අභිලාෂවත් නව XRP ඉදිරි දැක්මක් සම්බන්ධයෙන් නවතම චලනය පැමිණෙයි. Küçüker විශ්වාස කරන්නේ XRP “මෙම bull run එකේ තරුව විය හැකි” බවයි; ඔහු $2.30, $3.30, $4.90, $7.50 සහ අවසානයේ $11.60 යන ඉලක්ක වෙත යන ක්රමික ප්රගතියක් දක්වා ඇත.
ඊළඟ Bull Run එකේ තරුව විය හැකි XRP මිලක්—විශ්ලේෂකයා පවසයි
පසුගිය පැය 24 තුළ XRP මිල ආසන්න වශයෙන් 2% කින් ඉහළ ගොස් ඇති අතර, ගැනුම්කරුවන් ඔවුන්ගේ මෑතකාලීන යථා තත්ත්වය තවදුරටත් දිගු කිරීමට උත්සාහ කරන බැවින් ටෝකනය නැවත ආසන්න වශයෙන් $1.42 වෙත ගෙන එයි. වර්තමාන වෙළඳපල දත්ත අනුව පැය 24 පරාසය ආසන්න වශයෙන් $1.38 සිට $1.45 දක්වා වන අතර, පසුගිය සතිය තුළ XRP මිල 5% කට වඩා ද ඉහළ ගොස් ඇත.
CaptainAltcoin හි අපි නිතර ආවරණය කරන විශ්ලේෂකයෙකු වන Celal Küçüker විසින් ප්රකාශයට පත් කළ අභිලාෂවත් නව XRP ඉදිරි දැක්මක් සම්බන්ධයෙන් නවතම චලනය පැමිණෙයි. Küçüker විශ්වාස කරන්නේ XRP “මෙම bull run එකේ තරුව විය හැකි” බවයි; ඔහු $2.30, $3.30, $4.90, $7.50 සහ අවසානයේ $11.60 යන ඉලක්ක වෙත යන ක්රමික ප්රගතියක් දක්වා ඇත.
CaptainAltcoin හි අපි නිතර ආවරණය කරන විශ්ලේෂකයෙකු වන Celal Küçüker විසින් ප්රකාශයට පත් කළ අභිලාෂවත් නව XRP ඉදිරි දැක්මක් සම්බන්ධයෙන් නවතම චලනය පැමිණෙයි. Küçüker විශ්වාස කරන්නේ XRP “මෙම bull run එකේ තරුව විය හැකි” බවයි; ඔහු $2.30, $3.30, $4.90, $7.50 සහ අවසානයේ $11.60 යන ඉලක්ක වෙත යන ක්රමික ප්රගතියක් දක්වා ඇත.
7
2.1k
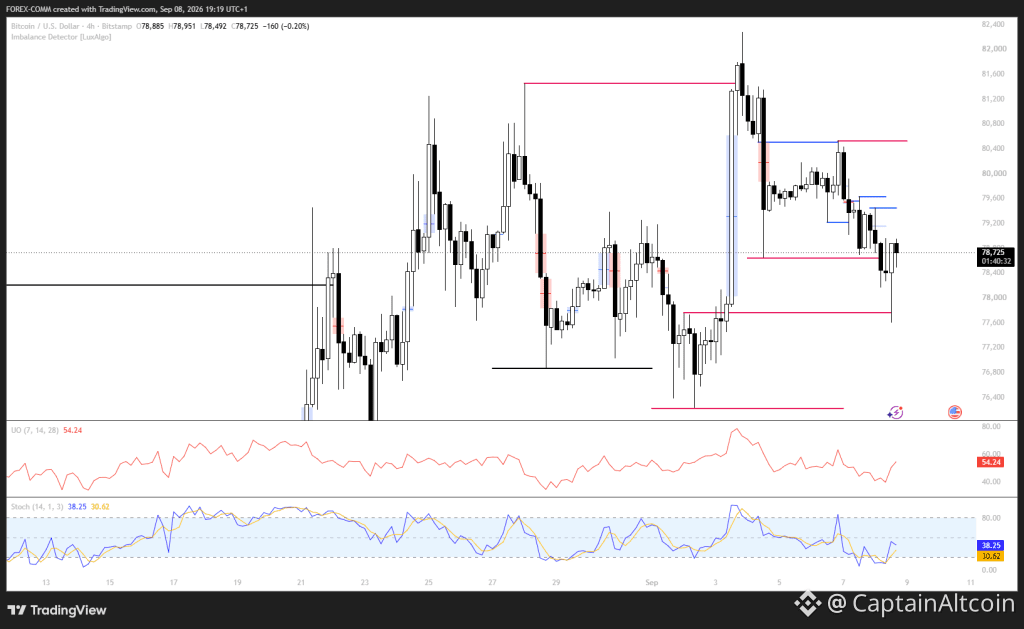
ලිපිය
පරිවර්තනය බලන්න
Bitcoin (BTC) Price Prediction for Today, September 9The Bitcoin price enters September 9 with bulls facing a familiar obstacle: $80,000. BTC is down 0.52% over 24 hours at $78,698.99 after failing to sustain a breakout above that barrier, with renewed macro uncertainty adding pressure.
The move also comes as Bitcoin’s seven-day correlation with gold reaches 73%, pointing to similar inflation-hedge positioning across both assets. Short-term holders’ unrealized profits have peaked and declined, adding another warning for buyers after BTC slipped from the high-$79,000 to $80,000 area.
Still, the longer-term demand picture has support from Tether, which has directed up to 15% of operating profits into Bitcoin since May 2023. With the BTC price near $79,000 support, the key question is where the Bitcoin price goes next before another breakout attempt.
News That Could Move Bitcoin Price Today
Bitcoin’s network activity has delivered a notable data point ahead of September 9. Galaxy Research recorded 893,391 confirmed BTC transactions on September 6, putting that day above the 99th percentile of all historical Bitcoin on-chain activity. It was the fourth-highest daily transaction count in Bitcoin’s history, showing that network usage has been unusually heavy even as the Bitcoin price struggles beneath $80,000.
The transaction count needs some context, however. Most of those transfers were small, low-fee transactions, meaning the record number does not necessarily indicate that an enormous amount of capital moved on-chain. For the Bitcoin price, the more useful metric from here may be whether transaction values and fee activity increase alongside the elevated transaction count.
That network activity comes at a time when ETF demand remains strong, creating an interesting contrast. The Bitcoin price is trading below major resistance despite heavy on-chain usage and institutional demand. The next data point to watch is therefore the composition of transactions and fee trends. If higher-value transfers and fees begin rising with activity, it would provide stronger evidence of economic demand for the network.
Macro data also has the potential to determine today’s direction. The calendar includes ADP Weekly Employment Change at 11.8K, a 10-year Treasury bond auction at 4.68 with a 2.5 bid-to-cover figure, and the API Weekly Statistical Bulletin later in the day. Employment figures and Treasury demand can influence yields and liquidity expectations, giving traders another reason to watch the Bitcoin price around the $79,000 area.
What Is the Bitcoin Chart Showing Today?
We had a look at the chart, and the structure remains cautious after the failed move above $80,000. The Bitcoin price pushed above $81,500 and briefly reached the $82,000–$82,400 region before sellers took control.
The subsequent decline produced lower highs, with price moving through $80,400, $79,600 and then toward the current $78,725 area shown on the chart. This creates a clear resistance ladder that buyers must reclaim before another test of the September high.
Source: Tradingview.com
The first area to watch is $79,200–$79,600. The chart shows several blue resistance levels in this region, making it the immediate barrier for a recovery. Above that zone, $80,400 becomes the next major objective, followed by the red resistance around $81,500. A break above $81,500 would reopen the path toward the recent high near $82,400.
Momentum indicators are showing some room for recovery but have not confirmed a bullish breakout. The Ultimate Oscillator reads 54.24, above its midpoint of 50, giving buyers a modest advantage.
The Stochastic indicator has %K at 38.25 and %D at 30.62, meaning short-term momentum is recovering from lower levels. That recovery could support a move back toward $79,600, but Bitcoin still needs price confirmation above the resistance zones.
Support is concentrated around $78,400, followed by the $77,600–$77,800 region marked on the chart. A deeper decline would expose the $76,800 area, which has acted as an important reaction zone during the displayed period. As long as Bitcoin holds above these levels, buyers have room to attempt another recovery. Losing $76,800 would weaken the near-term structure considerably.
Related Bitcoin News: Bitcoin Price Has 85 Days Before This Historic Buying Window Closes
Where Will BTC Price Go Today?
Bullish Path: $80,400–$81,500
The bullish Bitcoin price scenario starts with a recovery above $79,600. If buyers clear that resistance, BTC could target $80,400, followed by $81,500. A break above $81,500 would put the recent $82,400 high within reach. The UO reading of 54.24 and recovering Stochastic readings give this scenario some technical support.
Bearish Path: $77,600–$76,800
A failure to reclaim $79,200–$79,600 could keep sellers in control. If BTC breaks below $78,400, the next target is around $77,600, with $76,800 as the deeper support. Losing $76,800 would create room toward the lower $76,000–$77,000 support zone identified in the broader market setup.
Likely Path: $78,400–$80,000
The most balanced scenario for September 9 is consolidation between $78,400 and $80,000 as Bitcoin attempts to recover from the failed breakout. The key trigger remains $79,600: reclaiming it would improve the case for $80,400, whereas a break below $78,400 would increase the probability of $77,600 and $76,800.
However, tether’s estimated 83,000–100,000 BTC treasury, worth more than $8 billion, provides a notable institutional demand backdrop, but today’s Bitcoin price is still likely to respond first to resistance, liquidity and macro data.
Frequently Asked Questions
What is the Bitcoin price prediction for September 9
Bitcoin could trade between $78,400 and $80,000 if the market remains range-bound. A break above $79,600 could open targets at $80,400 and $81,500, while losing $78,400 could send BTC toward $77,600 and $76,800.
Can Bitcoin reach $82,000 today
Yes, but BTC would first need to reclaim the $79,600 and $80,400 resistance levels. A sustained break above $81,500 could then put the recent high near $82,400 within reach.
Why is Bitcoin network activity so high
Bitcoin processed 893,391 confirmed transactions on September 6, its fourth-highest daily total ever and above the 99th percentile of historical activity. Most transfers were small and low-fee, so the high transaction count indicates heavy network usage but does not necessarily mean large amounts of capital moved on-chain.
Subscribe to our YouTube channel for daily crypto updates, market insights, and expert analysis.
The post Bitcoin (BTC) Price Prediction for Today, September 9 appeared first on CaptainAltcoin.
Bitcoin (BTC) Price Prediction for Today, September 9
The Bitcoin price enters September 9 with bulls facing a familiar obstacle: $80,000. BTC is down 0.52% over 24 hours at $78,698.99 after failing to sustain a breakout above that barrier, with renewed macro uncertainty adding pressure.
The move also comes as Bitcoin’s seven-day correlation with gold reaches 73%, pointing to similar inflation-hedge positioning across both assets. Short-term holders’ unrealized profits have peaked and declined, adding another warning for buyers after BTC slipped from the high-$79,000 to $80,000 area.
Still, the longer-term demand picture has support from Tether, which has directed up to 15% of operating profits into Bitcoin since May 2023. With the BTC price near $79,000 support, the key question is where the Bitcoin price goes next before another breakout attempt.
News That Could Move Bitcoin Price Today
Bitcoin’s network activity has delivered a notable data point ahead of September 9. Galaxy Research recorded 893,391 confirmed BTC transactions on September 6, putting that day above the 99th percentile of all historical Bitcoin on-chain activity. It was the fourth-highest daily transaction count in Bitcoin’s history, showing that network usage has been unusually heavy even as the Bitcoin price struggles beneath $80,000.
The transaction count needs some context, however. Most of those transfers were small, low-fee transactions, meaning the record number does not necessarily indicate that an enormous amount of capital moved on-chain. For the Bitcoin price, the more useful metric from here may be whether transaction values and fee activity increase alongside the elevated transaction count.
That network activity comes at a time when ETF demand remains strong, creating an interesting contrast. The Bitcoin price is trading below major resistance despite heavy on-chain usage and institutional demand. The next data point to watch is therefore the composition of transactions and fee trends. If higher-value transfers and fees begin rising with activity, it would provide stronger evidence of economic demand for the network.
Macro data also has the potential to determine today’s direction. The calendar includes ADP Weekly Employment Change at 11.8K, a 10-year Treasury bond auction at 4.68 with a 2.5 bid-to-cover figure, and the API Weekly Statistical Bulletin later in the day. Employment figures and Treasury demand can influence yields and liquidity expectations, giving traders another reason to watch the Bitcoin price around the $79,000 area.
What Is the Bitcoin Chart Showing Today?
We had a look at the chart, and the structure remains cautious after the failed move above $80,000. The Bitcoin price pushed above $81,500 and briefly reached the $82,000–$82,400 region before sellers took control.
The subsequent decline produced lower highs, with price moving through $80,400, $79,600 and then toward the current $78,725 area shown on the chart. This creates a clear resistance ladder that buyers must reclaim before another test of the September high.
Source: Tradingview.com
The first area to watch is $79,200–$79,600. The chart shows several blue resistance levels in this region, making it the immediate barrier for a recovery. Above that zone, $80,400 becomes the next major objective, followed by the red resistance around $81,500. A break above $81,500 would reopen the path toward the recent high near $82,400.
Momentum indicators are showing some room for recovery but have not confirmed a bullish breakout. The Ultimate Oscillator reads 54.24, above its midpoint of 50, giving buyers a modest advantage.
The Stochastic indicator has %K at 38.25 and %D at 30.62, meaning short-term momentum is recovering from lower levels. That recovery could support a move back toward $79,600, but Bitcoin still needs price confirmation above the resistance zones.
Support is concentrated around $78,400, followed by the $77,600–$77,800 region marked on the chart. A deeper decline would expose the $76,800 area, which has acted as an important reaction zone during the displayed period. As long as Bitcoin holds above these levels, buyers have room to attempt another recovery. Losing $76,800 would weaken the near-term structure considerably.
Related Bitcoin News: Bitcoin Price Has 85 Days Before This Historic Buying Window Closes
Where Will BTC Price Go Today?
Bullish Path: $80,400–$81,500
The bullish Bitcoin price scenario starts with a recovery above $79,600. If buyers clear that resistance, BTC could target $80,400, followed by $81,500. A break above $81,500 would put the recent $82,400 high within reach. The UO reading of 54.24 and recovering Stochastic readings give this scenario some technical support.
Bearish Path: $77,600–$76,800
A failure to reclaim $79,200–$79,600 could keep sellers in control. If BTC breaks below $78,400, the next target is around $77,600, with $76,800 as the deeper support. Losing $76,800 would create room toward the lower $76,000–$77,000 support zone identified in the broader market setup.
Likely Path: $78,400–$80,000
The most balanced scenario for September 9 is consolidation between $78,400 and $80,000 as Bitcoin attempts to recover from the failed breakout. The key trigger remains $79,600: reclaiming it would improve the case for $80,400, whereas a break below $78,400 would increase the probability of $77,600 and $76,800.
However, tether’s estimated 83,000–100,000 BTC treasury, worth more than $8 billion, provides a notable institutional demand backdrop, but today’s Bitcoin price is still likely to respond first to resistance, liquidity and macro data.
Frequently Asked Questions
What is the Bitcoin price prediction for September 9
Bitcoin could trade between $78,400 and $80,000 if the market remains range-bound. A break above $79,600 could open targets at $80,400 and $81,500, while losing $78,400 could send BTC toward $77,600 and $76,800.
Can Bitcoin reach $82,000 today
Yes, but BTC would first need to reclaim the $79,600 and $80,400 resistance levels. A sustained break above $81,500 could then put the recent high near $82,400 within reach.
Why is Bitcoin network activity so high
Bitcoin processed 893,391 confirmed transactions on September 6, its fourth-highest daily total ever and above the 99th percentile of historical activity. Most transfers were small and low-fee, so the high transaction count indicates heavy network usage but does not necessarily mean large amounts of capital moved on-chain.
Subscribe to our YouTube channel for daily crypto updates, market insights, and expert analysis.
The post Bitcoin (BTC) Price Prediction for Today, September 9 appeared first on CaptainAltcoin.
The move also comes as Bitcoin’s seven-day correlation with gold reaches 73%, pointing to similar inflation-hedge positioning across both assets. Short-term holders’ unrealized profits have peaked and declined, adding another warning for buyers after BTC slipped from the high-$79,000 to $80,000 area.
Still, the longer-term demand picture has support from Tether, which has directed up to 15% of operating profits into Bitcoin since May 2023. With the BTC price near $79,000 support, the key question is where the Bitcoin price goes next before another breakout attempt.
News That Could Move Bitcoin Price Today
Bitcoin’s network activity has delivered a notable data point ahead of September 9. Galaxy Research recorded 893,391 confirmed BTC transactions on September 6, putting that day above the 99th percentile of all historical Bitcoin on-chain activity. It was the fourth-highest daily transaction count in Bitcoin’s history, showing that network usage has been unusually heavy even as the Bitcoin price struggles beneath $80,000.
The transaction count needs some context, however. Most of those transfers were small, low-fee transactions, meaning the record number does not necessarily indicate that an enormous amount of capital moved on-chain. For the Bitcoin price, the more useful metric from here may be whether transaction values and fee activity increase alongside the elevated transaction count.
That network activity comes at a time when ETF demand remains strong, creating an interesting contrast. The Bitcoin price is trading below major resistance despite heavy on-chain usage and institutional demand. The next data point to watch is therefore the composition of transactions and fee trends. If higher-value transfers and fees begin rising with activity, it would provide stronger evidence of economic demand for the network.
Macro data also has the potential to determine today’s direction. The calendar includes ADP Weekly Employment Change at 11.8K, a 10-year Treasury bond auction at 4.68 with a 2.5 bid-to-cover figure, and the API Weekly Statistical Bulletin later in the day. Employment figures and Treasury demand can influence yields and liquidity expectations, giving traders another reason to watch the Bitcoin price around the $79,000 area.
What Is the Bitcoin Chart Showing Today?
We had a look at the chart, and the structure remains cautious after the failed move above $80,000. The Bitcoin price pushed above $81,500 and briefly reached the $82,000–$82,400 region before sellers took control.
The subsequent decline produced lower highs, with price moving through $80,400, $79,600 and then toward the current $78,725 area shown on the chart. This creates a clear resistance ladder that buyers must reclaim before another test of the September high.
Source: Tradingview.com
The first area to watch is $79,200–$79,600. The chart shows several blue resistance levels in this region, making it the immediate barrier for a recovery. Above that zone, $80,400 becomes the next major objective, followed by the red resistance around $81,500. A break above $81,500 would reopen the path toward the recent high near $82,400.
Momentum indicators are showing some room for recovery but have not confirmed a bullish breakout. The Ultimate Oscillator reads 54.24, above its midpoint of 50, giving buyers a modest advantage.
The Stochastic indicator has %K at 38.25 and %D at 30.62, meaning short-term momentum is recovering from lower levels. That recovery could support a move back toward $79,600, but Bitcoin still needs price confirmation above the resistance zones.
Support is concentrated around $78,400, followed by the $77,600–$77,800 region marked on the chart. A deeper decline would expose the $76,800 area, which has acted as an important reaction zone during the displayed period. As long as Bitcoin holds above these levels, buyers have room to attempt another recovery. Losing $76,800 would weaken the near-term structure considerably.
Related Bitcoin News: Bitcoin Price Has 85 Days Before This Historic Buying Window Closes
Where Will BTC Price Go Today?
Bullish Path: $80,400–$81,500
The bullish Bitcoin price scenario starts with a recovery above $79,600. If buyers clear that resistance, BTC could target $80,400, followed by $81,500. A break above $81,500 would put the recent $82,400 high within reach. The UO reading of 54.24 and recovering Stochastic readings give this scenario some technical support.
Bearish Path: $77,600–$76,800
A failure to reclaim $79,200–$79,600 could keep sellers in control. If BTC breaks below $78,400, the next target is around $77,600, with $76,800 as the deeper support. Losing $76,800 would create room toward the lower $76,000–$77,000 support zone identified in the broader market setup.
Likely Path: $78,400–$80,000
The most balanced scenario for September 9 is consolidation between $78,400 and $80,000 as Bitcoin attempts to recover from the failed breakout. The key trigger remains $79,600: reclaiming it would improve the case for $80,400, whereas a break below $78,400 would increase the probability of $77,600 and $76,800.
However, tether’s estimated 83,000–100,000 BTC treasury, worth more than $8 billion, provides a notable institutional demand backdrop, but today’s Bitcoin price is still likely to respond first to resistance, liquidity and macro data.
Frequently Asked Questions
What is the Bitcoin price prediction for September 9
Bitcoin could trade between $78,400 and $80,000 if the market remains range-bound. A break above $79,600 could open targets at $80,400 and $81,500, while losing $78,400 could send BTC toward $77,600 and $76,800.
Can Bitcoin reach $82,000 today
Yes, but BTC would first need to reclaim the $79,600 and $80,400 resistance levels. A sustained break above $81,500 could then put the recent high near $82,400 within reach.
Why is Bitcoin network activity so high
Bitcoin processed 893,391 confirmed transactions on September 6, its fourth-highest daily total ever and above the 99th percentile of historical activity. Most transfers were small and low-fee, so the high transaction count indicates heavy network usage but does not necessarily mean large amounts of capital moved on-chain.
Subscribe to our YouTube channel for daily crypto updates, market insights, and expert analysis.
The post Bitcoin (BTC) Price Prediction for Today, September 9 appeared first on CaptainAltcoin.
279
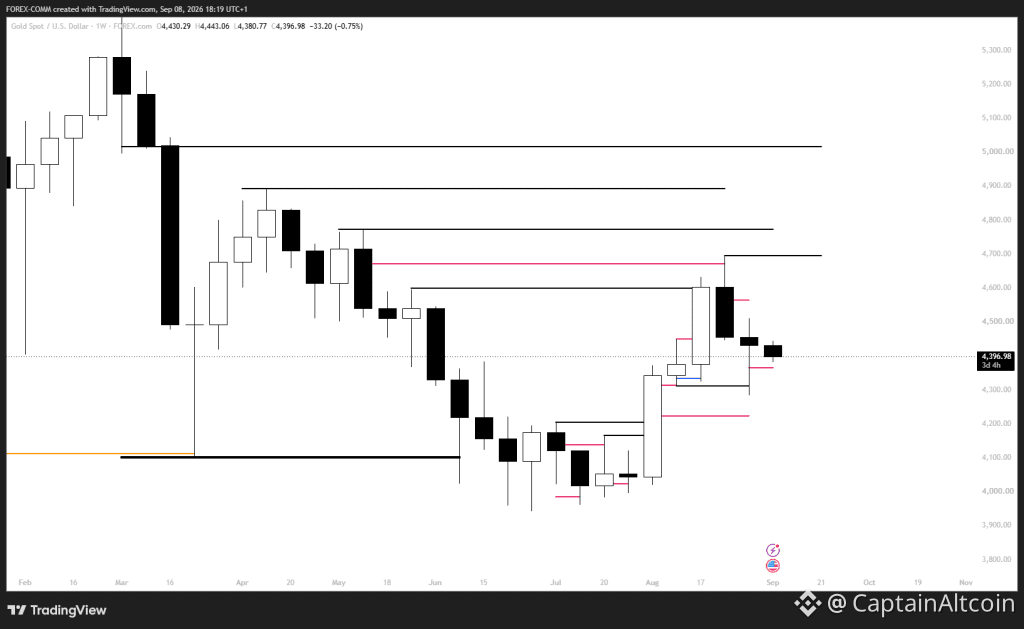
ලිපිය
පරිවර්තනය බලන්න
Gold Price Warning: This September Move Could Put $5,000 Back in PlayGold prices edged lower today as rising oil prices increased inflation concerns and strengthened expectations around a possible Federal Reserve rate hike in September. Spot gold fell 0.1% to $4,398.71 per ounce, according to the figures provided, with December U.S. gold futures down 0.7% at $4,443.60.
Oil prices also reached multi-week highs of $101 after attacks on Saudi energy facilities and fresh threats from Tehran, adding pressure to the inflation outlook. That leaves traders focused on upcoming U.S. inflation and employment data.
Yet the gold price has a technical setup worth watching. The chart shows the XAU/USD price testing a major rising trendline that extends from December 2024. If September brings a successful recovery above that trendline, analysts see an initial path toward $5,000.
Gold Price Tests a Major Trendline
We had a look at the chart, and the most important feature is the rising trendline that begins around December 2024 and connects several major price reactions through 2025 and 2026.
The gold price respected this line through multiple advances, making it an important structural level rather than a random support line.
After reaching a peak near $5,500, the gold price corrected toward the $4,000 area before recovering back toward the $4,400 region.
Gold continues to trade under a major rising trendline extending from December 2024. It needs to regain it during the month of September so initial move to $5k opens up… pic.twitter.com/SBqUG5neQH
— Rashad Hajiyev (@hajiyev_rashad) September 8, 2026
The latest move has brought XAU/USD directly into the area where the rising trendline meets the horizontal level around $4,400. The chart marks this meeting point with a circle, showing why September could become an important month for the gold price. A sustained move above the trendline would indicate that buyers have regained control of the broader structure. The first major objective would then be the $4,695.75 weekly level.
The bigger target comes from the sequence of weekly resistance levels. If $4,695.75 fails to contain buyers, the next objectives are $4,772, $4,890, and eventually $5,015. That makes the $5,000 area technically reachable if the gold price clears each resistance zone. However, failure to reclaim the rising trendline would weaken this setup and leave the $4,310–$4,365 area exposed.
News That Could Push Gold Price This Week
The U.S. economic calendar is packed with data capable of moving the gold price. The figures provided show Core PPI m/m at 0.3% versus 0.2% previously, PPI m/m at 0.4% versus 0.0%, and unemployment claims forecast at 205,000 versus 206,000 previously. Stronger producer-price readings could reinforce inflation concerns and make rate cuts harder to price, creating pressure on gold through higher yields and a stronger dollar.
Consumer inflation will be even more important. Core CPI m/m is forecast at 0.2%, unchanged from the previous reading, and Core CPI y/y at 2.4% versus 2.5%. Headline CPI m/m is forecast at 0.4% versus 0.1%, with annual CPI at 3.4%. A softer inflation print could improve the case for easier monetary policy and support the gold price, especially if Treasury yields decline at the same time.
Employment data also matters because a weaker labor market could increase pressure on the Federal Reserve to support the economy. The calendar lists ADP Weekly Employment Change at 11.8K, alongside the unemployment-claims estimate. Consumer sentiment is forecast at 51.0, down from the revised 51.7, and one-year inflation expectations are listed at 4.0%. A combination of weaker employment and softer inflation would create a more favorable environment for gold.
Related Gold News: Gold Price Prediction As Central Banks Refuse to Stop Buying Gold
Our Gold Price Prediction: $5,000 Is Back in Play
The weekly setup gives the gold price a clear roadmap. XAU/USD reacted around the $4,310.45 weekly low, with $4,695.75 the first upside objective. If buyers clear that level, $4,772 becomes the next target, followed by $4,890.
Source: Tradingview.com
A break through all three levels would put $5,015 within reach, matching the $5,000 target highlighted by the chart structure.
There is also a shorter-term downside path. The gold price has reacted around the daily obstruction at $4,470.85, and failure to hold this area could send the XAU/USD price toward $4,365 as the next weekly buying zone.
If $4,365 fails, the next supports are $4,283 and $4,225. Therefore, September’s key battle is clear: reclaim the rising trendline and $4,470.85, and the gold price can target $4,695.75, $4,772, $4,890 and potentially $5,015. Lose the lower supports, and the $5,000 setup would need to wait.
Frequently Asked Questions
Can gold reach $5,000 in September
Yes. Based on the chart levels, XAU/USD could target $5,015 if it clears $4,695.75, then $4,772 and $4,890. A sustained recovery above the major rising trendline would strengthen the path toward $5,000.
What could push the gold price higher this week
Softer U.S. inflation and weaker employment data could support gold by reducing pressure for tighter Federal Reserve policy. The key releases include Core CPI at 0.2% m/m, Core CPI at 2.4% y/y, and unemployment claims forecast at 205,000.
What are the key support levels for gold
The main downside levels identified in the analysis are $4,365, $4,283 and $4,225. The gold price first needs to defend the $4,310.45 weekly low; losing these support zones would weaken the bullish case for a move toward $5,000.
Subscribe to our YouTube channel for daily crypto updates, market insights, and expert analysis.
The post Gold Price Warning: This September Move Could Put $5,000 Back in Play appeared first on CaptainAltcoin.
Gold Price Warning: This September Move Could Put $5,000 Back in Play
Gold prices edged lower today as rising oil prices increased inflation concerns and strengthened expectations around a possible Federal Reserve rate hike in September. Spot gold fell 0.1% to $4,398.71 per ounce, according to the figures provided, with December U.S. gold futures down 0.7% at $4,443.60.
Oil prices also reached multi-week highs of $101 after attacks on Saudi energy facilities and fresh threats from Tehran, adding pressure to the inflation outlook. That leaves traders focused on upcoming U.S. inflation and employment data.
Yet the gold price has a technical setup worth watching. The chart shows the XAU/USD price testing a major rising trendline that extends from December 2024. If September brings a successful recovery above that trendline, analysts see an initial path toward $5,000.
Gold Price Tests a Major Trendline
We had a look at the chart, and the most important feature is the rising trendline that begins around December 2024 and connects several major price reactions through 2025 and 2026.
The gold price respected this line through multiple advances, making it an important structural level rather than a random support line.
After reaching a peak near $5,500, the gold price corrected toward the $4,000 area before recovering back toward the $4,400 region.
Gold continues to trade under a major rising trendline extending from December 2024. It needs to regain it during the month of September so initial move to $5k opens up… pic.twitter.com/SBqUG5neQH
— Rashad Hajiyev (@hajiyev_rashad) September 8, 2026
The latest move has brought XAU/USD directly into the area where the rising trendline meets the horizontal level around $4,400. The chart marks this meeting point with a circle, showing why September could become an important month for the gold price. A sustained move above the trendline would indicate that buyers have regained control of the broader structure. The first major objective would then be the $4,695.75 weekly level.
The bigger target comes from the sequence of weekly resistance levels. If $4,695.75 fails to contain buyers, the next objectives are $4,772, $4,890, and eventually $5,015. That makes the $5,000 area technically reachable if the gold price clears each resistance zone. However, failure to reclaim the rising trendline would weaken this setup and leave the $4,310–$4,365 area exposed.
News That Could Push Gold Price This Week
The U.S. economic calendar is packed with data capable of moving the gold price. The figures provided show Core PPI m/m at 0.3% versus 0.2% previously, PPI m/m at 0.4% versus 0.0%, and unemployment claims forecast at 205,000 versus 206,000 previously. Stronger producer-price readings could reinforce inflation concerns and make rate cuts harder to price, creating pressure on gold through higher yields and a stronger dollar.
Consumer inflation will be even more important. Core CPI m/m is forecast at 0.2%, unchanged from the previous reading, and Core CPI y/y at 2.4% versus 2.5%. Headline CPI m/m is forecast at 0.4% versus 0.1%, with annual CPI at 3.4%. A softer inflation print could improve the case for easier monetary policy and support the gold price, especially if Treasury yields decline at the same time.
Employment data also matters because a weaker labor market could increase pressure on the Federal Reserve to support the economy. The calendar lists ADP Weekly Employment Change at 11.8K, alongside the unemployment-claims estimate. Consumer sentiment is forecast at 51.0, down from the revised 51.7, and one-year inflation expectations are listed at 4.0%. A combination of weaker employment and softer inflation would create a more favorable environment for gold.
Related Gold News: Gold Price Prediction As Central Banks Refuse to Stop Buying Gold
Our Gold Price Prediction: $5,000 Is Back in Play
The weekly setup gives the gold price a clear roadmap. XAU/USD reacted around the $4,310.45 weekly low, with $4,695.75 the first upside objective. If buyers clear that level, $4,772 becomes the next target, followed by $4,890.
Source: Tradingview.com
A break through all three levels would put $5,015 within reach, matching the $5,000 target highlighted by the chart structure.
There is also a shorter-term downside path. The gold price has reacted around the daily obstruction at $4,470.85, and failure to hold this area could send the XAU/USD price toward $4,365 as the next weekly buying zone.
If $4,365 fails, the next supports are $4,283 and $4,225. Therefore, September’s key battle is clear: reclaim the rising trendline and $4,470.85, and the gold price can target $4,695.75, $4,772, $4,890 and potentially $5,015. Lose the lower supports, and the $5,000 setup would need to wait.
Frequently Asked Questions
Can gold reach $5,000 in September
Yes. Based on the chart levels, XAU/USD could target $5,015 if it clears $4,695.75, then $4,772 and $4,890. A sustained recovery above the major rising trendline would strengthen the path toward $5,000.
What could push the gold price higher this week
Softer U.S. inflation and weaker employment data could support gold by reducing pressure for tighter Federal Reserve policy. The key releases include Core CPI at 0.2% m/m, Core CPI at 2.4% y/y, and unemployment claims forecast at 205,000.
What are the key support levels for gold
The main downside levels identified in the analysis are $4,365, $4,283 and $4,225. The gold price first needs to defend the $4,310.45 weekly low; losing these support zones would weaken the bullish case for a move toward $5,000.
Subscribe to our YouTube channel for daily crypto updates, market insights, and expert analysis.
The post Gold Price Warning: This September Move Could Put $5,000 Back in Play appeared first on CaptainAltcoin.
Oil prices also reached multi-week highs of $101 after attacks on Saudi energy facilities and fresh threats from Tehran, adding pressure to the inflation outlook. That leaves traders focused on upcoming U.S. inflation and employment data.
Yet the gold price has a technical setup worth watching. The chart shows the XAU/USD price testing a major rising trendline that extends from December 2024. If September brings a successful recovery above that trendline, analysts see an initial path toward $5,000.
Gold Price Tests a Major Trendline
We had a look at the chart, and the most important feature is the rising trendline that begins around December 2024 and connects several major price reactions through 2025 and 2026.
The gold price respected this line through multiple advances, making it an important structural level rather than a random support line.
After reaching a peak near $5,500, the gold price corrected toward the $4,000 area before recovering back toward the $4,400 region.
Gold continues to trade under a major rising trendline extending from December 2024. It needs to regain it during the month of September so initial move to $5k opens up… pic.twitter.com/SBqUG5neQH
— Rashad Hajiyev (@hajiyev_rashad) September 8, 2026
The latest move has brought XAU/USD directly into the area where the rising trendline meets the horizontal level around $4,400. The chart marks this meeting point with a circle, showing why September could become an important month for the gold price. A sustained move above the trendline would indicate that buyers have regained control of the broader structure. The first major objective would then be the $4,695.75 weekly level.
The bigger target comes from the sequence of weekly resistance levels. If $4,695.75 fails to contain buyers, the next objectives are $4,772, $4,890, and eventually $5,015. That makes the $5,000 area technically reachable if the gold price clears each resistance zone. However, failure to reclaim the rising trendline would weaken this setup and leave the $4,310–$4,365 area exposed.
News That Could Push Gold Price This Week
The U.S. economic calendar is packed with data capable of moving the gold price. The figures provided show Core PPI m/m at 0.3% versus 0.2% previously, PPI m/m at 0.4% versus 0.0%, and unemployment claims forecast at 205,000 versus 206,000 previously. Stronger producer-price readings could reinforce inflation concerns and make rate cuts harder to price, creating pressure on gold through higher yields and a stronger dollar.
Consumer inflation will be even more important. Core CPI m/m is forecast at 0.2%, unchanged from the previous reading, and Core CPI y/y at 2.4% versus 2.5%. Headline CPI m/m is forecast at 0.4% versus 0.1%, with annual CPI at 3.4%. A softer inflation print could improve the case for easier monetary policy and support the gold price, especially if Treasury yields decline at the same time.
Employment data also matters because a weaker labor market could increase pressure on the Federal Reserve to support the economy. The calendar lists ADP Weekly Employment Change at 11.8K, alongside the unemployment-claims estimate. Consumer sentiment is forecast at 51.0, down from the revised 51.7, and one-year inflation expectations are listed at 4.0%. A combination of weaker employment and softer inflation would create a more favorable environment for gold.
Related Gold News: Gold Price Prediction As Central Banks Refuse to Stop Buying Gold
Our Gold Price Prediction: $5,000 Is Back in Play
The weekly setup gives the gold price a clear roadmap. XAU/USD reacted around the $4,310.45 weekly low, with $4,695.75 the first upside objective. If buyers clear that level, $4,772 becomes the next target, followed by $4,890.
Source: Tradingview.com
A break through all three levels would put $5,015 within reach, matching the $5,000 target highlighted by the chart structure.
There is also a shorter-term downside path. The gold price has reacted around the daily obstruction at $4,470.85, and failure to hold this area could send the XAU/USD price toward $4,365 as the next weekly buying zone.
If $4,365 fails, the next supports are $4,283 and $4,225. Therefore, September’s key battle is clear: reclaim the rising trendline and $4,470.85, and the gold price can target $4,695.75, $4,772, $4,890 and potentially $5,015. Lose the lower supports, and the $5,000 setup would need to wait.
Frequently Asked Questions
Can gold reach $5,000 in September
Yes. Based on the chart levels, XAU/USD could target $5,015 if it clears $4,695.75, then $4,772 and $4,890. A sustained recovery above the major rising trendline would strengthen the path toward $5,000.
What could push the gold price higher this week
Softer U.S. inflation and weaker employment data could support gold by reducing pressure for tighter Federal Reserve policy. The key releases include Core CPI at 0.2% m/m, Core CPI at 2.4% y/y, and unemployment claims forecast at 205,000.
What are the key support levels for gold
The main downside levels identified in the analysis are $4,365, $4,283 and $4,225. The gold price first needs to defend the $4,310.45 weekly low; losing these support zones would weaken the bullish case for a move toward $5,000.
Subscribe to our YouTube channel for daily crypto updates, market insights, and expert analysis.
The post Gold Price Warning: This September Move Could Put $5,000 Back in Play appeared first on CaptainAltcoin.
1
267
පරිවර්තනය බලන්න
Why Is “OG” VeChain (VET) Coin Price Up Right Now?VeChain is suddenly back on crypto traders’ radar. The long-running altcoin has pumped roughly 10% today, with VET trading around $0.007919, as attention returns to a project that has survived several crypto market cycles.
The clearest catalyst is VeChainThor’s upcoming Interstellar upgrade, scheduled for September 16. The protocol update, formally known as VIP-255, packages 11 Ethereum Improvement Proposals into one upgrade and brings VeChainThor closer to the standards introduced across Ethereum’s Cancun, Prague and Osaka releases.
Trading activity has accelerated alongside the rally, with the reported 24-hour volume increase pointing to considerably stronger speculative interest ahead of the upgrade. VET has already seen several bursts of buying in recent weeks as traders position around the September 16 catalyst.
Interstellar Is Putting VeChain Back in the Spotlight
Interstellar is the third major stage of VeChain’s broader Renaissance roadmap, and its importance goes beyond simply adding another network upgrade.
VIP-255 introduces newer EVM functionality, additional cryptographic capabilities and closer compatibility with Ethereum’s development ecosystem. Among the changes are transient storage through EIP-1153, MCOPY through EIP-5656 and additional cryptographic precompiles.
The bigger objective is straightforward: make it easier for developers accustomed to Ethereum infrastructure to work with VeChainThor.
'Interstellar' is a bold name for a protocol upgrade until you check what's inside: 11 EIPs bundled into one, live Sept 16. VeChainThor quietly closing the gap with Ethereum tooling while everyone's still asking 'wen update' #VeChain $VET https://t.co/NRIG3h0Xme
— FrienDowJones Ⓥ (@ValuableTX) September 8, 2026
That could reduce one of the barriers facing VeChain. A blockchain can have enterprise relationships and functioning infrastructure, but attracting developers becomes considerably harder when tooling differs substantially from the ecosystem where most EVM developers already operate.
Interstellar attempts to narrow that gap.
The upgrade has already passed VeChain’s governance process and is expected to activate at approximately block 25,902,540 on September 16.
The important distinction is that better technology doesn’t automatically produce more applications or users. Interstellar gives developers more capable and familiar infrastructure. Whether they actually build on it will become the more important question after September 16.
VeChain Is a Very Different Network Than It Used to Be
Part of the renewed VET narrative comes from changes that have already happened.
One community member described VeChain as an “OG” coin that the market has largely forgotten. That’s understandable. The project dates back to 2015, long before the current wave of DeFi, NFTs and AI-related crypto projects.
Its original story centered heavily on enterprise blockchain applications, supply chains, IoT and real-world adoption.
But VeChainThor’s architecture has undergone meaningful changes.
$VET — VECHAIN This is one of those OG coins the market basically forgot about. VeChain has been building since 2015. Before DeFi. Before NFTs. Before AI. Before most of the bullshit we trade today. And the original thesis was always: Real-World Adoption × Supply Chain ×… pic.twitter.com/mrYg5ihgl6
— Jus7Degen (@Jus7Degen) September 8, 2026
The previous Hayabusa upgrade moved VeChainThor to Delegated Proof of Stake, with validators producing blocks and VET holders able to participate through staking and delegation. VeChain’s Stargate system allows users to stake VET, receive staking NFTs and delegate them to validators while earning VTHO rewards.
That changes the role of VET within the network.
Rather than simply holding the asset, participants can now use VET to help secure VeChainThor and receive protocol rewards.
VeChain also redesigned the economics surrounding VTHO, the token used to pay for transactions. Under the new framework, 100% of transaction fees are burned, while VTHO generation is concentrated among VET actively staked through Stargate. VeChain said the redesigned structure could reduce VTHO inflation by as much as 72.2%.
The intended economic loop therefore looks something like this:
Stake VET → Secure VeChainThor → Earn VTHO → Network activity consumes VTHO → Transaction fees are burned
That doesn’t guarantee higher VET prices. It does, however, give the network a more explicit relationship between staking, security and transaction activity than its older model provided.
VET’s Supply Structure Could Also Matter
There’s another characteristic attracting attention: most of VET’s eventual supply is already circulating.
Current estimates put circulating supply around 86 billion VET against a maximum supply of roughly 86.7 billion, leaving the token close to fully diluted. VET also remains approximately 97% below its 2021 all-time high.
That makes VeChain different from newer tokens where only a small portion of supply is circulating and large future unlocks can create substantial dilution.
It doesn’t make VET automatically undervalued. A token can be almost completely diluted and still struggle if demand remains weak.
But it removes one question from the equation: there isn’t an enormous multiple between VeChain’s current market capitalization and its fully diluted valuation.
For traders searching for older altcoins that haven’t participated fully in the latest market cycle, that characteristic can make VET more interesting.
For more crypto news and price predictions, click here.
Subscribe to our YouTube channel for daily crypto updates, market insights, and expert analysis.
The post Why Is “OG” VeChain (VET) Coin Price Up Right Now? appeared first on CaptainAltcoin.
Why Is “OG” VeChain (VET) Coin Price Up Right Now?
VeChain is suddenly back on crypto traders’ radar. The long-running altcoin has pumped roughly 10% today, with VET trading around $0.007919, as attention returns to a project that has survived several crypto market cycles.
The clearest catalyst is VeChainThor’s upcoming Interstellar upgrade, scheduled for September 16. The protocol update, formally known as VIP-255, packages 11 Ethereum Improvement Proposals into one upgrade and brings VeChainThor closer to the standards introduced across Ethereum’s Cancun, Prague and Osaka releases.
Trading activity has accelerated alongside the rally, with the reported 24-hour volume increase pointing to considerably stronger speculative interest ahead of the upgrade. VET has already seen several bursts of buying in recent weeks as traders position around the September 16 catalyst.
Interstellar Is Putting VeChain Back in the Spotlight
Interstellar is the third major stage of VeChain’s broader Renaissance roadmap, and its importance goes beyond simply adding another network upgrade.
VIP-255 introduces newer EVM functionality, additional cryptographic capabilities and closer compatibility with Ethereum’s development ecosystem. Among the changes are transient storage through EIP-1153, MCOPY through EIP-5656 and additional cryptographic precompiles.
The bigger objective is straightforward: make it easier for developers accustomed to Ethereum infrastructure to work with VeChainThor.
'Interstellar' is a bold name for a protocol upgrade until you check what's inside: 11 EIPs bundled into one, live Sept 16. VeChainThor quietly closing the gap with Ethereum tooling while everyone's still asking 'wen update' #VeChain $VET https://t.co/NRIG3h0Xme
— FrienDowJones Ⓥ (@ValuableTX) September 8, 2026
That could reduce one of the barriers facing VeChain. A blockchain can have enterprise relationships and functioning infrastructure, but attracting developers becomes considerably harder when tooling differs substantially from the ecosystem where most EVM developers already operate.
Interstellar attempts to narrow that gap.
The upgrade has already passed VeChain’s governance process and is expected to activate at approximately block 25,902,540 on September 16.
The important distinction is that better technology doesn’t automatically produce more applications or users. Interstellar gives developers more capable and familiar infrastructure. Whether they actually build on it will become the more important question after September 16.
VeChain Is a Very Different Network Than It Used to Be
Part of the renewed VET narrative comes from changes that have already happened.
One community member described VeChain as an “OG” coin that the market has largely forgotten. That’s understandable. The project dates back to 2015, long before the current wave of DeFi, NFTs and AI-related crypto projects.
Its original story centered heavily on enterprise blockchain applications, supply chains, IoT and real-world adoption.
But VeChainThor’s architecture has undergone meaningful changes.
$VET — VECHAIN This is one of those OG coins the market basically forgot about. VeChain has been building since 2015. Before DeFi. Before NFTs. Before AI. Before most of the bullshit we trade today. And the original thesis was always: Real-World Adoption × Supply Chain ×… pic.twitter.com/mrYg5ihgl6
— Jus7Degen (@Jus7Degen) September 8, 2026
The previous Hayabusa upgrade moved VeChainThor to Delegated Proof of Stake, with validators producing blocks and VET holders able to participate through staking and delegation. VeChain’s Stargate system allows users to stake VET, receive staking NFTs and delegate them to validators while earning VTHO rewards.
That changes the role of VET within the network.
Rather than simply holding the asset, participants can now use VET to help secure VeChainThor and receive protocol rewards.
VeChain also redesigned the economics surrounding VTHO, the token used to pay for transactions. Under the new framework, 100% of transaction fees are burned, while VTHO generation is concentrated among VET actively staked through Stargate. VeChain said the redesigned structure could reduce VTHO inflation by as much as 72.2%.
The intended economic loop therefore looks something like this:
Stake VET → Secure VeChainThor → Earn VTHO → Network activity consumes VTHO → Transaction fees are burned
That doesn’t guarantee higher VET prices. It does, however, give the network a more explicit relationship between staking, security and transaction activity than its older model provided.
VET’s Supply Structure Could Also Matter
There’s another characteristic attracting attention: most of VET’s eventual supply is already circulating.
Current estimates put circulating supply around 86 billion VET against a maximum supply of roughly 86.7 billion, leaving the token close to fully diluted. VET also remains approximately 97% below its 2021 all-time high.
That makes VeChain different from newer tokens where only a small portion of supply is circulating and large future unlocks can create substantial dilution.
It doesn’t make VET automatically undervalued. A token can be almost completely diluted and still struggle if demand remains weak.
But it removes one question from the equation: there isn’t an enormous multiple between VeChain’s current market capitalization and its fully diluted valuation.
For traders searching for older altcoins that haven’t participated fully in the latest market cycle, that characteristic can make VET more interesting.
For more crypto news and price predictions, click here.
Subscribe to our YouTube channel for daily crypto updates, market insights, and expert analysis.
The post Why Is “OG” VeChain (VET) Coin Price Up Right Now? appeared first on CaptainAltcoin.
The clearest catalyst is VeChainThor’s upcoming Interstellar upgrade, scheduled for September 16. The protocol update, formally known as VIP-255, packages 11 Ethereum Improvement Proposals into one upgrade and brings VeChainThor closer to the standards introduced across Ethereum’s Cancun, Prague and Osaka releases.
Trading activity has accelerated alongside the rally, with the reported 24-hour volume increase pointing to considerably stronger speculative interest ahead of the upgrade. VET has already seen several bursts of buying in recent weeks as traders position around the September 16 catalyst.
Interstellar Is Putting VeChain Back in the Spotlight
Interstellar is the third major stage of VeChain’s broader Renaissance roadmap, and its importance goes beyond simply adding another network upgrade.
VIP-255 introduces newer EVM functionality, additional cryptographic capabilities and closer compatibility with Ethereum’s development ecosystem. Among the changes are transient storage through EIP-1153, MCOPY through EIP-5656 and additional cryptographic precompiles.
The bigger objective is straightforward: make it easier for developers accustomed to Ethereum infrastructure to work with VeChainThor.
'Interstellar' is a bold name for a protocol upgrade until you check what's inside: 11 EIPs bundled into one, live Sept 16. VeChainThor quietly closing the gap with Ethereum tooling while everyone's still asking 'wen update' #VeChain $VET https://t.co/NRIG3h0Xme
— FrienDowJones Ⓥ (@ValuableTX) September 8, 2026
That could reduce one of the barriers facing VeChain. A blockchain can have enterprise relationships and functioning infrastructure, but attracting developers becomes considerably harder when tooling differs substantially from the ecosystem where most EVM developers already operate.
Interstellar attempts to narrow that gap.
The upgrade has already passed VeChain’s governance process and is expected to activate at approximately block 25,902,540 on September 16.
The important distinction is that better technology doesn’t automatically produce more applications or users. Interstellar gives developers more capable and familiar infrastructure. Whether they actually build on it will become the more important question after September 16.
VeChain Is a Very Different Network Than It Used to Be
Part of the renewed VET narrative comes from changes that have already happened.
One community member described VeChain as an “OG” coin that the market has largely forgotten. That’s understandable. The project dates back to 2015, long before the current wave of DeFi, NFTs and AI-related crypto projects.
Its original story centered heavily on enterprise blockchain applications, supply chains, IoT and real-world adoption.
But VeChainThor’s architecture has undergone meaningful changes.
$VET — VECHAIN This is one of those OG coins the market basically forgot about. VeChain has been building since 2015. Before DeFi. Before NFTs. Before AI. Before most of the bullshit we trade today. And the original thesis was always: Real-World Adoption × Supply Chain ×… pic.twitter.com/mrYg5ihgl6
— Jus7Degen (@Jus7Degen) September 8, 2026
The previous Hayabusa upgrade moved VeChainThor to Delegated Proof of Stake, with validators producing blocks and VET holders able to participate through staking and delegation. VeChain’s Stargate system allows users to stake VET, receive staking NFTs and delegate them to validators while earning VTHO rewards.
That changes the role of VET within the network.
Rather than simply holding the asset, participants can now use VET to help secure VeChainThor and receive protocol rewards.
VeChain also redesigned the economics surrounding VTHO, the token used to pay for transactions. Under the new framework, 100% of transaction fees are burned, while VTHO generation is concentrated among VET actively staked through Stargate. VeChain said the redesigned structure could reduce VTHO inflation by as much as 72.2%.
The intended economic loop therefore looks something like this:
Stake VET → Secure VeChainThor → Earn VTHO → Network activity consumes VTHO → Transaction fees are burned
That doesn’t guarantee higher VET prices. It does, however, give the network a more explicit relationship between staking, security and transaction activity than its older model provided.
VET’s Supply Structure Could Also Matter
There’s another characteristic attracting attention: most of VET’s eventual supply is already circulating.
Current estimates put circulating supply around 86 billion VET against a maximum supply of roughly 86.7 billion, leaving the token close to fully diluted. VET also remains approximately 97% below its 2021 all-time high.
That makes VeChain different from newer tokens where only a small portion of supply is circulating and large future unlocks can create substantial dilution.
It doesn’t make VET automatically undervalued. A token can be almost completely diluted and still struggle if demand remains weak.
But it removes one question from the equation: there isn’t an enormous multiple between VeChain’s current market capitalization and its fully diluted valuation.
For traders searching for older altcoins that haven’t participated fully in the latest market cycle, that characteristic can make VET more interesting.
For more crypto news and price predictions, click here.
Subscribe to our YouTube channel for daily crypto updates, market insights, and expert analysis.
The post Why Is “OG” VeChain (VET) Coin Price Up Right Now? appeared first on CaptainAltcoin.
173
පරිවර්තනය බලන්න
September 2026 Presale Spotlight: Why Watt2Trade Leads Alongside Ethos Network and MoonbergToken sales rarely slow down, but only a handful of this month’s launches are attracting more than passing interest. Watt2Trade ($WATTOIN) is the one drawing the most attention because it is pointed at electricity, not at another self-contained crypto venue. Ethos Network ($WHUF) and Moonberg ($MBX) complete the shortlist with two other live themes: measurable on-chain reputation and AI-driven trading software.
The electricity market is routinely described as more than $5 trillion larger than crypto itself. That scale is the reason Watt2Trade sits first here. The other two projects are still worth tracking; they just occupy narrower corners of the same cycle.
Watt2Trade ($WATTOIN): A Marketplace for Electricity, Not Another Crypto Island
Watt2Trade is constructing a blockchain marketplace meant to open electricity trading to a wider set of participants. Power is generated, bought, sold, and consumed without pause. The protocol’s bet is that on-chain rails can make that process more open and less administratively heavy.
Utility is concentrated in $WATTOIN. The token is designed for fee discounts on the platform, staking and rewards, and governance votes. In other words, it is framed as a working asset inside the marketplace rather than a standalone ticker.
Operators from the energy business
Most RWA pitches stop at branding. Watt2Trade leans on operating credentials instead. The project is led by Carlos Aurelio Hernández González, President of COPARMEX’s National Energy Commission in Mexico. He has been recognized among the Top 100 figures in the energy sector for two consecutive years.
That background is the point. The team is not borrowing the language of power markets from a distance; it comes from those markets. On the Web3 side, Watt2Trade was named among the Top 100 projects at Paris Blockchain Week’s Start in Block program and ranked with the event’s top RWA cohort.
Sale mechanics and what is already in place
Buyers can enter the community presale now at presale.watt2trade.com. A short Fjord Foundry allocation is also being arranged at a slightly lower price. After that Fjord window ends, the sale stays on Watt2Trade’s site and advances through stepped price stages. Each completed stage lifts the token price.
The raise is arriving after earlier work, not before it. The team cites $1.55 million previously raised via equity, more than 257,000 unique wallets, and $850,000+ of DEX liquidity. Those figures do not make an early token safe. They do show that Watt2Trade is not starting from a blank page.
Put together, energy-industry leadership, outside recognition, a defined token use case, and a real-world market that already exists, and the project is the clearest September name on this list.
Fjord Foundry window: limited-period sale at reduced pricing.
Official presale: https://presale.watt2trade.com/
Ethos Network ($WHUF): Reputation With an Economic Backing
Crypto still struggles with trust. Ethos Network is trying to make reputation countable on-chain by gathering signals such as reviews and vouches, then attaching an economic layer through $WHUF. Credibility stops being only a social impression and starts carrying a stake.
Tokenomics are tight by current standards: a fixed supply of 10 million, with 20% reserved for a public sale. That sale is a uniform-price English auction run on Sonar, which is a different structure from the staged private-style offerings that fill most calendars.
The positioning is also different. Ethos is not selling another trading venue or DeFi primitive. It is trying to turn reputation into something that can hold value on-chain.
Public sale: https://sale.ethos.network/
Moonberg ($MBX): Trading Stack Meets AI
Moonberg is the third name because AI-assisted trading remains one of the few narratives that still pulls consistent attention. The product plan is an ecosystem of trading tools, analytics, and AI features. $MBX is the utility token that is supposed to unlock cheaper swaps, premium analytics, and governance rights.
Pricing follows a staged schedule. As each stage fills, the listed price moves up. The underlying argument is familiar and still commercially relevant: trading continues to generate a large share of on-chain activity, and traders increasingly expect AI inside their toolset. Moonberg’s test is whether that combination survives after the sale.
Token sale: https://moonberg.com/tokensale#token-sale
Final Thoughts
Ethos is a bet on trust becoming measurable. Moonberg is a bet on AI remaining useful to traders. Watt2Trade is a bet on electricity markets moving part of their activity on-chain, and it is the only one of the three whose leadership already sits inside that industry. That is why it leads this September spotlight.
DISCLAIMER: CAPTAINALTCOIN DOES NOT ENDORSE INVESTING IN ANY PROJECT MENTIONED IN SPONSORED ARTICLES. EXERCISE CAUTION AND DO THOROUGH RESEARCH BEFORE INVESTING YOUR MONEY. CaptainAltcoin takes no responsibility for its accuracy or quality. This content was not written by CaptainAltcoin’s team. We strongly advise readers to do their own thorough research before interacting with any featured companies. The information provided is not financial or legal advice. Neither CaptainAltcoin nor any third party recommends buying or selling any financial products. Investing in crypto assets is high-risk; consider the potential for loss. Any investment decisions made based on this content are at the sole risk of the readCaptainAltcoin is not liable for any damages or losses from using or relying on this content.
The post September 2026 Presale Spotlight: Why Watt2Trade Leads Alongside Ethos Network and Moonberg appeared first on CaptainAltcoin.
September 2026 Presale Spotlight: Why Watt2Trade Leads Alongside Ethos Network and Moonberg
Token sales rarely slow down, but only a handful of this month’s launches are attracting more than passing interest. Watt2Trade ($WATTOIN) is the one drawing the most attention because it is pointed at electricity, not at another self-contained crypto venue. Ethos Network ($WHUF) and Moonberg ($MBX) complete the shortlist with two other live themes: measurable on-chain reputation and AI-driven trading software.
The electricity market is routinely described as more than $5 trillion larger than crypto itself. That scale is the reason Watt2Trade sits first here. The other two projects are still worth tracking; they just occupy narrower corners of the same cycle.
Watt2Trade ($WATTOIN): A Marketplace for Electricity, Not Another Crypto Island
Watt2Trade is constructing a blockchain marketplace meant to open electricity trading to a wider set of participants. Power is generated, bought, sold, and consumed without pause. The protocol’s bet is that on-chain rails can make that process more open and less administratively heavy.
Utility is concentrated in $WATTOIN. The token is designed for fee discounts on the platform, staking and rewards, and governance votes. In other words, it is framed as a working asset inside the marketplace rather than a standalone ticker.
Operators from the energy business
Most RWA pitches stop at branding. Watt2Trade leans on operating credentials instead. The project is led by Carlos Aurelio Hernández González, President of COPARMEX’s National Energy Commission in Mexico. He has been recognized among the Top 100 figures in the energy sector for two consecutive years.
That background is the point. The team is not borrowing the language of power markets from a distance; it comes from those markets. On the Web3 side, Watt2Trade was named among the Top 100 projects at Paris Blockchain Week’s Start in Block program and ranked with the event’s top RWA cohort.
Sale mechanics and what is already in place
Buyers can enter the community presale now at presale.watt2trade.com. A short Fjord Foundry allocation is also being arranged at a slightly lower price. After that Fjord window ends, the sale stays on Watt2Trade’s site and advances through stepped price stages. Each completed stage lifts the token price.
The raise is arriving after earlier work, not before it. The team cites $1.55 million previously raised via equity, more than 257,000 unique wallets, and $850,000+ of DEX liquidity. Those figures do not make an early token safe. They do show that Watt2Trade is not starting from a blank page.
Put together, energy-industry leadership, outside recognition, a defined token use case, and a real-world market that already exists, and the project is the clearest September name on this list.
Fjord Foundry window: limited-period sale at reduced pricing.
Official presale: https://presale.watt2trade.com/
Ethos Network ($WHUF): Reputation With an Economic Backing
Crypto still struggles with trust. Ethos Network is trying to make reputation countable on-chain by gathering signals such as reviews and vouches, then attaching an economic layer through $WHUF. Credibility stops being only a social impression and starts carrying a stake.
Tokenomics are tight by current standards: a fixed supply of 10 million, with 20% reserved for a public sale. That sale is a uniform-price English auction run on Sonar, which is a different structure from the staged private-style offerings that fill most calendars.
The positioning is also different. Ethos is not selling another trading venue or DeFi primitive. It is trying to turn reputation into something that can hold value on-chain.
Public sale: https://sale.ethos.network/
Moonberg ($MBX): Trading Stack Meets AI
Moonberg is the third name because AI-assisted trading remains one of the few narratives that still pulls consistent attention. The product plan is an ecosystem of trading tools, analytics, and AI features. $MBX is the utility token that is supposed to unlock cheaper swaps, premium analytics, and governance rights.
Pricing follows a staged schedule. As each stage fills, the listed price moves up. The underlying argument is familiar and still commercially relevant: trading continues to generate a large share of on-chain activity, and traders increasingly expect AI inside their toolset. Moonberg’s test is whether that combination survives after the sale.
Token sale: https://moonberg.com/tokensale#token-sale
Final Thoughts
Ethos is a bet on trust becoming measurable. Moonberg is a bet on AI remaining useful to traders. Watt2Trade is a bet on electricity markets moving part of their activity on-chain, and it is the only one of the three whose leadership already sits inside that industry. That is why it leads this September spotlight.
DISCLAIMER: CAPTAINALTCOIN DOES NOT ENDORSE INVESTING IN ANY PROJECT MENTIONED IN SPONSORED ARTICLES. EXERCISE CAUTION AND DO THOROUGH RESEARCH BEFORE INVESTING YOUR MONEY. CaptainAltcoin takes no responsibility for its accuracy or quality. This content was not written by CaptainAltcoin’s team. We strongly advise readers to do their own thorough research before interacting with any featured companies. The information provided is not financial or legal advice. Neither CaptainAltcoin nor any third party recommends buying or selling any financial products. Investing in crypto assets is high-risk; consider the potential for loss. Any investment decisions made based on this content are at the sole risk of the readCaptainAltcoin is not liable for any damages or losses from using or relying on this content.
The post September 2026 Presale Spotlight: Why Watt2Trade Leads Alongside Ethos Network and Moonberg appeared first on CaptainAltcoin.
The electricity market is routinely described as more than $5 trillion larger than crypto itself. That scale is the reason Watt2Trade sits first here. The other two projects are still worth tracking; they just occupy narrower corners of the same cycle.
Watt2Trade ($WATTOIN): A Marketplace for Electricity, Not Another Crypto Island
Watt2Trade is constructing a blockchain marketplace meant to open electricity trading to a wider set of participants. Power is generated, bought, sold, and consumed without pause. The protocol’s bet is that on-chain rails can make that process more open and less administratively heavy.
Utility is concentrated in $WATTOIN. The token is designed for fee discounts on the platform, staking and rewards, and governance votes. In other words, it is framed as a working asset inside the marketplace rather than a standalone ticker.
Operators from the energy business
Most RWA pitches stop at branding. Watt2Trade leans on operating credentials instead. The project is led by Carlos Aurelio Hernández González, President of COPARMEX’s National Energy Commission in Mexico. He has been recognized among the Top 100 figures in the energy sector for two consecutive years.
That background is the point. The team is not borrowing the language of power markets from a distance; it comes from those markets. On the Web3 side, Watt2Trade was named among the Top 100 projects at Paris Blockchain Week’s Start in Block program and ranked with the event’s top RWA cohort.
Sale mechanics and what is already in place
Buyers can enter the community presale now at presale.watt2trade.com. A short Fjord Foundry allocation is also being arranged at a slightly lower price. After that Fjord window ends, the sale stays on Watt2Trade’s site and advances through stepped price stages. Each completed stage lifts the token price.
The raise is arriving after earlier work, not before it. The team cites $1.55 million previously raised via equity, more than 257,000 unique wallets, and $850,000+ of DEX liquidity. Those figures do not make an early token safe. They do show that Watt2Trade is not starting from a blank page.
Put together, energy-industry leadership, outside recognition, a defined token use case, and a real-world market that already exists, and the project is the clearest September name on this list.
Fjord Foundry window: limited-period sale at reduced pricing.
Official presale: https://presale.watt2trade.com/
Ethos Network ($WHUF): Reputation With an Economic Backing
Crypto still struggles with trust. Ethos Network is trying to make reputation countable on-chain by gathering signals such as reviews and vouches, then attaching an economic layer through $WHUF. Credibility stops being only a social impression and starts carrying a stake.
Tokenomics are tight by current standards: a fixed supply of 10 million, with 20% reserved for a public sale. That sale is a uniform-price English auction run on Sonar, which is a different structure from the staged private-style offerings that fill most calendars.
The positioning is also different. Ethos is not selling another trading venue or DeFi primitive. It is trying to turn reputation into something that can hold value on-chain.
Public sale: https://sale.ethos.network/
Moonberg ($MBX): Trading Stack Meets AI
Moonberg is the third name because AI-assisted trading remains one of the few narratives that still pulls consistent attention. The product plan is an ecosystem of trading tools, analytics, and AI features. $MBX is the utility token that is supposed to unlock cheaper swaps, premium analytics, and governance rights.
Pricing follows a staged schedule. As each stage fills, the listed price moves up. The underlying argument is familiar and still commercially relevant: trading continues to generate a large share of on-chain activity, and traders increasingly expect AI inside their toolset. Moonberg’s test is whether that combination survives after the sale.
Token sale: https://moonberg.com/tokensale#token-sale
Final Thoughts
Ethos is a bet on trust becoming measurable. Moonberg is a bet on AI remaining useful to traders. Watt2Trade is a bet on electricity markets moving part of their activity on-chain, and it is the only one of the three whose leadership already sits inside that industry. That is why it leads this September spotlight.
DISCLAIMER: CAPTAINALTCOIN DOES NOT ENDORSE INVESTING IN ANY PROJECT MENTIONED IN SPONSORED ARTICLES. EXERCISE CAUTION AND DO THOROUGH RESEARCH BEFORE INVESTING YOUR MONEY. CaptainAltcoin takes no responsibility for its accuracy or quality. This content was not written by CaptainAltcoin’s team. We strongly advise readers to do their own thorough research before interacting with any featured companies. The information provided is not financial or legal advice. Neither CaptainAltcoin nor any third party recommends buying or selling any financial products. Investing in crypto assets is high-risk; consider the potential for loss. Any investment decisions made based on this content are at the sole risk of the readCaptainAltcoin is not liable for any damages or losses from using or relying on this content.
The post September 2026 Presale Spotlight: Why Watt2Trade Leads Alongside Ethos Network and Moonberg appeared first on CaptainAltcoin.
84
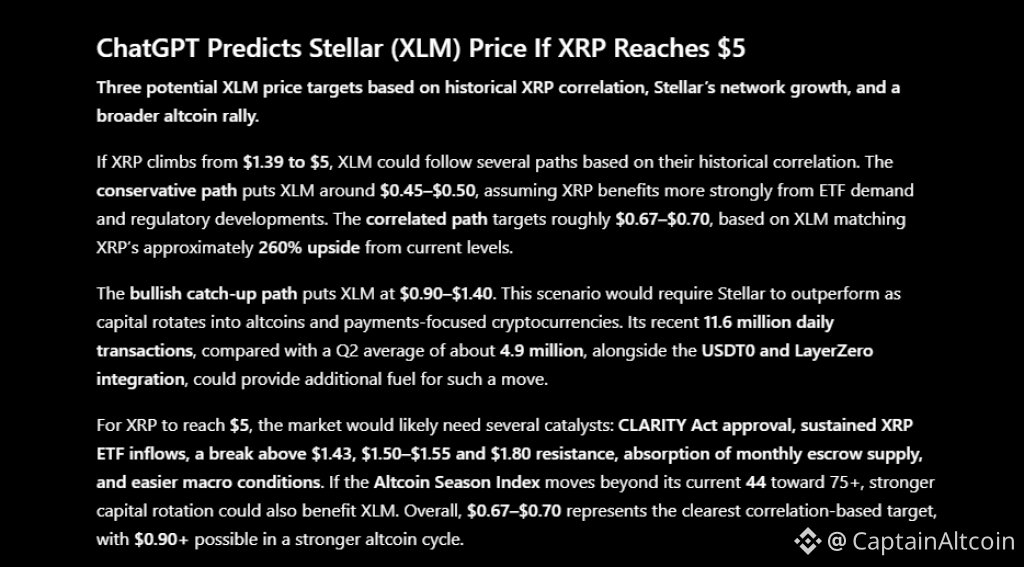
ලිපිය
පරිවර්තනය බලන්න
ChatGPT Predicts Stellar (XLM) Price If XRP Reaches $5These two have danced the same dance for years. XLM and XRP move like they’re tied together. So when people see XRP climbing, they naturally ask, what happens to Stellar if XRP really hits $5?
Look at January 2018. The XLM price peaked at $0.93. XRP topped at $3.31. Then in 2023, both ended the year up over 80%. Same beat. Same rhythm. Their correlation hit 0.94 over three months in 2021. Over five years, it’s still 0.78. That’s not random. That’s a pattern.
Right now, XLM is at $0.188, down 2.79% today. Ripple’s XRP price is at $1.39, down just under 1%. The whole market is jittery, waiting on inflation data. Even Bitcoin took a bigger hit than XRP did. So the question isn’t crazy, it’s actually pretty reasonable.
If XRP gets to $5, XLM won’t just watch from the sidelines. It’ll move. Maybe not to $5 itself, but probably toward that old $0.93 high, or past it. Depends on how greedy or scared everyone feels then. But if history means anything, XLM follows. Always has.
What Would Need to Happen for XRP to Reach $5?
For XRP to go from $1.39 to $5, that’s a 260% jump. That doesn’t happen on one piece of news. It takes real fuel.
Biggest possible match? ETF money. For the week ending September 4, spot XRP ETFs pulled in about $19 million. The week before, that number was $110 million. To push XRP to $5, those weekly inflows probably need to hit hundreds of millions, then billions. That kind of demand would eat up available supply fast.
Price has walls to break through too. XRP keeps bumping into resistance near $1.43. Above that, $1.50 to $1.55 is the next ceiling. If XRP closes a day above $1.43, it could run toward $1.50, then $1.55, then the August peak around $1.70. There’s also the CLARITY Act, if the Senate moves it forward on September 15, a day before the Fed’s next decision, that could light a fire.
Then there’s supply. Ripple unlocked 1 billion XRP on September 1. They locked 700 million of that back up, leaving 300 million floating around. That doesn’t mean all 300 million hit the market for sale, but it does mean there’s more coins out there. For XRP to really take off, demand has to be strong enough to soak up whatever eventually gets sold.
Macro conditions would also matter. XRP’s move toward $5 would be easier if liquidity conditions become more supportive of risk assets. The September 16 Federal Reserve decision is therefore important, especially with U.S. inflation still elevated and Treasury yields creating pressure across crypto markets. A combination of easier monetary policy, stronger ETF flows, regulatory clarity and an altcoin-wide liquidity cycle would provide a much stronger foundation for the $5 scenario.
ChatGPT Predicts Stellar Price If XRP Reaches $5
If the XRP price climbs from $1.39 to $5, that represents an increase of 259.7%. Applying the same percentage move to XLM’s $0.188 price $0.676, putting the correlation-based target near $0.68. From there, three possible XLM outcomes emerge: a conservative move toward $0.38, a correlation-based target around $0.68, and a highly bullish run toward $0.90–$1.00.
Conservative Path: XLM Reaches $0.38
The first scenario assumes the Stellar price captures only part of XRP’s upside. A move from $0.188 to $0.38 would represent roughly a 102% increase, meaning XLM would deliver less than half of XRP’s projected percentage gain.
This could happen if institutional capital remains concentrated in XRP products instead of rotating across payment-focused tokens. XLM would still have fundamental support from network usage and its growing stablecoin infrastructure, but the token would fail to fully match XRP’s performance.
Source: ChatGPT
Correlation Path: XLM Reaches $0.68
The middle scenario is the most mathematical. XRP needs roughly 260% upside to move from $1.39 to $5. Applying that same percentage increase to XLM takes the token from $0.188 to $0.676, which rounds to $0.68. This target also fits XLM’s historical relationship with XRP. A broader altcoin rally, stronger XRP ETF flows, passage of the CLARITY Act and easier macro liquidity could create the conditions for capital to move beyond XRP into XLM.
Stellar also has its own fundamental catalysts. USDT0 went live on Stellar in September, connecting the network to Tether’s unified liquidity across 26+ networks. Stellar says USDT0 provides access to a USDT ecosystem with more than $180 billion in market capitalization, alongside payment settlement of roughly five seconds and fees below one cent.
Bullish Path: XLM Reaches $0.90–$1.00
The most aggressive scenario would take XLM back toward its 2018 peak and potentially above $1. Historical market data places the token’s previous peak around $0.93, meaning a move to $1 from $0.188 would require an increase of about 432%. That is considerably larger than XRP’s 260% move, so XLM would need to outperform XRP rather than simply track it.
Network activity provides a fundamental case for this outcome. Chainspect data cited this week showed Stellar processing more than 11.6 million transactions in a single day, its highest daily figure of the week. USDT0 adds another potential source of liquidity, with Stellar positioning the integration around cross-border payments, remittances, treasury settlement and stablecoin activity across global markets.
Related XRP News: XRP Price Could Be Getting Ready to Surprise the Market
Could XLM Outperform XRP During the Rally?
Yes, but the conditions would need to be stronger than a simple XRP rally. XRP has a direct institutional catalyst through its spot ETF market, meaning a large portion of new capital could initially concentrate in XRP.
XLM would need investors to rotate part of that liquidity into other payment tokens after XRP establishes a strong trend. Its relatively smaller market capitalization also means that the same amount of new capital can produce a larger percentage move. XLM’s market capitalization was around $6.7 billion near September 8, based on recent market data.
The network fundamentals give XLM a case for outperforming if the market enters a broad altcoin phase. Stellar processed more than 11.6 million transactions in one day this week, and USDT0 now connects its payment network to a unified USDT liquidity pool spanning 26+ networks.
If XRP reaches $5 as part of a wider payment-token rally, XLM could therefore rise faster than XRP in percentage terms. That is the condition needed for the $0.90–$1.00 scenario; correlation alone would point closer to $0.68.
Stellar Price Prediction: How Realistic Is the AI Target?
The $0.68 XLM target is the most defensible of the three scenarios because the calculation is straightforward: XRP moving from $1.39 to $5 requires 260% upside, and applying that same percentage to XLM’s $0.188 price produces about $0.68.
It also avoids assuming that XLM must immediately exceed its previous peak. For context, the XLM price closed at $0.1935 on September 7 after trading as high as $0.1963, before moving back toward the $0.188 area on September 8.
The $0.90–$1.00 target is possible, but it requires an additional performance premium from XLM. At $1, Stellar’s market capitalization would be roughly $34.8 billion using a circulating supply near 34.8 billion XLM.
That would place the token well above its present valuation, but still far below the multi-hundred-billion-dollar valuations that would accompany much larger payment-token moves.
The bottom line is that if XRP genuinely reaches $5, a $0.38 XLM price becomes the conservative case, around $0.68 becomes the correlation-based case, and $0.90–$1.00 requires a full payment-token and altcoin rally. Among the three, $0.68 is the cleanest AI-derived target because it directly applies XRP’s projected percentage move to the XLM price.
Frequently Asked Questions
Can XLM reach $1 if XRP reaches $5
Yes, XLM could reach $1 if XRP climbs to $5, but it would require XLM to outperform XRP. From $0.188, XLM would need to rise roughly 432% to reach $1, compared with XRP’s roughly 260% increase from $1.39 to $5. A broad altcoin rally, strong Stellar network activity and capital rotation into payment tokens would likely be needed.
What could XLM be worth if XRP reaches $5
Based on the same percentage increase as XRP, the XLM price could reach approximately $0.68. A more conservative scenario puts XLM near $0.38, whereas a stronger payment-token rally could push it toward $0.90–$1.00.
What could drive Stellar (XLM) higher
Key drivers include rising Stellar network activity, the integration of USDT0, increased stablecoin usage and stronger demand for cross-border payments. Stellar recently processed more than 11.6 million transactions in a day, and USDT0 connects the network to Tether’s unified liquidity across more than 26 networks.
Subscribe to our YouTube channel for daily crypto updates, market insights, and expert analysis.
The post ChatGPT Predicts Stellar (XLM) Price If XRP Reaches $5 appeared first on CaptainAltcoin.
ChatGPT Predicts Stellar (XLM) Price If XRP Reaches $5
These two have danced the same dance for years. XLM and XRP move like they’re tied together. So when people see XRP climbing, they naturally ask, what happens to Stellar if XRP really hits $5?
Look at January 2018. The XLM price peaked at $0.93. XRP topped at $3.31. Then in 2023, both ended the year up over 80%. Same beat. Same rhythm. Their correlation hit 0.94 over three months in 2021. Over five years, it’s still 0.78. That’s not random. That’s a pattern.
Right now, XLM is at $0.188, down 2.79% today. Ripple’s XRP price is at $1.39, down just under 1%. The whole market is jittery, waiting on inflation data. Even Bitcoin took a bigger hit than XRP did. So the question isn’t crazy, it’s actually pretty reasonable.
If XRP gets to $5, XLM won’t just watch from the sidelines. It’ll move. Maybe not to $5 itself, but probably toward that old $0.93 high, or past it. Depends on how greedy or scared everyone feels then. But if history means anything, XLM follows. Always has.
What Would Need to Happen for XRP to Reach $5?
For XRP to go from $1.39 to $5, that’s a 260% jump. That doesn’t happen on one piece of news. It takes real fuel.
Biggest possible match? ETF money. For the week ending September 4, spot XRP ETFs pulled in about $19 million. The week before, that number was $110 million. To push XRP to $5, those weekly inflows probably need to hit hundreds of millions, then billions. That kind of demand would eat up available supply fast.
Price has walls to break through too. XRP keeps bumping into resistance near $1.43. Above that, $1.50 to $1.55 is the next ceiling. If XRP closes a day above $1.43, it could run toward $1.50, then $1.55, then the August peak around $1.70. There’s also the CLARITY Act, if the Senate moves it forward on September 15, a day before the Fed’s next decision, that could light a fire.
Then there’s supply. Ripple unlocked 1 billion XRP on September 1. They locked 700 million of that back up, leaving 300 million floating around. That doesn’t mean all 300 million hit the market for sale, but it does mean there’s more coins out there. For XRP to really take off, demand has to be strong enough to soak up whatever eventually gets sold.
Macro conditions would also matter. XRP’s move toward $5 would be easier if liquidity conditions become more supportive of risk assets. The September 16 Federal Reserve decision is therefore important, especially with U.S. inflation still elevated and Treasury yields creating pressure across crypto markets. A combination of easier monetary policy, stronger ETF flows, regulatory clarity and an altcoin-wide liquidity cycle would provide a much stronger foundation for the $5 scenario.
ChatGPT Predicts Stellar Price If XRP Reaches $5
If the XRP price climbs from $1.39 to $5, that represents an increase of 259.7%. Applying the same percentage move to XLM’s $0.188 price $0.676, putting the correlation-based target near $0.68. From there, three possible XLM outcomes emerge: a conservative move toward $0.38, a correlation-based target around $0.68, and a highly bullish run toward $0.90–$1.00.
Conservative Path: XLM Reaches $0.38
The first scenario assumes the Stellar price captures only part of XRP’s upside. A move from $0.188 to $0.38 would represent roughly a 102% increase, meaning XLM would deliver less than half of XRP’s projected percentage gain.
This could happen if institutional capital remains concentrated in XRP products instead of rotating across payment-focused tokens. XLM would still have fundamental support from network usage and its growing stablecoin infrastructure, but the token would fail to fully match XRP’s performance.
Source: ChatGPT
Correlation Path: XLM Reaches $0.68
The middle scenario is the most mathematical. XRP needs roughly 260% upside to move from $1.39 to $5. Applying that same percentage increase to XLM takes the token from $0.188 to $0.676, which rounds to $0.68. This target also fits XLM’s historical relationship with XRP. A broader altcoin rally, stronger XRP ETF flows, passage of the CLARITY Act and easier macro liquidity could create the conditions for capital to move beyond XRP into XLM.
Stellar also has its own fundamental catalysts. USDT0 went live on Stellar in September, connecting the network to Tether’s unified liquidity across 26+ networks. Stellar says USDT0 provides access to a USDT ecosystem with more than $180 billion in market capitalization, alongside payment settlement of roughly five seconds and fees below one cent.
Bullish Path: XLM Reaches $0.90–$1.00
The most aggressive scenario would take XLM back toward its 2018 peak and potentially above $1. Historical market data places the token’s previous peak around $0.93, meaning a move to $1 from $0.188 would require an increase of about 432%. That is considerably larger than XRP’s 260% move, so XLM would need to outperform XRP rather than simply track it.
Network activity provides a fundamental case for this outcome. Chainspect data cited this week showed Stellar processing more than 11.6 million transactions in a single day, its highest daily figure of the week. USDT0 adds another potential source of liquidity, with Stellar positioning the integration around cross-border payments, remittances, treasury settlement and stablecoin activity across global markets.
Related XRP News: XRP Price Could Be Getting Ready to Surprise the Market
Could XLM Outperform XRP During the Rally?
Yes, but the conditions would need to be stronger than a simple XRP rally. XRP has a direct institutional catalyst through its spot ETF market, meaning a large portion of new capital could initially concentrate in XRP.
XLM would need investors to rotate part of that liquidity into other payment tokens after XRP establishes a strong trend. Its relatively smaller market capitalization also means that the same amount of new capital can produce a larger percentage move. XLM’s market capitalization was around $6.7 billion near September 8, based on recent market data.
The network fundamentals give XLM a case for outperforming if the market enters a broad altcoin phase. Stellar processed more than 11.6 million transactions in one day this week, and USDT0 now connects its payment network to a unified USDT liquidity pool spanning 26+ networks.
If XRP reaches $5 as part of a wider payment-token rally, XLM could therefore rise faster than XRP in percentage terms. That is the condition needed for the $0.90–$1.00 scenario; correlation alone would point closer to $0.68.
Stellar Price Prediction: How Realistic Is the AI Target?
The $0.68 XLM target is the most defensible of the three scenarios because the calculation is straightforward: XRP moving from $1.39 to $5 requires 260% upside, and applying that same percentage to XLM’s $0.188 price produces about $0.68.
It also avoids assuming that XLM must immediately exceed its previous peak. For context, the XLM price closed at $0.1935 on September 7 after trading as high as $0.1963, before moving back toward the $0.188 area on September 8.
The $0.90–$1.00 target is possible, but it requires an additional performance premium from XLM. At $1, Stellar’s market capitalization would be roughly $34.8 billion using a circulating supply near 34.8 billion XLM.
That would place the token well above its present valuation, but still far below the multi-hundred-billion-dollar valuations that would accompany much larger payment-token moves.
The bottom line is that if XRP genuinely reaches $5, a $0.38 XLM price becomes the conservative case, around $0.68 becomes the correlation-based case, and $0.90–$1.00 requires a full payment-token and altcoin rally. Among the three, $0.68 is the cleanest AI-derived target because it directly applies XRP’s projected percentage move to the XLM price.
Frequently Asked Questions
Can XLM reach $1 if XRP reaches $5
Yes, XLM could reach $1 if XRP climbs to $5, but it would require XLM to outperform XRP. From $0.188, XLM would need to rise roughly 432% to reach $1, compared with XRP’s roughly 260% increase from $1.39 to $5. A broad altcoin rally, strong Stellar network activity and capital rotation into payment tokens would likely be needed.
What could XLM be worth if XRP reaches $5
Based on the same percentage increase as XRP, the XLM price could reach approximately $0.68. A more conservative scenario puts XLM near $0.38, whereas a stronger payment-token rally could push it toward $0.90–$1.00.
What could drive Stellar (XLM) higher
Key drivers include rising Stellar network activity, the integration of USDT0, increased stablecoin usage and stronger demand for cross-border payments. Stellar recently processed more than 11.6 million transactions in a day, and USDT0 connects the network to Tether’s unified liquidity across more than 26 networks.
Subscribe to our YouTube channel for daily crypto updates, market insights, and expert analysis.
The post ChatGPT Predicts Stellar (XLM) Price If XRP Reaches $5 appeared first on CaptainAltcoin.
Look at January 2018. The XLM price peaked at $0.93. XRP topped at $3.31. Then in 2023, both ended the year up over 80%. Same beat. Same rhythm. Their correlation hit 0.94 over three months in 2021. Over five years, it’s still 0.78. That’s not random. That’s a pattern.
Right now, XLM is at $0.188, down 2.79% today. Ripple’s XRP price is at $1.39, down just under 1%. The whole market is jittery, waiting on inflation data. Even Bitcoin took a bigger hit than XRP did. So the question isn’t crazy, it’s actually pretty reasonable.
If XRP gets to $5, XLM won’t just watch from the sidelines. It’ll move. Maybe not to $5 itself, but probably toward that old $0.93 high, or past it. Depends on how greedy or scared everyone feels then. But if history means anything, XLM follows. Always has.
What Would Need to Happen for XRP to Reach $5?
For XRP to go from $1.39 to $5, that’s a 260% jump. That doesn’t happen on one piece of news. It takes real fuel.
Biggest possible match? ETF money. For the week ending September 4, spot XRP ETFs pulled in about $19 million. The week before, that number was $110 million. To push XRP to $5, those weekly inflows probably need to hit hundreds of millions, then billions. That kind of demand would eat up available supply fast.
Price has walls to break through too. XRP keeps bumping into resistance near $1.43. Above that, $1.50 to $1.55 is the next ceiling. If XRP closes a day above $1.43, it could run toward $1.50, then $1.55, then the August peak around $1.70. There’s also the CLARITY Act, if the Senate moves it forward on September 15, a day before the Fed’s next decision, that could light a fire.
Then there’s supply. Ripple unlocked 1 billion XRP on September 1. They locked 700 million of that back up, leaving 300 million floating around. That doesn’t mean all 300 million hit the market for sale, but it does mean there’s more coins out there. For XRP to really take off, demand has to be strong enough to soak up whatever eventually gets sold.
Macro conditions would also matter. XRP’s move toward $5 would be easier if liquidity conditions become more supportive of risk assets. The September 16 Federal Reserve decision is therefore important, especially with U.S. inflation still elevated and Treasury yields creating pressure across crypto markets. A combination of easier monetary policy, stronger ETF flows, regulatory clarity and an altcoin-wide liquidity cycle would provide a much stronger foundation for the $5 scenario.
ChatGPT Predicts Stellar Price If XRP Reaches $5
If the XRP price climbs from $1.39 to $5, that represents an increase of 259.7%. Applying the same percentage move to XLM’s $0.188 price $0.676, putting the correlation-based target near $0.68. From there, three possible XLM outcomes emerge: a conservative move toward $0.38, a correlation-based target around $0.68, and a highly bullish run toward $0.90–$1.00.
Conservative Path: XLM Reaches $0.38
The first scenario assumes the Stellar price captures only part of XRP’s upside. A move from $0.188 to $0.38 would represent roughly a 102% increase, meaning XLM would deliver less than half of XRP’s projected percentage gain.
This could happen if institutional capital remains concentrated in XRP products instead of rotating across payment-focused tokens. XLM would still have fundamental support from network usage and its growing stablecoin infrastructure, but the token would fail to fully match XRP’s performance.
Source: ChatGPT
Correlation Path: XLM Reaches $0.68
The middle scenario is the most mathematical. XRP needs roughly 260% upside to move from $1.39 to $5. Applying that same percentage increase to XLM takes the token from $0.188 to $0.676, which rounds to $0.68. This target also fits XLM’s historical relationship with XRP. A broader altcoin rally, stronger XRP ETF flows, passage of the CLARITY Act and easier macro liquidity could create the conditions for capital to move beyond XRP into XLM.
Stellar also has its own fundamental catalysts. USDT0 went live on Stellar in September, connecting the network to Tether’s unified liquidity across 26+ networks. Stellar says USDT0 provides access to a USDT ecosystem with more than $180 billion in market capitalization, alongside payment settlement of roughly five seconds and fees below one cent.
Bullish Path: XLM Reaches $0.90–$1.00
The most aggressive scenario would take XLM back toward its 2018 peak and potentially above $1. Historical market data places the token’s previous peak around $0.93, meaning a move to $1 from $0.188 would require an increase of about 432%. That is considerably larger than XRP’s 260% move, so XLM would need to outperform XRP rather than simply track it.
Network activity provides a fundamental case for this outcome. Chainspect data cited this week showed Stellar processing more than 11.6 million transactions in a single day, its highest daily figure of the week. USDT0 adds another potential source of liquidity, with Stellar positioning the integration around cross-border payments, remittances, treasury settlement and stablecoin activity across global markets.
Related XRP News: XRP Price Could Be Getting Ready to Surprise the Market
Could XLM Outperform XRP During the Rally?
Yes, but the conditions would need to be stronger than a simple XRP rally. XRP has a direct institutional catalyst through its spot ETF market, meaning a large portion of new capital could initially concentrate in XRP.
XLM would need investors to rotate part of that liquidity into other payment tokens after XRP establishes a strong trend. Its relatively smaller market capitalization also means that the same amount of new capital can produce a larger percentage move. XLM’s market capitalization was around $6.7 billion near September 8, based on recent market data.
The network fundamentals give XLM a case for outperforming if the market enters a broad altcoin phase. Stellar processed more than 11.6 million transactions in one day this week, and USDT0 now connects its payment network to a unified USDT liquidity pool spanning 26+ networks.
If XRP reaches $5 as part of a wider payment-token rally, XLM could therefore rise faster than XRP in percentage terms. That is the condition needed for the $0.90–$1.00 scenario; correlation alone would point closer to $0.68.
Stellar Price Prediction: How Realistic Is the AI Target?
The $0.68 XLM target is the most defensible of the three scenarios because the calculation is straightforward: XRP moving from $1.39 to $5 requires 260% upside, and applying that same percentage to XLM’s $0.188 price produces about $0.68.
It also avoids assuming that XLM must immediately exceed its previous peak. For context, the XLM price closed at $0.1935 on September 7 after trading as high as $0.1963, before moving back toward the $0.188 area on September 8.
The $0.90–$1.00 target is possible, but it requires an additional performance premium from XLM. At $1, Stellar’s market capitalization would be roughly $34.8 billion using a circulating supply near 34.8 billion XLM.
That would place the token well above its present valuation, but still far below the multi-hundred-billion-dollar valuations that would accompany much larger payment-token moves.
The bottom line is that if XRP genuinely reaches $5, a $0.38 XLM price becomes the conservative case, around $0.68 becomes the correlation-based case, and $0.90–$1.00 requires a full payment-token and altcoin rally. Among the three, $0.68 is the cleanest AI-derived target because it directly applies XRP’s projected percentage move to the XLM price.
Frequently Asked Questions
Can XLM reach $1 if XRP reaches $5
Yes, XLM could reach $1 if XRP climbs to $5, but it would require XLM to outperform XRP. From $0.188, XLM would need to rise roughly 432% to reach $1, compared with XRP’s roughly 260% increase from $1.39 to $5. A broad altcoin rally, strong Stellar network activity and capital rotation into payment tokens would likely be needed.
What could XLM be worth if XRP reaches $5
Based on the same percentage increase as XRP, the XLM price could reach approximately $0.68. A more conservative scenario puts XLM near $0.38, whereas a stronger payment-token rally could push it toward $0.90–$1.00.
What could drive Stellar (XLM) higher
Key drivers include rising Stellar network activity, the integration of USDT0, increased stablecoin usage and stronger demand for cross-border payments. Stellar recently processed more than 11.6 million transactions in a day, and USDT0 connects the network to Tether’s unified liquidity across more than 26 networks.
Subscribe to our YouTube channel for daily crypto updates, market insights, and expert analysis.
The post ChatGPT Predicts Stellar (XLM) Price If XRP Reaches $5 appeared first on CaptainAltcoin.
324

ලිපිය
පරිවර්තනය බලන්න
Best Crypto Presale: Could DigiTap Deliver Next Shiba Inu Returns but With Utility As SHIB Battle...Shiba Inu is fighting to rebuild momentum after erasing more than 20% of its late-August gains. SHIB has since pushed back toward $0.0000055, with the meme coin gaining ground again in early September as traders watch whether another community-driven breakout can develop. The problem for anyone chasing the next Shiba Inu is timing. SHIB already has global recognition, deep exchange liquidity, and a mature public chart. DigiTap ($TAP) is approaching the opportunity from the opposite direction, combining a token still in presale with a beta financial app that users can already download. Round 4 is more than 84% complete, over $11.37 million has been raised, and $TAP is currently priced at $0.0589 before its next presale increase.
SHIB Shows Why Early Entry Can Matter More Than the Meme
Shiba Inu became one of crypto’s defining retail stories because its earliest buyers arrived before the token became a mainstream name. That phase cannot simply be recreated now. SHIB may still rally, but new buyers are entering an asset that has already experienced multiple bull cycles and reached enormous valuations during its peak.
September has brought fresh signs of life. SHIB price has recovered from the late-August setback, while new regulated futures access in Canada has added another route for traders seeking exposure. The question for buyers searching for the best crypto presale is whether the bigger asymmetric opportunity now sits somewhere before public price discovery begins. DigiTap is built around precisely that stage. Instead of asking retail to buy a token and wait for a roadmap to become a product, its beta app is already available while $TAP remains in Round 4.
DigiTap Adds Utility to the Early-Entry Formula
Meme coins can produce explosive moves when community momentum catches fire, but DigiTap is targeting a different market. Its ecosystem combines crypto wallets, cards, and payment functionality, creating a product that can attract users independently of speculation around $TAP.
That product-proof angle separates DigiTap from many presales. Buyers can already see the ecosystem before the token develops its first public-market chart, with more than 120,000 wallets connected to the presale site and approximately 350 million $TAP already sold. The timing is becoming increasingly important. Round 4 is over 84% complete, and the current $0.0589 price is followed by a $0.0594 presale price. DigiTap also carries a $0.14 listing price, meaning buyers entering now are still positioned considerably earlier in the token’s pricing journey.
A Fixed Supply Gives $TAP a Different Scarcity Story
DigiTap is not relying solely on its app to create interest. $TAP has a fixed maximum supply of 2 billion tokens, and the token contract has been independently audited by Coinsult and SolidProof. The audited design prevents additional TAP from being minted, giving buyers a defined supply ceiling before public trading starts.
The longer-term utility story also connects the app back to the token. Under DigiTap’s token model, 50% of app fee profits are allocated to open-market $TAP buybacks and burns. $TAP also sits inside the ecosystem through staking, cashback, fee discounts, and VIP benefits. For retail buyers, that creates a different proposition from SHIB. Shiba Inu demonstrated what community, scarcity psychology, and early positioning can do for a crypto asset. DigiTap is attempting to combine the same early-entry appeal with a financial product that already exists.
Could DigiTap Become the Best Crypto Presale Story of 2026?
SHIB’s rebound proves meme coins can remain powerful even after major pullbacks, but investors looking for the next Shiba Inu-style early-entry story are unlikely to find the same starting point in a token that has already traded through several market cycles. DigiTap is still before that first public-market phase. More than $11.37 million has already entered the presale, Round 4 is approaching its next pricing step, and the app is downloadable before $TAP reaches exchanges. Waiting may provide more information, but it also means giving up the current presale position that makes the DigiTap story different in the first place.
Click To Visit DigiTap Website To Enter The Presale
FAQs
Is DigiTap the best crypto presale in 2026?
DigiTap stands out by combining more than $11.37 million in presale traction with a downloadable beta app, a fixed 2 billion $TAP supply, and an entry point that remains before public-market price discovery.
What is the current DigiTap presale price?
$TAP is currently priced at $0.0589 in Round 4, with the next presale price displayed at $0.0594. Round 4 is already more than 84% complete.
Could DigiTap deliver returns similar to early Shiba Inu?
DigiTap is targeting the kind of early-entry setup that attracted buyers to SHIB before it became mainstream, but with wallet, card, and payment utility already visible through a working beta app. Its $0.14 listing price gives current presale buyers a clear next pricing milestone to watch.
DISCLAIMER: CAPTAINALTCOIN DOES NOT ENDORSE INVESTING IN ANY PROJECT MENTIONED IN SPONSORED ARTICLES. EXERCISE CAUTION AND DO THOROUGH RESEARCH BEFORE INVESTING YOUR MONEY. CaptainAltcoin takes no responsibility for its accuracy or quality. This content was not written by CaptainAltcoin’s team. We strongly advise readers to do their own thorough research before interacting with any featured companies. The information provided is not financial or legal advice. Neither CaptainAltcoin nor any third party recommends buying or selling any financial products. Investing in crypto assets is high-risk; consider the potential for loss. Any investment decisions made based on this content are at the sole risk of the readCaptainAltcoin is not liable for any damages or losses from using or relying on this content.
The post Best Crypto Presale: Could DigiTap Deliver Next Shiba Inu Returns But With Utility as SHIB Battles Back From a 20% Drop? appeared first on CaptainAltcoin.
Best Crypto Presale: Could DigiTap Deliver Next Shiba Inu Returns but With Utility As SHIB Battle...
Shiba Inu is fighting to rebuild momentum after erasing more than 20% of its late-August gains. SHIB has since pushed back toward $0.0000055, with the meme coin gaining ground again in early September as traders watch whether another community-driven breakout can develop. The problem for anyone chasing the next Shiba Inu is timing. SHIB already has global recognition, deep exchange liquidity, and a mature public chart. DigiTap ($TAP) is approaching the opportunity from the opposite direction, combining a token still in presale with a beta financial app that users can already download. Round 4 is more than 84% complete, over $11.37 million has been raised, and $TAP is currently priced at $0.0589 before its next presale increase.
SHIB Shows Why Early Entry Can Matter More Than the Meme
Shiba Inu became one of crypto’s defining retail stories because its earliest buyers arrived before the token became a mainstream name. That phase cannot simply be recreated now. SHIB may still rally, but new buyers are entering an asset that has already experienced multiple bull cycles and reached enormous valuations during its peak.
September has brought fresh signs of life. SHIB price has recovered from the late-August setback, while new regulated futures access in Canada has added another route for traders seeking exposure. The question for buyers searching for the best crypto presale is whether the bigger asymmetric opportunity now sits somewhere before public price discovery begins. DigiTap is built around precisely that stage. Instead of asking retail to buy a token and wait for a roadmap to become a product, its beta app is already available while $TAP remains in Round 4.
DigiTap Adds Utility to the Early-Entry Formula
Meme coins can produce explosive moves when community momentum catches fire, but DigiTap is targeting a different market. Its ecosystem combines crypto wallets, cards, and payment functionality, creating a product that can attract users independently of speculation around $TAP.
That product-proof angle separates DigiTap from many presales. Buyers can already see the ecosystem before the token develops its first public-market chart, with more than 120,000 wallets connected to the presale site and approximately 350 million $TAP already sold. The timing is becoming increasingly important. Round 4 is over 84% complete, and the current $0.0589 price is followed by a $0.0594 presale price. DigiTap also carries a $0.14 listing price, meaning buyers entering now are still positioned considerably earlier in the token’s pricing journey.
A Fixed Supply Gives $TAP a Different Scarcity Story
DigiTap is not relying solely on its app to create interest. $TAP has a fixed maximum supply of 2 billion tokens, and the token contract has been independently audited by Coinsult and SolidProof. The audited design prevents additional TAP from being minted, giving buyers a defined supply ceiling before public trading starts.
The longer-term utility story also connects the app back to the token. Under DigiTap’s token model, 50% of app fee profits are allocated to open-market $TAP buybacks and burns. $TAP also sits inside the ecosystem through staking, cashback, fee discounts, and VIP benefits. For retail buyers, that creates a different proposition from SHIB. Shiba Inu demonstrated what community, scarcity psychology, and early positioning can do for a crypto asset. DigiTap is attempting to combine the same early-entry appeal with a financial product that already exists.
Could DigiTap Become the Best Crypto Presale Story of 2026?
SHIB’s rebound proves meme coins can remain powerful even after major pullbacks, but investors looking for the next Shiba Inu-style early-entry story are unlikely to find the same starting point in a token that has already traded through several market cycles. DigiTap is still before that first public-market phase. More than $11.37 million has already entered the presale, Round 4 is approaching its next pricing step, and the app is downloadable before $TAP reaches exchanges. Waiting may provide more information, but it also means giving up the current presale position that makes the DigiTap story different in the first place.
Click To Visit DigiTap Website To Enter The Presale
FAQs
Is DigiTap the best crypto presale in 2026?
DigiTap stands out by combining more than $11.37 million in presale traction with a downloadable beta app, a fixed 2 billion $TAP supply, and an entry point that remains before public-market price discovery.
What is the current DigiTap presale price?
$TAP is currently priced at $0.0589 in Round 4, with the next presale price displayed at $0.0594. Round 4 is already more than 84% complete.
Could DigiTap deliver returns similar to early Shiba Inu?
DigiTap is targeting the kind of early-entry setup that attracted buyers to SHIB before it became mainstream, but with wallet, card, and payment utility already visible through a working beta app. Its $0.14 listing price gives current presale buyers a clear next pricing milestone to watch.
DISCLAIMER: CAPTAINALTCOIN DOES NOT ENDORSE INVESTING IN ANY PROJECT MENTIONED IN SPONSORED ARTICLES. EXERCISE CAUTION AND DO THOROUGH RESEARCH BEFORE INVESTING YOUR MONEY. CaptainAltcoin takes no responsibility for its accuracy or quality. This content was not written by CaptainAltcoin’s team. We strongly advise readers to do their own thorough research before interacting with any featured companies. The information provided is not financial or legal advice. Neither CaptainAltcoin nor any third party recommends buying or selling any financial products. Investing in crypto assets is high-risk; consider the potential for loss. Any investment decisions made based on this content are at the sole risk of the readCaptainAltcoin is not liable for any damages or losses from using or relying on this content.
The post Best Crypto Presale: Could DigiTap Deliver Next Shiba Inu Returns But With Utility as SHIB Battles Back From a 20% Drop? appeared first on CaptainAltcoin.
SHIB Shows Why Early Entry Can Matter More Than the Meme
Shiba Inu became one of crypto’s defining retail stories because its earliest buyers arrived before the token became a mainstream name. That phase cannot simply be recreated now. SHIB may still rally, but new buyers are entering an asset that has already experienced multiple bull cycles and reached enormous valuations during its peak.
September has brought fresh signs of life. SHIB price has recovered from the late-August setback, while new regulated futures access in Canada has added another route for traders seeking exposure. The question for buyers searching for the best crypto presale is whether the bigger asymmetric opportunity now sits somewhere before public price discovery begins. DigiTap is built around precisely that stage. Instead of asking retail to buy a token and wait for a roadmap to become a product, its beta app is already available while $TAP remains in Round 4.
DigiTap Adds Utility to the Early-Entry Formula
Meme coins can produce explosive moves when community momentum catches fire, but DigiTap is targeting a different market. Its ecosystem combines crypto wallets, cards, and payment functionality, creating a product that can attract users independently of speculation around $TAP.
That product-proof angle separates DigiTap from many presales. Buyers can already see the ecosystem before the token develops its first public-market chart, with more than 120,000 wallets connected to the presale site and approximately 350 million $TAP already sold. The timing is becoming increasingly important. Round 4 is over 84% complete, and the current $0.0589 price is followed by a $0.0594 presale price. DigiTap also carries a $0.14 listing price, meaning buyers entering now are still positioned considerably earlier in the token’s pricing journey.
A Fixed Supply Gives $TAP a Different Scarcity Story
DigiTap is not relying solely on its app to create interest. $TAP has a fixed maximum supply of 2 billion tokens, and the token contract has been independently audited by Coinsult and SolidProof. The audited design prevents additional TAP from being minted, giving buyers a defined supply ceiling before public trading starts.
The longer-term utility story also connects the app back to the token. Under DigiTap’s token model, 50% of app fee profits are allocated to open-market $TAP buybacks and burns. $TAP also sits inside the ecosystem through staking, cashback, fee discounts, and VIP benefits. For retail buyers, that creates a different proposition from SHIB. Shiba Inu demonstrated what community, scarcity psychology, and early positioning can do for a crypto asset. DigiTap is attempting to combine the same early-entry appeal with a financial product that already exists.
Could DigiTap Become the Best Crypto Presale Story of 2026?
SHIB’s rebound proves meme coins can remain powerful even after major pullbacks, but investors looking for the next Shiba Inu-style early-entry story are unlikely to find the same starting point in a token that has already traded through several market cycles. DigiTap is still before that first public-market phase. More than $11.37 million has already entered the presale, Round 4 is approaching its next pricing step, and the app is downloadable before $TAP reaches exchanges. Waiting may provide more information, but it also means giving up the current presale position that makes the DigiTap story different in the first place.
Click To Visit DigiTap Website To Enter The Presale
FAQs
Is DigiTap the best crypto presale in 2026?
DigiTap stands out by combining more than $11.37 million in presale traction with a downloadable beta app, a fixed 2 billion $TAP supply, and an entry point that remains before public-market price discovery.
What is the current DigiTap presale price?
$TAP is currently priced at $0.0589 in Round 4, with the next presale price displayed at $0.0594. Round 4 is already more than 84% complete.
Could DigiTap deliver returns similar to early Shiba Inu?
DigiTap is targeting the kind of early-entry setup that attracted buyers to SHIB before it became mainstream, but with wallet, card, and payment utility already visible through a working beta app. Its $0.14 listing price gives current presale buyers a clear next pricing milestone to watch.
DISCLAIMER: CAPTAINALTCOIN DOES NOT ENDORSE INVESTING IN ANY PROJECT MENTIONED IN SPONSORED ARTICLES. EXERCISE CAUTION AND DO THOROUGH RESEARCH BEFORE INVESTING YOUR MONEY. CaptainAltcoin takes no responsibility for its accuracy or quality. This content was not written by CaptainAltcoin’s team. We strongly advise readers to do their own thorough research before interacting with any featured companies. The information provided is not financial or legal advice. Neither CaptainAltcoin nor any third party recommends buying or selling any financial products. Investing in crypto assets is high-risk; consider the potential for loss. Any investment decisions made based on this content are at the sole risk of the readCaptainAltcoin is not liable for any damages or losses from using or relying on this content.
The post Best Crypto Presale: Could DigiTap Deliver Next Shiba Inu Returns But With Utility as SHIB Battles Back From a 20% Drop? appeared first on CaptainAltcoin.
1
204
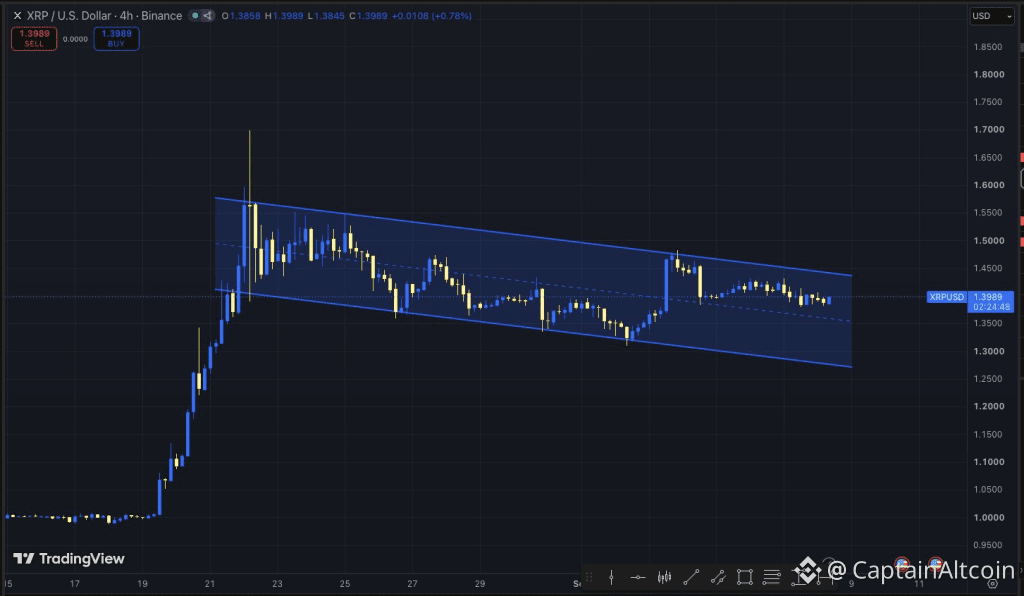
ලිපිය
පරිවර්තනය බලන්න
XRP Price Could Be Getting Ready to Surprise the MarketXRP price is trading around $1.38–$1.40 after dipping roughly 1%–1.5% today, which extends a period of relatively quiet trading following its powerful August rally. The lack of immediate upside may be frustrating bulls, but the technical structure hasn’t produced a decisive breakdown yet.
Two analysts are now watching closely for a breakout. Bird believes XRP remains inside a bull flag that favors continuation higher as long as its channel survives. Ali Martinez, meanwhile, has identified an even shorter-term trigger: an hourly close above $1.40, which he believes could send XRP toward $1.46.
Together, the charts put XRP in an interesting position. Price is sitting near the middle of a broader consolidation while getting increasingly close to levels that could determine its next move.
XRP Bull Flag Remains Intact
Bird’s four-hour chart begins with the explosive rally that carried XRP from around $1 in mid-August to as high as $1.70.
Rather than continuing vertically higher, XRP subsequently entered a downward-sloping channel. The chart shows both the upper and lower boundaries falling gradually, with price repeatedly moving between them.
Bird interprets that structure as a bull flag.
That interpretation matters because bull flags typically form after a strong upward impulse. The initial rally represents the flagpole, while the downward or sideways consolidation allows the market to digest those gains before another potential attempt higher.
In XRP’s case, the flagpole is obvious. Price surged from approximately $1 to $1.70 in only a few days before entering the current channel.
What has happened since is equally important.
Source: X/@Bird_XRPL
Despite multiple selloffs, XRP hasn’t decisively broken beneath the lower boundary of Bird’s channel. Price fell toward approximately $1.31–$1.33 in early September before rebounding strongly toward $1.47.
That recovery demonstrated that buyers were still willing to step in near the bottom of the structure.
XRP has since returned toward $1.40, leaving it roughly in the middle of the channel.
Read also: 3 AI Giants Predict XRP Price at the Peak of the Next Bull Run
What Would Confirm the XRP Bull Flag Breakout?
The most important part of Bird’s chart is the upper boundary.
At the current point in the pattern, that descending resistance appears to sit around $1.43–$1.45. XRP recently tested approximately $1.46–$1.48 but couldn’t establish itself above the channel.
That means the bullish breakout hasn’t been confirmed yet.
A convincing move above roughly $1.44–$1.45 would take XRP through the upper boundary and provide stronger evidence that the consolidation is ending.
The chart then leaves the recent $1.47–$1.50 region as an immediate obstacle. Beyond that, the August price action shows another important area around $1.55–$1.60.
The other side of the setup matters just as much.
XRP BREAKOUT WATCH$XRP appears to be forming a descending triangle on the hourly chart. I'm watching for an hourly close above $1.40. If confirmed, the breakout could trigger a rally toward $1.46. pic.twitter.com/K1RNqYkPnM
— Ali Charts (@alicharts) September 8, 2026
The lower boundary of Bird’s channel is currently around $1.27–$1.30 and continues declining. XRP therefore has room to move lower while technically remaining inside the structure.
That’s what Bird means when he says traders shouldn’t necessarily become concerned simply because XRP moves lower within the channel.
However, a decisive breakdown beneath the lower boundary would be different. At that point, calling the structure an intact bull flag would become considerably harder to defend.
Ali Martinez Watches $1.40 for a Faster Breakout
Ali Martinez is looking at a much shorter timeframe.
According to Martinez, the XRP price appears to be forming a descending triangle on the hourly chart, and he is watching for an hourly close above $1.40.
If that happens, his target is approximately $1.46. His analysis has also been reported alongside XRP trading near $1.39 today.
This creates an interesting sequence when combined with Bird’s four-hour chart.
$1.40 is the first trigger.
If XRP closes above it and Martinez’s setup plays out, price could move toward $1.46.
But approximately $1.43–$1.46 is also where Bird’s larger bull-flag resistance becomes increasingly important.
In other words, Martinez’s $1.46 target could take XRP directly into the area where a more meaningful four-hour breakout would need to occur.
That makes the next few levels relatively straightforward.
XRP first needs to reclaim $1.40 convincingly. It then needs to attack approximately $1.43–$1.46. If buyers can push through that entire region, the larger bull-flag thesis becomes much more interesting.
Subscribe to our YouTube channel for daily crypto updates, market insights, and expert analysis.
The post XRP Price Could Be Getting Ready to Surprise the Market appeared first on CaptainAltcoin.
XRP Price Could Be Getting Ready to Surprise the Market
XRP price is trading around $1.38–$1.40 after dipping roughly 1%–1.5% today, which extends a period of relatively quiet trading following its powerful August rally. The lack of immediate upside may be frustrating bulls, but the technical structure hasn’t produced a decisive breakdown yet.
Two analysts are now watching closely for a breakout. Bird believes XRP remains inside a bull flag that favors continuation higher as long as its channel survives. Ali Martinez, meanwhile, has identified an even shorter-term trigger: an hourly close above $1.40, which he believes could send XRP toward $1.46.
Together, the charts put XRP in an interesting position. Price is sitting near the middle of a broader consolidation while getting increasingly close to levels that could determine its next move.
XRP Bull Flag Remains Intact
Bird’s four-hour chart begins with the explosive rally that carried XRP from around $1 in mid-August to as high as $1.70.
Rather than continuing vertically higher, XRP subsequently entered a downward-sloping channel. The chart shows both the upper and lower boundaries falling gradually, with price repeatedly moving between them.
Bird interprets that structure as a bull flag.
That interpretation matters because bull flags typically form after a strong upward impulse. The initial rally represents the flagpole, while the downward or sideways consolidation allows the market to digest those gains before another potential attempt higher.
In XRP’s case, the flagpole is obvious. Price surged from approximately $1 to $1.70 in only a few days before entering the current channel.
What has happened since is equally important.
Source: X/@Bird_XRPL
Despite multiple selloffs, XRP hasn’t decisively broken beneath the lower boundary of Bird’s channel. Price fell toward approximately $1.31–$1.33 in early September before rebounding strongly toward $1.47.
That recovery demonstrated that buyers were still willing to step in near the bottom of the structure.
XRP has since returned toward $1.40, leaving it roughly in the middle of the channel.
Read also: 3 AI Giants Predict XRP Price at the Peak of the Next Bull Run
What Would Confirm the XRP Bull Flag Breakout?
The most important part of Bird’s chart is the upper boundary.
At the current point in the pattern, that descending resistance appears to sit around $1.43–$1.45. XRP recently tested approximately $1.46–$1.48 but couldn’t establish itself above the channel.
That means the bullish breakout hasn’t been confirmed yet.
A convincing move above roughly $1.44–$1.45 would take XRP through the upper boundary and provide stronger evidence that the consolidation is ending.
The chart then leaves the recent $1.47–$1.50 region as an immediate obstacle. Beyond that, the August price action shows another important area around $1.55–$1.60.
The other side of the setup matters just as much.
XRP BREAKOUT WATCH$XRP appears to be forming a descending triangle on the hourly chart. I'm watching for an hourly close above $1.40. If confirmed, the breakout could trigger a rally toward $1.46. pic.twitter.com/K1RNqYkPnM
— Ali Charts (@alicharts) September 8, 2026
The lower boundary of Bird’s channel is currently around $1.27–$1.30 and continues declining. XRP therefore has room to move lower while technically remaining inside the structure.
That’s what Bird means when he says traders shouldn’t necessarily become concerned simply because XRP moves lower within the channel.
However, a decisive breakdown beneath the lower boundary would be different. At that point, calling the structure an intact bull flag would become considerably harder to defend.
Ali Martinez Watches $1.40 for a Faster Breakout
Ali Martinez is looking at a much shorter timeframe.
According to Martinez, the XRP price appears to be forming a descending triangle on the hourly chart, and he is watching for an hourly close above $1.40.
If that happens, his target is approximately $1.46. His analysis has also been reported alongside XRP trading near $1.39 today.
This creates an interesting sequence when combined with Bird’s four-hour chart.
$1.40 is the first trigger.
If XRP closes above it and Martinez’s setup plays out, price could move toward $1.46.
But approximately $1.43–$1.46 is also where Bird’s larger bull-flag resistance becomes increasingly important.
In other words, Martinez’s $1.46 target could take XRP directly into the area where a more meaningful four-hour breakout would need to occur.
That makes the next few levels relatively straightforward.
XRP first needs to reclaim $1.40 convincingly. It then needs to attack approximately $1.43–$1.46. If buyers can push through that entire region, the larger bull-flag thesis becomes much more interesting.
Subscribe to our YouTube channel for daily crypto updates, market insights, and expert analysis.
The post XRP Price Could Be Getting Ready to Surprise the Market appeared first on CaptainAltcoin.
Two analysts are now watching closely for a breakout. Bird believes XRP remains inside a bull flag that favors continuation higher as long as its channel survives. Ali Martinez, meanwhile, has identified an even shorter-term trigger: an hourly close above $1.40, which he believes could send XRP toward $1.46.
Together, the charts put XRP in an interesting position. Price is sitting near the middle of a broader consolidation while getting increasingly close to levels that could determine its next move.
XRP Bull Flag Remains Intact
Bird’s four-hour chart begins with the explosive rally that carried XRP from around $1 in mid-August to as high as $1.70.
Rather than continuing vertically higher, XRP subsequently entered a downward-sloping channel. The chart shows both the upper and lower boundaries falling gradually, with price repeatedly moving between them.
Bird interprets that structure as a bull flag.
That interpretation matters because bull flags typically form after a strong upward impulse. The initial rally represents the flagpole, while the downward or sideways consolidation allows the market to digest those gains before another potential attempt higher.
In XRP’s case, the flagpole is obvious. Price surged from approximately $1 to $1.70 in only a few days before entering the current channel.
What has happened since is equally important.
Source: X/@Bird_XRPL
Despite multiple selloffs, XRP hasn’t decisively broken beneath the lower boundary of Bird’s channel. Price fell toward approximately $1.31–$1.33 in early September before rebounding strongly toward $1.47.
That recovery demonstrated that buyers were still willing to step in near the bottom of the structure.
XRP has since returned toward $1.40, leaving it roughly in the middle of the channel.
Read also: 3 AI Giants Predict XRP Price at the Peak of the Next Bull Run
What Would Confirm the XRP Bull Flag Breakout?
The most important part of Bird’s chart is the upper boundary.
At the current point in the pattern, that descending resistance appears to sit around $1.43–$1.45. XRP recently tested approximately $1.46–$1.48 but couldn’t establish itself above the channel.
That means the bullish breakout hasn’t been confirmed yet.
A convincing move above roughly $1.44–$1.45 would take XRP through the upper boundary and provide stronger evidence that the consolidation is ending.
The chart then leaves the recent $1.47–$1.50 region as an immediate obstacle. Beyond that, the August price action shows another important area around $1.55–$1.60.
The other side of the setup matters just as much.
XRP BREAKOUT WATCH$XRP appears to be forming a descending triangle on the hourly chart. I'm watching for an hourly close above $1.40. If confirmed, the breakout could trigger a rally toward $1.46. pic.twitter.com/K1RNqYkPnM
— Ali Charts (@alicharts) September 8, 2026
The lower boundary of Bird’s channel is currently around $1.27–$1.30 and continues declining. XRP therefore has room to move lower while technically remaining inside the structure.
That’s what Bird means when he says traders shouldn’t necessarily become concerned simply because XRP moves lower within the channel.
However, a decisive breakdown beneath the lower boundary would be different. At that point, calling the structure an intact bull flag would become considerably harder to defend.
Ali Martinez Watches $1.40 for a Faster Breakout
Ali Martinez is looking at a much shorter timeframe.
According to Martinez, the XRP price appears to be forming a descending triangle on the hourly chart, and he is watching for an hourly close above $1.40.
If that happens, his target is approximately $1.46. His analysis has also been reported alongside XRP trading near $1.39 today.
This creates an interesting sequence when combined with Bird’s four-hour chart.
$1.40 is the first trigger.
If XRP closes above it and Martinez’s setup plays out, price could move toward $1.46.
But approximately $1.43–$1.46 is also where Bird’s larger bull-flag resistance becomes increasingly important.
In other words, Martinez’s $1.46 target could take XRP directly into the area where a more meaningful four-hour breakout would need to occur.
That makes the next few levels relatively straightforward.
XRP first needs to reclaim $1.40 convincingly. It then needs to attack approximately $1.43–$1.46. If buyers can push through that entire region, the larger bull-flag thesis becomes much more interesting.
Subscribe to our YouTube channel for daily crypto updates, market insights, and expert analysis.
The post XRP Price Could Be Getting Ready to Surprise the Market appeared first on CaptainAltcoin.
1
266
ලිපිය
පරිවර්තනය බලන්න
Rain Expands Global Payouts to More Than 80 Countries in 50 CurrenciesPayouts build on Rain’s existing money movement technology, which enables partners to offer virtual accounts, onramps, and offramps and give users even more ways to spend stablecoins
Key facts
Rain’s expanded global payouts capability broadens its money movement technology.
Rain’s partners can now support payouts to more than 80 countries in 50 currencies from stablecoins, with expansion to 95 countries and more than 60 currencies by the end of the year.
Global payouts support business-to-business (B2B), business-to-consumer (B2C), consumer-to-consumer (C2C), and consumer-to-business (C2B) transactions, whether a partner is sending funds to their own account or to someone else’s.
Global payouts are available now for select beta partners, with broader availability expected by the end of the year.
/PRNewswire/ — Rain, the enterprise-grade infrastructure for stablecoin payments, announced today an expansion of its global money movement technology platform, enabling partners to send payouts to more than 80 countries in 50 currencies, and plans to reach 95 countries and more than 60 currencies by the end of the year. The expanded capability gives Rain’s partners one way to pay others in the currency they actually use, from a single stablecoin balance. It supports business-to-business (B2B), business-to-consumer (B2C), consumer-to-consumer (C2C), and consumer-to-business (C2B) payouts, whether a partner is sending funds to their own account or to someone else’s.
Rain’s global payouts capability closes the last-mile gap for stablecoins by connecting onchain infrastructure with legacy rails. Partners fund payouts directly from the stablecoin balances they already hold, and Rain orchestrates the conversion of stablecoins to local currency through licensed partners.
Stablecoin cards were Rain’s original answer to making stablecoins spendable in the real world. The purchase is authorized like any other card transaction at the point of sale, but behind the scenes, Rain settles with the card networks in stablecoins, while the merchant gets paid in fiat. But card transactions represent just one way users want to use their stablecoins. A business in Bogotá still needs to pay a supplier in Lisbon. A contractor in Buenos Aires still needs pesos to pay their landlord for rent.
An expansion across pay-ins and payouts
Virtual accounts already let partners move money between fiat and stablecoins, covering both pay-ins and payouts. Rain’s global payouts extend the payout side of that stack to local currencies and local rails in more than 80 countries.
Together, the two capabilities mean a partner can bring pesos onchain through a virtual account in Mexico, hold them as stablecoins, and separately initiate a payout to a vendor in Argentina. Once the payout is initiated, a licensed partner would deliver Argentine pesos to the recipient’s bank account.
“Partners don’t want to stitch together several vendors every time they need to pay someone in a new country,” said Charles Yoo-Naut, CTO and co-founder of Rain. “They want one platform that powers the whole flow of funds, from stablecoins to local currency, wherever that money needs to land. Rain’s global payouts product is the next step in building that platform.”
Built for how partners actually move money
Rain built global payouts around the flows its partners already need it for:
Neobanks can offer money movement and payments services to their own consumer or business customers, without building and maintaining local banking relationships in every market themselves.
Marketplaces can pay a global base of sellers and drivers in their local currencies from a single stablecoin balance instead of prefunding an account in every country they operate in.
Contractor platforms can distribute payments to freelancers across borders, regardless of where they live.
Businesses can pay suppliers abroad from their onchain balance without requiring that vendor to accept stablecoins.
Settlement time depends on the rail and the destination. Many corridors settle in real time, others take up to two business days.
Rolling out now
Global payouts is live today with a select group of beta partners, and will roll out more broadly across Rain’s partner base over the coming months. Interested partners can work with their Account Manager to join the beta program and interested prospects can contact Partnerships at sales@rain.xyz.
Frequently Asked Questions
Question: What are global payouts?
Answer: Global payouts are the latest capability in Rain’s global money movement product suite. It lets partners send money to recipients in more than 80 countries and 50 currencies, landing as local currency in the recipient’s own bank account, with plans to reach 95 countries and more than 60 currencies by the end of the year. The capability covers business-to-business (B2B), business-to-consumer (B2C), consumer-to-consumer (C2C), and consumer-to-business (C2B) payouts, whether a partner is sending funds to their own account or to someone else’s. Global payouts is live today with a select group of Rain partners and will expand to new partners over the coming months.
Question: What kinds of payments does Rain global payouts support?
Answer: Rain supports business-to-business, business-to-consumer, consumer-to-consumer, and consumer-to-business payouts. Common use cases include marketplace seller payouts, contractor payments, consumer payments, and supplier or vendor payments.
Question: Does Rain offer more than stablecoin cards?
Answer: Yes. Rain enables card issuing, rewards, embedded wallets, virtual accounts, and on/offramps via one platform. Expanding global payout capabilities means partners get the convenience of a single stack, with the flexibility and modularity to use only the pieces they need underneath it.
Question: What are Rain’s money movement capabilities?
Answer: Rain provides a full suite of money movement technology, enabling partners to access global payouts, onramps and offramps, and virtual accounts in several currencies. Virtual accounts already support both pay-ins and payouts, moving money between fiat and stablecoins in multiple currencies. Global payouts expands the payout side of that stack specifically, extending Rain’s reach to local-currency payouts across more than 80 countries through local payment rails.
Question: Who are global payouts built for?
Answer: Partners with a global base of recipients to pay: marketplaces paying sellers and drivers, contractor platforms hiring across borders, businesses paying suppliers and vendors abroad, and neobanks offering money movement services to their own consumer or business customers.
About Rain
Rain is the global stablecoin payments platform for enterprises, neobanks, platforms, developers, and AI agents. Our technology allows partners to move, store, and use stablecoins instantly and compliantly through global payment cards, rewards, on/offramps, stablecoin and fiat wallets, and cross-border rails. As both a Visa and Mastercard Principal Member, Rain issues cards that work at more than 175 million merchant locations in over 200 countries and territories. Built natively for stablecoins and trusted by more than 100 organizations worldwide, Rain delivers secure, scalable infrastructure that makes money move freely and instantly around the world. Learn more at https://www.rain.xyz/.
Media Contact:
Joseph Gallo
Communications Director, Rain
joseph@rain.xyz
The post Rain Expands Global Payouts to More than 80 Countries in 50 Currencies appeared first on CaptainAltcoin.
Rain Expands Global Payouts to More Than 80 Countries in 50 Currencies
Payouts build on Rain’s existing money movement technology, which enables partners to offer virtual accounts, onramps, and offramps and give users even more ways to spend stablecoins
Key facts
Rain’s expanded global payouts capability broadens its money movement technology.
Rain’s partners can now support payouts to more than 80 countries in 50 currencies from stablecoins, with expansion to 95 countries and more than 60 currencies by the end of the year.
Global payouts support business-to-business (B2B), business-to-consumer (B2C), consumer-to-consumer (C2C), and consumer-to-business (C2B) transactions, whether a partner is sending funds to their own account or to someone else’s.
Global payouts are available now for select beta partners, with broader availability expected by the end of the year.
/PRNewswire/ — Rain, the enterprise-grade infrastructure for stablecoin payments, announced today an expansion of its global money movement technology platform, enabling partners to send payouts to more than 80 countries in 50 currencies, and plans to reach 95 countries and more than 60 currencies by the end of the year. The expanded capability gives Rain’s partners one way to pay others in the currency they actually use, from a single stablecoin balance. It supports business-to-business (B2B), business-to-consumer (B2C), consumer-to-consumer (C2C), and consumer-to-business (C2B) payouts, whether a partner is sending funds to their own account or to someone else’s.
Rain’s global payouts capability closes the last-mile gap for stablecoins by connecting onchain infrastructure with legacy rails. Partners fund payouts directly from the stablecoin balances they already hold, and Rain orchestrates the conversion of stablecoins to local currency through licensed partners.
Stablecoin cards were Rain’s original answer to making stablecoins spendable in the real world. The purchase is authorized like any other card transaction at the point of sale, but behind the scenes, Rain settles with the card networks in stablecoins, while the merchant gets paid in fiat. But card transactions represent just one way users want to use their stablecoins. A business in Bogotá still needs to pay a supplier in Lisbon. A contractor in Buenos Aires still needs pesos to pay their landlord for rent.
An expansion across pay-ins and payouts
Virtual accounts already let partners move money between fiat and stablecoins, covering both pay-ins and payouts. Rain’s global payouts extend the payout side of that stack to local currencies and local rails in more than 80 countries.
Together, the two capabilities mean a partner can bring pesos onchain through a virtual account in Mexico, hold them as stablecoins, and separately initiate a payout to a vendor in Argentina. Once the payout is initiated, a licensed partner would deliver Argentine pesos to the recipient’s bank account.
“Partners don’t want to stitch together several vendors every time they need to pay someone in a new country,” said Charles Yoo-Naut, CTO and co-founder of Rain. “They want one platform that powers the whole flow of funds, from stablecoins to local currency, wherever that money needs to land. Rain’s global payouts product is the next step in building that platform.”
Built for how partners actually move money
Rain built global payouts around the flows its partners already need it for:
Neobanks can offer money movement and payments services to their own consumer or business customers, without building and maintaining local banking relationships in every market themselves.
Marketplaces can pay a global base of sellers and drivers in their local currencies from a single stablecoin balance instead of prefunding an account in every country they operate in.
Contractor platforms can distribute payments to freelancers across borders, regardless of where they live.
Businesses can pay suppliers abroad from their onchain balance without requiring that vendor to accept stablecoins.
Settlement time depends on the rail and the destination. Many corridors settle in real time, others take up to two business days.
Rolling out now
Global payouts is live today with a select group of beta partners, and will roll out more broadly across Rain’s partner base over the coming months. Interested partners can work with their Account Manager to join the beta program and interested prospects can contact Partnerships at sales@rain.xyz.
Frequently Asked Questions
Question: What are global payouts?
Answer: Global payouts are the latest capability in Rain’s global money movement product suite. It lets partners send money to recipients in more than 80 countries and 50 currencies, landing as local currency in the recipient’s own bank account, with plans to reach 95 countries and more than 60 currencies by the end of the year. The capability covers business-to-business (B2B), business-to-consumer (B2C), consumer-to-consumer (C2C), and consumer-to-business (C2B) payouts, whether a partner is sending funds to their own account or to someone else’s. Global payouts is live today with a select group of Rain partners and will expand to new partners over the coming months.
Question: What kinds of payments does Rain global payouts support?
Answer: Rain supports business-to-business, business-to-consumer, consumer-to-consumer, and consumer-to-business payouts. Common use cases include marketplace seller payouts, contractor payments, consumer payments, and supplier or vendor payments.
Question: Does Rain offer more than stablecoin cards?
Answer: Yes. Rain enables card issuing, rewards, embedded wallets, virtual accounts, and on/offramps via one platform. Expanding global payout capabilities means partners get the convenience of a single stack, with the flexibility and modularity to use only the pieces they need underneath it.
Question: What are Rain’s money movement capabilities?
Answer: Rain provides a full suite of money movement technology, enabling partners to access global payouts, onramps and offramps, and virtual accounts in several currencies. Virtual accounts already support both pay-ins and payouts, moving money between fiat and stablecoins in multiple currencies. Global payouts expands the payout side of that stack specifically, extending Rain’s reach to local-currency payouts across more than 80 countries through local payment rails.
Question: Who are global payouts built for?
Answer: Partners with a global base of recipients to pay: marketplaces paying sellers and drivers, contractor platforms hiring across borders, businesses paying suppliers and vendors abroad, and neobanks offering money movement services to their own consumer or business customers.
About Rain
Rain is the global stablecoin payments platform for enterprises, neobanks, platforms, developers, and AI agents. Our technology allows partners to move, store, and use stablecoins instantly and compliantly through global payment cards, rewards, on/offramps, stablecoin and fiat wallets, and cross-border rails. As both a Visa and Mastercard Principal Member, Rain issues cards that work at more than 175 million merchant locations in over 200 countries and territories. Built natively for stablecoins and trusted by more than 100 organizations worldwide, Rain delivers secure, scalable infrastructure that makes money move freely and instantly around the world. Learn more at https://www.rain.xyz/.
Media Contact:
Joseph Gallo
Communications Director, Rain
joseph@rain.xyz
The post Rain Expands Global Payouts to More than 80 Countries in 50 Currencies appeared first on CaptainAltcoin.
Key facts
Rain’s expanded global payouts capability broadens its money movement technology.
Rain’s partners can now support payouts to more than 80 countries in 50 currencies from stablecoins, with expansion to 95 countries and more than 60 currencies by the end of the year.
Global payouts support business-to-business (B2B), business-to-consumer (B2C), consumer-to-consumer (C2C), and consumer-to-business (C2B) transactions, whether a partner is sending funds to their own account or to someone else’s.
Global payouts are available now for select beta partners, with broader availability expected by the end of the year.
/PRNewswire/ — Rain, the enterprise-grade infrastructure for stablecoin payments, announced today an expansion of its global money movement technology platform, enabling partners to send payouts to more than 80 countries in 50 currencies, and plans to reach 95 countries and more than 60 currencies by the end of the year. The expanded capability gives Rain’s partners one way to pay others in the currency they actually use, from a single stablecoin balance. It supports business-to-business (B2B), business-to-consumer (B2C), consumer-to-consumer (C2C), and consumer-to-business (C2B) payouts, whether a partner is sending funds to their own account or to someone else’s.
Rain’s global payouts capability closes the last-mile gap for stablecoins by connecting onchain infrastructure with legacy rails. Partners fund payouts directly from the stablecoin balances they already hold, and Rain orchestrates the conversion of stablecoins to local currency through licensed partners.
Stablecoin cards were Rain’s original answer to making stablecoins spendable in the real world. The purchase is authorized like any other card transaction at the point of sale, but behind the scenes, Rain settles with the card networks in stablecoins, while the merchant gets paid in fiat. But card transactions represent just one way users want to use their stablecoins. A business in Bogotá still needs to pay a supplier in Lisbon. A contractor in Buenos Aires still needs pesos to pay their landlord for rent.
An expansion across pay-ins and payouts
Virtual accounts already let partners move money between fiat and stablecoins, covering both pay-ins and payouts. Rain’s global payouts extend the payout side of that stack to local currencies and local rails in more than 80 countries.
Together, the two capabilities mean a partner can bring pesos onchain through a virtual account in Mexico, hold them as stablecoins, and separately initiate a payout to a vendor in Argentina. Once the payout is initiated, a licensed partner would deliver Argentine pesos to the recipient’s bank account.
“Partners don’t want to stitch together several vendors every time they need to pay someone in a new country,” said Charles Yoo-Naut, CTO and co-founder of Rain. “They want one platform that powers the whole flow of funds, from stablecoins to local currency, wherever that money needs to land. Rain’s global payouts product is the next step in building that platform.”
Built for how partners actually move money
Rain built global payouts around the flows its partners already need it for:
Neobanks can offer money movement and payments services to their own consumer or business customers, without building and maintaining local banking relationships in every market themselves.
Marketplaces can pay a global base of sellers and drivers in their local currencies from a single stablecoin balance instead of prefunding an account in every country they operate in.
Contractor platforms can distribute payments to freelancers across borders, regardless of where they live.
Businesses can pay suppliers abroad from their onchain balance without requiring that vendor to accept stablecoins.
Settlement time depends on the rail and the destination. Many corridors settle in real time, others take up to two business days.
Rolling out now
Global payouts is live today with a select group of beta partners, and will roll out more broadly across Rain’s partner base over the coming months. Interested partners can work with their Account Manager to join the beta program and interested prospects can contact Partnerships at sales@rain.xyz.
Frequently Asked Questions
Question: What are global payouts?
Answer: Global payouts are the latest capability in Rain’s global money movement product suite. It lets partners send money to recipients in more than 80 countries and 50 currencies, landing as local currency in the recipient’s own bank account, with plans to reach 95 countries and more than 60 currencies by the end of the year. The capability covers business-to-business (B2B), business-to-consumer (B2C), consumer-to-consumer (C2C), and consumer-to-business (C2B) payouts, whether a partner is sending funds to their own account or to someone else’s. Global payouts is live today with a select group of Rain partners and will expand to new partners over the coming months.
Question: What kinds of payments does Rain global payouts support?
Answer: Rain supports business-to-business, business-to-consumer, consumer-to-consumer, and consumer-to-business payouts. Common use cases include marketplace seller payouts, contractor payments, consumer payments, and supplier or vendor payments.
Question: Does Rain offer more than stablecoin cards?
Answer: Yes. Rain enables card issuing, rewards, embedded wallets, virtual accounts, and on/offramps via one platform. Expanding global payout capabilities means partners get the convenience of a single stack, with the flexibility and modularity to use only the pieces they need underneath it.
Question: What are Rain’s money movement capabilities?
Answer: Rain provides a full suite of money movement technology, enabling partners to access global payouts, onramps and offramps, and virtual accounts in several currencies. Virtual accounts already support both pay-ins and payouts, moving money between fiat and stablecoins in multiple currencies. Global payouts expands the payout side of that stack specifically, extending Rain’s reach to local-currency payouts across more than 80 countries through local payment rails.
Question: Who are global payouts built for?
Answer: Partners with a global base of recipients to pay: marketplaces paying sellers and drivers, contractor platforms hiring across borders, businesses paying suppliers and vendors abroad, and neobanks offering money movement services to their own consumer or business customers.
About Rain
Rain is the global stablecoin payments platform for enterprises, neobanks, platforms, developers, and AI agents. Our technology allows partners to move, store, and use stablecoins instantly and compliantly through global payment cards, rewards, on/offramps, stablecoin and fiat wallets, and cross-border rails. As both a Visa and Mastercard Principal Member, Rain issues cards that work at more than 175 million merchant locations in over 200 countries and territories. Built natively for stablecoins and trusted by more than 100 organizations worldwide, Rain delivers secure, scalable infrastructure that makes money move freely and instantly around the world. Learn more at https://www.rain.xyz/.
Media Contact:
Joseph Gallo
Communications Director, Rain
joseph@rain.xyz
The post Rain Expands Global Payouts to More than 80 Countries in 50 Currencies appeared first on CaptainAltcoin.
1
111
තවත් අන්තර්ගතයන් ගවේෂණය කිරීමට ඇතුල් වන්න
Binance චතුරශ්රය හි ගෝලීය ක්රිප්ටෝ පරිශීලකයින් හා එක්වන්න
⚡️ ක්රිප්ටෝ පිළිබඳ නවතම සහ ප්රයෝජනවත් තොරතුරු ලබා ගන්න.
💬 ලොව විශාලතම ක්රිප්ටෝ හුවමාරුව මගින් විශ්වාස කෙරේ.
👍 සත්යායනය කරන ලද නිර්මාණකරුවන්ගෙන් සැබෑ විදසුන් සොයා ගන්න.
විද්යුත් තැපෑල / දුරකථන අංකය
නැගී එන මාතෘකා
USTreasuryToBuyBackUpTo$6BLongDatedDebt
2,565 views
69 සාකච්ඡා කරමින්
#USTreasuryToBuyBackUpTo$6BLongDatedDebt
🚨 අමෙරිකා එක්සත් ජනපද භාණ්ඩාගාරය දීර්ඝ කාලීන ණය වලින් ඩොලර් බිලියන 6ක් දක්වා නැවත මිලදී ගැනීමට සූදානම්
එක්සත් ජනපද භාණ්ඩාගාරය සිය සැප්තැම්බර් 10 වැනි දින පැවැත්වෙන මෙහෙයුමේදී වසර 10 සිට 20 දක්වා කල් පිරෙන භාණ්ඩාගාර බොන්ඩ් වලින් ඩොලර් බිලියන 6ක් දක්වා නැවත මිලදී ගැනීමට සූදානම් වෙමින් සිටී — එය, මීට පෙර සිදු වූ දිර්ඝකාලීන නැවත මිලදී ගැනීමේ ප්රමාණයෙන් දළ වශයෙන් 3 ගුණයකි.
මෙය සිදුවන්නේ දිර්ඝකාලීන භාණ්ඩාගාර ලැබීම් (yields) තියුණු ලෙස ඉහළ ගිය නිසාය; එමඟින් වසර 10 ලැබීම් අත්හැරීම් නොවැම්බර් 2023 සිට ඉහළම මට්ටම වන ආසන්න වශයෙන් 4.85% දක්වා පැමිණ ඇත.
භාණ්ඩාගාරය මෙය කරන්නේ ඇයි?
මෙම නැවත මිලදී ගැනීමේ වැඩසටහන ප්රධාන වශයෙන් පරණ සහ අඩු ද්රවශීල (less-liquid) භාණ්ඩාගාර සුරක්ෂිතතා වලට ද්රවශීලතාව වැඩි කිරීමත්, දිර්ඝ කාලීන බොන්ඩ් වෙළෙඳපොළේ ක්රියාකාරීත්වය (functioning) සඳහා සහාය දීමත් අරමුණු කරගෙනය.
පෙර භාණ්ඩාගාරය ප්රකාශ කර තිබුණේ, දිර්ඝකාලීන නැවත මිලදී ගැනීම් එක් එක් මෙහෙයුමකට පෙර උපරිමය වූ ඩොලර් බිලියන 2 සිට ඉතිරි වන refunding කාල සීමාව පුරා අවම වශයෙන් බිලියන 4 දක්වා වැඩි වන බවයි.
වෙළෙඳපොළට මෙයින් අදහස් කරන්නේ කුමක්ද?
බොන්ඩ්:
වැඩි ප්රමාණයේ නැවත මිලදී ගැනීමක් ඉලක්කගත සුරක්ෂිතතා සඳහා අමතර ඉල්ලුමක් ලබා දී වෙළෙඳපොළේ ද්රවශීලතාව පවත්වා ගැනීමට උපකාරී විය හැක.
ලැබීම් (Yields):
කෙටි කාලීන ප්රතිචාරය පැහැදිලි සැනසුම් රැලියක් (relief rally) වගේ නොවූ බවයි. ප්රකාශයෙන් පසුව වසර 10 ලැබීම් ඉහළ ගියේය; එයින් පෙනෙන්නේ විශාල මැදිහත්වීමක් අපේක්ෂා කළ බව ආයෝජකයන්ට ඇතිව තිබිය හැකි බවයි.
කොටස් (Stocks):
වැඩිවූ දිර්ඝකාලීන ලැබීම් නිසා කොටස් අගයන්ට (equity valuations) මීඩු පීඩනය දිගටම විය හැක. මන්ද, ඉහළ discount rates පੂੰසි වියදම (cost of capital) වැඩි කරයි.
බිට්කොයින් සහ ක්රිප්ටෝ:
මෙතැන තමයි වෙළෙඳුන් අවධානය යොමු කළ යුත්තේ.
භාණ්ඩාගාර ලැබීම් දිගටම පහත වැටීමක් සිදුවුවහොත්, එය අවසානයේ පුළුල් මූල්ය තත්ත්වයන් හොඳ අතට හැරවිය හැකි අතර BTC වැනි අවදානම් සම්පත් (risk assets) සඳහා සහාය විය හැක.
නමුත් අද පැවැත්වෙන නැවත මිලදී ගැනීම ස්වයංක්රීයව bullish crypto catalyst එකක් ලෙස අර්ථකථනය නොකළ යුතුයි.
ප්රධාන වශයෙන් ඉතිරිව ඇති වෙනස්කම් (variables) නම්:
• භාණ්ඩාගාර ලැබීම් (Treasury yields)
• ෆෙඩ් ප්රතිපත්ති අපේක්ෂා
• ඩොලර් ද්රවශීලතාව
• අමෙරිකා එක්සත් ජනපද ණය නිකුත් කිරීම
• ගෝලීය අවදානම් හැඟීම (Global risk sentiment)
ප්රධාන takeaway එක
හෙඩ්ලයින් එක ඩොලර් බිලියන 6ක් ගැනයි; නමුත් ඊට වඩා විශාල කතාව වන්නේ දිර්ඝ කාලීන භාණ්ඩාගාර වෙළෙඳපොළේ පෙනෙන ආතතිය (stress).
විශාල නැවත මිලදී ගැනීම් තිබුණත් ලැබීම් දිගටම ඉහළ ගියහොත් වෙළෙඳපොළ වඩාත් සංවේදීව (cautious) ඉන්න පුළුවන්.
භාණ්ඩාගාරයේ ද්රවශීලතාව වැඩි වී ලැබීම් පහතට යමින් ප්රවණතාවක් (trending lower) ගත්තොත්, අවදානම් සම්පත් අවසානයේ ප්රතිලාභ ලබන්න පුළුවන්.
$IOST $KAT $COTI
顾清妍
·0 කැමත්ත දැක්වීම්
·7 views
BitcoinSurpasses$79K
31,962 views
196 සාකච්ඡා කරමින්
BrentCrudeTops$100
90,413 views
317 සාකච්ඡා කරමින්