
Bit_Guru
42.4k පෝස්ටු

Bit_Guru
 Binance චතුරශ්ර සත්යාපිත+
වාර්තා කරන්න
පරිශීලක අවහිර කරන්න
Only Live Trader on Binance Square 💛 // Binance, CMC & X kols handle @bitgu_ru // PnL is always Live

Live Trader

Creator Awards 2024
විවෘත වෙළෙඳාම
නිතර වෙළෙන්දා
{වේලාව} වසර
63 හඹා යමින්
156.6K+ හඹා යන්නන්
300.5K+ කැමති විය
3 ලාංජනය
පෝස්ටු
ආයෝජන කළඹ
සියල්ල
උපුටා දැක්වීම්
වීඩියෝ
සජීවි
අමුණා ඇත
·
--
ලිපිය
$17කින් පමණක් $100 උපයන්න පුළුවන්ද?ඉතා විශාල ගිණුමක් තිබිය යුතුයි කියලා බොහෝ දෙනා සිතනවා සැබෑ මුදල් උපයන්න trading වලදී. එහෙම නෑ. සත්යය සරලයි—ඔයා ආරම්භ කරන මුදල කොච්චරද කියන එක නෙමෙයි; ඔයාට ඇති දේ හොඳට කළමනාකරණය කරනවාද කියන එකයි.
ඔව්, ඩොලර් 17 සිට ඩොලර් 100 දක්වා වර්ධනය කරගැනීම මුළුමනින්ම හැකි දෙයක්. නමුත් වාසනාවෙන් නෙමෙයි, සූදුවෙන් නෙමෙයි, තවද ඔයා දකින හැම pump එක පස්සේ දුවන එකෙන්වත් නෙමෙයි. ඒ සඳහා ශિસ્ત, ඉවසීම, සහ පැහැදිලි සැලැස්මක් අවශ්යයි.
පළමුව, ඔබට තේරුම්ගන්න ඕන එක දෙයක් තියෙනවා: කුඩා මුලික ප්රාග්ධනයක් තිබෙන විට බුද්ධිමත් ක්රියාවලියක් අවශ්යයි. ඔබට විශාල වැරදි කරගන්න බැහැ. වැඩි අවදානමක් තියෙන නරක එක් trade එකකින්වත් ඔබේ ගිණුම නැතිවෙලා යන්න පුළුවන්. ඒ නිසා risk management තමයි ඔබේ ශක්තිමත්ම ආයුධය වන්නේ.
$17කින් පමණක් $100 උපයන්න පුළුවන්ද?
ඉතා විශාල ගිණුමක් තිබිය යුතුයි කියලා බොහෝ දෙනා සිතනවා සැබෑ මුදල් උපයන්න trading වලදී. එහෙම නෑ. සත්යය සරලයි—ඔයා ආරම්භ කරන මුදල කොච්චරද කියන එක නෙමෙයි; ඔයාට ඇති දේ හොඳට කළමනාකරණය කරනවාද කියන එකයි.
ඔව්, ඩොලර් 17 සිට ඩොලර් 100 දක්වා වර්ධනය කරගැනීම මුළුමනින්ම හැකි දෙයක්. නමුත් වාසනාවෙන් නෙමෙයි, සූදුවෙන් නෙමෙයි, තවද ඔයා දකින හැම pump එක පස්සේ දුවන එකෙන්වත් නෙමෙයි. ඒ සඳහා ශિસ્ત, ඉවසීම, සහ පැහැදිලි සැලැස්මක් අවශ්යයි.
පළමුව, ඔබට තේරුම්ගන්න ඕන එක දෙයක් තියෙනවා: කුඩා මුලික ප්රාග්ධනයක් තිබෙන විට බුද්ධිමත් ක්රියාවලියක් අවශ්යයි. ඔබට විශාල වැරදි කරගන්න බැහැ. වැඩි අවදානමක් තියෙන නරක එක් trade එකකින්වත් ඔබේ ගිණුම නැතිවෙලා යන්න පුළුවන්. ඒ නිසා risk management තමයි ඔබේ ශක්තිමත්ම ආයුධය වන්නේ.
ඔව්, ඩොලර් 17 සිට ඩොලර් 100 දක්වා වර්ධනය කරගැනීම මුළුමනින්ම හැකි දෙයක්. නමුත් වාසනාවෙන් නෙමෙයි, සූදුවෙන් නෙමෙයි, තවද ඔයා දකින හැම pump එක පස්සේ දුවන එකෙන්වත් නෙමෙයි. ඒ සඳහා ශિસ્ત, ඉවසීම, සහ පැහැදිලි සැලැස්මක් අවශ්යයි.
පළමුව, ඔබට තේරුම්ගන්න ඕන එක දෙයක් තියෙනවා: කුඩා මුලික ප්රාග්ධනයක් තිබෙන විට බුද්ධිමත් ක්රියාවලියක් අවශ්යයි. ඔබට විශාල වැරදි කරගන්න බැහැ. වැඩි අවදානමක් තියෙන නරක එක් trade එකකින්වත් ඔබේ ගිණුම නැතිවෙලා යන්න පුළුවන්. ඒ නිසා risk management තමයි ඔබේ ශක්තිමත්ම ආයුධය වන්නේ.
312
55
744
689k
අමුණා ඇත
·
--
උසබ තත්ත්වය
ක්රිප්ටෝ වෙළෙඳපොළ තුළ වසර 4ක් ගත කරලා මේ දේවල් මට වැටහුණා. ඒ වගේම කියවීමට ඔබට අවශ්ය වෙන්නේ මිනිත්තු 2ක් විතරයි: 🤏
1. වෙළෙඳපොළ තත්වය කුමක් වුණත්, එක දෙයක් නියතයි: පුද්ගලයන්ගෙන් 8%ක් 21 මිලියන Bitcoin එකක් සතු කරගෙන ඉන්නවා.
2. මූල්ය, ප්රාග්ධන හා අවදානම් කළමනාකරණ කුසලතා තාක්ෂණික විශ්ලේෂණය හෝ ක්රිප්ටෝ පර්යේෂණයට වඩා 100 ගුණයකින් වැදගත්.
3. නිදාගෙනත් උපයන්න: ක්රිප්ටෝ වෙළෙඳපොළ තුළ සක්රීයව වෙළෙඳාම් නොකරම මුදල් උපයන්න විවිධ ක්රම තියෙනවා.
සාමාන්යයෙන් #Bitcoin has වසර 15ක් පුරා වසරකට 100%කට වඩා වැඩි වී ඇත. නමුත් ඇයි මේතරම් අය අඩුද මුදල් හොයන්නේ? ඉක්මනින් පොහොසත් වෙන්න කියන මානසිකත්වය සාමාන්ය දෙයක් නිසා. ඔබට දිනකට අවම වශයෙන් පැය 4ක් ක්රිප්ටෝ සඳහා කැප කළ නොහැකි නම්—Bitcoin සහ ETH වලටම හුරුවෙන්න: BTC 70%ක් සහ ETH 30%ක්.
කිසිම කෙනෙකු විශ්වාස නොකරන්න: විශ්වාසය බලාපොරොත්තුව, අධෛර්යය සහ වැරදි වලට මඟපාදනවා. තනිවම ඉගෙනගෙන ඔබේ ක්රියාවන් වෙනුවෙන් ඔබම වගකියන්න. මේකයි ස්වයංක්රීය minting අත්දැකීම ලබාගන්න හැටි!
ආයෝජනයේ අවසාන අරමුණ: ජීවිතය තවත් අර්ථවත් කරගන්න. ක්රිප්ටෝ ආයෝජනයෙන් ඒක කරගන්න පුළුවන්ද නම්—කරන්න. නැත්නම් නැවත සිතා බලන්න.
ක්රිප්ටෝ දැන් මූල්ය වෙළෙඳපොළක්: මුලින්ම තාක්ෂණයෙන් උපන් දෙයක් වුවත්, දැන් එය මැක්රෝ ආර්ථිකයට බලපාන අතර ප්රධාන මූල්ය වෙළෙඳපොළවලට සම්බන්ධ වෙලා.
කෙනෙක් ඔබට Bitcoin මිලදීගන්න එපා කියලා අධෛර්ය කරයි, නමුත් මතක තියාගන්න—කිසිම දෙයක් පුළුල් ලෙස පිළිගැනීමට ලැබුණාම ඒ අවස්ථාව නැතිවෙලා යන්න පුළුවන්. දැන්ම ඔබේ අවස්ථාව ගන්න!
දක්ෂ ලෙස ආයෝජනය කරන්න, අර්ථවත් තීරණ ගන්න, සහ ක්රිප්ටෝවට වඩා හොඳ අනාගතයකට මඟ සකස් කරන්න ඉඩ දෙන්න.
#CryptoInvesting #ethbeta #Write2Earn! #BinanceTurns7 $BTC $ETH $SOL
{spot}(SOLUSDT)
{spot}(ETHUSDT)
{spot}(BTCUSDT)
ක්රිප්ටෝ වෙළෙඳපොළ තුළ වසර 4ක් ගත කරලා මේ දේවල් මට වැටහුණා. ඒ වගේම කියවීමට ඔබට අවශ්ය වෙන්නේ මිනිත්තු 2ක් විතරයි: 🤏
1. වෙළෙඳපොළ තත්වය කුමක් වුණත්, එක දෙයක් නියතයි: පුද්ගලයන්ගෙන් 8%ක් 21 මිලියන Bitcoin එකක් සතු කරගෙන ඉන්නවා.
2. මූල්ය, ප්රාග්ධන හා අවදානම් කළමනාකරණ කුසලතා තාක්ෂණික විශ්ලේෂණය හෝ ක්රිප්ටෝ පර්යේෂණයට වඩා 100 ගුණයකින් වැදගත්.
3. නිදාගෙනත් උපයන්න: ක්රිප්ටෝ වෙළෙඳපොළ තුළ සක්රීයව වෙළෙඳාම් නොකරම මුදල් උපයන්න විවිධ ක්රම තියෙනවා.
සාමාන්යයෙන් #Bitcoin has වසර 15ක් පුරා වසරකට 100%කට වඩා වැඩි වී ඇත. නමුත් ඇයි මේතරම් අය අඩුද මුදල් හොයන්නේ? ඉක්මනින් පොහොසත් වෙන්න කියන මානසිකත්වය සාමාන්ය දෙයක් නිසා. ඔබට දිනකට අවම වශයෙන් පැය 4ක් ක්රිප්ටෝ සඳහා කැප කළ නොහැකි නම්—Bitcoin සහ ETH වලටම හුරුවෙන්න: BTC 70%ක් සහ ETH 30%ක්.
කිසිම කෙනෙකු විශ්වාස නොකරන්න: විශ්වාසය බලාපොරොත්තුව, අධෛර්යය සහ වැරදි වලට මඟපාදනවා. තනිවම ඉගෙනගෙන ඔබේ ක්රියාවන් වෙනුවෙන් ඔබම වගකියන්න. මේකයි ස්වයංක්රීය minting අත්දැකීම ලබාගන්න හැටි!
ආයෝජනයේ අවසාන අරමුණ: ජීවිතය තවත් අර්ථවත් කරගන්න. ක්රිප්ටෝ ආයෝජනයෙන් ඒක කරගන්න පුළුවන්ද නම්—කරන්න. නැත්නම් නැවත සිතා බලන්න.
ක්රිප්ටෝ දැන් මූල්ය වෙළෙඳපොළක්: මුලින්ම තාක්ෂණයෙන් උපන් දෙයක් වුවත්, දැන් එය මැක්රෝ ආර්ථිකයට බලපාන අතර ප්රධාන මූල්ය වෙළෙඳපොළවලට සම්බන්ධ වෙලා.
කෙනෙක් ඔබට Bitcoin මිලදීගන්න එපා කියලා අධෛර්ය කරයි, නමුත් මතක තියාගන්න—කිසිම දෙයක් පුළුල් ලෙස පිළිගැනීමට ලැබුණාම ඒ අවස්ථාව නැතිවෙලා යන්න පුළුවන්. දැන්ම ඔබේ අවස්ථාව ගන්න!
දක්ෂ ලෙස ආයෝජනය කරන්න, අර්ථවත් තීරණ ගන්න, සහ ක්රිප්ටෝවට වඩා හොඳ අනාගතයකට මඟ සකස් කරන්න ඉඩ දෙන්න.
#CryptoInvesting #ethbeta #Write2Earn! #BinanceTurns7 $BTC $ETH $SOL
1. වෙළෙඳපොළ තත්වය කුමක් වුණත්, එක දෙයක් නියතයි: පුද්ගලයන්ගෙන් 8%ක් 21 මිලියන Bitcoin එකක් සතු කරගෙන ඉන්නවා.
2. මූල්ය, ප්රාග්ධන හා අවදානම් කළමනාකරණ කුසලතා තාක්ෂණික විශ්ලේෂණය හෝ ක්රිප්ටෝ පර්යේෂණයට වඩා 100 ගුණයකින් වැදගත්.
3. නිදාගෙනත් උපයන්න: ක්රිප්ටෝ වෙළෙඳපොළ තුළ සක්රීයව වෙළෙඳාම් නොකරම මුදල් උපයන්න විවිධ ක්රම තියෙනවා.
සාමාන්යයෙන් #Bitcoin has වසර 15ක් පුරා වසරකට 100%කට වඩා වැඩි වී ඇත. නමුත් ඇයි මේතරම් අය අඩුද මුදල් හොයන්නේ? ඉක්මනින් පොහොසත් වෙන්න කියන මානසිකත්වය සාමාන්ය දෙයක් නිසා. ඔබට දිනකට අවම වශයෙන් පැය 4ක් ක්රිප්ටෝ සඳහා කැප කළ නොහැකි නම්—Bitcoin සහ ETH වලටම හුරුවෙන්න: BTC 70%ක් සහ ETH 30%ක්.
කිසිම කෙනෙකු විශ්වාස නොකරන්න: විශ්වාසය බලාපොරොත්තුව, අධෛර්යය සහ වැරදි වලට මඟපාදනවා. තනිවම ඉගෙනගෙන ඔබේ ක්රියාවන් වෙනුවෙන් ඔබම වගකියන්න. මේකයි ස්වයංක්රීය minting අත්දැකීම ලබාගන්න හැටි!
ආයෝජනයේ අවසාන අරමුණ: ජීවිතය තවත් අර්ථවත් කරගන්න. ක්රිප්ටෝ ආයෝජනයෙන් ඒක කරගන්න පුළුවන්ද නම්—කරන්න. නැත්නම් නැවත සිතා බලන්න.
ක්රිප්ටෝ දැන් මූල්ය වෙළෙඳපොළක්: මුලින්ම තාක්ෂණයෙන් උපන් දෙයක් වුවත්, දැන් එය මැක්රෝ ආර්ථිකයට බලපාන අතර ප්රධාන මූල්ය වෙළෙඳපොළවලට සම්බන්ධ වෙලා.
කෙනෙක් ඔබට Bitcoin මිලදීගන්න එපා කියලා අධෛර්ය කරයි, නමුත් මතක තියාගන්න—කිසිම දෙයක් පුළුල් ලෙස පිළිගැනීමට ලැබුණාම ඒ අවස්ථාව නැතිවෙලා යන්න පුළුවන්. දැන්ම ඔබේ අවස්ථාව ගන්න!
දක්ෂ ලෙස ආයෝජනය කරන්න, අර්ථවත් තීරණ ගන්න, සහ ක්රිප්ටෝවට වඩා හොඳ අනාගතයකට මඟ සකස් කරන්න ඉඩ දෙන්න.
#CryptoInvesting #ethbeta #Write2Earn! #BinanceTurns7 $BTC $ETH $SOL

302
102
2.2k
1.1M
·
--
පරිවර්තනය බලන්න
$ENSO is moving… 🚨🔥 DOWN!
Entry: 0.90685 - 0.90776
SL: 0.91365
TP1: 0.8938 | TP2: 0.88727 | TP3: 0.88075
$ENSO is moving… 🚨🔥 DOWN!
Entry: 0.90685 - 0.90776
SL: 0.91365
TP1: 0.8938 | TP2: 0.88727 | TP3: 0.88075
Entry: 0.90685 - 0.90776
SL: 0.91365
TP1: 0.8938 | TP2: 0.88727 | TP3: 0.88075
6
·
--
පරිවර්තනය බලන්න
Wait wait wait… 🚨 $Q DOWN!
Entry: 0.023904 - 0.023928
SL: 0.024071
TP1: 0.023623 | TP2: 0.023483 | TP3: 0.023342
Wait wait wait… 🚨 $Q DOWN!
Entry: 0.023904 - 0.023928
SL: 0.024071
TP1: 0.023623 | TP2: 0.023483 | TP3: 0.023342
Entry: 0.023904 - 0.023928
SL: 0.024071
TP1: 0.023623 | TP2: 0.023483 | TP3: 0.023342
305
·
--
පරිවර්තනය බලන්න
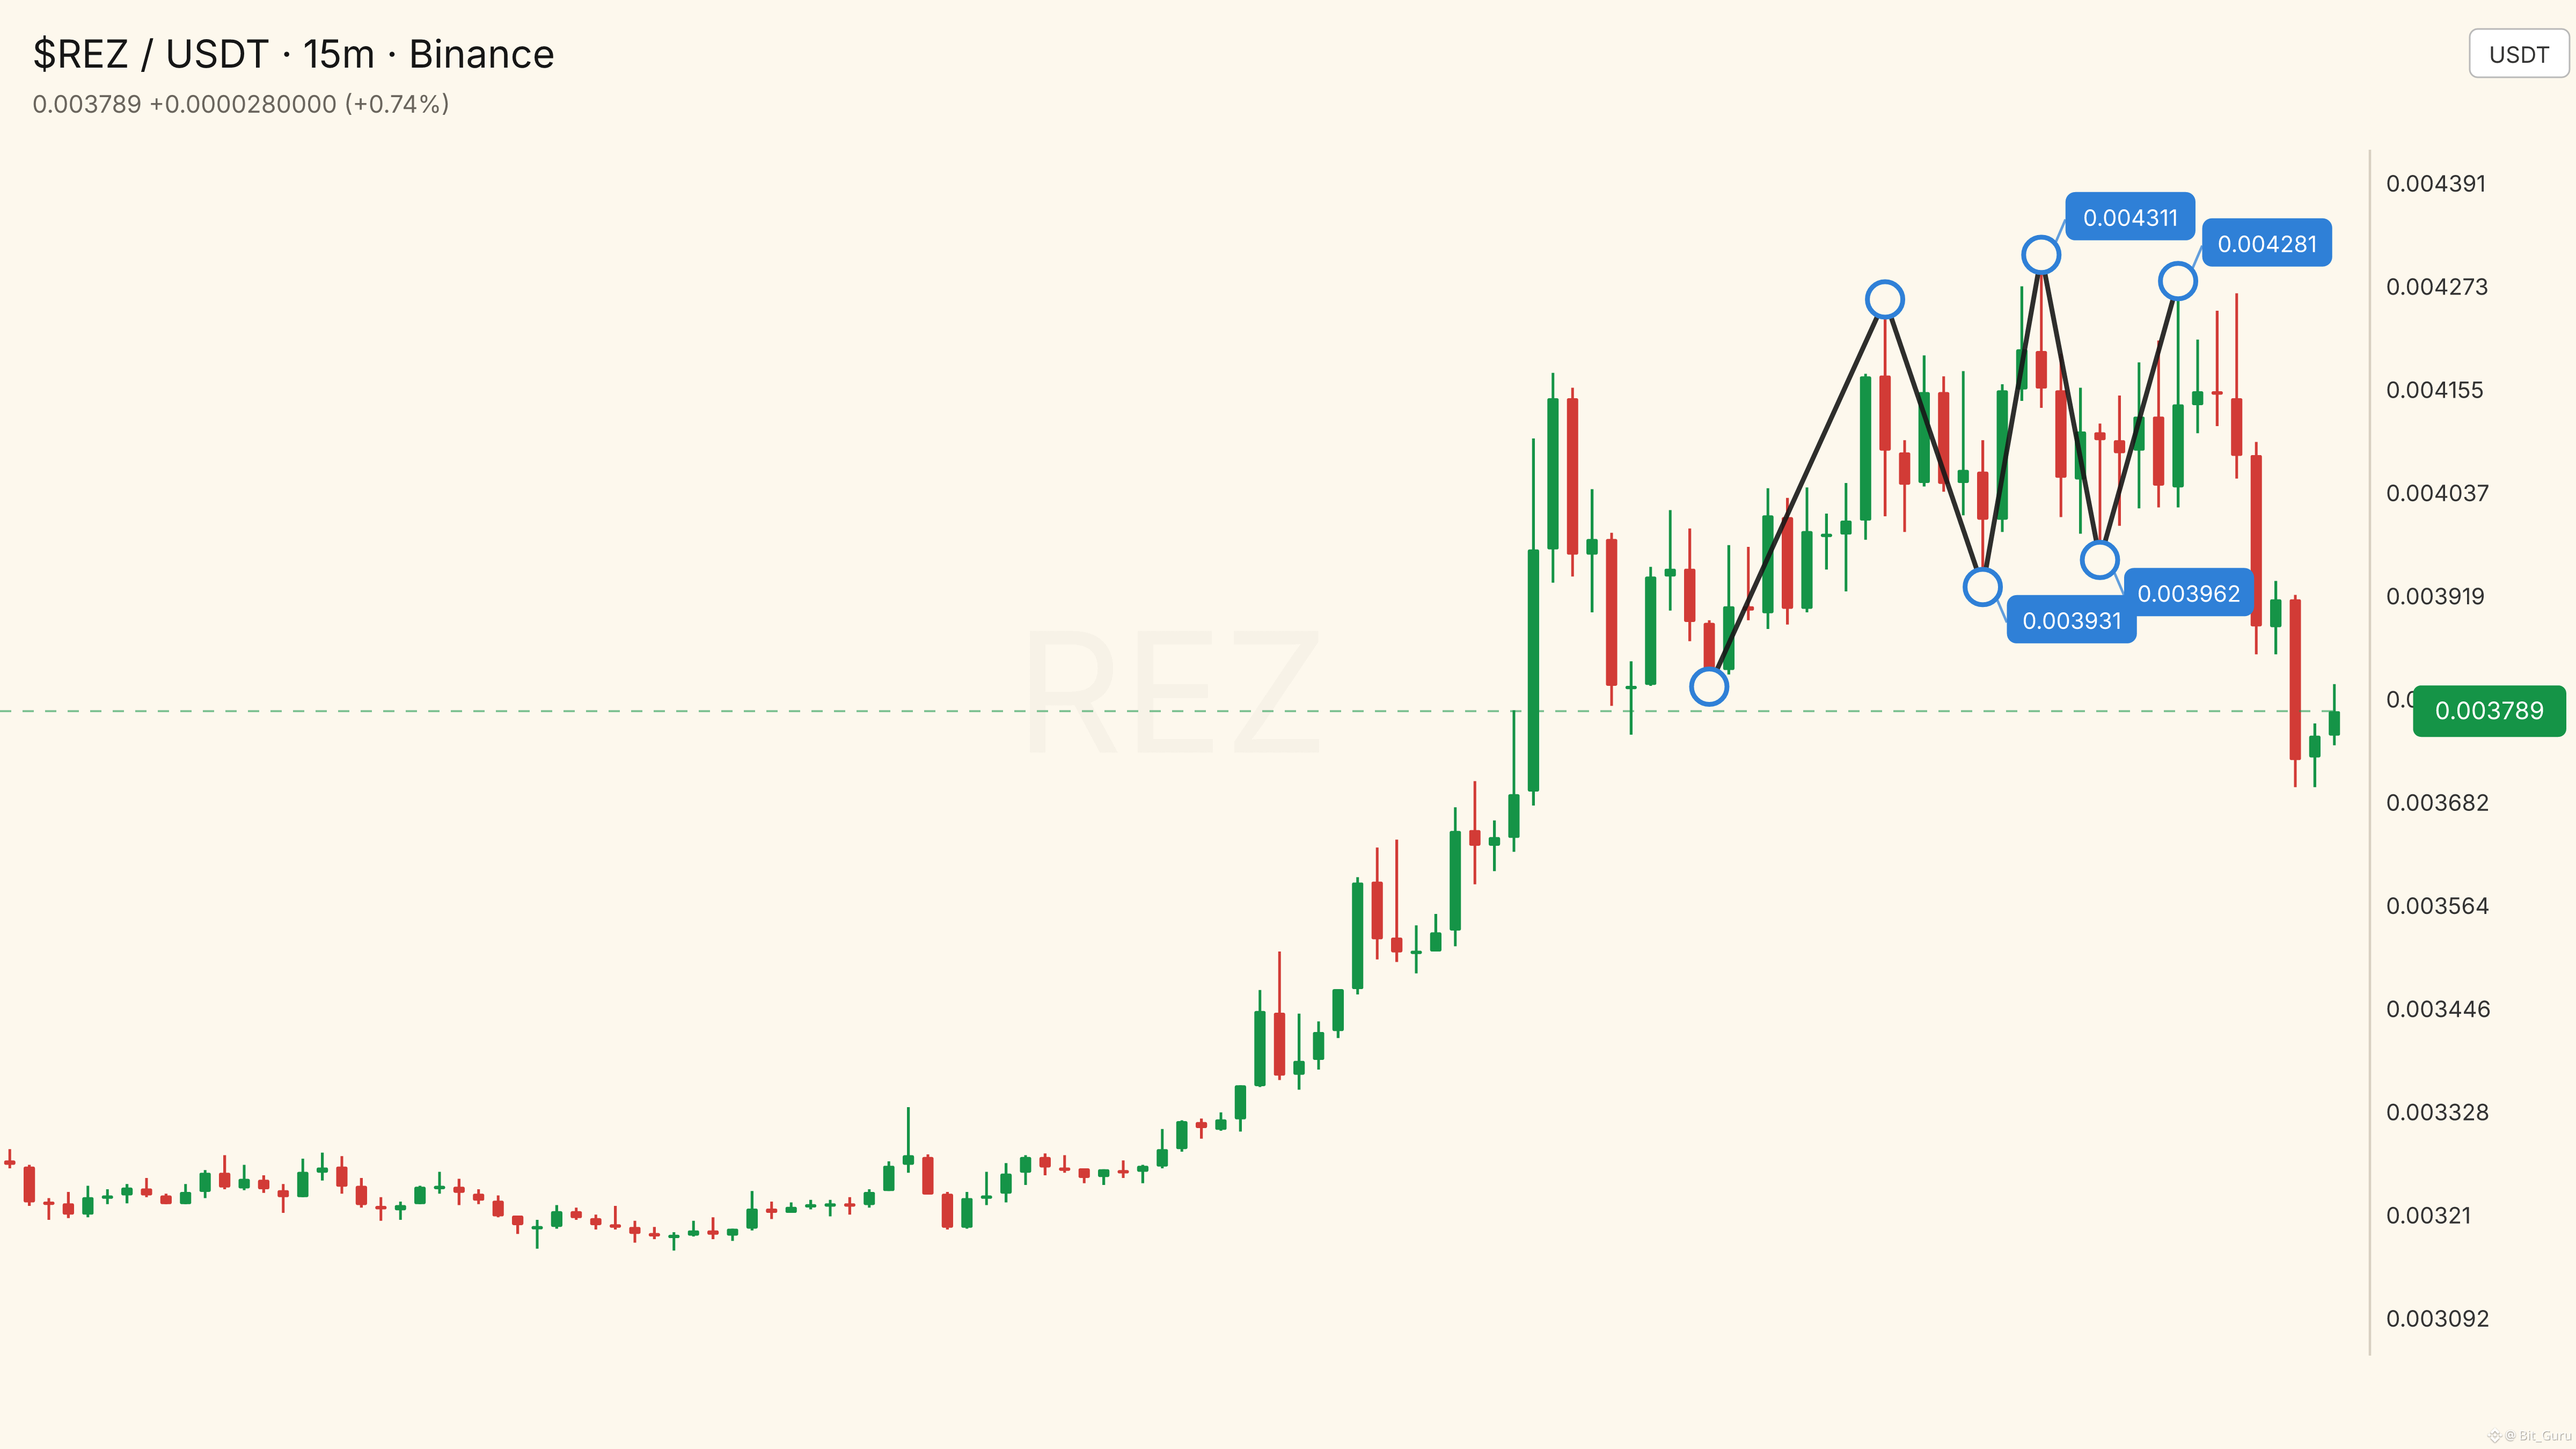
My community, look at $REZ … ✅ DOWN!
Entry: 0.00376688 - 0.00377065
SL: 0.00378632
TP1: 0.00372904 | TP2: 0.00371012 | TP3: 0.00369121
My community, look at $REZ … ✅ DOWN!
Entry: 0.00376688 - 0.00377065
SL: 0.00378632
TP1: 0.00372904 | TP2: 0.00371012 | TP3: 0.00369121
Entry: 0.00376688 - 0.00377065
SL: 0.00378632
TP1: 0.00372904 | TP2: 0.00371012 | TP3: 0.00369121
399
·
--
පරිවර්තනය බලන්න
VELVETUSDT: Bearish Structure Meets a Key Support Zone𝗧𝗵𝗲 𝘀𝗰𝗮𝗻𝗻𝗲𝗿 𝗵𝗮𝘀 𝗽𝘂𝘁 𝗩𝗲𝗹𝘃𝗲𝘁 𝘂𝗻𝗱𝗲𝗿 𝘁𝗵𝗲 𝗺𝗶𝗰𝗿𝗼𝘀𝗰𝗼𝗽𝗲
VELVETUSDT has been selected from a sharp-loss group rather than a quiet, orderly trend. The supplied scanner marks the pair as a short-direction setup, gives it a confidence score of 100, and ranks it seventh in the TOP_LOSER category. That makes the pair notable for a specific reason: downside pressure is strong, but price is sitting close to a short-term support area where selling could either continue or temporarily lose control.
The scanner recorded a price of 0.0554 USDT. Its reference support was 0.0553, resistance was 0.0557, and its suggested entry range was 0.0554277 to 0.0554831. The scanner placed its invalidation level at 0.0558671 and identified downside reference points at 0.0546408, 0.0542474, and 0.0538540. Its calculated risk-reward figure was 2.0491.
Those figures describe a model output at one point in time. They do not establish what the next candle must do. The more useful question is whether the broader market structure supports the bearish reading and whether price can hold or break the nearby levels.
𝗪𝗵𝗮𝘁 𝗩𝗲𝗹𝘃𝗲𝘁 𝗖𝗮𝗽𝗶𝘁𝗮𝗹 𝗶𝘀 𝗯𝘂𝗶𝗹𝗱𝗶𝗻𝗴
The supplied project description identifies Velvet Capital as a social trading terminal for non-custodial crypto trading. Its stated scope includes spot trading, perpetual futures, and yield strategies across Robinhood Chain, Solana, Base, BNB Chain, Ethereum, Hyperliquid, Ink, Monad, Sonic, and other networks.
Velvet’s stated approach is to bring several functions into one interface. These include trading execution, wallet tracking, smart-money-flow observation, token research, and onchain analysis. Trades are described as routing through aggregated decentralised-exchange liquidity, with support for advanced order types such as limit orders and take-profit or stop-loss instructions. The project also describes MEV protection and execution from users’ own wallets.
The platform’s social layer includes a wallet tracker intended for following notable traders. Its project description also references an artificial-intelligence trading agent for token research and onchain analysis. That gives Velvet a broader identity than a basic swap interface: it is positioned as a combination of execution, discovery, and wallet-monitoring tools.
The research does not provide user counts, fee revenue, verified transaction totals, retention figures, or independent performance data for the trading agent. Product breadth is therefore documented, but adoption and commercial performance remain unquantified.
𝗧𝗼𝗸𝗲𝗻 𝗰𝗼𝗻𝘁𝗲𝘅𝘁 𝗮𝗻𝗱 𝘂𝗻𝗰𝗲𝗿𝘁𝗮𝗶𝗻𝘁𝗶𝗲𝘀
The research identifies the project as Velvet Capital and the token as VELVET. It does not verify a founding date, named founders, headquarters, fundraising history, or a detailed launch timeline. Those details should not be inferred from the available data.
The token is categorised across artificial intelligence, decentralised finance, AI applications, DeFAI, BNB Chain, Base, and a Binance Wallet IDO-related category. It is also listed in the YZi Labs, previously Binance Labs, portfolio category. However, the supplied research does not explain the exact nature, size, or date of any investment or relationship.
The precise utility schedule for VELVET is not fully documented either. The research does not verify a complete list of token-holder rights, governance powers, fee discounts, staking mechanics, buyback rules, or revenue-sharing terms. VELVET is clearly associated with the Velvet ecosystem, but the available material does not establish how platform activity translates into economic value for token holders.
The project’s multi-chain positioning is also presented at a high level. Velvet says it supports several networks and routes trades through aggregated DEX liquidity, but the research does not establish how deeply each chain is integrated or how much activity each contributes. That leaves a gap between the breadth of the product description and the measurable evidence of usage.
𝗦𝘂𝗽𝗽𝗹𝘆 𝗮𝗻𝗱 𝘃𝗮𝗹𝘂𝗮𝘁𝗶𝗼𝗻 𝗽𝗿𝗲𝘀𝘀𝘂𝗿𝗲
The tokenomics data lists a maximum and total supply of 1 billion VELVET. Circulating supply was approximately 463.82 million tokens, equal to about 46.38% of the maximum supply. More than half of the stated maximum supply was therefore outside circulation at the time of the snapshot.
The research does not provide a dated unlock calendar, allocation breakdown, vesting schedule, treasury policy, or details on when the remaining tokens may enter the market. That makes future dilution an unresolved issue rather than a precisely timed event.
The supplied CoinGecko snapshot placed VELVET at approximately 0.054386 USDT, with a market capitalisation of about 25.21 million US dollars. Its market-cap rank was 741. Fully diluted valuation was approximately 54.35 million US dollars. The FDV was therefore roughly 2.16 times the reported market capitalisation, while the market-cap-to-FDV ratio was 0.46.
That gap does not automatically determine the token’s direction. It does show that future supply entering circulation could become a source of selling pressure if demand and platform usage do not grow at a comparable pace.
Reported total value locked was approximately 641,723 US dollars. The market-cap-to-TVL ratio was 39.36, and the FDV-to-TVL ratio was 84.87. These figures need context because Velvet is described as a trading terminal rather than solely a lending or liquidity protocol, so TVL may not capture every form of platform activity. Even so, the reported token valuation is substantially larger than the locked-value base.
The research does not include Velvet-specific revenue, protocol fees, active users, or trading volume generated through the terminal. Valuation cannot therefore be assessed through verified cash-flow or usage multiples.
VELVET’s recorded all-time high was 2.08 US dollars on June 29, 2026. The supplied current price was approximately 97.39% below that level. Its reported all-time low was 0.04131603 US dollars on July 10, 2025, placing the token about 31.63% above that low. The long-term record shows a severe decline from the peak while retaining a meaningful distance from the historical floor.
𝗧𝗵𝗲 𝗺𝗮𝗿𝗸𝗲𝘁 𝘀𝘁𝗿𝘂𝗰𝘁𝘂𝗿𝗲 𝗿𝗲𝗺𝗮𝗶𝗻𝘀 𝘄𝗲𝗮𝗸
VELVET’s reported performance is negative across nearly every supplied timeframe. The token was down 9.97% over 24 hours, 38.40% over seven days, 46.61% over 14 days, and 92.18% over 30 days. It was also down 90.82% over 60 days, 41.03% over 200 days, and 67.52% over one year. The one-hour reading showed another decline of 1.86%.
The reported 24-hour range was 0.054291 to 0.061354 USDT, leaving the latest price near the bottom of that range. Binance ticker data showed an open price of 0.0604, a high of 0.0633, a low of 0.0542, and a last price of 0.0547. Quote volume was approximately 7.41 million USDT, with 128.70 million VELVET traded.
A separate market snapshot reported total volume of about 3.40 million US dollars. Because the supplied feeds use different measurements and windows, their volume figures are not identical. The cautious conclusion is that turnover was significant relative to the token’s approximately 25 million dollar market capitalisation, but the exact comparison depends on the data source.
The hourly candles show lower highs after price reached 0.0633. Price then moved through the 0.0600, 0.0580, and 0.0560 areas before testing 0.0542. A rebound from the 0.0543 region reached toward 0.0564, but the recovery did not create a durable higher high.
The four-hour data shows the same broad pressure, with price moving from a high near 0.0633 toward a low around 0.0542. Overall, the chart resembles a selloff interrupted by relief rallies rather than a confirmed base.
Open interest was reported at 84,432,770 VELVET. The research does not include funding rates, liquidation data, or historical open-interest changes. It is therefore not possible to determine whether the decline was driven mainly by new short positions, long liquidation, spot selling, or a combination of factors.
𝗪𝗵𝗲𝗿𝗲 𝘁𝗵𝗲 𝘀𝗰𝗮𝗻𝗻𝗲𝗿 𝘀𝗲𝘁𝘂𝗽 𝗰𝗮𝗻 𝗵𝗼𝗹𝗱 𝗼𝗿 𝗳𝗮𝗶𝗹
The scanner’s bearish case is consistent with the token’s broader performance. Its TOP_LOSER classification matches the sharp decline shown in the scanner feed and the larger losses visible across the weekly and monthly data. The scanner recorded a negative 15-minute move of 1.0714% and a volume ratio of 1.1222, indicating activity slightly above its comparison baseline. That is evidence of active trading, but not an extreme volume surge.
The proposed short setup sits above the 0.0553 support reference and below 0.0557 resistance. This is a narrow decision zone. If price remains below resistance and moves through nearby support, the scanner’s reference levels at 0.0546408, 0.0542474, and 0.0538540 become the areas to monitor. The 0.0558671 invalidation level is also important for the specific setup: a move above that area would weaken the immediate bearish structure.
Several factors could undermine the setup. Price has already suffered an extreme decline over longer periods, and sharp relief rallies can occur during such moves. The 0.0542 to 0.0543 region has recently attracted buying activity, so repeated defence of that area could send price back toward 0.0557 or higher. Smaller tokens can also move quickly through technical levels when liquidity is limited or fragmented, increasing the risk of false breaks and slippage.
The scanner’s confidence score reflects its model output at the recorded time. It does not remove the possibility of a reversal, a failed breakdown, or a rapid move through the reference levels.
𝗕𝗶𝘁𝗰𝗼𝗶𝗻’𝘀 𝘀𝘁𝗮𝗯𝗶𝗹𝗶𝘁𝘆 𝗱𝗼𝗲𝘀 𝗻𝗼𝘁 𝗿𝗲𝘀𝗰𝘂𝗲 𝗩𝗘𝗟𝗩𝗘𝗧
Bitcoin was comparatively stable in the supplied market snapshot. BTC was priced near 77,287.80 USDT, up 0.038% over the reported period, with a range of 77,025.10 to 77,477.40. Its quote volume was approximately 3.02 billion USDT.
That contrast matters. VELVET’s decline was not mirrored by a major Bitcoin selloff in the same data window. When BTC is nearly flat while a smaller token falls sharply, token-specific liquidity, positioning, supply, or confidence may be contributing to the weakness.
A stable Bitcoin market is not automatically supportive for every altcoin, however. If BTC leaves its range sharply, smaller tokens could become more volatile. The supplied research does not include total crypto-market capitalisation, Bitcoin dominance, Ethereum performance, or a broader altcoin index, so the wider market picture remains incomplete.
𝗟𝗲𝘃𝗲𝗹𝘀 𝗮𝗻𝗱 𝗳𝗮𝗰𝘁𝗼𝗿𝘀 𝘁𝗼 𝗺𝗼𝗻𝗶𝘁𝗼𝗿
The first technical checkpoint is 0.0553, the scanner’s support reference. The recent 0.0542 to 0.0543 low area is the next important zone. A sustained move below it would show that buyers have not established a reliable floor. The scanner’s three downside references are 0.0546408, 0.0542474, and 0.0538540, with the final level below the recent market low.
On the recovery side, 0.0557 is immediate resistance. The 0.0558 to 0.0564 area appeared repeatedly in recent hourly and four-hour candles, while 0.0558671 is the scanner’s specific invalidation area. A move above that level would weaken the short-term bearish pattern, although it would not by itself confirm a full trend reversal.
A larger recovery would need to address the 0.0575 to 0.0586 region, followed by the recent high near 0.0633. Beyond price, useful observations include volume behaviour at support, changes in open interest, funding rates, liquidations, supply disclosures, and evidence of actual Velvet platform usage.
The research feed contains no recent verified news items for Velvet. It provides no confirmed announcement covering a partnership, exchange listing, product release, token unlock, governance vote, funding event, security incident, or new chain integration. That absence means no catalyst was supplied or verified in this dataset; it does not prove that no external development exists.
𝗕𝗮𝗹𝗮𝗻𝗰𝗲𝗱 𝗰𝗼𝗻𝗰𝗹𝘂𝘀𝗶𝗼𝗻
Velvet presents a coherent product idea: combine non-custodial trading, cross-chain execution, wallet tracking, smart-money discovery, and AI-assisted research. The available research confirms the stated product scope, but it does not provide enough usage, revenue, fee, user, or performance data to measure adoption.
The token chart is currently communicating stress rather than steady strength. VELVET has suffered severe losses across the supplied timeframes, remains far below its recorded all-time high, and trades in a market with a substantial gap between circulating market capitalisation and fully diluted valuation. That gap leaves future dilution as an unresolved consideration.
The scanner’s bearish setup is supported by lower highs, heavy recent losses, and active trading near support. It is also vulnerable to a relief move because price is close to a recent low and the 0.0542 to 0.0543 area has attracted buyers. The key short-term question is how price resolves the 0.0553 to 0.0557 zone and whether volume and derivatives data confirm that move.
A break beneath nearby lows would keep the continuation structure in focus. A move above 0.0558671 would weaken the immediate bearish thesis. The broader assessment still depends on unanswered questions around token unlocks, platform usage, token utility, and whether Velvet’s product activity can support a token that has experienced such an extreme repricing.
VELVETUSDT: Bearish Structure Meets a Key Support Zone
𝗧𝗵𝗲 𝘀𝗰𝗮𝗻𝗻𝗲𝗿 𝗵𝗮𝘀 𝗽𝘂𝘁 𝗩𝗲𝗹𝘃𝗲𝘁 𝘂𝗻𝗱𝗲𝗿 𝘁𝗵𝗲 𝗺𝗶𝗰𝗿𝗼𝘀𝗰𝗼𝗽𝗲
VELVETUSDT has been selected from a sharp-loss group rather than a quiet, orderly trend. The supplied scanner marks the pair as a short-direction setup, gives it a confidence score of 100, and ranks it seventh in the TOP_LOSER category. That makes the pair notable for a specific reason: downside pressure is strong, but price is sitting close to a short-term support area where selling could either continue or temporarily lose control.
The scanner recorded a price of 0.0554 USDT. Its reference support was 0.0553, resistance was 0.0557, and its suggested entry range was 0.0554277 to 0.0554831. The scanner placed its invalidation level at 0.0558671 and identified downside reference points at 0.0546408, 0.0542474, and 0.0538540. Its calculated risk-reward figure was 2.0491.
Those figures describe a model output at one point in time. They do not establish what the next candle must do. The more useful question is whether the broader market structure supports the bearish reading and whether price can hold or break the nearby levels.
𝗪𝗵𝗮𝘁 𝗩𝗲𝗹𝘃𝗲𝘁 𝗖𝗮𝗽𝗶𝘁𝗮𝗹 𝗶𝘀 𝗯𝘂𝗶𝗹𝗱𝗶𝗻𝗴
The supplied project description identifies Velvet Capital as a social trading terminal for non-custodial crypto trading. Its stated scope includes spot trading, perpetual futures, and yield strategies across Robinhood Chain, Solana, Base, BNB Chain, Ethereum, Hyperliquid, Ink, Monad, Sonic, and other networks.
Velvet’s stated approach is to bring several functions into one interface. These include trading execution, wallet tracking, smart-money-flow observation, token research, and onchain analysis. Trades are described as routing through aggregated decentralised-exchange liquidity, with support for advanced order types such as limit orders and take-profit or stop-loss instructions. The project also describes MEV protection and execution from users’ own wallets.
The platform’s social layer includes a wallet tracker intended for following notable traders. Its project description also references an artificial-intelligence trading agent for token research and onchain analysis. That gives Velvet a broader identity than a basic swap interface: it is positioned as a combination of execution, discovery, and wallet-monitoring tools.
The research does not provide user counts, fee revenue, verified transaction totals, retention figures, or independent performance data for the trading agent. Product breadth is therefore documented, but adoption and commercial performance remain unquantified.
𝗧𝗼𝗸𝗲𝗻 𝗰𝗼𝗻𝘁𝗲𝘅𝘁 𝗮𝗻𝗱 𝘂𝗻𝗰𝗲𝗿𝘁𝗮𝗶𝗻𝘁𝗶𝗲𝘀
The research identifies the project as Velvet Capital and the token as VELVET. It does not verify a founding date, named founders, headquarters, fundraising history, or a detailed launch timeline. Those details should not be inferred from the available data.
The token is categorised across artificial intelligence, decentralised finance, AI applications, DeFAI, BNB Chain, Base, and a Binance Wallet IDO-related category. It is also listed in the YZi Labs, previously Binance Labs, portfolio category. However, the supplied research does not explain the exact nature, size, or date of any investment or relationship.
The precise utility schedule for VELVET is not fully documented either. The research does not verify a complete list of token-holder rights, governance powers, fee discounts, staking mechanics, buyback rules, or revenue-sharing terms. VELVET is clearly associated with the Velvet ecosystem, but the available material does not establish how platform activity translates into economic value for token holders.
The project’s multi-chain positioning is also presented at a high level. Velvet says it supports several networks and routes trades through aggregated DEX liquidity, but the research does not establish how deeply each chain is integrated or how much activity each contributes. That leaves a gap between the breadth of the product description and the measurable evidence of usage.
𝗦𝘂𝗽𝗽𝗹𝘆 𝗮𝗻𝗱 𝘃𝗮𝗹𝘂𝗮𝘁𝗶𝗼𝗻 𝗽𝗿𝗲𝘀𝘀𝘂𝗿𝗲
The tokenomics data lists a maximum and total supply of 1 billion VELVET. Circulating supply was approximately 463.82 million tokens, equal to about 46.38% of the maximum supply. More than half of the stated maximum supply was therefore outside circulation at the time of the snapshot.
The research does not provide a dated unlock calendar, allocation breakdown, vesting schedule, treasury policy, or details on when the remaining tokens may enter the market. That makes future dilution an unresolved issue rather than a precisely timed event.
The supplied CoinGecko snapshot placed VELVET at approximately 0.054386 USDT, with a market capitalisation of about 25.21 million US dollars. Its market-cap rank was 741. Fully diluted valuation was approximately 54.35 million US dollars. The FDV was therefore roughly 2.16 times the reported market capitalisation, while the market-cap-to-FDV ratio was 0.46.
That gap does not automatically determine the token’s direction. It does show that future supply entering circulation could become a source of selling pressure if demand and platform usage do not grow at a comparable pace.
Reported total value locked was approximately 641,723 US dollars. The market-cap-to-TVL ratio was 39.36, and the FDV-to-TVL ratio was 84.87. These figures need context because Velvet is described as a trading terminal rather than solely a lending or liquidity protocol, so TVL may not capture every form of platform activity. Even so, the reported token valuation is substantially larger than the locked-value base.
The research does not include Velvet-specific revenue, protocol fees, active users, or trading volume generated through the terminal. Valuation cannot therefore be assessed through verified cash-flow or usage multiples.
VELVET’s recorded all-time high was 2.08 US dollars on June 29, 2026. The supplied current price was approximately 97.39% below that level. Its reported all-time low was 0.04131603 US dollars on July 10, 2025, placing the token about 31.63% above that low. The long-term record shows a severe decline from the peak while retaining a meaningful distance from the historical floor.
𝗧𝗵𝗲 𝗺𝗮𝗿𝗸𝗲𝘁 𝘀𝘁𝗿𝘂𝗰𝘁𝘂𝗿𝗲 𝗿𝗲𝗺𝗮𝗶𝗻𝘀 𝘄𝗲𝗮𝗸
VELVET’s reported performance is negative across nearly every supplied timeframe. The token was down 9.97% over 24 hours, 38.40% over seven days, 46.61% over 14 days, and 92.18% over 30 days. It was also down 90.82% over 60 days, 41.03% over 200 days, and 67.52% over one year. The one-hour reading showed another decline of 1.86%.
The reported 24-hour range was 0.054291 to 0.061354 USDT, leaving the latest price near the bottom of that range. Binance ticker data showed an open price of 0.0604, a high of 0.0633, a low of 0.0542, and a last price of 0.0547. Quote volume was approximately 7.41 million USDT, with 128.70 million VELVET traded.
A separate market snapshot reported total volume of about 3.40 million US dollars. Because the supplied feeds use different measurements and windows, their volume figures are not identical. The cautious conclusion is that turnover was significant relative to the token’s approximately 25 million dollar market capitalisation, but the exact comparison depends on the data source.
The hourly candles show lower highs after price reached 0.0633. Price then moved through the 0.0600, 0.0580, and 0.0560 areas before testing 0.0542. A rebound from the 0.0543 region reached toward 0.0564, but the recovery did not create a durable higher high.
The four-hour data shows the same broad pressure, with price moving from a high near 0.0633 toward a low around 0.0542. Overall, the chart resembles a selloff interrupted by relief rallies rather than a confirmed base.
Open interest was reported at 84,432,770 VELVET. The research does not include funding rates, liquidation data, or historical open-interest changes. It is therefore not possible to determine whether the decline was driven mainly by new short positions, long liquidation, spot selling, or a combination of factors.
𝗪𝗵𝗲𝗿𝗲 𝘁𝗵𝗲 𝘀𝗰𝗮𝗻𝗻𝗲𝗿 𝘀𝗲𝘁𝘂𝗽 𝗰𝗮𝗻 𝗵𝗼𝗹𝗱 𝗼𝗿 𝗳𝗮𝗶𝗹
The scanner’s bearish case is consistent with the token’s broader performance. Its TOP_LOSER classification matches the sharp decline shown in the scanner feed and the larger losses visible across the weekly and monthly data. The scanner recorded a negative 15-minute move of 1.0714% and a volume ratio of 1.1222, indicating activity slightly above its comparison baseline. That is evidence of active trading, but not an extreme volume surge.
The proposed short setup sits above the 0.0553 support reference and below 0.0557 resistance. This is a narrow decision zone. If price remains below resistance and moves through nearby support, the scanner’s reference levels at 0.0546408, 0.0542474, and 0.0538540 become the areas to monitor. The 0.0558671 invalidation level is also important for the specific setup: a move above that area would weaken the immediate bearish structure.
Several factors could undermine the setup. Price has already suffered an extreme decline over longer periods, and sharp relief rallies can occur during such moves. The 0.0542 to 0.0543 region has recently attracted buying activity, so repeated defence of that area could send price back toward 0.0557 or higher. Smaller tokens can also move quickly through technical levels when liquidity is limited or fragmented, increasing the risk of false breaks and slippage.
The scanner’s confidence score reflects its model output at the recorded time. It does not remove the possibility of a reversal, a failed breakdown, or a rapid move through the reference levels.
𝗕𝗶𝘁𝗰𝗼𝗶𝗻’𝘀 𝘀𝘁𝗮𝗯𝗶𝗹𝗶𝘁𝘆 𝗱𝗼𝗲𝘀 𝗻𝗼𝘁 𝗿𝗲𝘀𝗰𝘂𝗲 𝗩𝗘𝗟𝗩𝗘𝗧
Bitcoin was comparatively stable in the supplied market snapshot. BTC was priced near 77,287.80 USDT, up 0.038% over the reported period, with a range of 77,025.10 to 77,477.40. Its quote volume was approximately 3.02 billion USDT.
That contrast matters. VELVET’s decline was not mirrored by a major Bitcoin selloff in the same data window. When BTC is nearly flat while a smaller token falls sharply, token-specific liquidity, positioning, supply, or confidence may be contributing to the weakness.
A stable Bitcoin market is not automatically supportive for every altcoin, however. If BTC leaves its range sharply, smaller tokens could become more volatile. The supplied research does not include total crypto-market capitalisation, Bitcoin dominance, Ethereum performance, or a broader altcoin index, so the wider market picture remains incomplete.
𝗟𝗲𝘃𝗲𝗹𝘀 𝗮𝗻𝗱 𝗳𝗮𝗰𝘁𝗼𝗿𝘀 𝘁𝗼 𝗺𝗼𝗻𝗶𝘁𝗼𝗿
The first technical checkpoint is 0.0553, the scanner’s support reference. The recent 0.0542 to 0.0543 low area is the next important zone. A sustained move below it would show that buyers have not established a reliable floor. The scanner’s three downside references are 0.0546408, 0.0542474, and 0.0538540, with the final level below the recent market low.
On the recovery side, 0.0557 is immediate resistance. The 0.0558 to 0.0564 area appeared repeatedly in recent hourly and four-hour candles, while 0.0558671 is the scanner’s specific invalidation area. A move above that level would weaken the short-term bearish pattern, although it would not by itself confirm a full trend reversal.
A larger recovery would need to address the 0.0575 to 0.0586 region, followed by the recent high near 0.0633. Beyond price, useful observations include volume behaviour at support, changes in open interest, funding rates, liquidations, supply disclosures, and evidence of actual Velvet platform usage.
The research feed contains no recent verified news items for Velvet. It provides no confirmed announcement covering a partnership, exchange listing, product release, token unlock, governance vote, funding event, security incident, or new chain integration. That absence means no catalyst was supplied or verified in this dataset; it does not prove that no external development exists.
𝗕𝗮𝗹𝗮𝗻𝗰𝗲𝗱 𝗰𝗼𝗻𝗰𝗹𝘂𝘀𝗶𝗼𝗻
Velvet presents a coherent product idea: combine non-custodial trading, cross-chain execution, wallet tracking, smart-money discovery, and AI-assisted research. The available research confirms the stated product scope, but it does not provide enough usage, revenue, fee, user, or performance data to measure adoption.
The token chart is currently communicating stress rather than steady strength. VELVET has suffered severe losses across the supplied timeframes, remains far below its recorded all-time high, and trades in a market with a substantial gap between circulating market capitalisation and fully diluted valuation. That gap leaves future dilution as an unresolved consideration.
The scanner’s bearish setup is supported by lower highs, heavy recent losses, and active trading near support. It is also vulnerable to a relief move because price is close to a recent low and the 0.0542 to 0.0543 area has attracted buyers. The key short-term question is how price resolves the 0.0553 to 0.0557 zone and whether volume and derivatives data confirm that move.
A break beneath nearby lows would keep the continuation structure in focus. A move above 0.0558671 would weaken the immediate bearish thesis. The broader assessment still depends on unanswered questions around token unlocks, platform usage, token utility, and whether Velvet’s product activity can support a token that has experienced such an extreme repricing.
VELVETUSDT has been selected from a sharp-loss group rather than a quiet, orderly trend. The supplied scanner marks the pair as a short-direction setup, gives it a confidence score of 100, and ranks it seventh in the TOP_LOSER category. That makes the pair notable for a specific reason: downside pressure is strong, but price is sitting close to a short-term support area where selling could either continue or temporarily lose control.
The scanner recorded a price of 0.0554 USDT. Its reference support was 0.0553, resistance was 0.0557, and its suggested entry range was 0.0554277 to 0.0554831. The scanner placed its invalidation level at 0.0558671 and identified downside reference points at 0.0546408, 0.0542474, and 0.0538540. Its calculated risk-reward figure was 2.0491.
Those figures describe a model output at one point in time. They do not establish what the next candle must do. The more useful question is whether the broader market structure supports the bearish reading and whether price can hold or break the nearby levels.
𝗪𝗵𝗮𝘁 𝗩𝗲𝗹𝘃𝗲𝘁 𝗖𝗮𝗽𝗶𝘁𝗮𝗹 𝗶𝘀 𝗯𝘂𝗶𝗹𝗱𝗶𝗻𝗴
The supplied project description identifies Velvet Capital as a social trading terminal for non-custodial crypto trading. Its stated scope includes spot trading, perpetual futures, and yield strategies across Robinhood Chain, Solana, Base, BNB Chain, Ethereum, Hyperliquid, Ink, Monad, Sonic, and other networks.
Velvet’s stated approach is to bring several functions into one interface. These include trading execution, wallet tracking, smart-money-flow observation, token research, and onchain analysis. Trades are described as routing through aggregated decentralised-exchange liquidity, with support for advanced order types such as limit orders and take-profit or stop-loss instructions. The project also describes MEV protection and execution from users’ own wallets.
The platform’s social layer includes a wallet tracker intended for following notable traders. Its project description also references an artificial-intelligence trading agent for token research and onchain analysis. That gives Velvet a broader identity than a basic swap interface: it is positioned as a combination of execution, discovery, and wallet-monitoring tools.
The research does not provide user counts, fee revenue, verified transaction totals, retention figures, or independent performance data for the trading agent. Product breadth is therefore documented, but adoption and commercial performance remain unquantified.
𝗧𝗼𝗸𝗲𝗻 𝗰𝗼𝗻𝘁𝗲𝘅𝘁 𝗮𝗻𝗱 𝘂𝗻𝗰𝗲𝗿𝘁𝗮𝗶𝗻𝘁𝗶𝗲𝘀
The research identifies the project as Velvet Capital and the token as VELVET. It does not verify a founding date, named founders, headquarters, fundraising history, or a detailed launch timeline. Those details should not be inferred from the available data.
The token is categorised across artificial intelligence, decentralised finance, AI applications, DeFAI, BNB Chain, Base, and a Binance Wallet IDO-related category. It is also listed in the YZi Labs, previously Binance Labs, portfolio category. However, the supplied research does not explain the exact nature, size, or date of any investment or relationship.
The precise utility schedule for VELVET is not fully documented either. The research does not verify a complete list of token-holder rights, governance powers, fee discounts, staking mechanics, buyback rules, or revenue-sharing terms. VELVET is clearly associated with the Velvet ecosystem, but the available material does not establish how platform activity translates into economic value for token holders.
The project’s multi-chain positioning is also presented at a high level. Velvet says it supports several networks and routes trades through aggregated DEX liquidity, but the research does not establish how deeply each chain is integrated or how much activity each contributes. That leaves a gap between the breadth of the product description and the measurable evidence of usage.
𝗦𝘂𝗽𝗽𝗹𝘆 𝗮𝗻𝗱 𝘃𝗮𝗹𝘂𝗮𝘁𝗶𝗼𝗻 𝗽𝗿𝗲𝘀𝘀𝘂𝗿𝗲
The tokenomics data lists a maximum and total supply of 1 billion VELVET. Circulating supply was approximately 463.82 million tokens, equal to about 46.38% of the maximum supply. More than half of the stated maximum supply was therefore outside circulation at the time of the snapshot.
The research does not provide a dated unlock calendar, allocation breakdown, vesting schedule, treasury policy, or details on when the remaining tokens may enter the market. That makes future dilution an unresolved issue rather than a precisely timed event.
The supplied CoinGecko snapshot placed VELVET at approximately 0.054386 USDT, with a market capitalisation of about 25.21 million US dollars. Its market-cap rank was 741. Fully diluted valuation was approximately 54.35 million US dollars. The FDV was therefore roughly 2.16 times the reported market capitalisation, while the market-cap-to-FDV ratio was 0.46.
That gap does not automatically determine the token’s direction. It does show that future supply entering circulation could become a source of selling pressure if demand and platform usage do not grow at a comparable pace.
Reported total value locked was approximately 641,723 US dollars. The market-cap-to-TVL ratio was 39.36, and the FDV-to-TVL ratio was 84.87. These figures need context because Velvet is described as a trading terminal rather than solely a lending or liquidity protocol, so TVL may not capture every form of platform activity. Even so, the reported token valuation is substantially larger than the locked-value base.
The research does not include Velvet-specific revenue, protocol fees, active users, or trading volume generated through the terminal. Valuation cannot therefore be assessed through verified cash-flow or usage multiples.
VELVET’s recorded all-time high was 2.08 US dollars on June 29, 2026. The supplied current price was approximately 97.39% below that level. Its reported all-time low was 0.04131603 US dollars on July 10, 2025, placing the token about 31.63% above that low. The long-term record shows a severe decline from the peak while retaining a meaningful distance from the historical floor.
𝗧𝗵𝗲 𝗺𝗮𝗿𝗸𝗲𝘁 𝘀𝘁𝗿𝘂𝗰𝘁𝘂𝗿𝗲 𝗿𝗲𝗺𝗮𝗶𝗻𝘀 𝘄𝗲𝗮𝗸
VELVET’s reported performance is negative across nearly every supplied timeframe. The token was down 9.97% over 24 hours, 38.40% over seven days, 46.61% over 14 days, and 92.18% over 30 days. It was also down 90.82% over 60 days, 41.03% over 200 days, and 67.52% over one year. The one-hour reading showed another decline of 1.86%.
The reported 24-hour range was 0.054291 to 0.061354 USDT, leaving the latest price near the bottom of that range. Binance ticker data showed an open price of 0.0604, a high of 0.0633, a low of 0.0542, and a last price of 0.0547. Quote volume was approximately 7.41 million USDT, with 128.70 million VELVET traded.
A separate market snapshot reported total volume of about 3.40 million US dollars. Because the supplied feeds use different measurements and windows, their volume figures are not identical. The cautious conclusion is that turnover was significant relative to the token’s approximately 25 million dollar market capitalisation, but the exact comparison depends on the data source.
The hourly candles show lower highs after price reached 0.0633. Price then moved through the 0.0600, 0.0580, and 0.0560 areas before testing 0.0542. A rebound from the 0.0543 region reached toward 0.0564, but the recovery did not create a durable higher high.
The four-hour data shows the same broad pressure, with price moving from a high near 0.0633 toward a low around 0.0542. Overall, the chart resembles a selloff interrupted by relief rallies rather than a confirmed base.
Open interest was reported at 84,432,770 VELVET. The research does not include funding rates, liquidation data, or historical open-interest changes. It is therefore not possible to determine whether the decline was driven mainly by new short positions, long liquidation, spot selling, or a combination of factors.
𝗪𝗵𝗲𝗿𝗲 𝘁𝗵𝗲 𝘀𝗰𝗮𝗻𝗻𝗲𝗿 𝘀𝗲𝘁𝘂𝗽 𝗰𝗮𝗻 𝗵𝗼𝗹𝗱 𝗼𝗿 𝗳𝗮𝗶𝗹
The scanner’s bearish case is consistent with the token’s broader performance. Its TOP_LOSER classification matches the sharp decline shown in the scanner feed and the larger losses visible across the weekly and monthly data. The scanner recorded a negative 15-minute move of 1.0714% and a volume ratio of 1.1222, indicating activity slightly above its comparison baseline. That is evidence of active trading, but not an extreme volume surge.
The proposed short setup sits above the 0.0553 support reference and below 0.0557 resistance. This is a narrow decision zone. If price remains below resistance and moves through nearby support, the scanner’s reference levels at 0.0546408, 0.0542474, and 0.0538540 become the areas to monitor. The 0.0558671 invalidation level is also important for the specific setup: a move above that area would weaken the immediate bearish structure.
Several factors could undermine the setup. Price has already suffered an extreme decline over longer periods, and sharp relief rallies can occur during such moves. The 0.0542 to 0.0543 region has recently attracted buying activity, so repeated defence of that area could send price back toward 0.0557 or higher. Smaller tokens can also move quickly through technical levels when liquidity is limited or fragmented, increasing the risk of false breaks and slippage.
The scanner’s confidence score reflects its model output at the recorded time. It does not remove the possibility of a reversal, a failed breakdown, or a rapid move through the reference levels.
𝗕𝗶𝘁𝗰𝗼𝗶𝗻’𝘀 𝘀𝘁𝗮𝗯𝗶𝗹𝗶𝘁𝘆 𝗱𝗼𝗲𝘀 𝗻𝗼𝘁 𝗿𝗲𝘀𝗰𝘂𝗲 𝗩𝗘𝗟𝗩𝗘𝗧
Bitcoin was comparatively stable in the supplied market snapshot. BTC was priced near 77,287.80 USDT, up 0.038% over the reported period, with a range of 77,025.10 to 77,477.40. Its quote volume was approximately 3.02 billion USDT.
That contrast matters. VELVET’s decline was not mirrored by a major Bitcoin selloff in the same data window. When BTC is nearly flat while a smaller token falls sharply, token-specific liquidity, positioning, supply, or confidence may be contributing to the weakness.
A stable Bitcoin market is not automatically supportive for every altcoin, however. If BTC leaves its range sharply, smaller tokens could become more volatile. The supplied research does not include total crypto-market capitalisation, Bitcoin dominance, Ethereum performance, or a broader altcoin index, so the wider market picture remains incomplete.
𝗟𝗲𝘃𝗲𝗹𝘀 𝗮𝗻𝗱 𝗳𝗮𝗰𝘁𝗼𝗿𝘀 𝘁𝗼 𝗺𝗼𝗻𝗶𝘁𝗼𝗿
The first technical checkpoint is 0.0553, the scanner’s support reference. The recent 0.0542 to 0.0543 low area is the next important zone. A sustained move below it would show that buyers have not established a reliable floor. The scanner’s three downside references are 0.0546408, 0.0542474, and 0.0538540, with the final level below the recent market low.
On the recovery side, 0.0557 is immediate resistance. The 0.0558 to 0.0564 area appeared repeatedly in recent hourly and four-hour candles, while 0.0558671 is the scanner’s specific invalidation area. A move above that level would weaken the short-term bearish pattern, although it would not by itself confirm a full trend reversal.
A larger recovery would need to address the 0.0575 to 0.0586 region, followed by the recent high near 0.0633. Beyond price, useful observations include volume behaviour at support, changes in open interest, funding rates, liquidations, supply disclosures, and evidence of actual Velvet platform usage.
The research feed contains no recent verified news items for Velvet. It provides no confirmed announcement covering a partnership, exchange listing, product release, token unlock, governance vote, funding event, security incident, or new chain integration. That absence means no catalyst was supplied or verified in this dataset; it does not prove that no external development exists.
𝗕𝗮𝗹𝗮𝗻𝗰𝗲𝗱 𝗰𝗼𝗻𝗰𝗹𝘂𝘀𝗶𝗼𝗻
Velvet presents a coherent product idea: combine non-custodial trading, cross-chain execution, wallet tracking, smart-money discovery, and AI-assisted research. The available research confirms the stated product scope, but it does not provide enough usage, revenue, fee, user, or performance data to measure adoption.
The token chart is currently communicating stress rather than steady strength. VELVET has suffered severe losses across the supplied timeframes, remains far below its recorded all-time high, and trades in a market with a substantial gap between circulating market capitalisation and fully diluted valuation. That gap leaves future dilution as an unresolved consideration.
The scanner’s bearish setup is supported by lower highs, heavy recent losses, and active trading near support. It is also vulnerable to a relief move because price is close to a recent low and the 0.0542 to 0.0543 area has attracted buyers. The key short-term question is how price resolves the 0.0553 to 0.0557 zone and whether volume and derivatives data confirm that move.
A break beneath nearby lows would keep the continuation structure in focus. A move above 0.0558671 would weaken the immediate bearish thesis. The broader assessment still depends on unanswered questions around token unlocks, platform usage, token utility, and whether Velvet’s product activity can support a token that has experienced such an extreme repricing.
300
·
--
පරිවර්තනය බලන්න
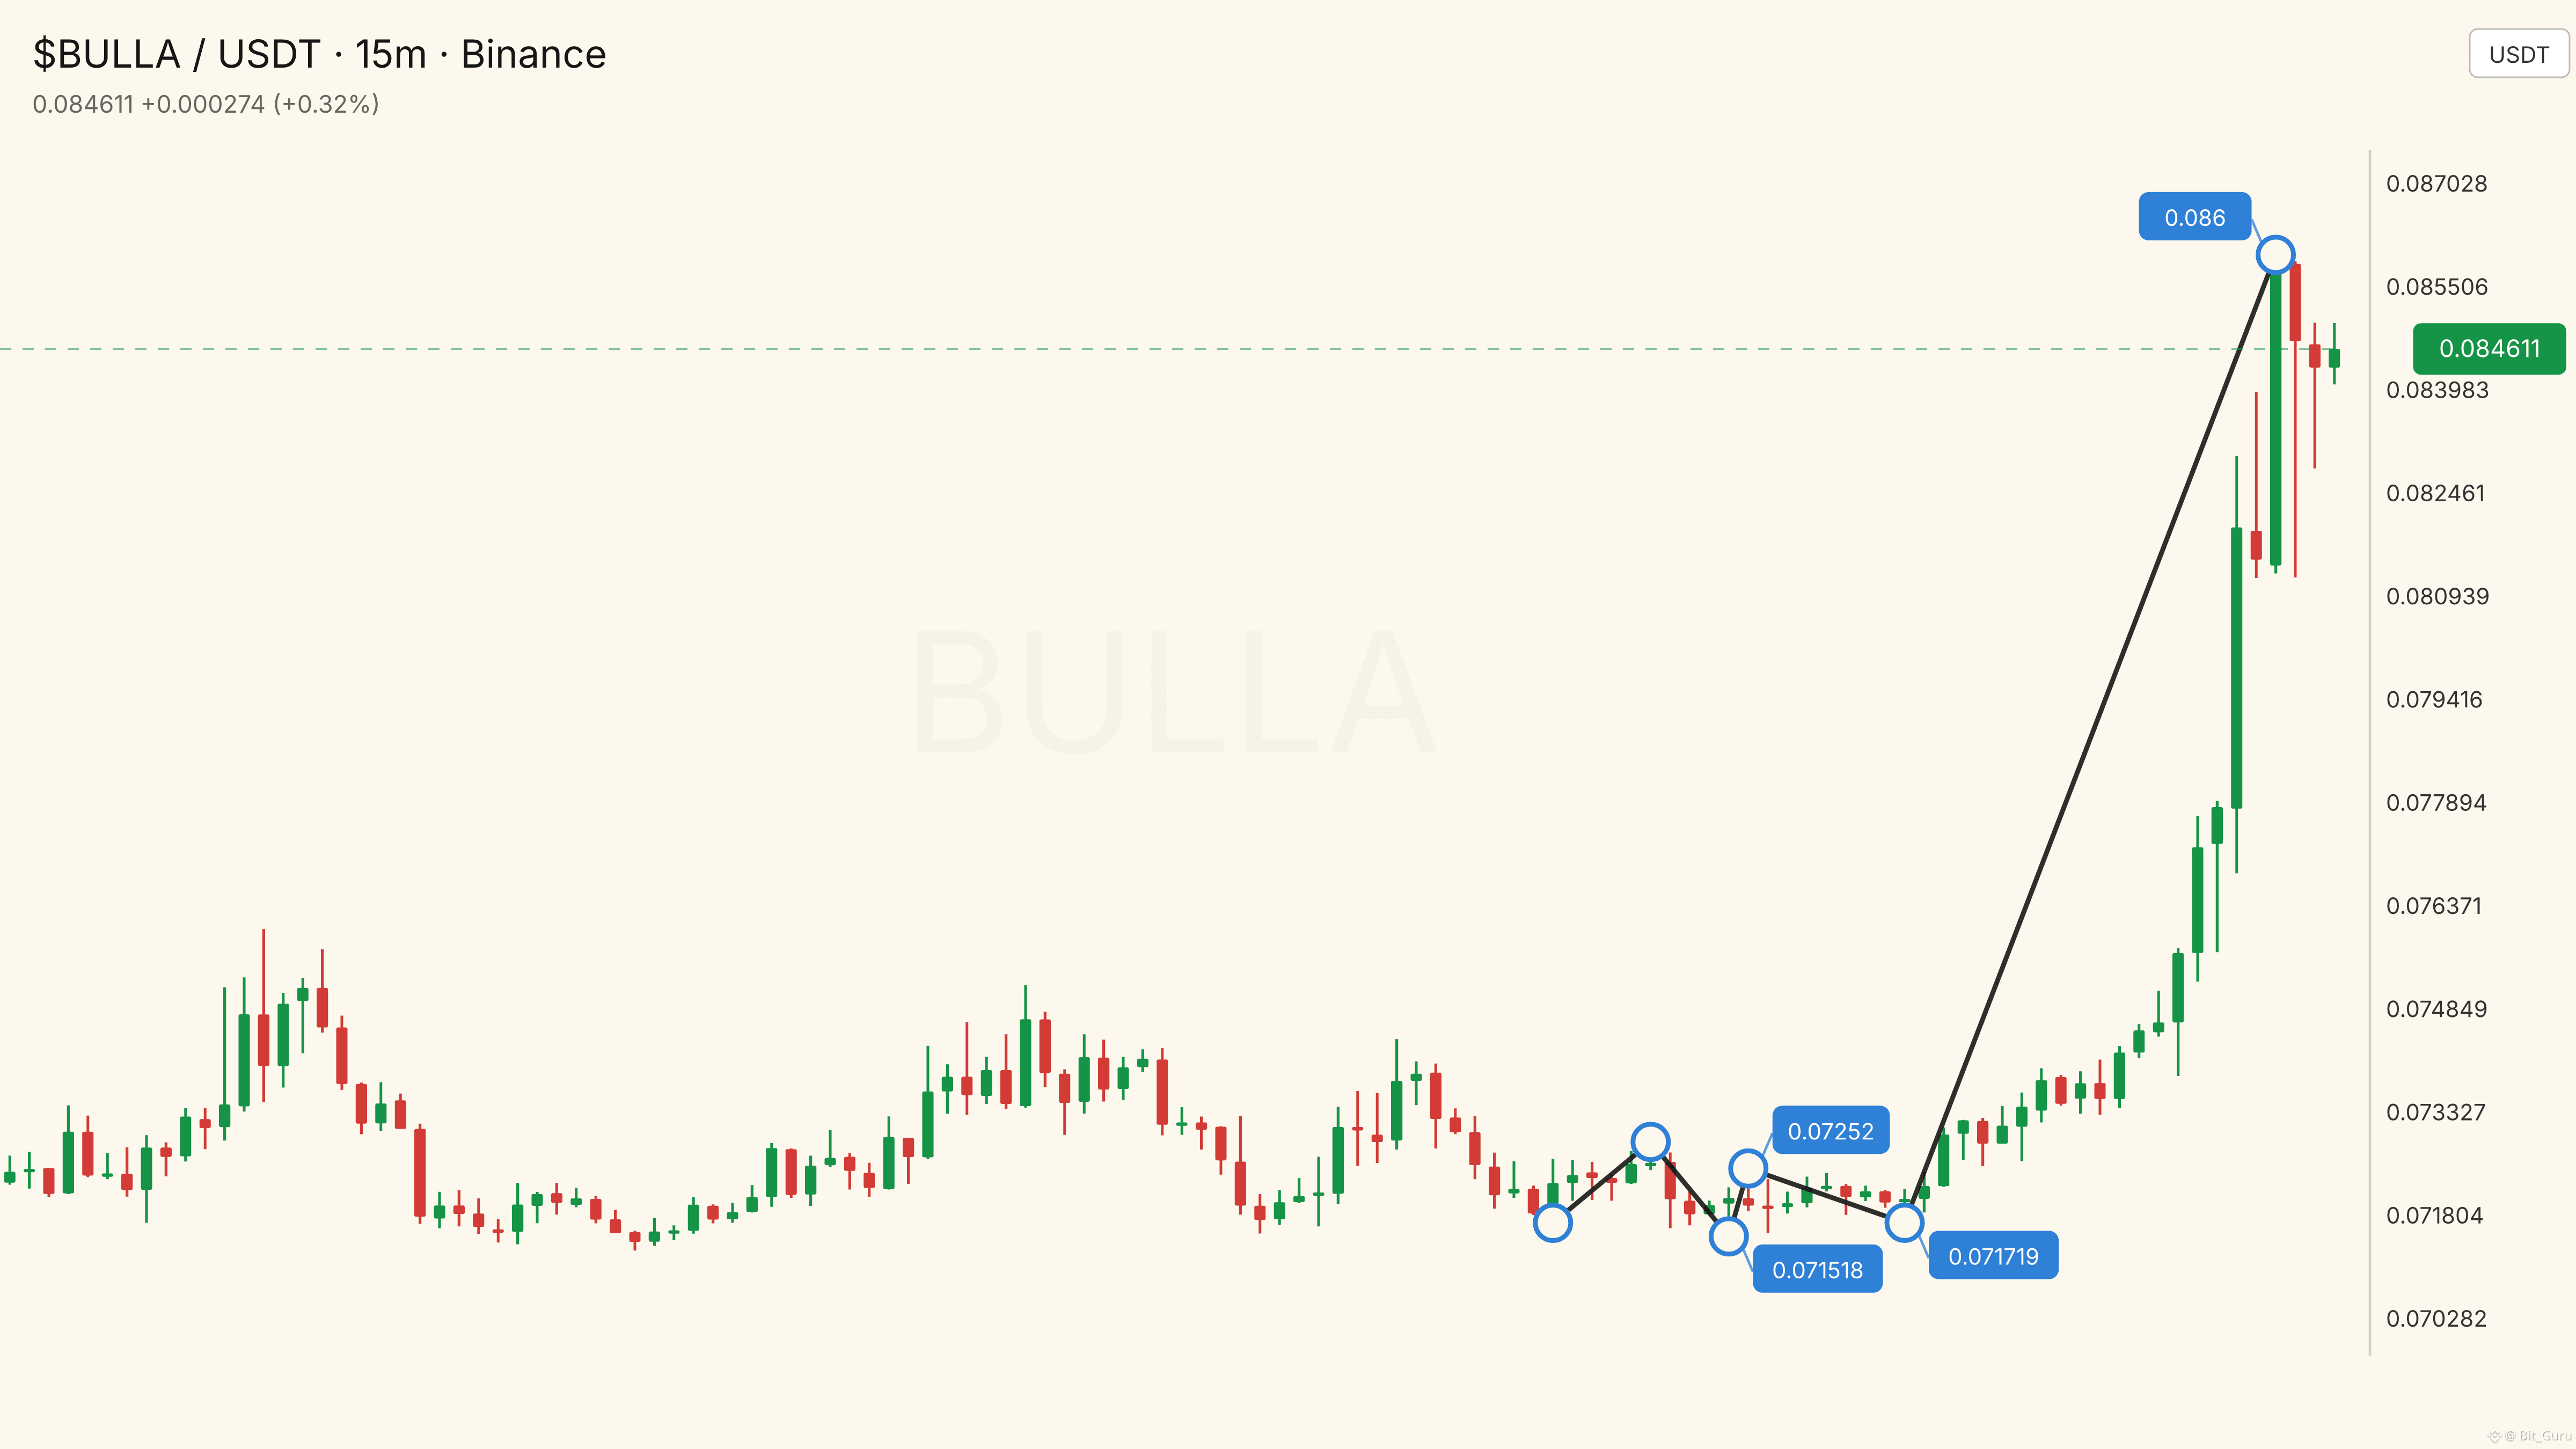
Don’t miss $BULLA … ‼️ UP move!
Entry: 0.084435 - 0.08452
SL: 0.083886
TP1: 0.085737 | TP2: 0.086346 | TP3: 0.086955
Don’t miss $BULLA … ‼️ UP move!
Entry: 0.084435 - 0.08452
SL: 0.083886
TP1: 0.085737 | TP2: 0.086346 | TP3: 0.086955
Entry: 0.084435 - 0.08452
SL: 0.083886
TP1: 0.085737 | TP2: 0.086346 | TP3: 0.086955
461
·
--
පරිවර්තනය බලන්න
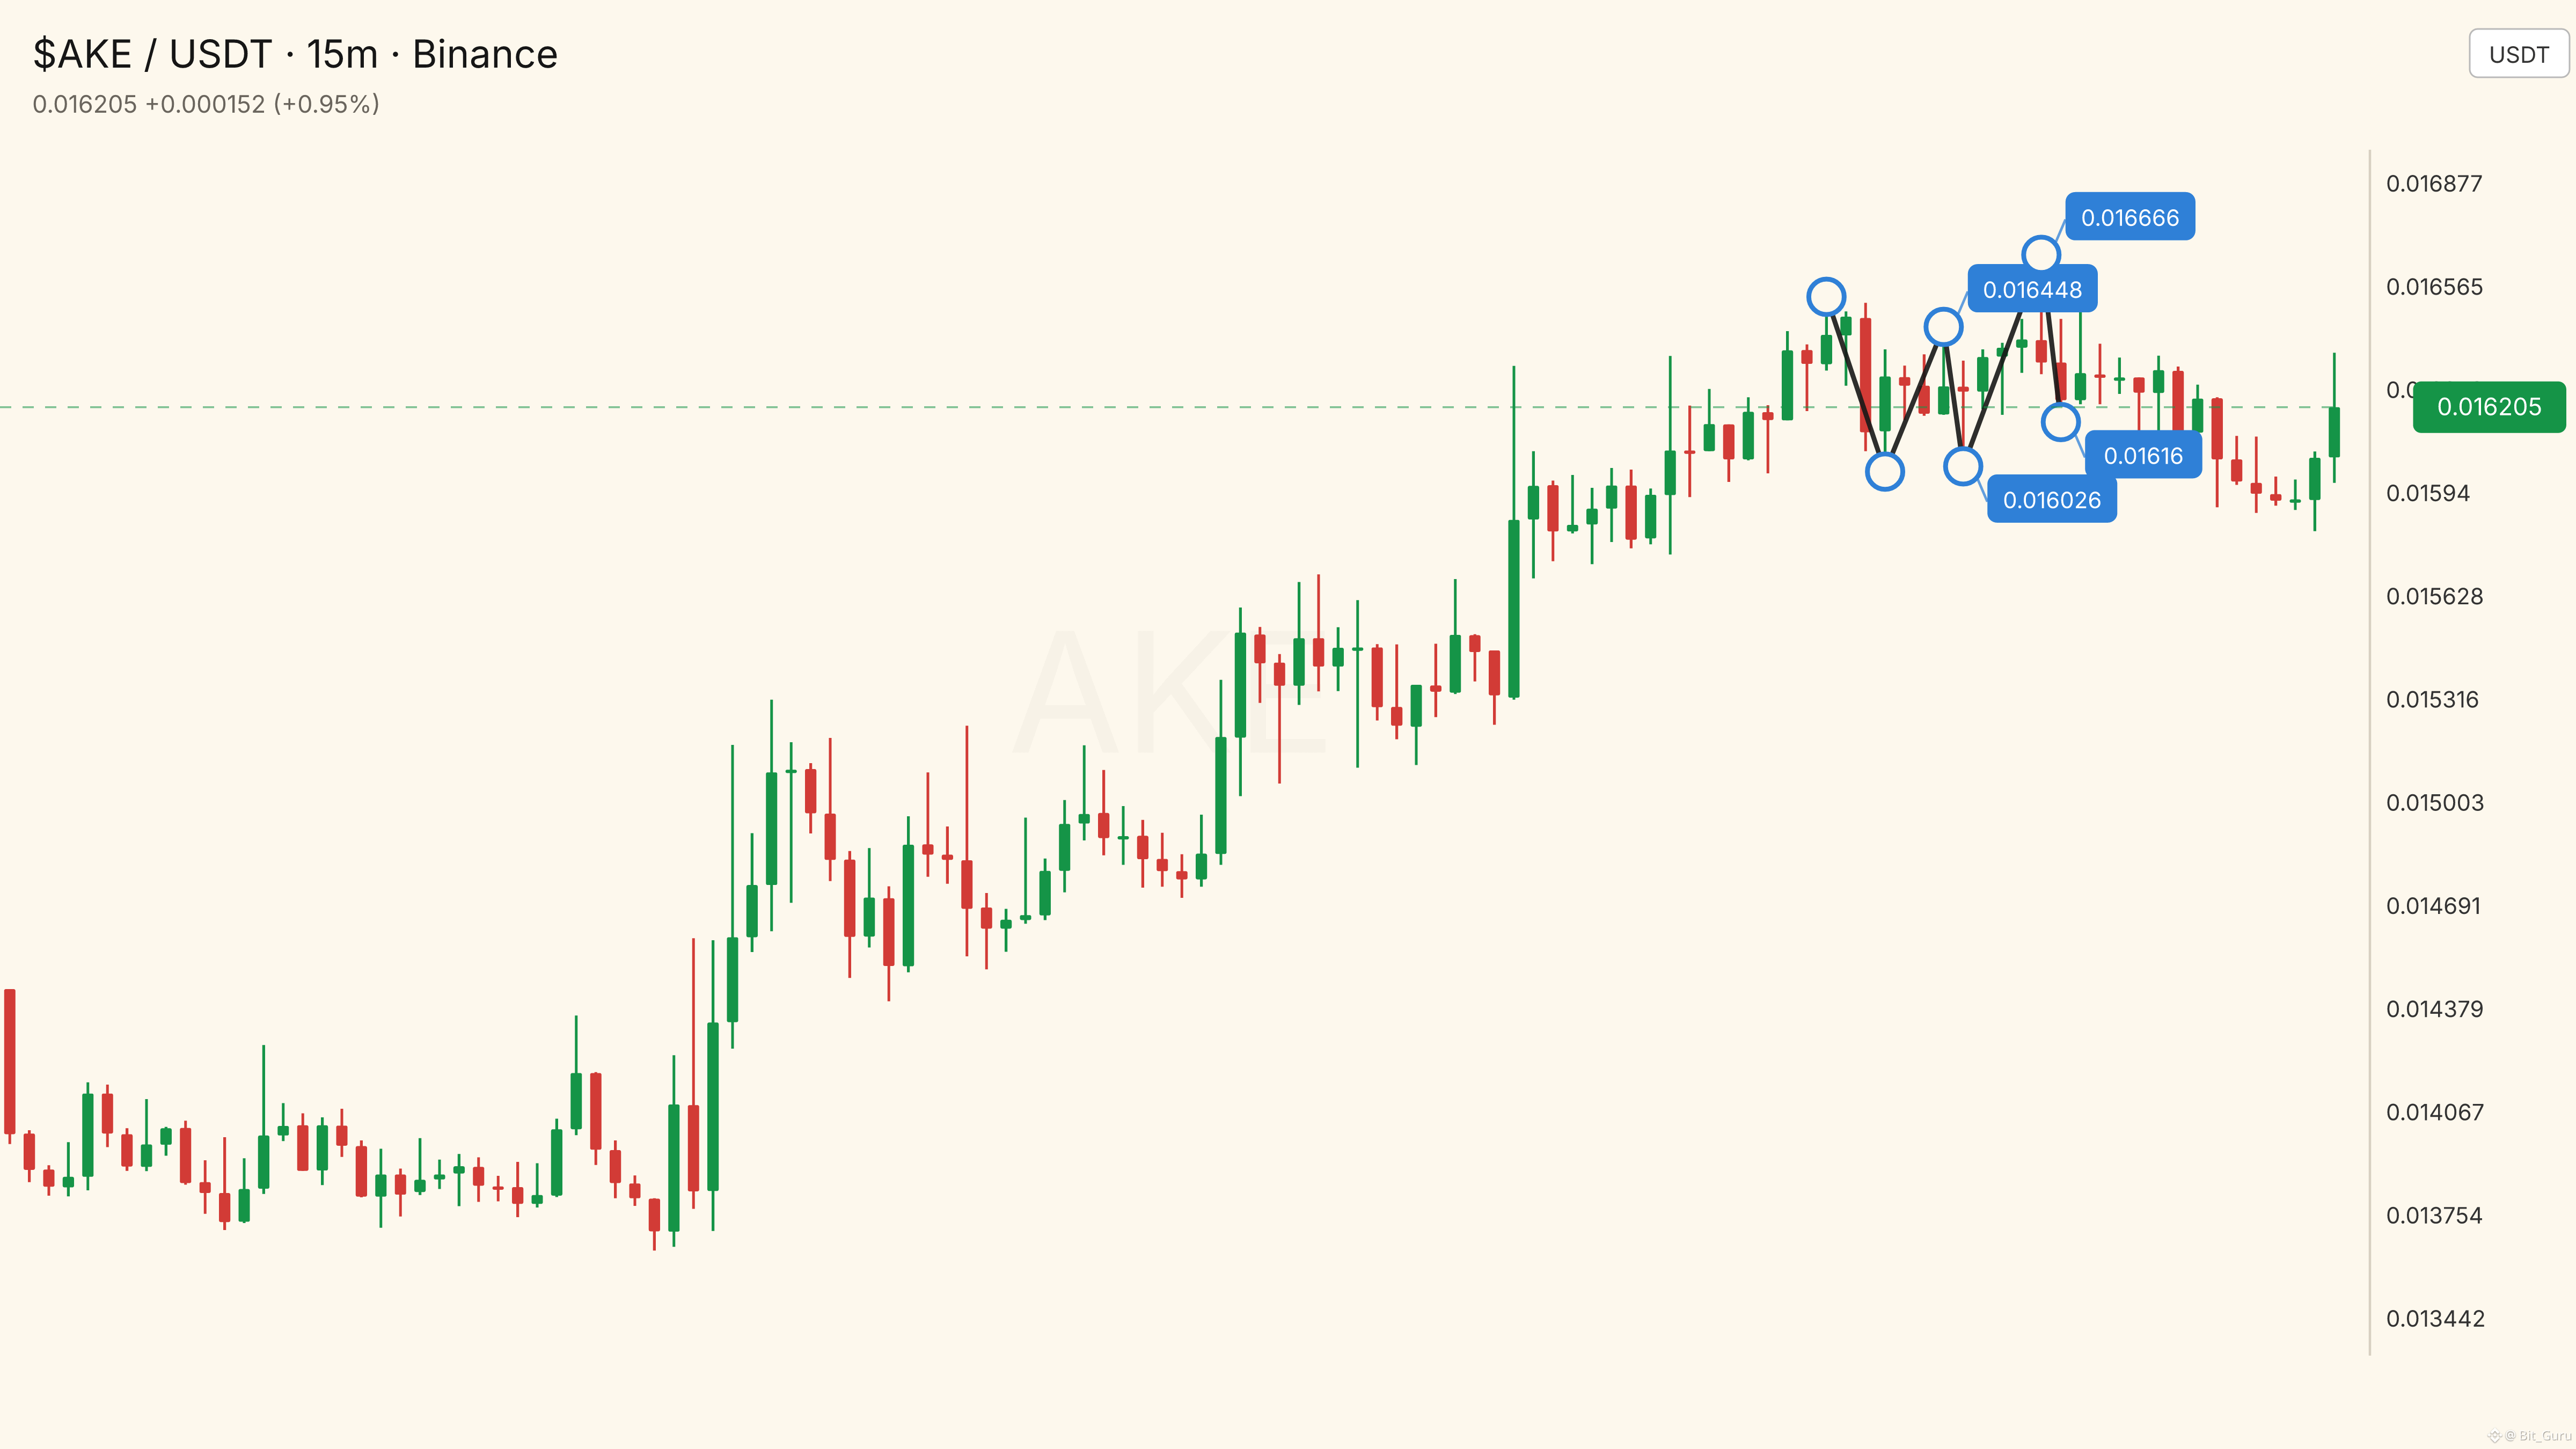
$AKE is in focus… ✅🚨 UP!
Entry: 0.016168 - 0.016184
SL: 0.016082
TP1: 0.016383 | TP2: 0.016482 | TP3: 0.016581
$AKE is in focus… ✅🚨 UP!
Entry: 0.016168 - 0.016184
SL: 0.016082
TP1: 0.016383 | TP2: 0.016482 | TP3: 0.016581
Entry: 0.016168 - 0.016184
SL: 0.016082
TP1: 0.016383 | TP2: 0.016482 | TP3: 0.016581
577
·
--
පරිවර්තනය බලන්න
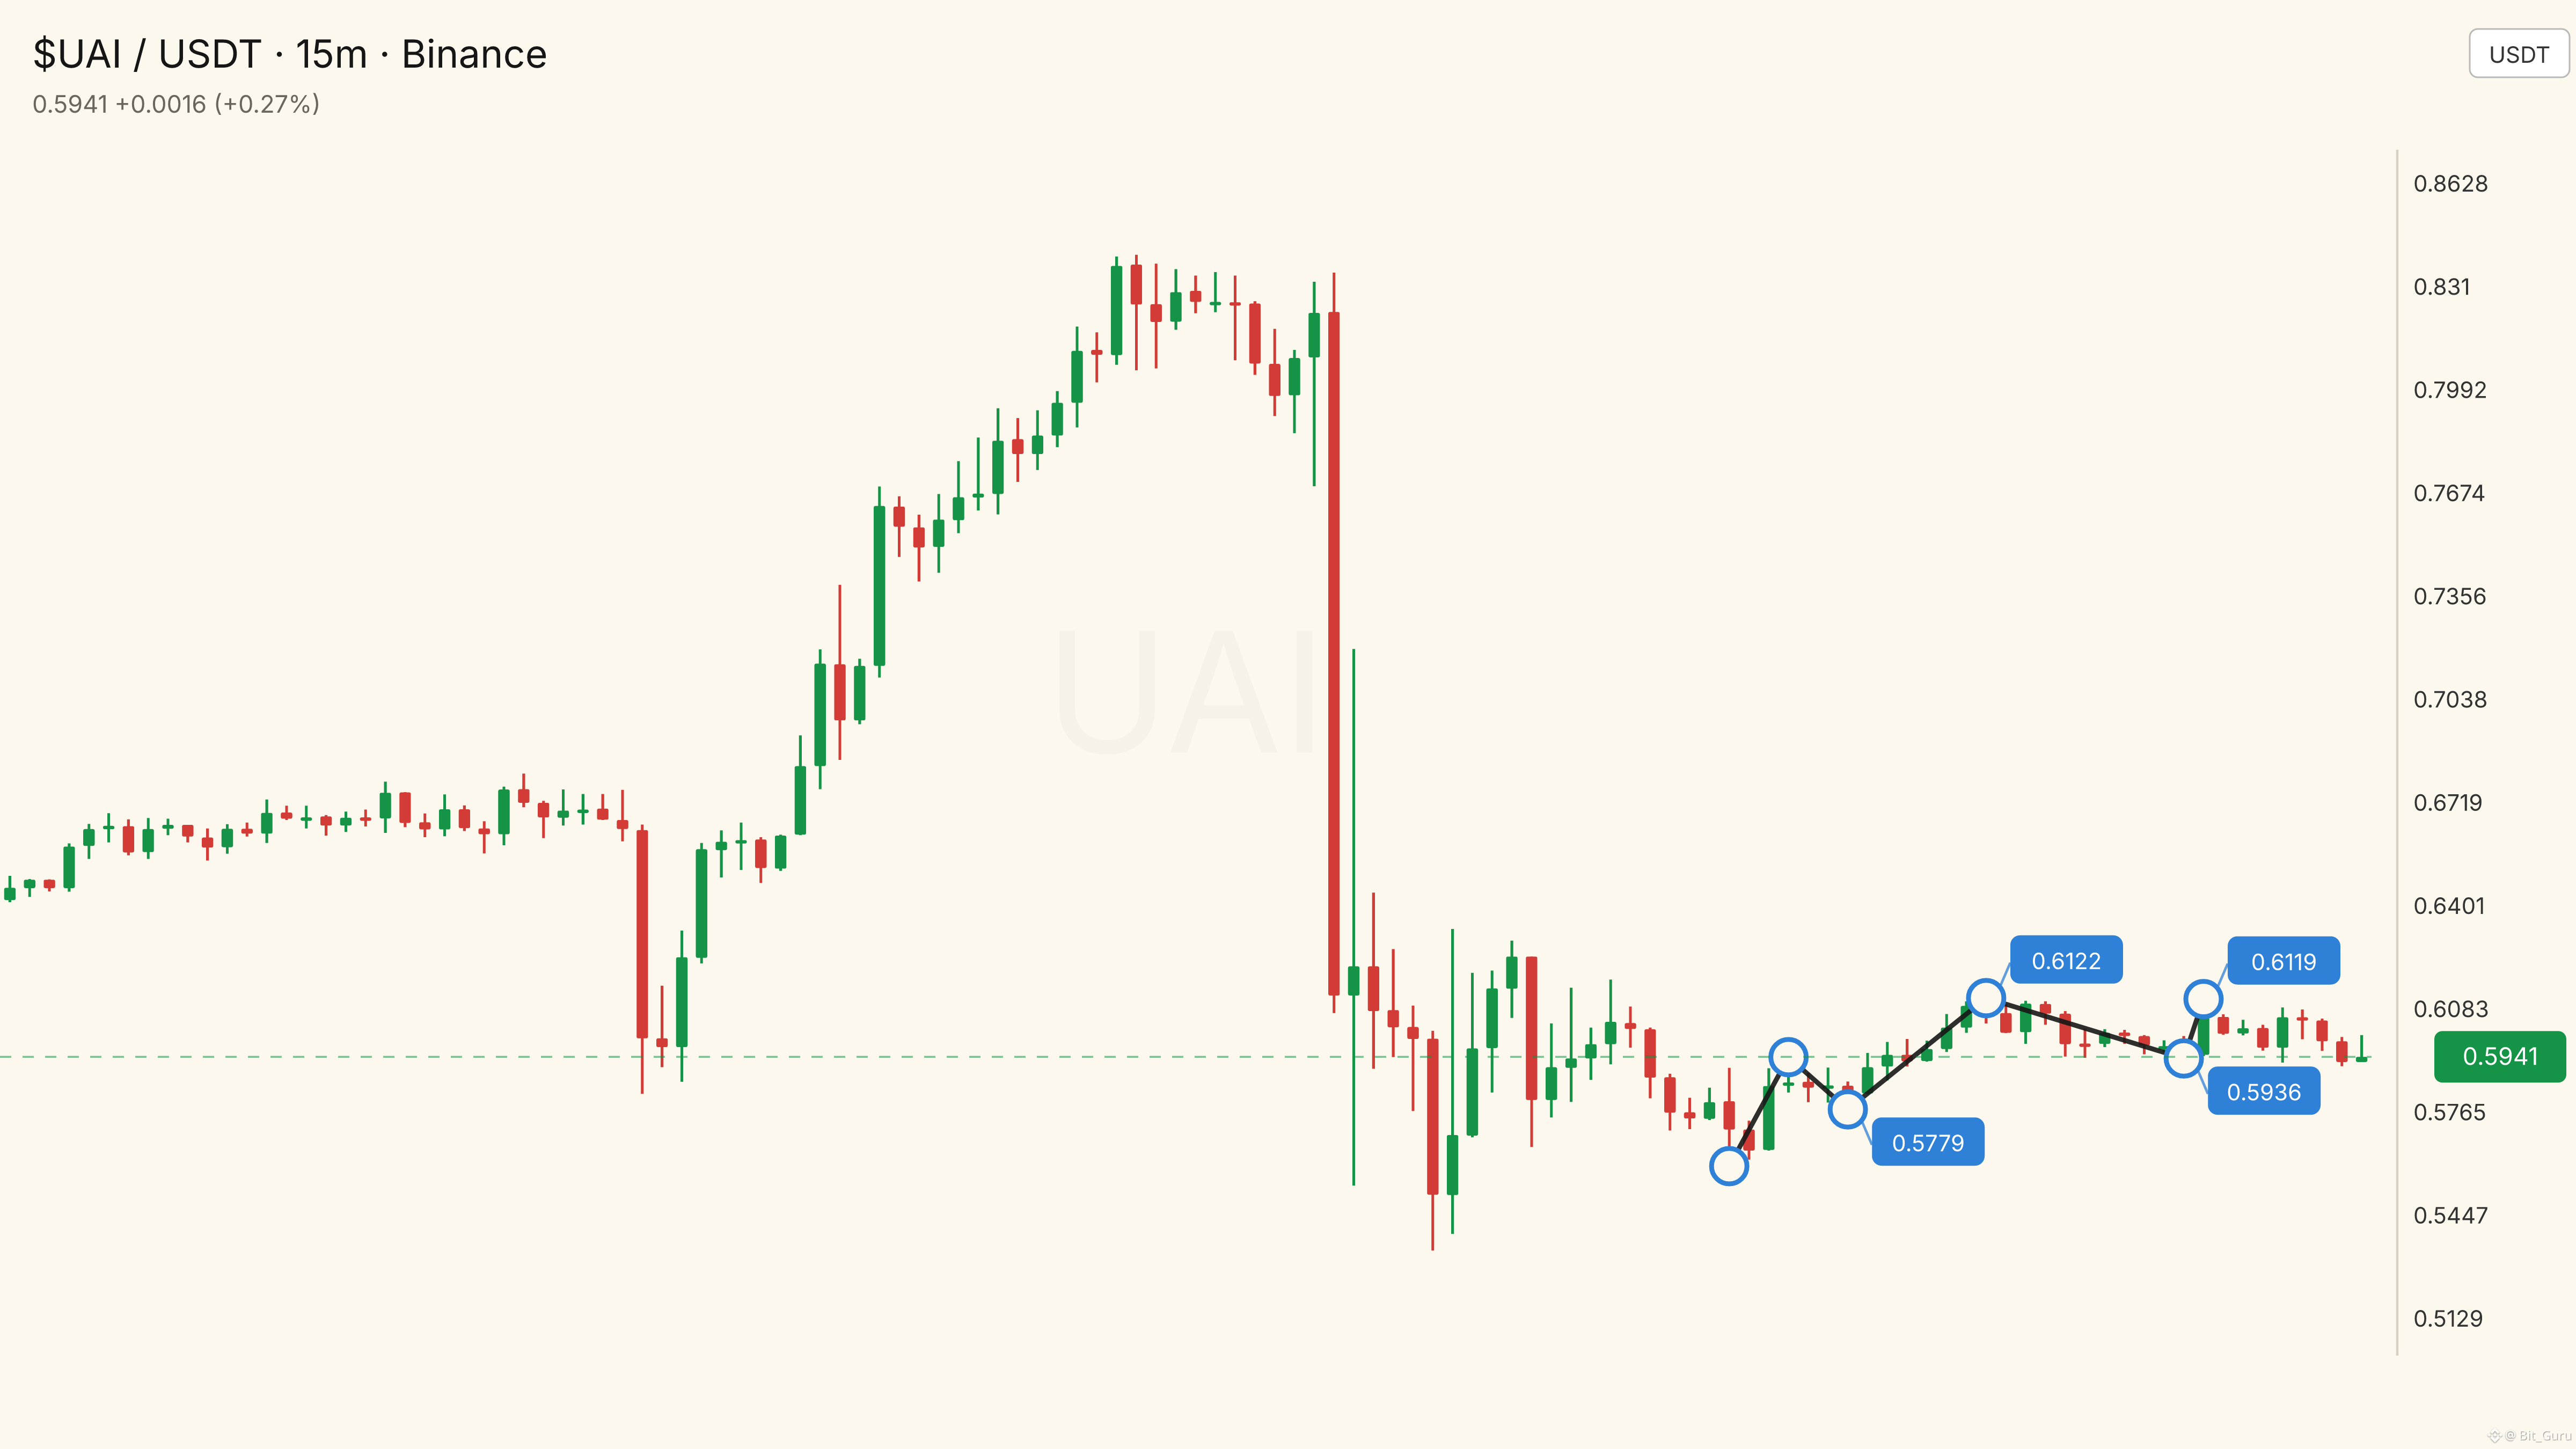
$UAI caught my eye… 👀🔥 DOWN!
Entry: 0.5968 - 0.59739
SL: 0.6014
TP1: 0.58821 | TP2: 0.58391 | TP3: 0.57962
$UAI caught my eye… 👀🔥 DOWN!
Entry: 0.5968 - 0.59739
SL: 0.6014
TP1: 0.58821 | TP2: 0.58391 | TP3: 0.57962
Entry: 0.5968 - 0.59739
SL: 0.6014
TP1: 0.58821 | TP2: 0.58391 | TP3: 0.57962
395
·
--
පරිවර්තනය බලන්න
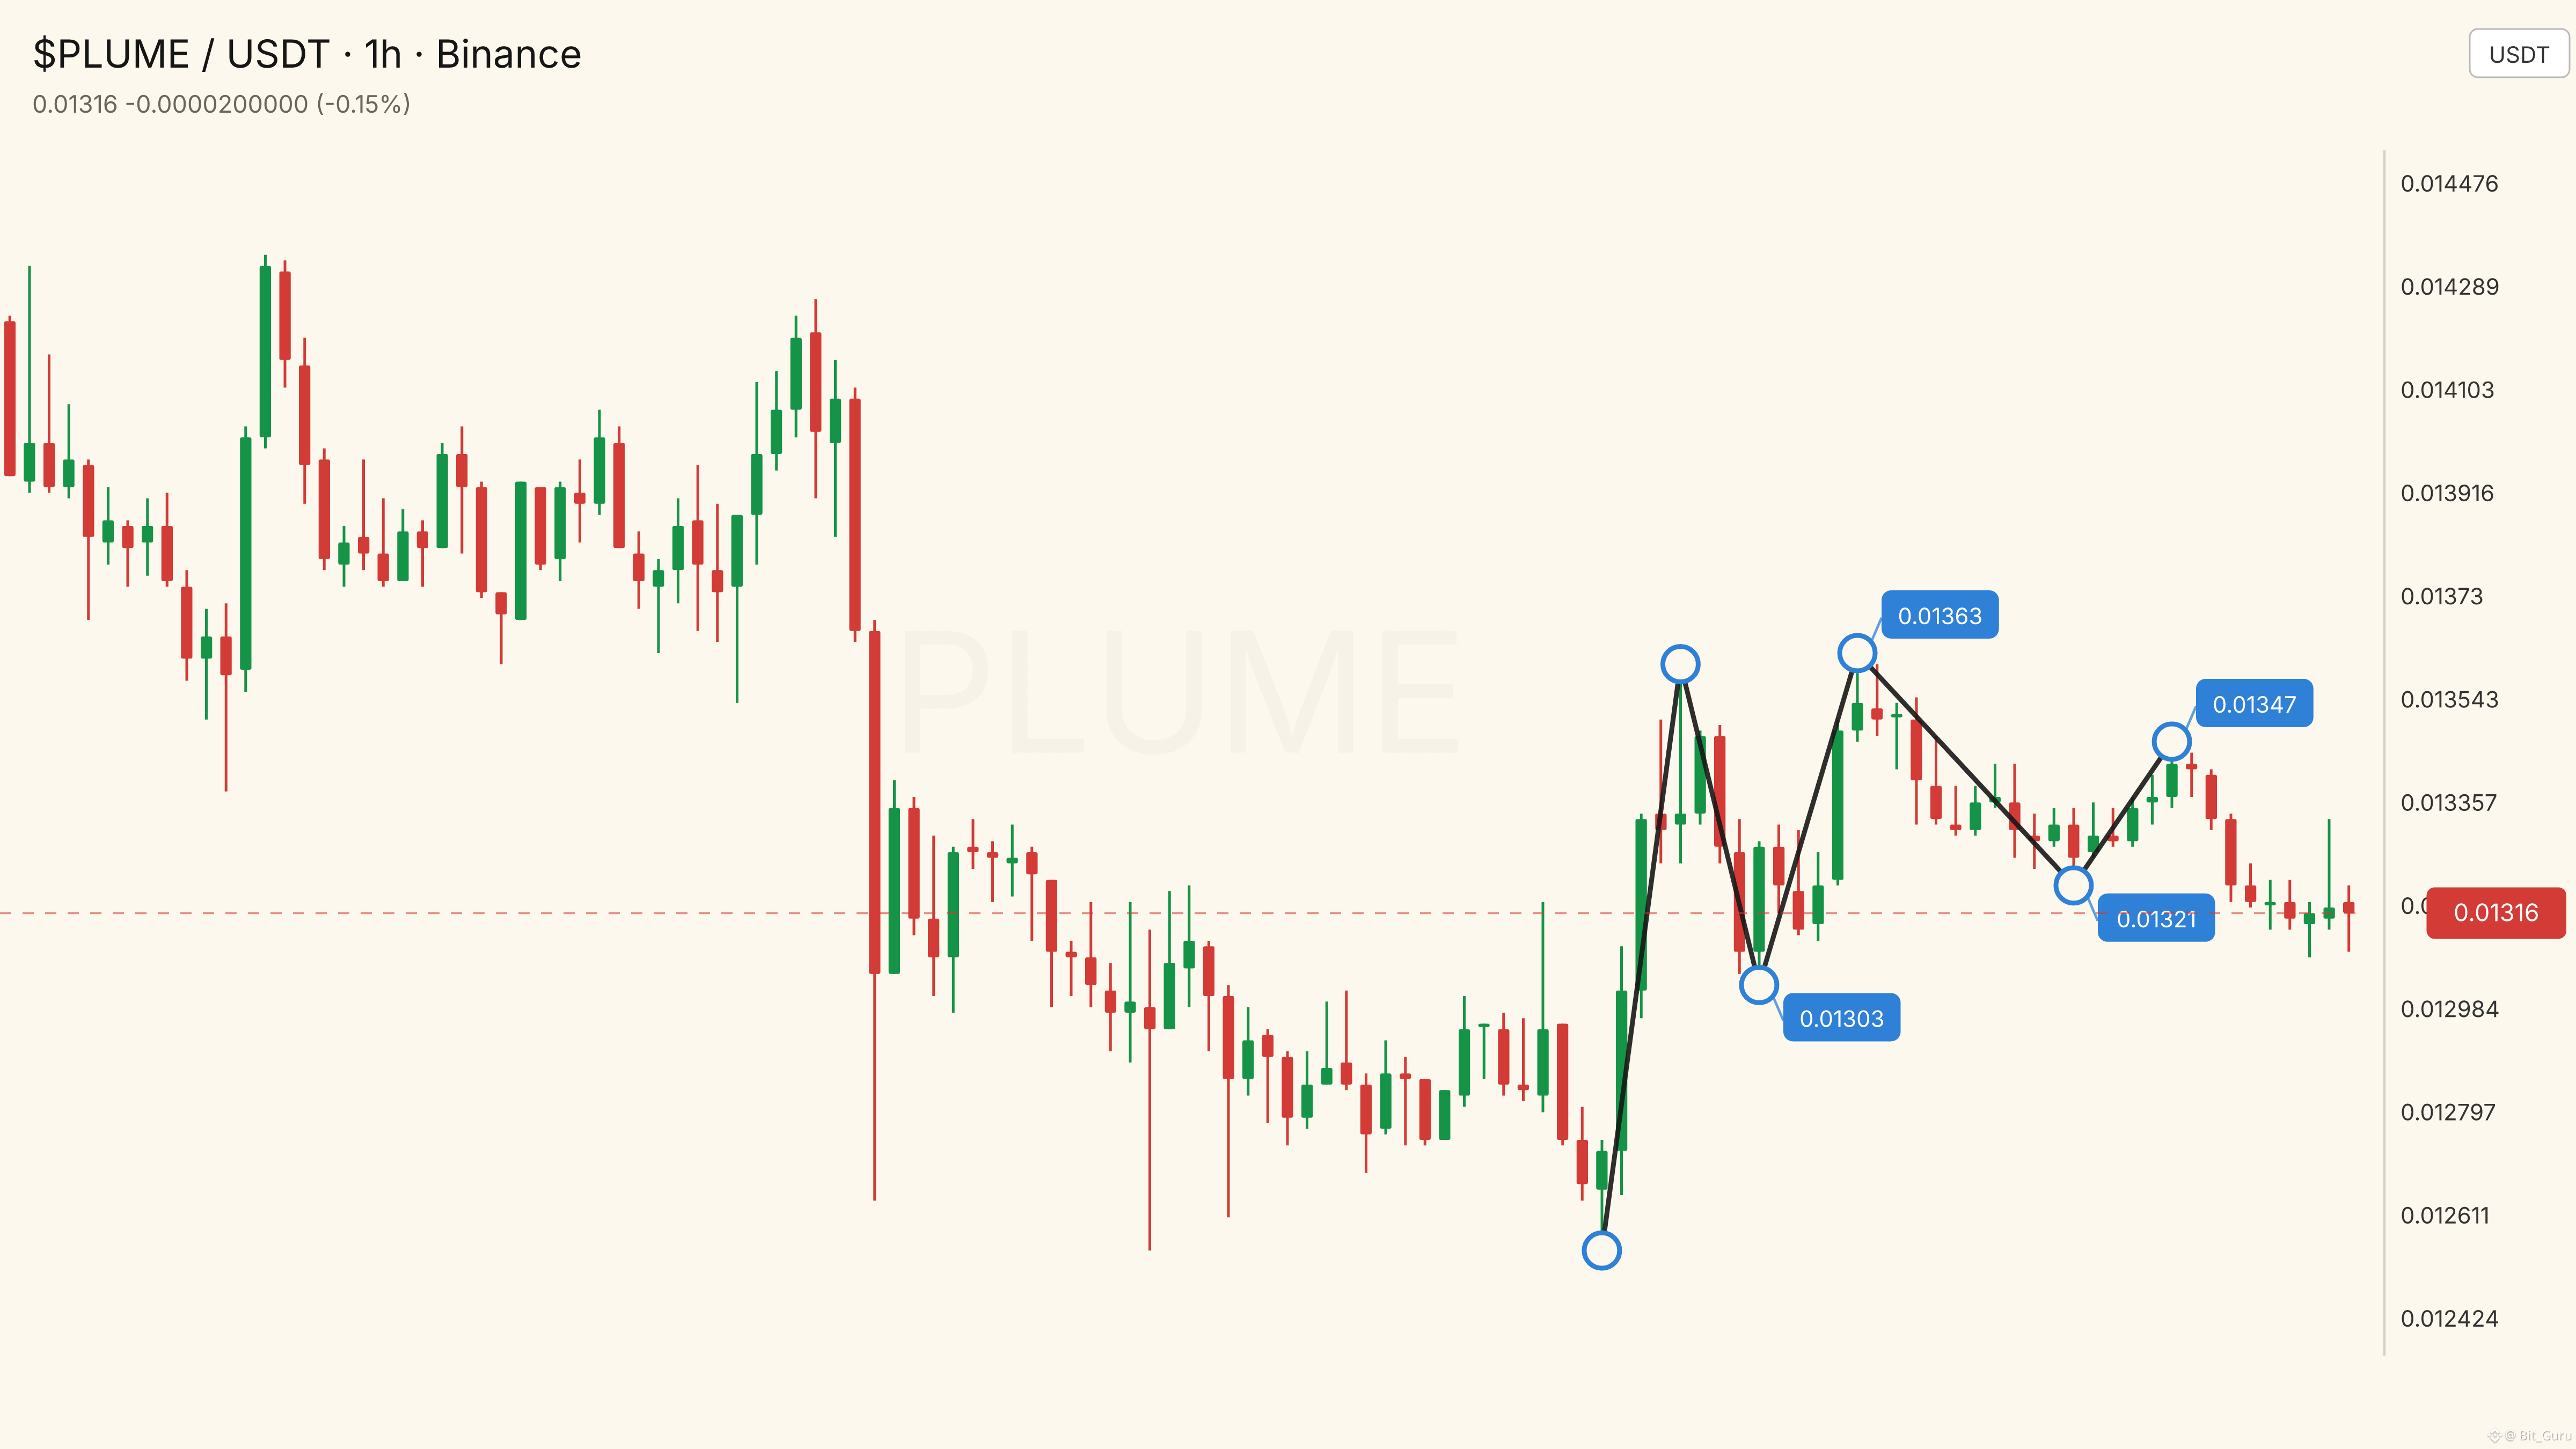
Guys, watch $PLUME closely… 🔥 DOWN!
Entry: 0.013167 - 0.01318
SL: 0.013256
TP1: 0.012993 | TP2: 0.012906 | TP3: 0.012819
Guys, watch $PLUME closely… 🔥 DOWN!
Entry: 0.013167 - 0.01318
SL: 0.013256
TP1: 0.012993 | TP2: 0.012906 | TP3: 0.012819
Entry: 0.013167 - 0.01318
SL: 0.013256
TP1: 0.012993 | TP2: 0.012906 | TP3: 0.012819
358
·
--
පරිවර්තනය බලන්න
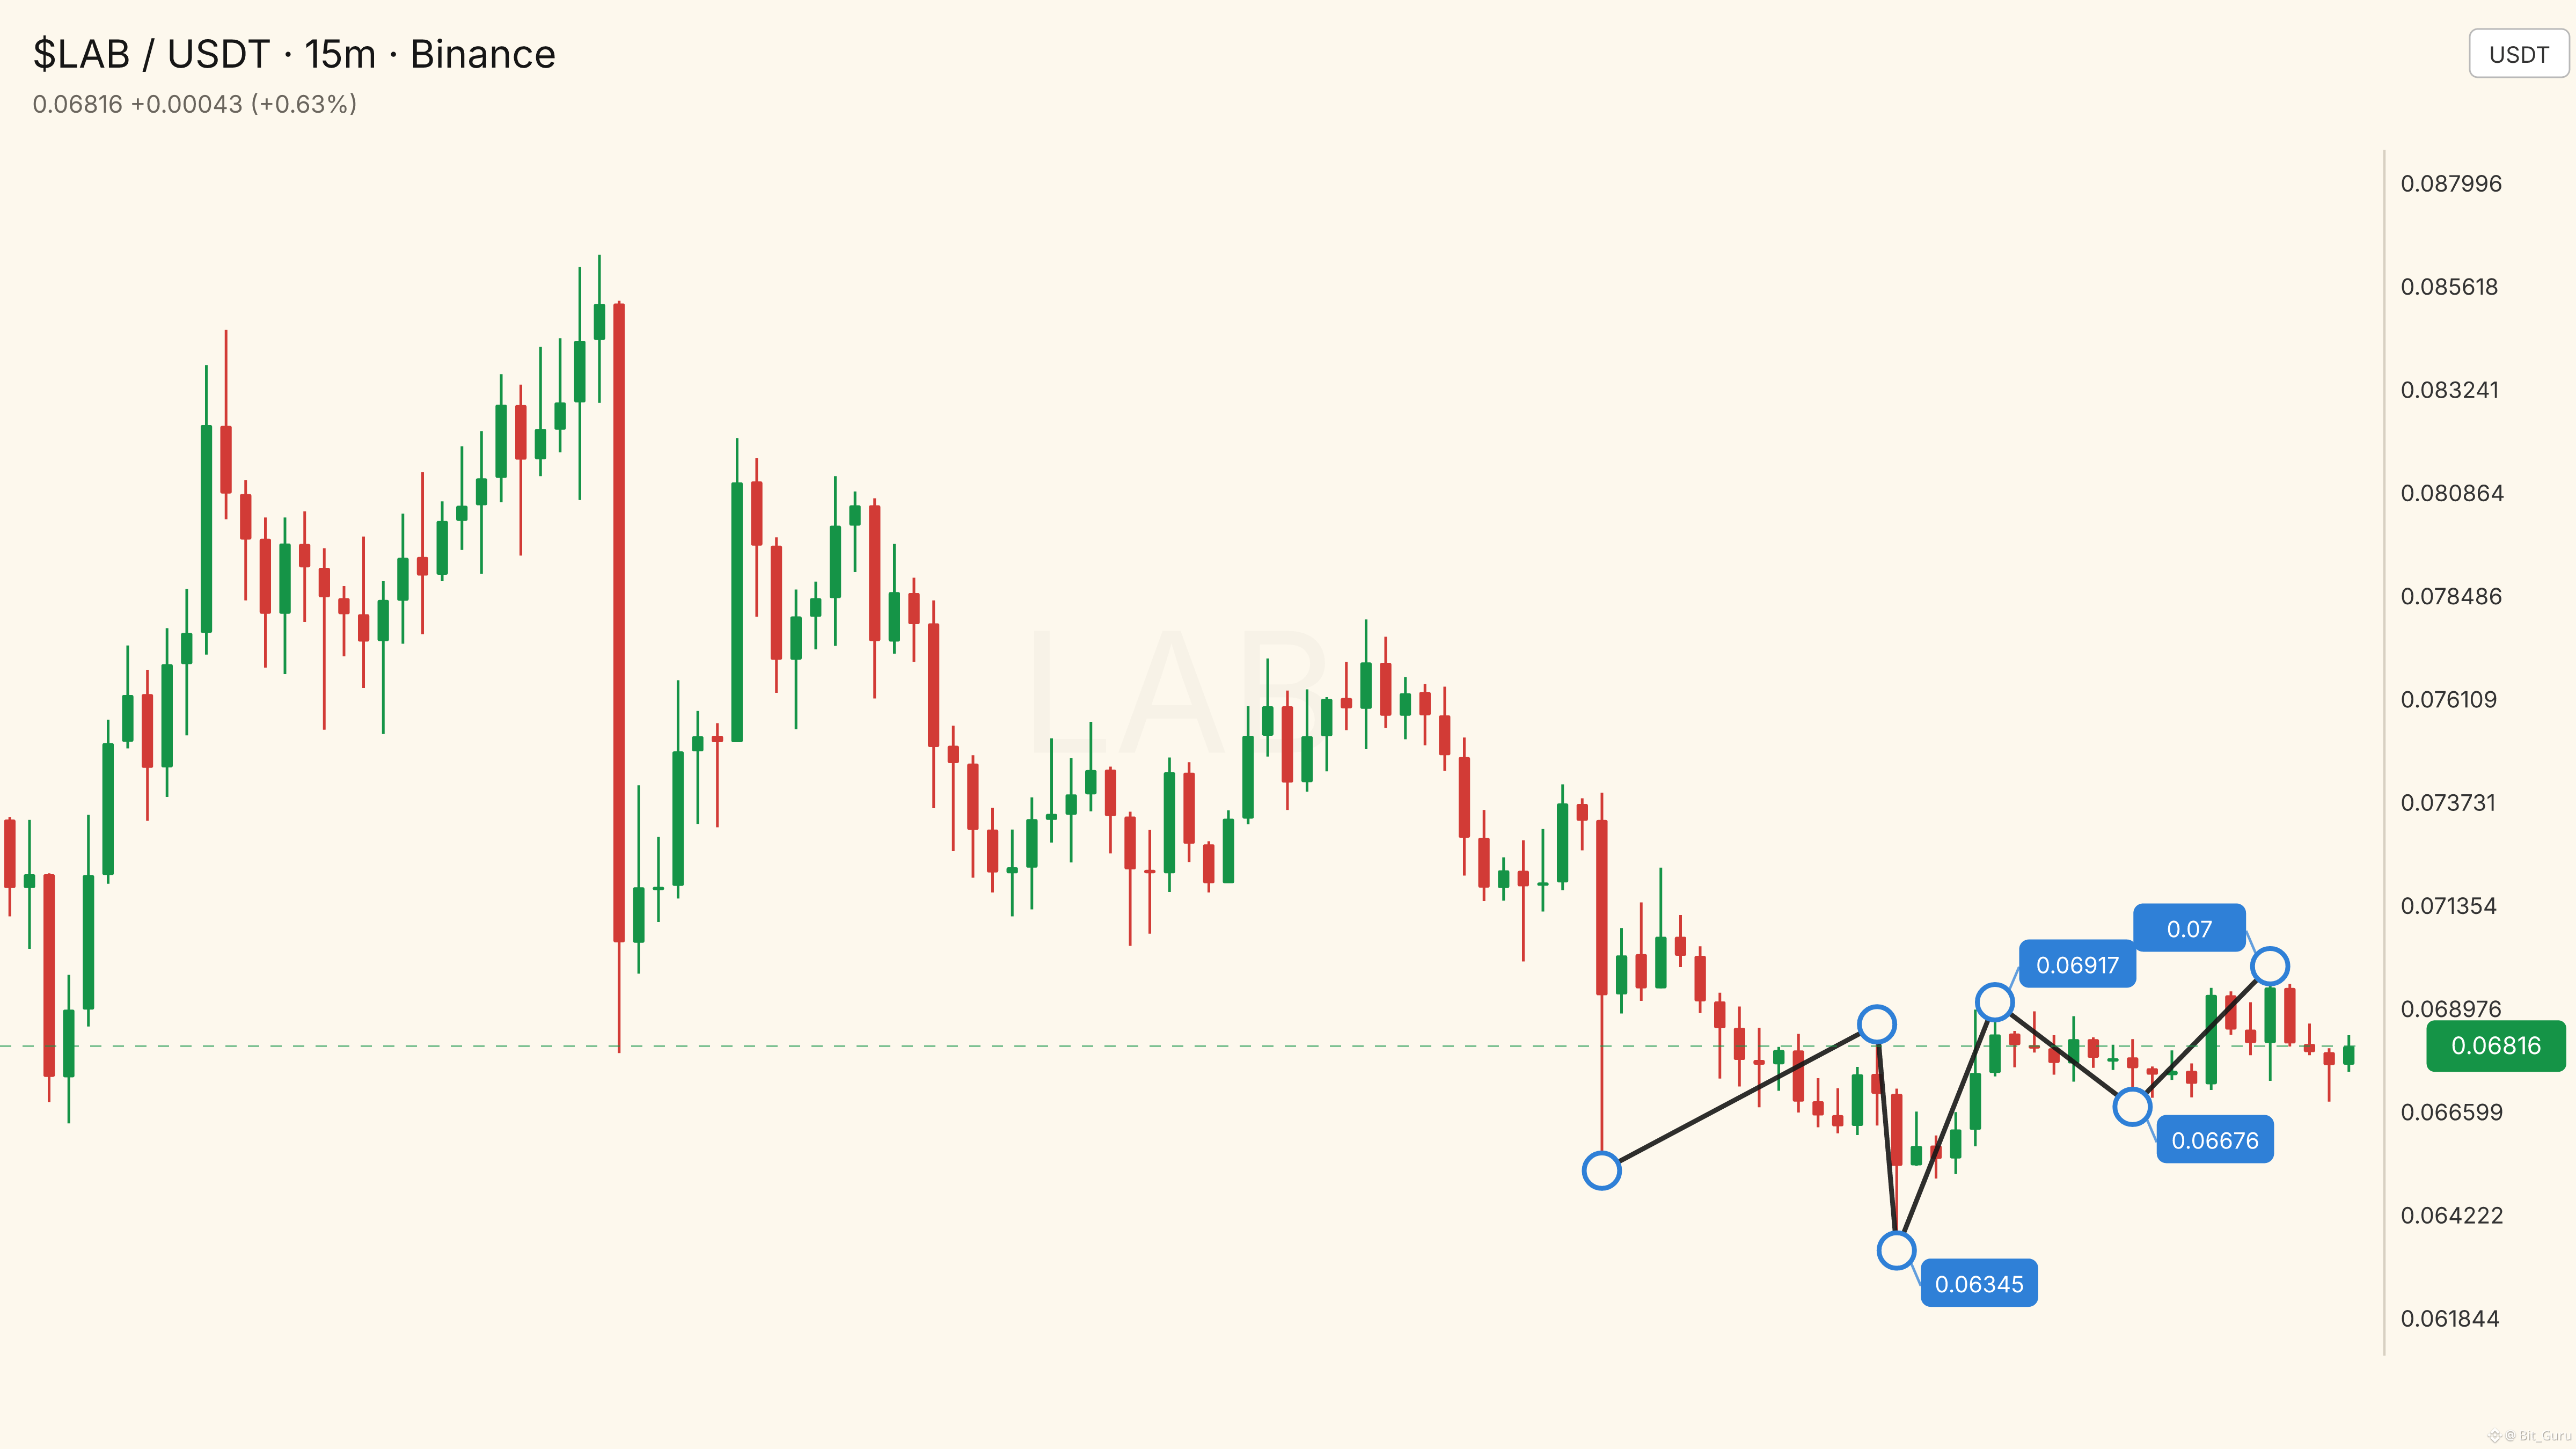
$LAB caught my eye… 👀🔥 DOWN!
Entry: 0.067814 - 0.067882
SL: 0.068391
TP1: 0.066838 | TP2: 0.06635 | TP3: 0.065862
$LAB caught my eye… 👀🔥 DOWN!
Entry: 0.067814 - 0.067882
SL: 0.068391
TP1: 0.066838 | TP2: 0.06635 | TP3: 0.065862
Entry: 0.067814 - 0.067882
SL: 0.068391
TP1: 0.066838 | TP2: 0.06635 | TP3: 0.065862
1
428
·
--
පරිවර්තනය බලන්න
我踏马来了USDT:强势拉升后的短线转弱信号一枚名字夸张、走势更夸张的BSC代币
𝗖𝗼𝗶𝗻 𝗦𝘁𝗼𝗿𝘆:为什么进入观察名单
我踏马来了USDT刚刚进入Bit Guru的小时级Coin Story名单。原因不是它拥有一份完整的项目白皮书,也不是研究资料确认了某项重大合作,而是它在短时间内同时出现了几项交易员很难忽略的特征:价格快速上冲、成交量明显放大、过去一个月涨幅较高,但最新的短周期结构已经出现回落信号。
扫描器使用的交易符号是“我踏马来了USDT”,而CoinGecko记录的项目名称是“我踏马来了”,代币符号同样显示为“我踏马来了”。CoinGecko将其归类为BNB Chain生态、Meme、Chinese Meme以及Four.meme Ecosystem相关代币。研究资料还显示,该代币对应一个部署在BSC上的合约。
名称中的“USDT”需要单独说明。现有资料没有证明它是项目的官方名称、稳定币产品,也没有证明它与Tether存在官方关系。因此,本文把“我踏马来了USDT”视为交易市场使用的完整交易符号,而不是对项目功能的描述。
𝗣𝗿𝗼𝗷𝗲𝗰𝘁 𝗕𝗮𝘀𝗶𝗰𝘀:用途仍然缺少可验证内容
从已经核实的资料看,我踏马来了更接近一个以中文网络表达和社区注意力为核心的Meme代币,而不是已经披露明确产品路线图的基础设施项目。CoinGecko没有提供项目描述,研究数据中也没有白皮书、开发者资料、代码仓库、正式论坛或新闻条目。
因此,不能把它包装成支付、借贷、跨链、游戏或数据服务项目。当前能够确认的属性主要是代币交易和社区传播。它被放进BNB Chain Meme赛道以及Four.meme生态分类,但这些标签只能说明市场归属,不能证明它已经拥有可使用的应用、治理模块或其他实用功能。
这类资产的核心价值通常更多体现为注意力、叙事和流动性,而不是复杂技术。醒目的中文名称可能有助于它在社交传播中被记住,但注意力并不等于长期效用。除非后续出现可验证的应用、治理安排、社区活动或生态整合,否则目前仍然缺少足够资料来判断它是否具备超出交易和传播之外的用途。
𝗘𝗰𝗼𝘀𝘆𝘀𝘁𝗲𝗺:已知信息集中在BNB Chain和Meme属性
现有资料没有确认项目创始人、发行团队、具体上线日期或起源故事。研究数据中没有公告、白皮书、开发活动记录或新闻条目,因此不能把社区传闻当作项目背景。
能够确认的是,代币属于BNB Chain生态,合约部署在BSC,CoinGecko将它列入Four.meme Ecosystem相关分类。数据没有显示质押、治理、收益分配、NFT、游戏、支付或其他实用模块,也没有给出锁仓、流动性挖矿或协议总锁仓价值。
TVL字段为空,开发者数据为空,社区数据也为空。基于这些信息,更准确的描述是:它目前处在交易与社区叙事环境中,而不是一个已经披露完整功能的应用生态。研究资料不足以证明它已经形成稳定的用户基础,也不足以判断团队后续是否会扩展产品功能。
𝗦𝘂𝗽𝗽𝗹𝘆 𝗮𝗻𝗱 𝗩𝗮𝗹𝘂𝗮𝘁𝗶𝗼𝗻:完全流通不等于风险消失
代币经济数据相对清晰。总供应量为10亿枚,最大供应量也是10亿枚,流通供应量同样为10亿枚。数据因此显示其当前处于完全流通状态,流通比例和完全稀释估值比例均为100%。研究资料没有显示额外增发空间,也没有显示未解锁供应。
不过,完全流通不能单独证明合约权限、持仓集中度、代币分配或做市安排已经经过独立验证。研究数据没有提供持仓集中度、管理员权限、税费设置、流动性锁定状态或安全审计结果,所以不能仅凭供应量数据判断代币分配是否健康。
CoinGecko记录的美元价格约为0.015261,市值约1528万美元,市场排名约979。以这个规模来看,它仍属于小市值资产,价格可能受到单一资金流和情绪变化影响。CoinGecko数据显示24小时交易量约1195万美元,Binance市场快照显示报价成交额约7306万美元。两组数字来自不同市场或统计口径,不能直接相加,但都说明近期交易活动较为活跃。
高成交量意味着市场换手明显,却不等于订单簿始终深厚。情绪转向时,成交量与实际可成交深度可能出现差异,这也是小市值Meme代币需要面对的流动性风险。
𝗣𝗿𝗶𝗰𝗲 𝗔𝗰𝘁𝗶𝗼𝗻:日线强势,短线开始降温
Binance市场数据给出的24小时开盘价约为0.012851,最高价0.017590,最低价0.011974,最新价约0.015337,24小时涨幅约19.35%。CoinGecko快照显示,价格约为0.015261,24小时上涨约18.70%,24小时高点约0.017293,低点约0.012253。
两组数据的时间和统计来源不同,但共同说明我踏马来了经历了显著的日内扩张,并且仍处在高波动区间。CoinGecko数据显示,过去7天上涨约6.08%,14天上涨约8.39%,30天上涨约74.52%,60天上涨约89.11%。与此同时,当前价格距离记录中的历史高点0.062415美元仍低约75.55%。该历史高点日期为2026年2月1日,历史低点约0.006562美元,日期为2026年4月2日。
小时K线显示,价格曾从约0.012附近快速上行至0.016上方,期间出现多根大成交量K线。4小时数据中,某一阶段成交量超过17.5亿枚,报价成交额超过2758万美元,随后价格从0.017590附近回落至0.015美元左右。这个过程说明市场注意力集中,也说明冲高后存在较大换手。
上涨本身只能证明此前一段时间买盘占优,不能证明趋势已经稳定。快速拉升后的高位震荡,需要结合回踩承接和后续成交量继续判断。这里属于基于价格数据的市场解读,不是项目方对未来表现的说明。
𝗦𝗰𝗮𝗻𝗻𝗲𝗿 𝗦𝗶𝗴𝗻𝗮𝗹:为什么方向标记为SHORT
Bit Guru的实时RR Trader扫描器在2026年9月12日23:57左右选中该交易对,方向字段标记为SHORT,信心字段显示100,选择评分为167.69,热门分类为TOP_GAINER,排名第10。这里的SHORT是扫描器对当前结构的方向判断,不代表未来结果,也不能视为确定性结论。
扫描器记录的当前价格为0.014693,参考入场区间为0.014700至0.014715,附近阻力为0.0147804375,支持位为0.0146046561。风险控制参考线为0.0148247788,三个下方目标分别为0.0144887673、0.0143829777和0.0142771881,模型给出的风险回报比约为1.93。扫描时15分钟变动为负1.39%,成交量比率为2.22倍。
这组数据描述的是一种短周期与更大周期不完全一致的状态:过去24小时价格仍然上涨接近19%,但扫描时15分钟走势转弱,成交量又高于近期基准。按照量化信号的逻辑,这可能对应冲高后的获利回吐、阻力附近供给增加,或者短线多头主动性减弱。
不过,不能只看信心字段。价格快速跳动、数据延迟、流动性变化和极端波动,都可能让参考区间迅速失去准确性。对于小市值Meme代币,单根K线就可能改变短线结构,因此扫描器信号更适合被理解为某一时点的市场快照。
𝗞𝗲𝘆 𝗟𝗲𝘃𝗲𝗹𝘀:当前结构的观察区域
按照扫描器数据,0.0146047是近端支持,0.0147804是近端阻力。若价格在0.014700至0.014715附近反复受压,并跌破0.0146047,短线回落结构会得到更多确认。模型下方关注的层级是0.0144888、0.0143830和0.0142772。
相反,如果价格重新站稳0.0147804,并进一步突破0.0148248附近的风险控制线,当前扫描器标记的短线看空结构将被削弱。这里的价位只对应当前数据快照,不是永久支撑或阻力。
历史小时数据还显示,0.015至0.016之间曾多次出现激烈换手,0.0162附近以及本轮高点0.017590附近也属于需要观察的区域。价格在这些位置可能继续快速来回,因此单一价位不能替代对成交量和K线收盘表现的观察。
BTCUSDT快照显示,比特币价格约77231.90美元,24小时开盘约77235.90,最高约77477.40,最低约77025.10,24小时变动约为负0.005%。在这份数据里,比特币没有出现与我踏马来了相同幅度的方向性行情。由此看,本轮代币波动更可能与自身的Meme资金和交易结构有关,而不是由BTC单独带动。
但BTC相对平稳并不能消除小市值资产自身的风险。若比特币突然走弱,风险偏好可能收缩;即使BTC保持稳定,近期已经大幅上涨的代币仍可能受到获利兑现影响。
𝗡𝗲𝘄𝘀 𝗖𝗵𝗲𝗰𝗸:没有确认的新闻催化剂
本次研究数据的news字段为空,没有确认的合作、产品发布、交易所公告、团队融资、代币销毁、治理提案或安全事件。因此,不能把这轮上涨归因于某一条已经验证的新闻。
现有资料只能确认价格变化、交易活跃度和扫描器信号,不能确认背后存在官方催化剂。Meme代币经常在价格上涨后出现新的解释,但在缺少原始公告、链上动作或其他可验证材料时,社交媒体热度只能作为情绪变量,不能直接当作基本面改善。
目前也没有研究证据证明项目拥有持续的开发活动、稳定的社区规模或明确的路线图。后续如果出现公告,仍需要核对发布主体、相关链上动作以及公告内容是否真正对应产品使用或生态整合。
𝗥𝗶𝘀𝗸 𝗟𝗶𝘀𝘁:高波动与信息不足并存
第一项风险是项目透明度不足。研究资料没有提供项目描述、白皮书、开发者资料或正式新闻记录,外部研究者因此难以判断团队能力、路线图和长期计划。第二项风险是效用不明确。目前没有证据证明它拥有超出交易和社区传播之外的明确用途。
第三项风险是流动性与滑点。24小时成交量较高,但高成交量不等于订单簿始终深厚,情绪反转时买卖价差可能扩大。第四项风险是合约与持仓信息不完整。研究资料没有给出持仓集中度、流动性锁定状态、管理员权限、税费设置或安全审计结果。
第五项风险来自近期涨幅。30天涨幅约74.52%,60天涨幅约89.11%,价格快速上行后,短线获利盘压力不能忽略。第六项风险是数据时间差异。扫描器价格为0.014693,Binance快照价格约0.015337,CoinGecko价格约0.015261,更新时间和统计口径并不相同。高速波动期间,几分钟甚至更短的差异都可能改变信号质量。
最后仍要注意名称混淆。“我踏马来了USDT”包含USDT字样,但研究资料没有证明它是稳定币,也没有证明它与Tether存在官方关系。识别资产时,名称不能替代合约和市场数据核对。
𝗙𝗶𝗻𝗮𝗹 𝗩𝗶𝗲𝘄:观察结构,而不是追逐叙事
综合来看,我踏马来了USDT是一枚高弹性的BNB Chain Meme代币:供应数据清楚,当前市场交易活跃,近期涨幅醒目,但项目用途、团队背景、开发活动和生态进展仍缺少可验证内容。
扫描器捕捉到的是强势上涨后的短线转弱,而不是已经被基本面证实的长期看空结论。当前需要观察0.0146047支持是否有效,0.0147804和0.0148248附近是否重新被价格收复,以及成交量能否在更高价格区域持续,而不是只在冲高时短暂放大。
更高时间周期同样重要。小时和4小时数据已经显示出大幅波动,后续价格能否在0.015至0.016区域形成新的整理平台,将比单次冲高更能说明短线结构。与此同时,项目是否出现经过核实的团队资料、产品进展或链上活动,也将影响市场对它的理解。
这枚代币的名字确实醒目,走势也足够激烈,但目前最重要的事实仍然是:它拥有显著交易热度,却缺少相匹配的基本面披露。Bit Guru的判断保持在数据范围内——关注支持、阻力、成交量和信息透明度,避免把短线信号误读成长期结论。
我踏马来了USDT:强势拉升后的短线转弱信号
一枚名字夸张、走势更夸张的BSC代币
𝗖𝗼𝗶𝗻 𝗦𝘁𝗼𝗿𝘆:为什么进入观察名单
我踏马来了USDT刚刚进入Bit Guru的小时级Coin Story名单。原因不是它拥有一份完整的项目白皮书,也不是研究资料确认了某项重大合作,而是它在短时间内同时出现了几项交易员很难忽略的特征:价格快速上冲、成交量明显放大、过去一个月涨幅较高,但最新的短周期结构已经出现回落信号。
扫描器使用的交易符号是“我踏马来了USDT”,而CoinGecko记录的项目名称是“我踏马来了”,代币符号同样显示为“我踏马来了”。CoinGecko将其归类为BNB Chain生态、Meme、Chinese Meme以及Four.meme Ecosystem相关代币。研究资料还显示,该代币对应一个部署在BSC上的合约。
名称中的“USDT”需要单独说明。现有资料没有证明它是项目的官方名称、稳定币产品,也没有证明它与Tether存在官方关系。因此,本文把“我踏马来了USDT”视为交易市场使用的完整交易符号,而不是对项目功能的描述。
𝗣𝗿𝗼𝗷𝗲𝗰𝘁 𝗕𝗮𝘀𝗶𝗰𝘀:用途仍然缺少可验证内容
从已经核实的资料看,我踏马来了更接近一个以中文网络表达和社区注意力为核心的Meme代币,而不是已经披露明确产品路线图的基础设施项目。CoinGecko没有提供项目描述,研究数据中也没有白皮书、开发者资料、代码仓库、正式论坛或新闻条目。
因此,不能把它包装成支付、借贷、跨链、游戏或数据服务项目。当前能够确认的属性主要是代币交易和社区传播。它被放进BNB Chain Meme赛道以及Four.meme生态分类,但这些标签只能说明市场归属,不能证明它已经拥有可使用的应用、治理模块或其他实用功能。
这类资产的核心价值通常更多体现为注意力、叙事和流动性,而不是复杂技术。醒目的中文名称可能有助于它在社交传播中被记住,但注意力并不等于长期效用。除非后续出现可验证的应用、治理安排、社区活动或生态整合,否则目前仍然缺少足够资料来判断它是否具备超出交易和传播之外的用途。
𝗘𝗰𝗼𝘀𝘆𝘀𝘁𝗲𝗺:已知信息集中在BNB Chain和Meme属性
现有资料没有确认项目创始人、发行团队、具体上线日期或起源故事。研究数据中没有公告、白皮书、开发活动记录或新闻条目,因此不能把社区传闻当作项目背景。
能够确认的是,代币属于BNB Chain生态,合约部署在BSC,CoinGecko将它列入Four.meme Ecosystem相关分类。数据没有显示质押、治理、收益分配、NFT、游戏、支付或其他实用模块,也没有给出锁仓、流动性挖矿或协议总锁仓价值。
TVL字段为空,开发者数据为空,社区数据也为空。基于这些信息,更准确的描述是:它目前处在交易与社区叙事环境中,而不是一个已经披露完整功能的应用生态。研究资料不足以证明它已经形成稳定的用户基础,也不足以判断团队后续是否会扩展产品功能。
𝗦𝘂𝗽𝗽𝗹𝘆 𝗮𝗻𝗱 𝗩𝗮𝗹𝘂𝗮𝘁𝗶𝗼𝗻:完全流通不等于风险消失
代币经济数据相对清晰。总供应量为10亿枚,最大供应量也是10亿枚,流通供应量同样为10亿枚。数据因此显示其当前处于完全流通状态,流通比例和完全稀释估值比例均为100%。研究资料没有显示额外增发空间,也没有显示未解锁供应。
不过,完全流通不能单独证明合约权限、持仓集中度、代币分配或做市安排已经经过独立验证。研究数据没有提供持仓集中度、管理员权限、税费设置、流动性锁定状态或安全审计结果,所以不能仅凭供应量数据判断代币分配是否健康。
CoinGecko记录的美元价格约为0.015261,市值约1528万美元,市场排名约979。以这个规模来看,它仍属于小市值资产,价格可能受到单一资金流和情绪变化影响。CoinGecko数据显示24小时交易量约1195万美元,Binance市场快照显示报价成交额约7306万美元。两组数字来自不同市场或统计口径,不能直接相加,但都说明近期交易活动较为活跃。
高成交量意味着市场换手明显,却不等于订单簿始终深厚。情绪转向时,成交量与实际可成交深度可能出现差异,这也是小市值Meme代币需要面对的流动性风险。
𝗣𝗿𝗶𝗰𝗲 𝗔𝗰𝘁𝗶𝗼𝗻:日线强势,短线开始降温
Binance市场数据给出的24小时开盘价约为0.012851,最高价0.017590,最低价0.011974,最新价约0.015337,24小时涨幅约19.35%。CoinGecko快照显示,价格约为0.015261,24小时上涨约18.70%,24小时高点约0.017293,低点约0.012253。
两组数据的时间和统计来源不同,但共同说明我踏马来了经历了显著的日内扩张,并且仍处在高波动区间。CoinGecko数据显示,过去7天上涨约6.08%,14天上涨约8.39%,30天上涨约74.52%,60天上涨约89.11%。与此同时,当前价格距离记录中的历史高点0.062415美元仍低约75.55%。该历史高点日期为2026年2月1日,历史低点约0.006562美元,日期为2026年4月2日。
小时K线显示,价格曾从约0.012附近快速上行至0.016上方,期间出现多根大成交量K线。4小时数据中,某一阶段成交量超过17.5亿枚,报价成交额超过2758万美元,随后价格从0.017590附近回落至0.015美元左右。这个过程说明市场注意力集中,也说明冲高后存在较大换手。
上涨本身只能证明此前一段时间买盘占优,不能证明趋势已经稳定。快速拉升后的高位震荡,需要结合回踩承接和后续成交量继续判断。这里属于基于价格数据的市场解读,不是项目方对未来表现的说明。
𝗦𝗰𝗮𝗻𝗻𝗲𝗿 𝗦𝗶𝗴𝗻𝗮𝗹:为什么方向标记为SHORT
Bit Guru的实时RR Trader扫描器在2026年9月12日23:57左右选中该交易对,方向字段标记为SHORT,信心字段显示100,选择评分为167.69,热门分类为TOP_GAINER,排名第10。这里的SHORT是扫描器对当前结构的方向判断,不代表未来结果,也不能视为确定性结论。
扫描器记录的当前价格为0.014693,参考入场区间为0.014700至0.014715,附近阻力为0.0147804375,支持位为0.0146046561。风险控制参考线为0.0148247788,三个下方目标分别为0.0144887673、0.0143829777和0.0142771881,模型给出的风险回报比约为1.93。扫描时15分钟变动为负1.39%,成交量比率为2.22倍。
这组数据描述的是一种短周期与更大周期不完全一致的状态:过去24小时价格仍然上涨接近19%,但扫描时15分钟走势转弱,成交量又高于近期基准。按照量化信号的逻辑,这可能对应冲高后的获利回吐、阻力附近供给增加,或者短线多头主动性减弱。
不过,不能只看信心字段。价格快速跳动、数据延迟、流动性变化和极端波动,都可能让参考区间迅速失去准确性。对于小市值Meme代币,单根K线就可能改变短线结构,因此扫描器信号更适合被理解为某一时点的市场快照。
𝗞𝗲𝘆 𝗟𝗲𝘃𝗲𝗹𝘀:当前结构的观察区域
按照扫描器数据,0.0146047是近端支持,0.0147804是近端阻力。若价格在0.014700至0.014715附近反复受压,并跌破0.0146047,短线回落结构会得到更多确认。模型下方关注的层级是0.0144888、0.0143830和0.0142772。
相反,如果价格重新站稳0.0147804,并进一步突破0.0148248附近的风险控制线,当前扫描器标记的短线看空结构将被削弱。这里的价位只对应当前数据快照,不是永久支撑或阻力。
历史小时数据还显示,0.015至0.016之间曾多次出现激烈换手,0.0162附近以及本轮高点0.017590附近也属于需要观察的区域。价格在这些位置可能继续快速来回,因此单一价位不能替代对成交量和K线收盘表现的观察。
BTCUSDT快照显示,比特币价格约77231.90美元,24小时开盘约77235.90,最高约77477.40,最低约77025.10,24小时变动约为负0.005%。在这份数据里,比特币没有出现与我踏马来了相同幅度的方向性行情。由此看,本轮代币波动更可能与自身的Meme资金和交易结构有关,而不是由BTC单独带动。
但BTC相对平稳并不能消除小市值资产自身的风险。若比特币突然走弱,风险偏好可能收缩;即使BTC保持稳定,近期已经大幅上涨的代币仍可能受到获利兑现影响。
𝗡𝗲𝘄𝘀 𝗖𝗵𝗲𝗰𝗸:没有确认的新闻催化剂
本次研究数据的news字段为空,没有确认的合作、产品发布、交易所公告、团队融资、代币销毁、治理提案或安全事件。因此,不能把这轮上涨归因于某一条已经验证的新闻。
现有资料只能确认价格变化、交易活跃度和扫描器信号,不能确认背后存在官方催化剂。Meme代币经常在价格上涨后出现新的解释,但在缺少原始公告、链上动作或其他可验证材料时,社交媒体热度只能作为情绪变量,不能直接当作基本面改善。
目前也没有研究证据证明项目拥有持续的开发活动、稳定的社区规模或明确的路线图。后续如果出现公告,仍需要核对发布主体、相关链上动作以及公告内容是否真正对应产品使用或生态整合。
𝗥𝗶𝘀𝗸 𝗟𝗶𝘀𝘁:高波动与信息不足并存
第一项风险是项目透明度不足。研究资料没有提供项目描述、白皮书、开发者资料或正式新闻记录,外部研究者因此难以判断团队能力、路线图和长期计划。第二项风险是效用不明确。目前没有证据证明它拥有超出交易和社区传播之外的明确用途。
第三项风险是流动性与滑点。24小时成交量较高,但高成交量不等于订单簿始终深厚,情绪反转时买卖价差可能扩大。第四项风险是合约与持仓信息不完整。研究资料没有给出持仓集中度、流动性锁定状态、管理员权限、税费设置或安全审计结果。
第五项风险来自近期涨幅。30天涨幅约74.52%,60天涨幅约89.11%,价格快速上行后,短线获利盘压力不能忽略。第六项风险是数据时间差异。扫描器价格为0.014693,Binance快照价格约0.015337,CoinGecko价格约0.015261,更新时间和统计口径并不相同。高速波动期间,几分钟甚至更短的差异都可能改变信号质量。
最后仍要注意名称混淆。“我踏马来了USDT”包含USDT字样,但研究资料没有证明它是稳定币,也没有证明它与Tether存在官方关系。识别资产时,名称不能替代合约和市场数据核对。
𝗙𝗶𝗻𝗮𝗹 𝗩𝗶𝗲𝘄:观察结构,而不是追逐叙事
综合来看,我踏马来了USDT是一枚高弹性的BNB Chain Meme代币:供应数据清楚,当前市场交易活跃,近期涨幅醒目,但项目用途、团队背景、开发活动和生态进展仍缺少可验证内容。
扫描器捕捉到的是强势上涨后的短线转弱,而不是已经被基本面证实的长期看空结论。当前需要观察0.0146047支持是否有效,0.0147804和0.0148248附近是否重新被价格收复,以及成交量能否在更高价格区域持续,而不是只在冲高时短暂放大。
更高时间周期同样重要。小时和4小时数据已经显示出大幅波动,后续价格能否在0.015至0.016区域形成新的整理平台,将比单次冲高更能说明短线结构。与此同时,项目是否出现经过核实的团队资料、产品进展或链上活动,也将影响市场对它的理解。
这枚代币的名字确实醒目,走势也足够激烈,但目前最重要的事实仍然是:它拥有显著交易热度,却缺少相匹配的基本面披露。Bit Guru的判断保持在数据范围内——关注支持、阻力、成交量和信息透明度,避免把短线信号误读成长期结论。
𝗖𝗼𝗶𝗻 𝗦𝘁𝗼𝗿𝘆:为什么进入观察名单
我踏马来了USDT刚刚进入Bit Guru的小时级Coin Story名单。原因不是它拥有一份完整的项目白皮书,也不是研究资料确认了某项重大合作,而是它在短时间内同时出现了几项交易员很难忽略的特征:价格快速上冲、成交量明显放大、过去一个月涨幅较高,但最新的短周期结构已经出现回落信号。
扫描器使用的交易符号是“我踏马来了USDT”,而CoinGecko记录的项目名称是“我踏马来了”,代币符号同样显示为“我踏马来了”。CoinGecko将其归类为BNB Chain生态、Meme、Chinese Meme以及Four.meme Ecosystem相关代币。研究资料还显示,该代币对应一个部署在BSC上的合约。
名称中的“USDT”需要单独说明。现有资料没有证明它是项目的官方名称、稳定币产品,也没有证明它与Tether存在官方关系。因此,本文把“我踏马来了USDT”视为交易市场使用的完整交易符号,而不是对项目功能的描述。
𝗣𝗿𝗼𝗷𝗲𝗰𝘁 𝗕𝗮𝘀𝗶𝗰𝘀:用途仍然缺少可验证内容
从已经核实的资料看,我踏马来了更接近一个以中文网络表达和社区注意力为核心的Meme代币,而不是已经披露明确产品路线图的基础设施项目。CoinGecko没有提供项目描述,研究数据中也没有白皮书、开发者资料、代码仓库、正式论坛或新闻条目。
因此,不能把它包装成支付、借贷、跨链、游戏或数据服务项目。当前能够确认的属性主要是代币交易和社区传播。它被放进BNB Chain Meme赛道以及Four.meme生态分类,但这些标签只能说明市场归属,不能证明它已经拥有可使用的应用、治理模块或其他实用功能。
这类资产的核心价值通常更多体现为注意力、叙事和流动性,而不是复杂技术。醒目的中文名称可能有助于它在社交传播中被记住,但注意力并不等于长期效用。除非后续出现可验证的应用、治理安排、社区活动或生态整合,否则目前仍然缺少足够资料来判断它是否具备超出交易和传播之外的用途。
𝗘𝗰𝗼𝘀𝘆𝘀𝘁𝗲𝗺:已知信息集中在BNB Chain和Meme属性
现有资料没有确认项目创始人、发行团队、具体上线日期或起源故事。研究数据中没有公告、白皮书、开发活动记录或新闻条目,因此不能把社区传闻当作项目背景。
能够确认的是,代币属于BNB Chain生态,合约部署在BSC,CoinGecko将它列入Four.meme Ecosystem相关分类。数据没有显示质押、治理、收益分配、NFT、游戏、支付或其他实用模块,也没有给出锁仓、流动性挖矿或协议总锁仓价值。
TVL字段为空,开发者数据为空,社区数据也为空。基于这些信息,更准确的描述是:它目前处在交易与社区叙事环境中,而不是一个已经披露完整功能的应用生态。研究资料不足以证明它已经形成稳定的用户基础,也不足以判断团队后续是否会扩展产品功能。
𝗦𝘂𝗽𝗽𝗹𝘆 𝗮𝗻𝗱 𝗩𝗮𝗹𝘂𝗮𝘁𝗶𝗼𝗻:完全流通不等于风险消失
代币经济数据相对清晰。总供应量为10亿枚,最大供应量也是10亿枚,流通供应量同样为10亿枚。数据因此显示其当前处于完全流通状态,流通比例和完全稀释估值比例均为100%。研究资料没有显示额外增发空间,也没有显示未解锁供应。
不过,完全流通不能单独证明合约权限、持仓集中度、代币分配或做市安排已经经过独立验证。研究数据没有提供持仓集中度、管理员权限、税费设置、流动性锁定状态或安全审计结果,所以不能仅凭供应量数据判断代币分配是否健康。
CoinGecko记录的美元价格约为0.015261,市值约1528万美元,市场排名约979。以这个规模来看,它仍属于小市值资产,价格可能受到单一资金流和情绪变化影响。CoinGecko数据显示24小时交易量约1195万美元,Binance市场快照显示报价成交额约7306万美元。两组数字来自不同市场或统计口径,不能直接相加,但都说明近期交易活动较为活跃。
高成交量意味着市场换手明显,却不等于订单簿始终深厚。情绪转向时,成交量与实际可成交深度可能出现差异,这也是小市值Meme代币需要面对的流动性风险。
𝗣𝗿𝗶𝗰𝗲 𝗔𝗰𝘁𝗶𝗼𝗻:日线强势,短线开始降温
Binance市场数据给出的24小时开盘价约为0.012851,最高价0.017590,最低价0.011974,最新价约0.015337,24小时涨幅约19.35%。CoinGecko快照显示,价格约为0.015261,24小时上涨约18.70%,24小时高点约0.017293,低点约0.012253。
两组数据的时间和统计来源不同,但共同说明我踏马来了经历了显著的日内扩张,并且仍处在高波动区间。CoinGecko数据显示,过去7天上涨约6.08%,14天上涨约8.39%,30天上涨约74.52%,60天上涨约89.11%。与此同时,当前价格距离记录中的历史高点0.062415美元仍低约75.55%。该历史高点日期为2026年2月1日,历史低点约0.006562美元,日期为2026年4月2日。
小时K线显示,价格曾从约0.012附近快速上行至0.016上方,期间出现多根大成交量K线。4小时数据中,某一阶段成交量超过17.5亿枚,报价成交额超过2758万美元,随后价格从0.017590附近回落至0.015美元左右。这个过程说明市场注意力集中,也说明冲高后存在较大换手。
上涨本身只能证明此前一段时间买盘占优,不能证明趋势已经稳定。快速拉升后的高位震荡,需要结合回踩承接和后续成交量继续判断。这里属于基于价格数据的市场解读,不是项目方对未来表现的说明。
𝗦𝗰𝗮𝗻𝗻𝗲𝗿 𝗦𝗶𝗴𝗻𝗮𝗹:为什么方向标记为SHORT
Bit Guru的实时RR Trader扫描器在2026年9月12日23:57左右选中该交易对,方向字段标记为SHORT,信心字段显示100,选择评分为167.69,热门分类为TOP_GAINER,排名第10。这里的SHORT是扫描器对当前结构的方向判断,不代表未来结果,也不能视为确定性结论。
扫描器记录的当前价格为0.014693,参考入场区间为0.014700至0.014715,附近阻力为0.0147804375,支持位为0.0146046561。风险控制参考线为0.0148247788,三个下方目标分别为0.0144887673、0.0143829777和0.0142771881,模型给出的风险回报比约为1.93。扫描时15分钟变动为负1.39%,成交量比率为2.22倍。
这组数据描述的是一种短周期与更大周期不完全一致的状态:过去24小时价格仍然上涨接近19%,但扫描时15分钟走势转弱,成交量又高于近期基准。按照量化信号的逻辑,这可能对应冲高后的获利回吐、阻力附近供给增加,或者短线多头主动性减弱。
不过,不能只看信心字段。价格快速跳动、数据延迟、流动性变化和极端波动,都可能让参考区间迅速失去准确性。对于小市值Meme代币,单根K线就可能改变短线结构,因此扫描器信号更适合被理解为某一时点的市场快照。
𝗞𝗲𝘆 𝗟𝗲𝘃𝗲𝗹𝘀:当前结构的观察区域
按照扫描器数据,0.0146047是近端支持,0.0147804是近端阻力。若价格在0.014700至0.014715附近反复受压,并跌破0.0146047,短线回落结构会得到更多确认。模型下方关注的层级是0.0144888、0.0143830和0.0142772。
相反,如果价格重新站稳0.0147804,并进一步突破0.0148248附近的风险控制线,当前扫描器标记的短线看空结构将被削弱。这里的价位只对应当前数据快照,不是永久支撑或阻力。
历史小时数据还显示,0.015至0.016之间曾多次出现激烈换手,0.0162附近以及本轮高点0.017590附近也属于需要观察的区域。价格在这些位置可能继续快速来回,因此单一价位不能替代对成交量和K线收盘表现的观察。
BTCUSDT快照显示,比特币价格约77231.90美元,24小时开盘约77235.90,最高约77477.40,最低约77025.10,24小时变动约为负0.005%。在这份数据里,比特币没有出现与我踏马来了相同幅度的方向性行情。由此看,本轮代币波动更可能与自身的Meme资金和交易结构有关,而不是由BTC单独带动。
但BTC相对平稳并不能消除小市值资产自身的风险。若比特币突然走弱,风险偏好可能收缩;即使BTC保持稳定,近期已经大幅上涨的代币仍可能受到获利兑现影响。
𝗡𝗲𝘄𝘀 𝗖𝗵𝗲𝗰𝗸:没有确认的新闻催化剂
本次研究数据的news字段为空,没有确认的合作、产品发布、交易所公告、团队融资、代币销毁、治理提案或安全事件。因此,不能把这轮上涨归因于某一条已经验证的新闻。
现有资料只能确认价格变化、交易活跃度和扫描器信号,不能确认背后存在官方催化剂。Meme代币经常在价格上涨后出现新的解释,但在缺少原始公告、链上动作或其他可验证材料时,社交媒体热度只能作为情绪变量,不能直接当作基本面改善。
目前也没有研究证据证明项目拥有持续的开发活动、稳定的社区规模或明确的路线图。后续如果出现公告,仍需要核对发布主体、相关链上动作以及公告内容是否真正对应产品使用或生态整合。
𝗥𝗶𝘀𝗸 𝗟𝗶𝘀𝘁:高波动与信息不足并存
第一项风险是项目透明度不足。研究资料没有提供项目描述、白皮书、开发者资料或正式新闻记录,外部研究者因此难以判断团队能力、路线图和长期计划。第二项风险是效用不明确。目前没有证据证明它拥有超出交易和社区传播之外的明确用途。
第三项风险是流动性与滑点。24小时成交量较高,但高成交量不等于订单簿始终深厚,情绪反转时买卖价差可能扩大。第四项风险是合约与持仓信息不完整。研究资料没有给出持仓集中度、流动性锁定状态、管理员权限、税费设置或安全审计结果。
第五项风险来自近期涨幅。30天涨幅约74.52%,60天涨幅约89.11%,价格快速上行后,短线获利盘压力不能忽略。第六项风险是数据时间差异。扫描器价格为0.014693,Binance快照价格约0.015337,CoinGecko价格约0.015261,更新时间和统计口径并不相同。高速波动期间,几分钟甚至更短的差异都可能改变信号质量。
最后仍要注意名称混淆。“我踏马来了USDT”包含USDT字样,但研究资料没有证明它是稳定币,也没有证明它与Tether存在官方关系。识别资产时,名称不能替代合约和市场数据核对。
𝗙𝗶𝗻𝗮𝗹 𝗩𝗶𝗲𝘄:观察结构,而不是追逐叙事
综合来看,我踏马来了USDT是一枚高弹性的BNB Chain Meme代币:供应数据清楚,当前市场交易活跃,近期涨幅醒目,但项目用途、团队背景、开发活动和生态进展仍缺少可验证内容。
扫描器捕捉到的是强势上涨后的短线转弱,而不是已经被基本面证实的长期看空结论。当前需要观察0.0146047支持是否有效,0.0147804和0.0148248附近是否重新被价格收复,以及成交量能否在更高价格区域持续,而不是只在冲高时短暂放大。
更高时间周期同样重要。小时和4小时数据已经显示出大幅波动,后续价格能否在0.015至0.016区域形成新的整理平台,将比单次冲高更能说明短线结构。与此同时,项目是否出现经过核实的团队资料、产品进展或链上活动,也将影响市场对它的理解。
这枚代币的名字确实醒目,走势也足够激烈,但目前最重要的事实仍然是:它拥有显著交易热度,却缺少相匹配的基本面披露。Bit Guru的判断保持在数据范围内——关注支持、阻力、成交量和信息透明度,避免把短线信号误读成长期结论。
432
·
--
පරිවර්තනය බලන්න
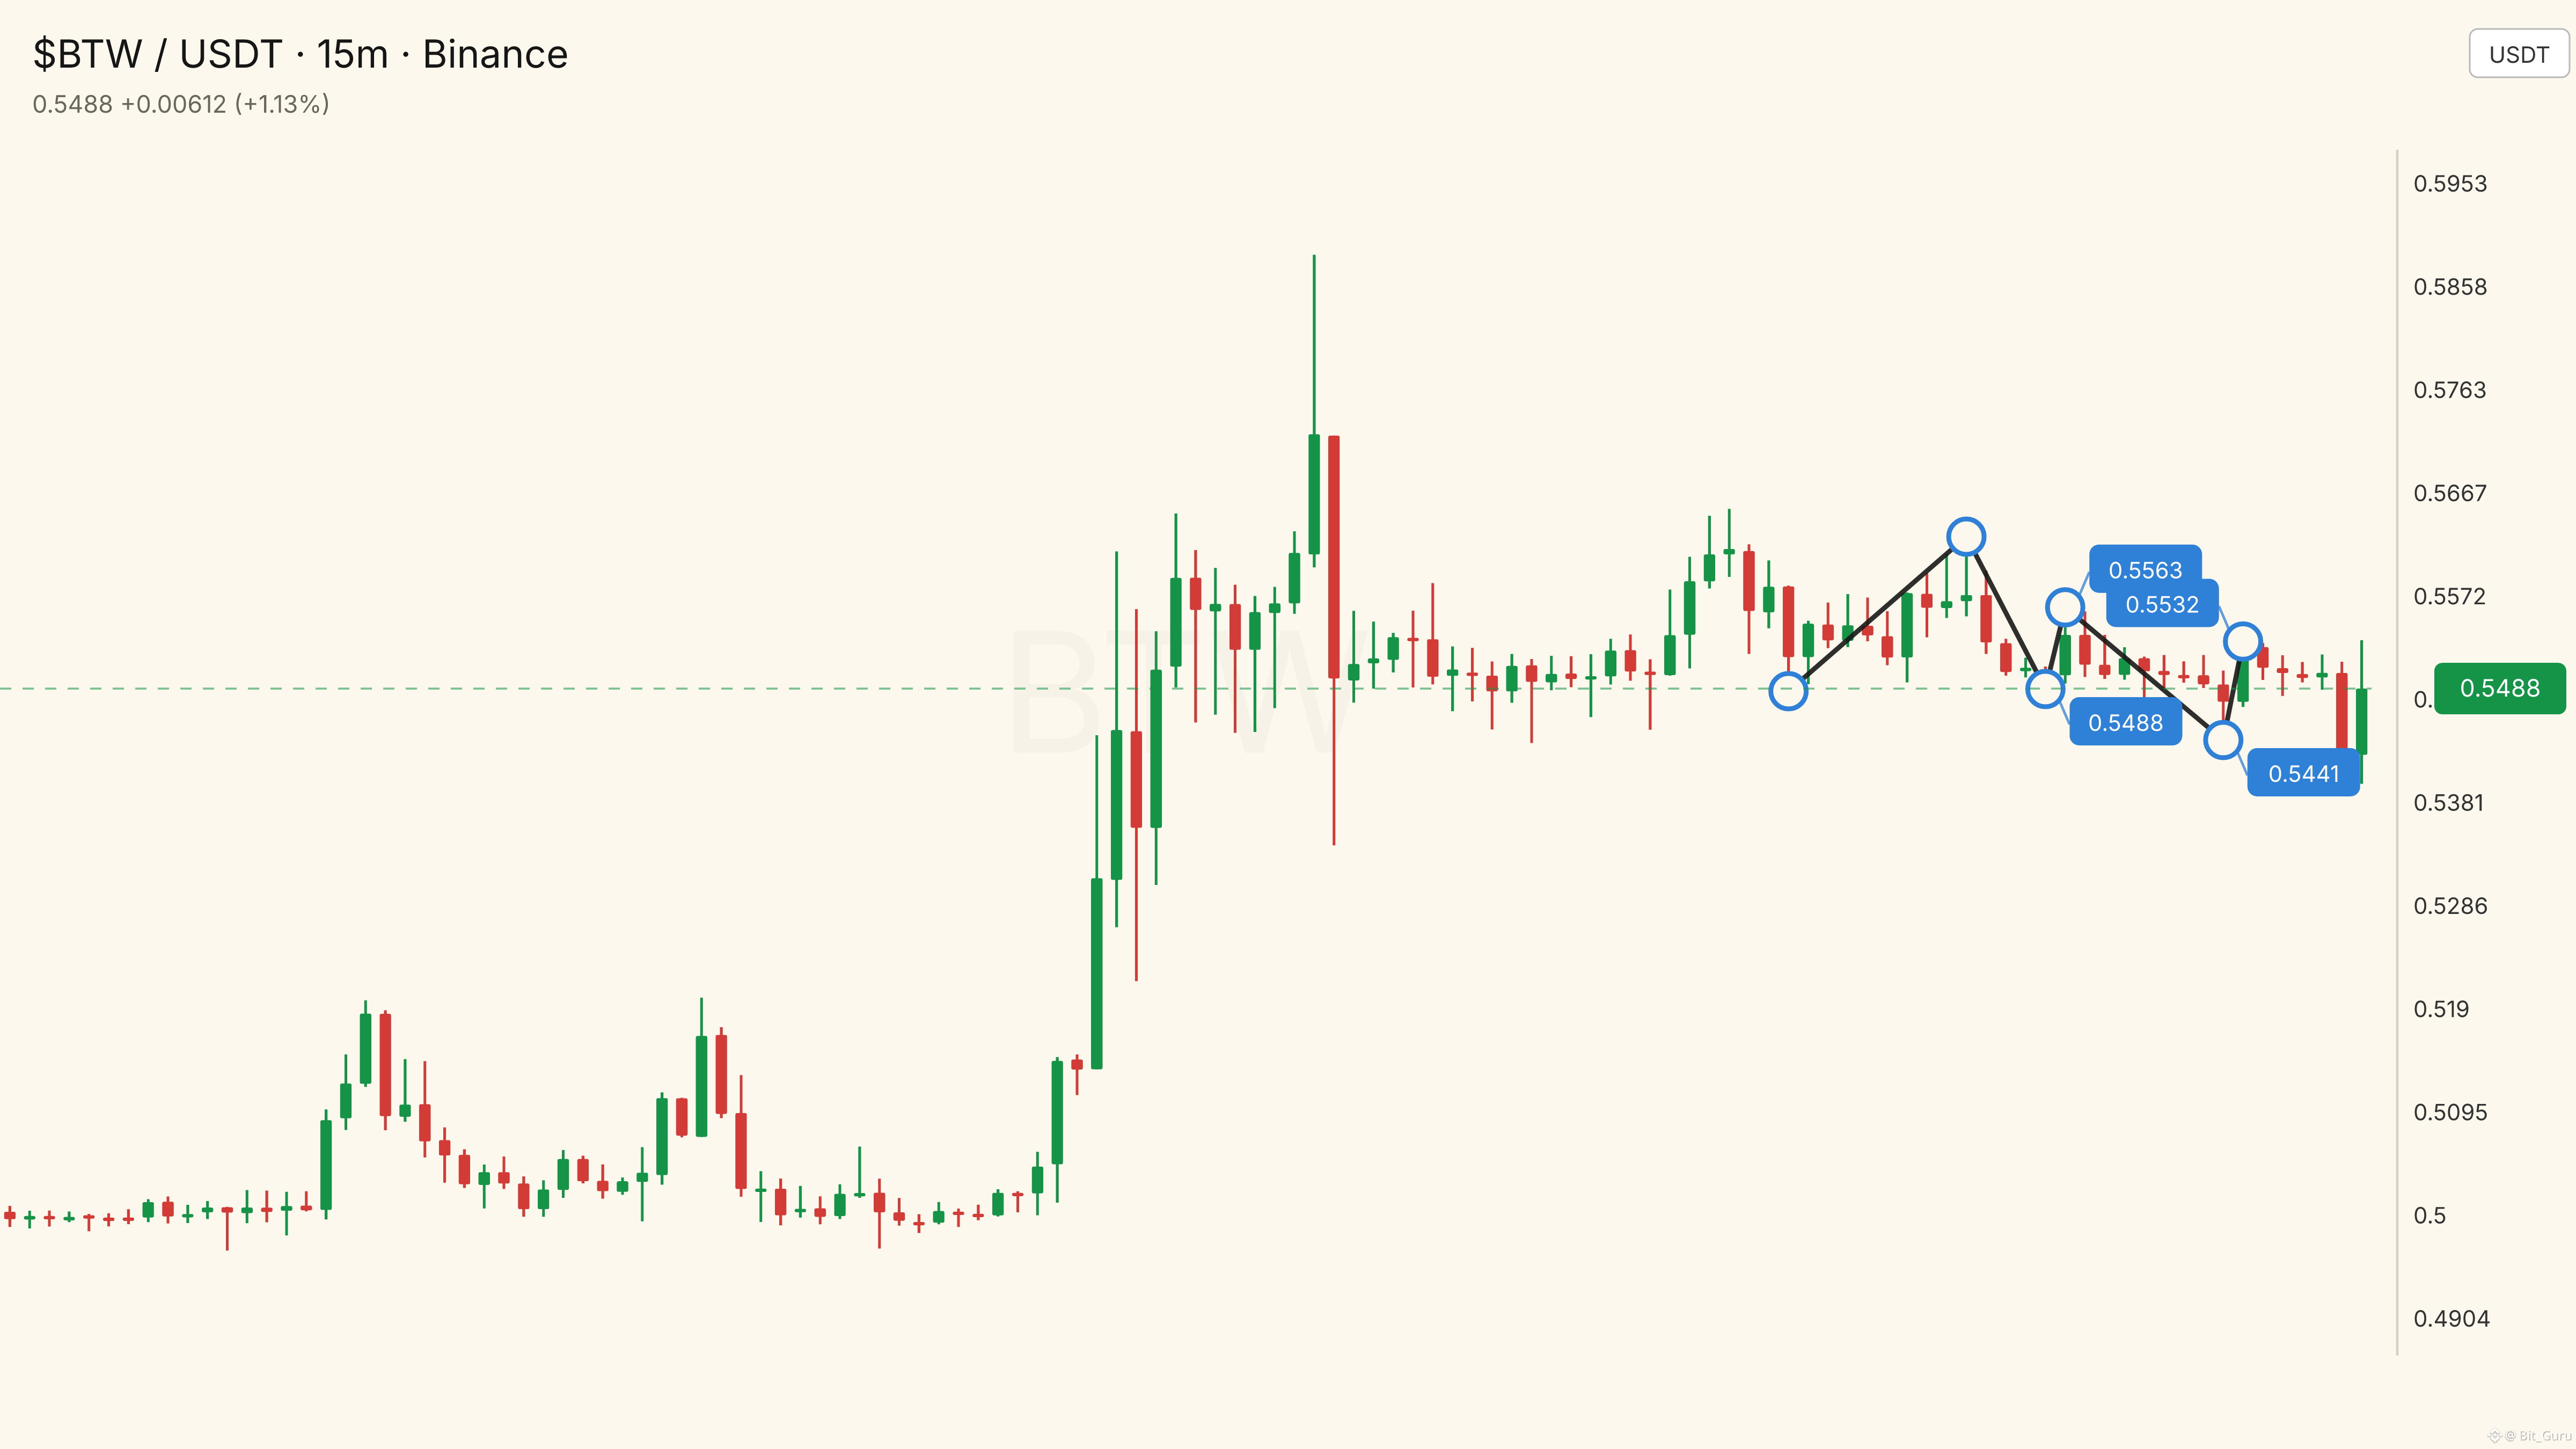
$BTW is in focus… ✅🚨 UP!
Entry: 0.54948 - 0.55003
SL: 0.54591
TP1: 0.55796 | TP2: 0.56192 | TP3: 0.56588
$BTW is in focus… ✅🚨 UP!
Entry: 0.54948 - 0.55003
SL: 0.54591
TP1: 0.55796 | TP2: 0.56192 | TP3: 0.56588
Entry: 0.54948 - 0.55003
SL: 0.54591
TP1: 0.55796 | TP2: 0.56192 | TP3: 0.56588
433
·
--
පරිවර්තනය බලන්න
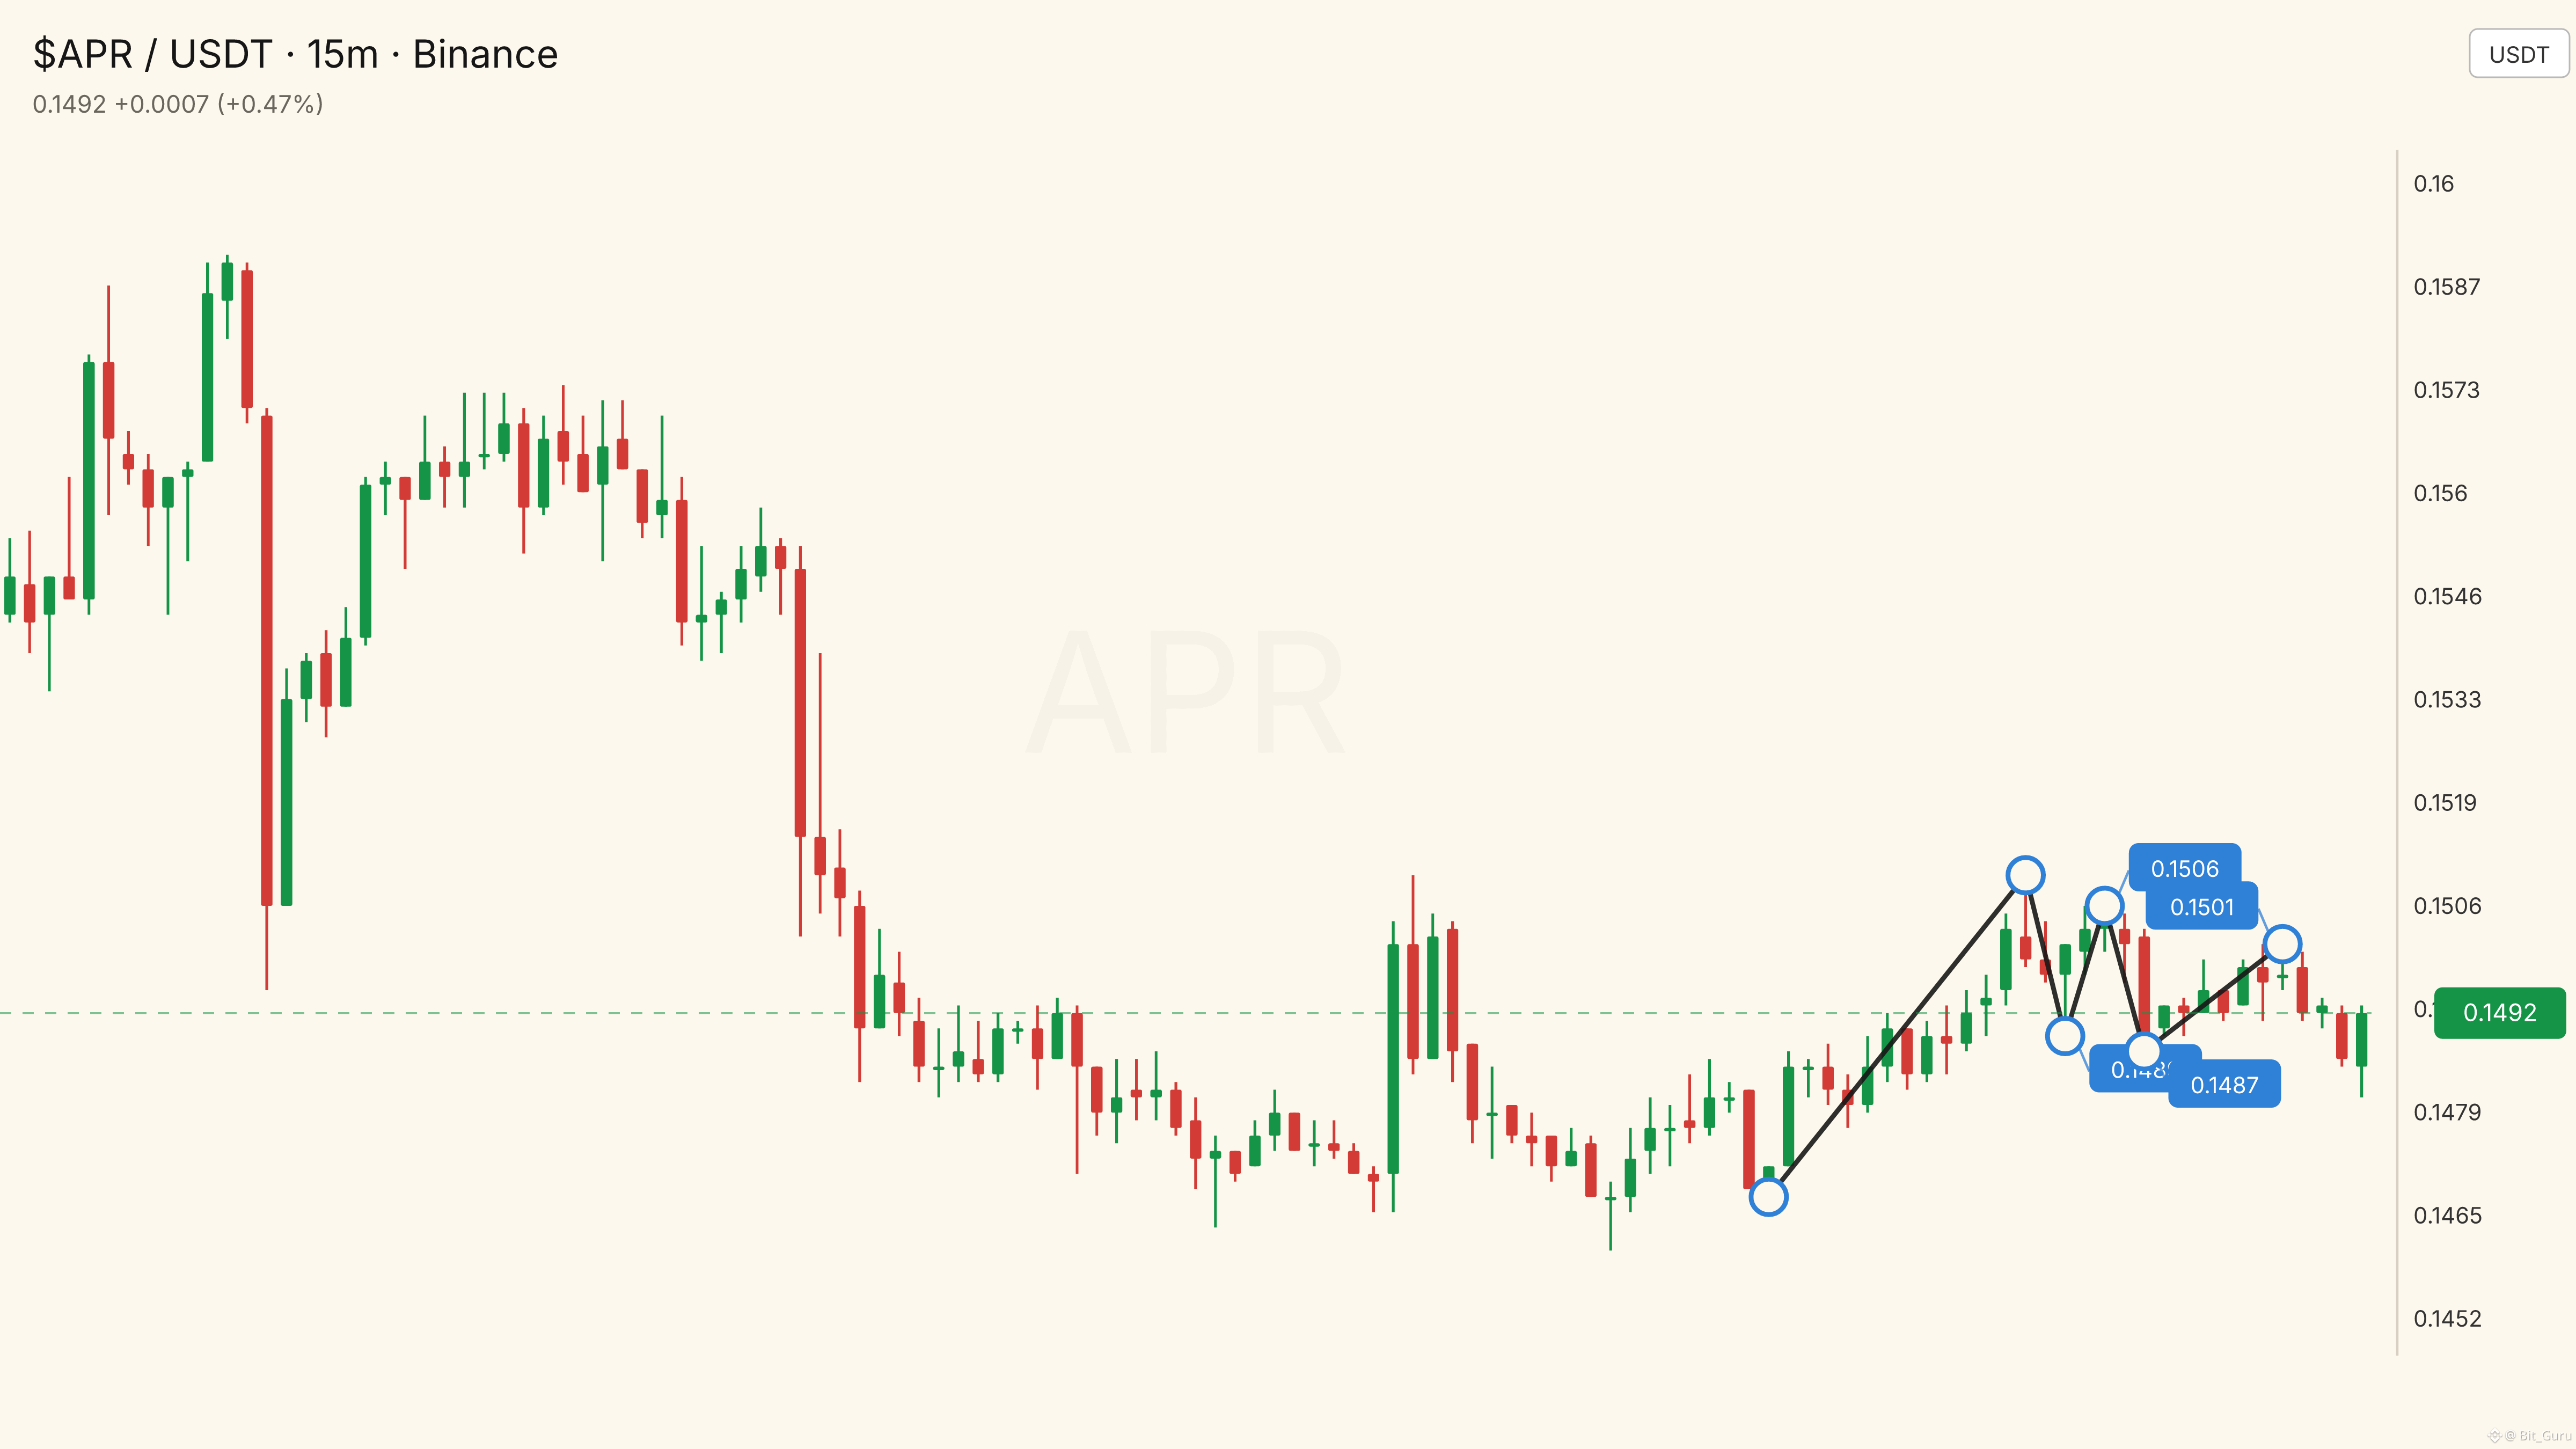
$APR caught my eye… 👀🔥 DOWN!
Entry: 0.14907 - 0.14922
SL: 0.14985
TP1: 0.14784 | TP2: 0.14722 | TP3: 0.1466
$APR caught my eye… 👀🔥 DOWN!
Entry: 0.14907 - 0.14922
SL: 0.14985
TP1: 0.14784 | TP2: 0.14722 | TP3: 0.1466
Entry: 0.14907 - 0.14922
SL: 0.14985
TP1: 0.14784 | TP2: 0.14722 | TP3: 0.1466
461
·
--
පරිවර්තනය බලන්න
AKEUSDT: Strong Momentum Meets an Unfinished Fundamental Case𝗧𝗵𝗲 𝗺𝗼𝘃𝗲 𝘁𝗵𝗮𝘁 𝗽𝘂𝘁 𝗔𝗞𝗘𝗨𝗦𝗗𝗧 𝗼𝗻 𝘁𝗵𝗲 𝗿𝗮𝗱𝗮𝗿
AKEUSDT appeared on the live RR Trader scanner after a sharp burst of activity rather than a quiet, gradual climb. The pair was marked LONG, with a scanner confidence score of 100, a hot-priority score of 13.555, and a TOP_GAINER rank of 10. The scanner recorded a 17.74% move for its hot-gainer filter. The supplied market snapshots showed a 16.431% rise on Binance and a 16.95727% rise in the CoinGecko data. Those figures are close but not identical because the sources use different timestamps and market calculations.
The first important point is that AKE had already made a large move before the signal was recorded. The scanner price was 0.016351 USDT, compared with its proposed entry range of 0.01632647 to 0.01634282. Price was therefore slightly above the scanner’s preferred zone and just below its listed resistance. That is an observation about the data, not a forecast. A fast-moving token can move through a setup quickly, and a scanner signal does not establish that momentum will continue.
𝗪𝗵𝗮𝘁 𝗔𝗸𝗲𝗱𝗼 𝘀𝗮𝘆𝘀 𝗶𝘁 𝗶𝘀 𝗯𝘂𝗶𝗹𝗱𝗶𝗻𝗴
The supplied project information identifies AKE with Akedo, a multi-agent artificial intelligence framework focused on autonomous content creation and intelligent collaboration. Akedo describes a system intended to let creators design engaging games in roughly two minutes by using simple natural-language prompts. Its framework is described as modular, powered by large language models, and designed with scalability and flexibility in mind.
That gives Akedo a straightforward product thesis: use multiple AI agents and natural-language instructions to reduce the complexity of creating interactive content. Game development can involve design, coding, art, narrative work, and production coordination. Akedo’s stated approach is to let creators describe an idea while the framework helps turn that idea into a game.
The practical question is whether the system can consistently produce games that are functional, enjoyable, distinctive, and worth returning to. The research confirms the project’s stated direction, but it does not provide independent evidence about the quality, number, or commercial performance of games created through the framework.
The available material also does not establish a detailed founding history, named founding team, funding background, launch chronology, or audited product milestones. Akedo has a public project description and documentation references, but the supplied research is not sufficient to reconstruct a fully verified origin story.
𝗨𝘁𝗶𝗹𝗶𝘁𝘆 𝗮𝗻𝗱 𝗲𝗰𝗼𝘀𝘆𝘀𝘁𝗲𝗺: 𝗽𝗿𝗼𝗺𝗶𝘀𝗲 𝘃𝗲𝗿𝘀𝘂𝘀 𝗽𝗿𝗼𝗼𝗳
Akedo’s potential utility is tied to AI-assisted game creation and collaboration. The project describes an ecosystem in which creators use natural-language prompts, large language models, and modular AI agents to turn ideas into interactive content. If the system develops as described, the token could eventually be connected to access, incentives, creator participation, digital assets, or other ecosystem functions. However, the supplied data does not specify the exact token utility, fee design, staking mechanics, governance rights, or product permissions attached to AKE.
The available categorization places Akedo in the Artificial Intelligence, AI Applications, BNB Chain Ecosystem, and Binance Wallet IDO groups. The research identifies the token as being on BNB Chain. These details establish the project’s broad ecosystem positioning, but they do not prove adoption.
There is no verified user count, game-library size, revenue figure, active developer count, or application usage metric in the supplied material. That creates an important split in the AKE story. The concept is easy to understand and fits the broader combination of generative AI and interactive entertainment. The evidence for real-world traction is much thinner. A compelling narrative can attract attention, but sustained token demand generally requires a working product, repeat users, visible development, and a clear reason to hold or use the token. The research does not confirm those elements for Akedo.
𝗦𝘂𝗽𝗽𝗹𝘆, 𝘃𝗮𝗹𝘂𝗮𝘁𝗶𝗼𝗻 𝗮𝗻𝗱 𝘁𝗵𝗲 𝗱𝗶𝗹𝘂𝘁𝗶𝗼𝗻 𝗾𝘂𝗲𝘀𝘁𝗶𝗼𝗻
The token data lists a total supply and maximum supply of 100 billion AKE. Circulating supply is listed at 22.79625 billion tokens, or approximately 22.8% of the maximum. CoinGecko reports a market capitalization of about 372.9 million US dollars and a fully diluted valuation of about 1.636 billion dollars. The reported market-cap-to-FDV ratio is 0.23, consistent with a relatively small portion of the maximum supply currently circulating.
This is one of the most important structural details in the AKE setup. The gap between circulating supply and maximum supply means future supply increases are a factor to monitor. If additional tokens enter circulation while demand does not expand at a similar pace, that supply growth could create pressure on price. The research does not provide the unlock schedule, allocation breakdown, vesting terms, investor holdings, treasury policy, or emissions timetable. The timing and scale of possible future dilution are therefore unavailable.
The token is ranked 122 by market capitalization in the supplied CoinGecko snapshot. A separate ranking that accounts for rehypothecated values places it at 173. These rankings are data points rather than proof of liquidity or project quality.
The same dataset reports total trading volume of roughly 9.05 million dollars, while the Binance ticker shows approximately 49.83 million dollars in quote volume for its supplied 24-hour period. The difference is substantial and likely reflects different market coverage or timestamps. Volume comparisons should therefore be treated carefully rather than combined as though they were measuring the same market activity.
𝗣𝗿𝗶𝗰𝗲 𝗮𝗰𝘁𝗶𝗼𝗻 𝗮𝗻𝗱 𝗿𝗲𝗰𝗲𝗻𝘁 𝘀𝘁𝗿𝘂𝗰𝘁𝘂𝗿𝗲
The price picture is powerful but unstable. The Binance ticker showed an open price of 0.014010, a last price of 0.016312, a 24-hour high of 0.016666, and a 24-hour low of 0.013653. That represented a 0.002302 USDT increase, or 16.431%. The CoinGecko snapshot placed the price at 0.01640113, with a 24-hour high of 0.01652677 and a low of 0.01369464, alongside a 16.95727% daily gain.
The wider performance figures explain why AKE attracted attention. The token was reported down 12.7274% over seven days, up 97.41311% over 14 days, up 157.38046% over 30 days, and up 8,546.44447% over 60 days. It was also reported up 3,235.22858% over 200 days and 1,336.06452% over one year.
These returns describe an extreme repricing phase rather than a calm trend. The reported all-time high was 0.0363756 USDT on September 2, 2026. In the supplied dataset, the token remained about 54.9% below that peak.
The hourly candles showed a recovery from the 0.013653 low. Price moved through 0.0150 and then 0.0160, with several high-volume periods during the climb. The most recent four-hour candle range reached 0.016666 and closed around 0.016309 in the supplied data. On the four-hour view, the market had previously reached as low as 0.009300 before recovering. That history shows both strong buying interest during the rebound and the potential for deep retracements when sentiment changes.
𝗪𝗵𝗮𝘁 𝘁𝗵𝗲 𝘀𝗰𝗮𝗻𝗻𝗲𝗿 𝗶𝘀 𝘀𝗲𝗲𝗶𝗻𝗴
The RR Trader scanner recorded a 15-minute move of 0.8325% and a volume ratio of 1.24467. The short-term move remained positive, while the volume ratio was above the scanner’s comparison baseline. It was not an extreme multiple.
The scanner identified support at 0.016270 and resistance at 0.01636803. Its entry range was 0.01632647 to 0.01634282, with a stop reference at 0.01622019 and projected levels at 0.01657828, 0.01669601, and 0.01681373. The stated risk-reward figure was 1.92.
Price was an important part of the setup. At 0.016351, the scanner price sat just above the entry range and just below the listed resistance. That created a narrow decision area. A move through 0.016368 could indicate that buyers were still willing to trade near the recent highs. A failure to hold 0.016270 would weaken the immediate momentum structure, while a move below 0.016220 would move below the scanner’s stated risk reference.
The scanner’s LONG direction and confidence score are outputs from the scanner, not independent confirmation of future performance. The signal is notable because it combines a strong daily move, recent price recovery, elevated activity, and defined nearby levels. It is also vulnerable because it appeared after a large run, when a loss of momentum could leave late participants exposed to a reversal.
𝗕𝗶𝘁𝗰𝗼𝗶𝗻 𝗮𝗻𝗱 𝘁𝗵𝗲 𝘄𝗶𝗱𝗲𝗿 𝗺𝗮𝗿𝗸𝗲𝘁
Bitcoin was comparatively quiet during the supplied period. BTCUSDT was listed at 77,221.80 USDT, up 0.103%, with a high of 77,477.40 and a low of 77,025.10. AKE’s roughly 16% daily move therefore substantially outpaced Bitcoin in the same snapshot.
That comparison indicates that AKE’s move was more specific to the token and its immediate trading activity than to a broad Bitcoin surge. It does not establish the exact cause of the rally. Bitcoin stability can give smaller tokens room to trade on their own narratives, while a sharp BTC reversal could still affect liquidity across the altcoin market. AKE’s recent volatility makes that a relevant risk framework, although the supplied data does not include a direct correlation study.
The wider news feed included macroeconomic and crypto-market stories, including a report that core CPI rose 0.3% in August and could influence expectations for Federal Reserve policy. It also included commentary about Bitcoin’s role in portfolios exposed to heavy AI investment. None of those reports specifically named Akedo or confirmed a direct AKE catalyst.
𝗖𝗮𝘁𝗮𝗹𝘆𝘀𝘁𝘀 𝗮𝗻𝗱 𝗿𝗲𝗱-𝗳𝗹𝗮𝗴 𝗰𝗵𝗲𝗰𝗸𝘀
No recent announcement in the supplied research directly linked the current AKEUSDT rise to a product launch, partnership, exchange event, game release, token burn, funding round, or other Akedo-specific catalyst. The market move is confirmed by the price data, but its cause is not confirmed. It may reflect momentum trading, increased interest in AI tokens, market positioning, or information not included in the research.
The most useful future evidence would involve the framework becoming a demonstrably usable product. New features, completed games, active creators, measurable usage, or clear token utility could help connect the current narrative with a stronger fundamental case. Announcements without verifiable delivery would not resolve the main evidence gap.
The major risks are significant. AKE has already recorded exceptional gains over multiple periods, increasing the possibility of sharp reversals. Only about 22.8% of the maximum supply is listed as circulating, leaving a large difference between current supply and the 100 billion maximum. The research does not provide unlock details, holder concentration, audited contract information, or a detailed allocation schedule. The four-hour data also includes a decline to 0.009300, showing how quickly price conditions have changed in the past.
Finally, the project’s AI and gaming claims remain difficult to evaluate without independently verified product adoption. These gaps do not establish misconduct, but they are areas that require careful scrutiny.
𝗟𝗲𝘃𝗲𝗹𝘀 𝗮𝗻𝗱 𝘀𝗶𝗴𝗻𝗮𝗹𝘀 𝘁𝗼 𝘄𝗮𝘁𝗰𝗵
The immediate scanner map is concentrated between 0.016270 and 0.016368. Support is listed at 0.016270, resistance at 0.01636803, and the invalidation reference at 0.01622019. If price holds above that area and accepts trades above resistance, the scanner’s next reference points are 0.01657828, 0.01669601, and 0.01681373. These are scanner-derived levels, not guaranteed destinations.
The Binance session high at 0.016666 is another important reference because it marks the latest visible high in the supplied ticker. A move beyond it would extend the current daily range. On the downside, the 0.0160 area matters as a recent psychological and structural level, while 0.015320 and 0.014598 appeared as earlier hourly highs during the advance. The 0.013653 daily low and 0.009300 four-hour low are wider reference points showing how far the market previously travelled when momentum weakened.
The next useful evidence is not simply another green candle. Volume behaviour during advances, the ability of pullbacks to hold above scanner support, differences between Binance and aggregated pricing, and new information about actual Akedo usage will provide more context. Bitcoin near 77,000 and the broader response to macroeconomic news are also relevant background factors.
𝗕𝗮𝗹𝗮𝗻𝗰𝗲𝗱 𝗰𝗼𝗻𝗰𝗹𝘂𝘀𝗶𝗼𝗻
AKEUSDT is interesting because the market has combined an AI gaming narrative, a sharp price recovery, and enough reported activity to place the token among the scanner’s notable gainers. The chart shows buyers reclaiming levels around 0.0150 and 0.0160 after a volatile period, while the scanner identifies a compact range with nearby upside and invalidation references.
The less comfortable part of the story is equally important. AKE has already delivered extraordinary gains over multiple periods, remains well below its reported recent all-time high, and has a large difference between circulating supply and maximum supply. The supplied research confirms what Akedo says it is building, but it does not confirm a detailed origin history, meaningful product adoption, token utility mechanics, or a project-specific catalyst behind the latest surge.
The cleanest description is a momentum event attached to an early-stage AI gaming thesis. If the market maintains the 0.016270 area, clears 0.016368, and new evidence shows that Akedo is producing real creator and game activity, the narrative could gain credibility. If those levels fail and no fundamental evidence appears, the rally may remain primarily a trading-driven repricing. The next phase will depend on whether AKE can turn attention into sustained usage while defending its recently recovered price structure.
AKEUSDT: Strong Momentum Meets an Unfinished Fundamental Case
𝗧𝗵𝗲 𝗺𝗼𝘃𝗲 𝘁𝗵𝗮𝘁 𝗽𝘂𝘁 𝗔𝗞𝗘𝗨𝗦𝗗𝗧 𝗼𝗻 𝘁𝗵𝗲 𝗿𝗮𝗱𝗮𝗿
AKEUSDT appeared on the live RR Trader scanner after a sharp burst of activity rather than a quiet, gradual climb. The pair was marked LONG, with a scanner confidence score of 100, a hot-priority score of 13.555, and a TOP_GAINER rank of 10. The scanner recorded a 17.74% move for its hot-gainer filter. The supplied market snapshots showed a 16.431% rise on Binance and a 16.95727% rise in the CoinGecko data. Those figures are close but not identical because the sources use different timestamps and market calculations.
The first important point is that AKE had already made a large move before the signal was recorded. The scanner price was 0.016351 USDT, compared with its proposed entry range of 0.01632647 to 0.01634282. Price was therefore slightly above the scanner’s preferred zone and just below its listed resistance. That is an observation about the data, not a forecast. A fast-moving token can move through a setup quickly, and a scanner signal does not establish that momentum will continue.
𝗪𝗵𝗮𝘁 𝗔𝗸𝗲𝗱𝗼 𝘀𝗮𝘆𝘀 𝗶𝘁 𝗶𝘀 𝗯𝘂𝗶𝗹𝗱𝗶𝗻𝗴
The supplied project information identifies AKE with Akedo, a multi-agent artificial intelligence framework focused on autonomous content creation and intelligent collaboration. Akedo describes a system intended to let creators design engaging games in roughly two minutes by using simple natural-language prompts. Its framework is described as modular, powered by large language models, and designed with scalability and flexibility in mind.
That gives Akedo a straightforward product thesis: use multiple AI agents and natural-language instructions to reduce the complexity of creating interactive content. Game development can involve design, coding, art, narrative work, and production coordination. Akedo’s stated approach is to let creators describe an idea while the framework helps turn that idea into a game.
The practical question is whether the system can consistently produce games that are functional, enjoyable, distinctive, and worth returning to. The research confirms the project’s stated direction, but it does not provide independent evidence about the quality, number, or commercial performance of games created through the framework.
The available material also does not establish a detailed founding history, named founding team, funding background, launch chronology, or audited product milestones. Akedo has a public project description and documentation references, but the supplied research is not sufficient to reconstruct a fully verified origin story.
𝗨𝘁𝗶𝗹𝗶𝘁𝘆 𝗮𝗻𝗱 𝗲𝗰𝗼𝘀𝘆𝘀𝘁𝗲𝗺: 𝗽𝗿𝗼𝗺𝗶𝘀𝗲 𝘃𝗲𝗿𝘀𝘂𝘀 𝗽𝗿𝗼𝗼𝗳
Akedo’s potential utility is tied to AI-assisted game creation and collaboration. The project describes an ecosystem in which creators use natural-language prompts, large language models, and modular AI agents to turn ideas into interactive content. If the system develops as described, the token could eventually be connected to access, incentives, creator participation, digital assets, or other ecosystem functions. However, the supplied data does not specify the exact token utility, fee design, staking mechanics, governance rights, or product permissions attached to AKE.
The available categorization places Akedo in the Artificial Intelligence, AI Applications, BNB Chain Ecosystem, and Binance Wallet IDO groups. The research identifies the token as being on BNB Chain. These details establish the project’s broad ecosystem positioning, but they do not prove adoption.
There is no verified user count, game-library size, revenue figure, active developer count, or application usage metric in the supplied material. That creates an important split in the AKE story. The concept is easy to understand and fits the broader combination of generative AI and interactive entertainment. The evidence for real-world traction is much thinner. A compelling narrative can attract attention, but sustained token demand generally requires a working product, repeat users, visible development, and a clear reason to hold or use the token. The research does not confirm those elements for Akedo.
𝗦𝘂𝗽𝗽𝗹𝘆, 𝘃𝗮𝗹𝘂𝗮𝘁𝗶𝗼𝗻 𝗮𝗻𝗱 𝘁𝗵𝗲 𝗱𝗶𝗹𝘂𝘁𝗶𝗼𝗻 𝗾𝘂𝗲𝘀𝘁𝗶𝗼𝗻
The token data lists a total supply and maximum supply of 100 billion AKE. Circulating supply is listed at 22.79625 billion tokens, or approximately 22.8% of the maximum. CoinGecko reports a market capitalization of about 372.9 million US dollars and a fully diluted valuation of about 1.636 billion dollars. The reported market-cap-to-FDV ratio is 0.23, consistent with a relatively small portion of the maximum supply currently circulating.
This is one of the most important structural details in the AKE setup. The gap between circulating supply and maximum supply means future supply increases are a factor to monitor. If additional tokens enter circulation while demand does not expand at a similar pace, that supply growth could create pressure on price. The research does not provide the unlock schedule, allocation breakdown, vesting terms, investor holdings, treasury policy, or emissions timetable. The timing and scale of possible future dilution are therefore unavailable.
The token is ranked 122 by market capitalization in the supplied CoinGecko snapshot. A separate ranking that accounts for rehypothecated values places it at 173. These rankings are data points rather than proof of liquidity or project quality.
The same dataset reports total trading volume of roughly 9.05 million dollars, while the Binance ticker shows approximately 49.83 million dollars in quote volume for its supplied 24-hour period. The difference is substantial and likely reflects different market coverage or timestamps. Volume comparisons should therefore be treated carefully rather than combined as though they were measuring the same market activity.
𝗣𝗿𝗶𝗰𝗲 𝗮𝗰𝘁𝗶𝗼𝗻 𝗮𝗻𝗱 𝗿𝗲𝗰𝗲𝗻𝘁 𝘀𝘁𝗿𝘂𝗰𝘁𝘂𝗿𝗲
The price picture is powerful but unstable. The Binance ticker showed an open price of 0.014010, a last price of 0.016312, a 24-hour high of 0.016666, and a 24-hour low of 0.013653. That represented a 0.002302 USDT increase, or 16.431%. The CoinGecko snapshot placed the price at 0.01640113, with a 24-hour high of 0.01652677 and a low of 0.01369464, alongside a 16.95727% daily gain.
The wider performance figures explain why AKE attracted attention. The token was reported down 12.7274% over seven days, up 97.41311% over 14 days, up 157.38046% over 30 days, and up 8,546.44447% over 60 days. It was also reported up 3,235.22858% over 200 days and 1,336.06452% over one year.
These returns describe an extreme repricing phase rather than a calm trend. The reported all-time high was 0.0363756 USDT on September 2, 2026. In the supplied dataset, the token remained about 54.9% below that peak.
The hourly candles showed a recovery from the 0.013653 low. Price moved through 0.0150 and then 0.0160, with several high-volume periods during the climb. The most recent four-hour candle range reached 0.016666 and closed around 0.016309 in the supplied data. On the four-hour view, the market had previously reached as low as 0.009300 before recovering. That history shows both strong buying interest during the rebound and the potential for deep retracements when sentiment changes.
𝗪𝗵𝗮𝘁 𝘁𝗵𝗲 𝘀𝗰𝗮𝗻𝗻𝗲𝗿 𝗶𝘀 𝘀𝗲𝗲𝗶𝗻𝗴
The RR Trader scanner recorded a 15-minute move of 0.8325% and a volume ratio of 1.24467. The short-term move remained positive, while the volume ratio was above the scanner’s comparison baseline. It was not an extreme multiple.
The scanner identified support at 0.016270 and resistance at 0.01636803. Its entry range was 0.01632647 to 0.01634282, with a stop reference at 0.01622019 and projected levels at 0.01657828, 0.01669601, and 0.01681373. The stated risk-reward figure was 1.92.
Price was an important part of the setup. At 0.016351, the scanner price sat just above the entry range and just below the listed resistance. That created a narrow decision area. A move through 0.016368 could indicate that buyers were still willing to trade near the recent highs. A failure to hold 0.016270 would weaken the immediate momentum structure, while a move below 0.016220 would move below the scanner’s stated risk reference.
The scanner’s LONG direction and confidence score are outputs from the scanner, not independent confirmation of future performance. The signal is notable because it combines a strong daily move, recent price recovery, elevated activity, and defined nearby levels. It is also vulnerable because it appeared after a large run, when a loss of momentum could leave late participants exposed to a reversal.
𝗕𝗶𝘁𝗰𝗼𝗶𝗻 𝗮𝗻𝗱 𝘁𝗵𝗲 𝘄𝗶𝗱𝗲𝗿 𝗺𝗮𝗿𝗸𝗲𝘁
Bitcoin was comparatively quiet during the supplied period. BTCUSDT was listed at 77,221.80 USDT, up 0.103%, with a high of 77,477.40 and a low of 77,025.10. AKE’s roughly 16% daily move therefore substantially outpaced Bitcoin in the same snapshot.
That comparison indicates that AKE’s move was more specific to the token and its immediate trading activity than to a broad Bitcoin surge. It does not establish the exact cause of the rally. Bitcoin stability can give smaller tokens room to trade on their own narratives, while a sharp BTC reversal could still affect liquidity across the altcoin market. AKE’s recent volatility makes that a relevant risk framework, although the supplied data does not include a direct correlation study.
The wider news feed included macroeconomic and crypto-market stories, including a report that core CPI rose 0.3% in August and could influence expectations for Federal Reserve policy. It also included commentary about Bitcoin’s role in portfolios exposed to heavy AI investment. None of those reports specifically named Akedo or confirmed a direct AKE catalyst.
𝗖𝗮𝘁𝗮𝗹𝘆𝘀𝘁𝘀 𝗮𝗻𝗱 𝗿𝗲𝗱-𝗳𝗹𝗮𝗴 𝗰𝗵𝗲𝗰𝗸𝘀
No recent announcement in the supplied research directly linked the current AKEUSDT rise to a product launch, partnership, exchange event, game release, token burn, funding round, or other Akedo-specific catalyst. The market move is confirmed by the price data, but its cause is not confirmed. It may reflect momentum trading, increased interest in AI tokens, market positioning, or information not included in the research.
The most useful future evidence would involve the framework becoming a demonstrably usable product. New features, completed games, active creators, measurable usage, or clear token utility could help connect the current narrative with a stronger fundamental case. Announcements without verifiable delivery would not resolve the main evidence gap.
The major risks are significant. AKE has already recorded exceptional gains over multiple periods, increasing the possibility of sharp reversals. Only about 22.8% of the maximum supply is listed as circulating, leaving a large difference between current supply and the 100 billion maximum. The research does not provide unlock details, holder concentration, audited contract information, or a detailed allocation schedule. The four-hour data also includes a decline to 0.009300, showing how quickly price conditions have changed in the past.
Finally, the project’s AI and gaming claims remain difficult to evaluate without independently verified product adoption. These gaps do not establish misconduct, but they are areas that require careful scrutiny.
𝗟𝗲𝘃𝗲𝗹𝘀 𝗮𝗻𝗱 𝘀𝗶𝗴𝗻𝗮𝗹𝘀 𝘁𝗼 𝘄𝗮𝘁𝗰𝗵
The immediate scanner map is concentrated between 0.016270 and 0.016368. Support is listed at 0.016270, resistance at 0.01636803, and the invalidation reference at 0.01622019. If price holds above that area and accepts trades above resistance, the scanner’s next reference points are 0.01657828, 0.01669601, and 0.01681373. These are scanner-derived levels, not guaranteed destinations.
The Binance session high at 0.016666 is another important reference because it marks the latest visible high in the supplied ticker. A move beyond it would extend the current daily range. On the downside, the 0.0160 area matters as a recent psychological and structural level, while 0.015320 and 0.014598 appeared as earlier hourly highs during the advance. The 0.013653 daily low and 0.009300 four-hour low are wider reference points showing how far the market previously travelled when momentum weakened.
The next useful evidence is not simply another green candle. Volume behaviour during advances, the ability of pullbacks to hold above scanner support, differences between Binance and aggregated pricing, and new information about actual Akedo usage will provide more context. Bitcoin near 77,000 and the broader response to macroeconomic news are also relevant background factors.
𝗕𝗮𝗹𝗮𝗻𝗰𝗲𝗱 𝗰𝗼𝗻𝗰𝗹𝘂𝘀𝗶𝗼𝗻
AKEUSDT is interesting because the market has combined an AI gaming narrative, a sharp price recovery, and enough reported activity to place the token among the scanner’s notable gainers. The chart shows buyers reclaiming levels around 0.0150 and 0.0160 after a volatile period, while the scanner identifies a compact range with nearby upside and invalidation references.
The less comfortable part of the story is equally important. AKE has already delivered extraordinary gains over multiple periods, remains well below its reported recent all-time high, and has a large difference between circulating supply and maximum supply. The supplied research confirms what Akedo says it is building, but it does not confirm a detailed origin history, meaningful product adoption, token utility mechanics, or a project-specific catalyst behind the latest surge.
The cleanest description is a momentum event attached to an early-stage AI gaming thesis. If the market maintains the 0.016270 area, clears 0.016368, and new evidence shows that Akedo is producing real creator and game activity, the narrative could gain credibility. If those levels fail and no fundamental evidence appears, the rally may remain primarily a trading-driven repricing. The next phase will depend on whether AKE can turn attention into sustained usage while defending its recently recovered price structure.
AKEUSDT appeared on the live RR Trader scanner after a sharp burst of activity rather than a quiet, gradual climb. The pair was marked LONG, with a scanner confidence score of 100, a hot-priority score of 13.555, and a TOP_GAINER rank of 10. The scanner recorded a 17.74% move for its hot-gainer filter. The supplied market snapshots showed a 16.431% rise on Binance and a 16.95727% rise in the CoinGecko data. Those figures are close but not identical because the sources use different timestamps and market calculations.
The first important point is that AKE had already made a large move before the signal was recorded. The scanner price was 0.016351 USDT, compared with its proposed entry range of 0.01632647 to 0.01634282. Price was therefore slightly above the scanner’s preferred zone and just below its listed resistance. That is an observation about the data, not a forecast. A fast-moving token can move through a setup quickly, and a scanner signal does not establish that momentum will continue.
𝗪𝗵𝗮𝘁 𝗔𝗸𝗲𝗱𝗼 𝘀𝗮𝘆𝘀 𝗶𝘁 𝗶𝘀 𝗯𝘂𝗶𝗹𝗱𝗶𝗻𝗴
The supplied project information identifies AKE with Akedo, a multi-agent artificial intelligence framework focused on autonomous content creation and intelligent collaboration. Akedo describes a system intended to let creators design engaging games in roughly two minutes by using simple natural-language prompts. Its framework is described as modular, powered by large language models, and designed with scalability and flexibility in mind.
That gives Akedo a straightforward product thesis: use multiple AI agents and natural-language instructions to reduce the complexity of creating interactive content. Game development can involve design, coding, art, narrative work, and production coordination. Akedo’s stated approach is to let creators describe an idea while the framework helps turn that idea into a game.
The practical question is whether the system can consistently produce games that are functional, enjoyable, distinctive, and worth returning to. The research confirms the project’s stated direction, but it does not provide independent evidence about the quality, number, or commercial performance of games created through the framework.
The available material also does not establish a detailed founding history, named founding team, funding background, launch chronology, or audited product milestones. Akedo has a public project description and documentation references, but the supplied research is not sufficient to reconstruct a fully verified origin story.
𝗨𝘁𝗶𝗹𝗶𝘁𝘆 𝗮𝗻𝗱 𝗲𝗰𝗼𝘀𝘆𝘀𝘁𝗲𝗺: 𝗽𝗿𝗼𝗺𝗶𝘀𝗲 𝘃𝗲𝗿𝘀𝘂𝘀 𝗽𝗿𝗼𝗼𝗳
Akedo’s potential utility is tied to AI-assisted game creation and collaboration. The project describes an ecosystem in which creators use natural-language prompts, large language models, and modular AI agents to turn ideas into interactive content. If the system develops as described, the token could eventually be connected to access, incentives, creator participation, digital assets, or other ecosystem functions. However, the supplied data does not specify the exact token utility, fee design, staking mechanics, governance rights, or product permissions attached to AKE.
The available categorization places Akedo in the Artificial Intelligence, AI Applications, BNB Chain Ecosystem, and Binance Wallet IDO groups. The research identifies the token as being on BNB Chain. These details establish the project’s broad ecosystem positioning, but they do not prove adoption.
There is no verified user count, game-library size, revenue figure, active developer count, or application usage metric in the supplied material. That creates an important split in the AKE story. The concept is easy to understand and fits the broader combination of generative AI and interactive entertainment. The evidence for real-world traction is much thinner. A compelling narrative can attract attention, but sustained token demand generally requires a working product, repeat users, visible development, and a clear reason to hold or use the token. The research does not confirm those elements for Akedo.
𝗦𝘂𝗽𝗽𝗹𝘆, 𝘃𝗮𝗹𝘂𝗮𝘁𝗶𝗼𝗻 𝗮𝗻𝗱 𝘁𝗵𝗲 𝗱𝗶𝗹𝘂𝘁𝗶𝗼𝗻 𝗾𝘂𝗲𝘀𝘁𝗶𝗼𝗻
The token data lists a total supply and maximum supply of 100 billion AKE. Circulating supply is listed at 22.79625 billion tokens, or approximately 22.8% of the maximum. CoinGecko reports a market capitalization of about 372.9 million US dollars and a fully diluted valuation of about 1.636 billion dollars. The reported market-cap-to-FDV ratio is 0.23, consistent with a relatively small portion of the maximum supply currently circulating.
This is one of the most important structural details in the AKE setup. The gap between circulating supply and maximum supply means future supply increases are a factor to monitor. If additional tokens enter circulation while demand does not expand at a similar pace, that supply growth could create pressure on price. The research does not provide the unlock schedule, allocation breakdown, vesting terms, investor holdings, treasury policy, or emissions timetable. The timing and scale of possible future dilution are therefore unavailable.
The token is ranked 122 by market capitalization in the supplied CoinGecko snapshot. A separate ranking that accounts for rehypothecated values places it at 173. These rankings are data points rather than proof of liquidity or project quality.
The same dataset reports total trading volume of roughly 9.05 million dollars, while the Binance ticker shows approximately 49.83 million dollars in quote volume for its supplied 24-hour period. The difference is substantial and likely reflects different market coverage or timestamps. Volume comparisons should therefore be treated carefully rather than combined as though they were measuring the same market activity.
𝗣𝗿𝗶𝗰𝗲 𝗮𝗰𝘁𝗶𝗼𝗻 𝗮𝗻𝗱 𝗿𝗲𝗰𝗲𝗻𝘁 𝘀𝘁𝗿𝘂𝗰𝘁𝘂𝗿𝗲
The price picture is powerful but unstable. The Binance ticker showed an open price of 0.014010, a last price of 0.016312, a 24-hour high of 0.016666, and a 24-hour low of 0.013653. That represented a 0.002302 USDT increase, or 16.431%. The CoinGecko snapshot placed the price at 0.01640113, with a 24-hour high of 0.01652677 and a low of 0.01369464, alongside a 16.95727% daily gain.
The wider performance figures explain why AKE attracted attention. The token was reported down 12.7274% over seven days, up 97.41311% over 14 days, up 157.38046% over 30 days, and up 8,546.44447% over 60 days. It was also reported up 3,235.22858% over 200 days and 1,336.06452% over one year.
These returns describe an extreme repricing phase rather than a calm trend. The reported all-time high was 0.0363756 USDT on September 2, 2026. In the supplied dataset, the token remained about 54.9% below that peak.
The hourly candles showed a recovery from the 0.013653 low. Price moved through 0.0150 and then 0.0160, with several high-volume periods during the climb. The most recent four-hour candle range reached 0.016666 and closed around 0.016309 in the supplied data. On the four-hour view, the market had previously reached as low as 0.009300 before recovering. That history shows both strong buying interest during the rebound and the potential for deep retracements when sentiment changes.
𝗪𝗵𝗮𝘁 𝘁𝗵𝗲 𝘀𝗰𝗮𝗻𝗻𝗲𝗿 𝗶𝘀 𝘀𝗲𝗲𝗶𝗻𝗴
The RR Trader scanner recorded a 15-minute move of 0.8325% and a volume ratio of 1.24467. The short-term move remained positive, while the volume ratio was above the scanner’s comparison baseline. It was not an extreme multiple.
The scanner identified support at 0.016270 and resistance at 0.01636803. Its entry range was 0.01632647 to 0.01634282, with a stop reference at 0.01622019 and projected levels at 0.01657828, 0.01669601, and 0.01681373. The stated risk-reward figure was 1.92.
Price was an important part of the setup. At 0.016351, the scanner price sat just above the entry range and just below the listed resistance. That created a narrow decision area. A move through 0.016368 could indicate that buyers were still willing to trade near the recent highs. A failure to hold 0.016270 would weaken the immediate momentum structure, while a move below 0.016220 would move below the scanner’s stated risk reference.
The scanner’s LONG direction and confidence score are outputs from the scanner, not independent confirmation of future performance. The signal is notable because it combines a strong daily move, recent price recovery, elevated activity, and defined nearby levels. It is also vulnerable because it appeared after a large run, when a loss of momentum could leave late participants exposed to a reversal.
𝗕𝗶𝘁𝗰𝗼𝗶𝗻 𝗮𝗻𝗱 𝘁𝗵𝗲 𝘄𝗶𝗱𝗲𝗿 𝗺𝗮𝗿𝗸𝗲𝘁
Bitcoin was comparatively quiet during the supplied period. BTCUSDT was listed at 77,221.80 USDT, up 0.103%, with a high of 77,477.40 and a low of 77,025.10. AKE’s roughly 16% daily move therefore substantially outpaced Bitcoin in the same snapshot.
That comparison indicates that AKE’s move was more specific to the token and its immediate trading activity than to a broad Bitcoin surge. It does not establish the exact cause of the rally. Bitcoin stability can give smaller tokens room to trade on their own narratives, while a sharp BTC reversal could still affect liquidity across the altcoin market. AKE’s recent volatility makes that a relevant risk framework, although the supplied data does not include a direct correlation study.
The wider news feed included macroeconomic and crypto-market stories, including a report that core CPI rose 0.3% in August and could influence expectations for Federal Reserve policy. It also included commentary about Bitcoin’s role in portfolios exposed to heavy AI investment. None of those reports specifically named Akedo or confirmed a direct AKE catalyst.
𝗖𝗮𝘁𝗮𝗹𝘆𝘀𝘁𝘀 𝗮𝗻𝗱 𝗿𝗲𝗱-𝗳𝗹𝗮𝗴 𝗰𝗵𝗲𝗰𝗸𝘀
No recent announcement in the supplied research directly linked the current AKEUSDT rise to a product launch, partnership, exchange event, game release, token burn, funding round, or other Akedo-specific catalyst. The market move is confirmed by the price data, but its cause is not confirmed. It may reflect momentum trading, increased interest in AI tokens, market positioning, or information not included in the research.
The most useful future evidence would involve the framework becoming a demonstrably usable product. New features, completed games, active creators, measurable usage, or clear token utility could help connect the current narrative with a stronger fundamental case. Announcements without verifiable delivery would not resolve the main evidence gap.
The major risks are significant. AKE has already recorded exceptional gains over multiple periods, increasing the possibility of sharp reversals. Only about 22.8% of the maximum supply is listed as circulating, leaving a large difference between current supply and the 100 billion maximum. The research does not provide unlock details, holder concentration, audited contract information, or a detailed allocation schedule. The four-hour data also includes a decline to 0.009300, showing how quickly price conditions have changed in the past.
Finally, the project’s AI and gaming claims remain difficult to evaluate without independently verified product adoption. These gaps do not establish misconduct, but they are areas that require careful scrutiny.
𝗟𝗲𝘃𝗲𝗹𝘀 𝗮𝗻𝗱 𝘀𝗶𝗴𝗻𝗮𝗹𝘀 𝘁𝗼 𝘄𝗮𝘁𝗰𝗵
The immediate scanner map is concentrated between 0.016270 and 0.016368. Support is listed at 0.016270, resistance at 0.01636803, and the invalidation reference at 0.01622019. If price holds above that area and accepts trades above resistance, the scanner’s next reference points are 0.01657828, 0.01669601, and 0.01681373. These are scanner-derived levels, not guaranteed destinations.
The Binance session high at 0.016666 is another important reference because it marks the latest visible high in the supplied ticker. A move beyond it would extend the current daily range. On the downside, the 0.0160 area matters as a recent psychological and structural level, while 0.015320 and 0.014598 appeared as earlier hourly highs during the advance. The 0.013653 daily low and 0.009300 four-hour low are wider reference points showing how far the market previously travelled when momentum weakened.
The next useful evidence is not simply another green candle. Volume behaviour during advances, the ability of pullbacks to hold above scanner support, differences between Binance and aggregated pricing, and new information about actual Akedo usage will provide more context. Bitcoin near 77,000 and the broader response to macroeconomic news are also relevant background factors.
𝗕𝗮𝗹𝗮𝗻𝗰𝗲𝗱 𝗰𝗼𝗻𝗰𝗹𝘂𝘀𝗶𝗼𝗻
AKEUSDT is interesting because the market has combined an AI gaming narrative, a sharp price recovery, and enough reported activity to place the token among the scanner’s notable gainers. The chart shows buyers reclaiming levels around 0.0150 and 0.0160 after a volatile period, while the scanner identifies a compact range with nearby upside and invalidation references.
The less comfortable part of the story is equally important. AKE has already delivered extraordinary gains over multiple periods, remains well below its reported recent all-time high, and has a large difference between circulating supply and maximum supply. The supplied research confirms what Akedo says it is building, but it does not confirm a detailed origin history, meaningful product adoption, token utility mechanics, or a project-specific catalyst behind the latest surge.
The cleanest description is a momentum event attached to an early-stage AI gaming thesis. If the market maintains the 0.016270 area, clears 0.016368, and new evidence shows that Akedo is producing real creator and game activity, the narrative could gain credibility. If those levels fail and no fundamental evidence appears, the rally may remain primarily a trading-driven repricing. The next phase will depend on whether AKE can turn attention into sustained usage while defending its recently recovered price structure.
1
352
·
--
අර්ධ වශයෙන් සත්යයි
පරිවර්තනය බලන්න
QUSDT Faces a Volatile Test After a Sharp Sell-Off𝗧𝗵𝗲 𝘀𝗵𝗮𝗿𝗽 𝗺𝗼𝘃𝗲 𝗽𝘂𝘁𝘀 𝗤𝗨𝗦𝗗𝗧 𝗯𝗮𝗰𝗸 𝗶𝗻𝘁𝗼 𝗳𝗼𝗰𝘂𝘀
QUSDT has become one of the market’s most active losers during the latest observation window. The RR Trader scanner selected the pair with a SHORT direction, a 99.2 confidence score, a TOP_LOSER rank of two, and a selection score of 173.33. That is a technical alert, not proof that the decline must continue. It does, however, explain why the token deserves attention after such a large move.
The supplied data shows QUSDT trading close to 0.024 USDT, with prices differing slightly between the scanner, ticker feed, and CoinGecko snapshot. The scanner reference price is 0.024227, the ticker feed reports a latest price of 0.023973, and CoinGecko lists 0.023885. These readings cover different timestamps and data sources. The consistent message is that QUSDT has fallen sharply and is now trading near the lower portion of a recently expanded range.
The central question is whether this move represents a violent reset after a strong period of performance or the beginning of a deeper change in market structure.
𝗪𝗵𝗮𝘁 𝗤𝘂𝗮𝗰𝗸 𝗔𝗜 𝗶𝘀 𝗱𝗲𝘀𝗶𝗴𝗻𝗲𝗱 𝘁𝗼 𝗱𝗼
The Q token is identified with Quack AI, a project positioned around what it describes as the agent economy. Its stated focus is an environment where artificial-intelligence agents, users, and applications interact and transact on-chain under verifiable rules.
The project description presents Quack AI as a governance layer for this environment. Its stated components include the x402 standard, sign-to-pay and gasless transactions across blockchains, a facilitator relay system, a policy engine, and governance-intelligence modules. Together, these are intended to support automated on-chain actions while addressing issues such as authorization, spending rules, compliance, and accountability.
The use case is straightforward in theory. An autonomous agent may need to pay for data, call an external service, follow a policy, or execute a transaction without waiting for a person to approve every step. A system built for that setting would need rules governing what the agent can do, how payments are authorized, and how actions can be reviewed.
The available research describes the intended architecture, but it does not establish the scale of adoption. It contains no independently verified figures for active users, agent transactions, revenue, or the number of applications using the system. The project’s narrative may be timely, but a narrative alone does not show that the infrastructure has achieved meaningful production usage.
𝗣𝗿𝗼𝗷𝗲𝗰𝘁 𝗶𝗱𝗲𝗻𝘁𝗶𝘁𝘆 𝗮𝗻𝗱 𝗲𝗰𝗼𝘀𝘆𝘀𝘁𝗲𝗺 𝗳𝗼𝗼𝘁𝗽𝗿𝗶𝗻𝘁
The available records categorize Quack AI under artificial intelligence, AI applications, governance, the BNB Chain ecosystem, and the Ethereum ecosystem. The supplied token information includes the same contract address for Ethereum and BNB Chain listings. The asset is also included in a Binance Alpha Spotlight category in the market data.
The research does not provide a fully verified founding history, named founding team, launch chronology, funding-round details, or a complete investor-allocation record. Those omissions are important for anyone assessing the project beyond its chart. A technically attractive description can still leave unanswered questions about development responsibility, governance control, delivery speed, and the distribution of decision-making power.
The supplied project records include a homepage, documentation, community publication channels, and a public code repository. However, the research does not verify the quality, activity, security, or production status of those resources. It also does not establish whether the listed code is actively maintained or whether the described modules are operating at scale.
The available information suggests that Q’s intended role is connected to governance and the infrastructure surrounding AI-agent payments and policies. It does not specify a complete list of governance rights, fee-capture mechanisms, staking functions, or required token sinks. Those features should not be assumed without further documentation.
𝗦𝘂𝗽𝗽𝗹𝘆 𝗮𝗻𝗱 𝘁𝗵𝗲 𝗙𝗗𝗩 𝗴𝗮𝗽
QUSDT has a reported total supply and maximum supply of 10 billion tokens. Circulating supply is listed at approximately 4.4458 billion, meaning about 44.46% of the maximum supply is circulating. CoinGecko reports a market capitalization of approximately 106.1 million US dollars and a fully diluted valuation of about 238.6 million dollars. The market-cap-to-FDV ratio is listed at 0.44.
That difference between current market capitalization and fully diluted valuation is one of the main fundamental issues in the QUSDT profile. If the remaining supply enters circulation, it could create additional selling pressure unless demand grows quickly enough to absorb it. The available research does not include a verified unlock calendar, vesting schedule, allocation breakdown, treasury policy, or holder distribution.
As a result, the potential dilution risk cannot be timed or measured precisely from the supplied data. It is possible to identify the gap, but not to say when future tokens may enter the market or which groups control them. The absence of that information limits confidence in any long-term valuation assessment.
CoinGecko places the asset around rank 260 by market capitalization in the supplied snapshot. Reported total market volume is approximately 5.49 million dollars, while the ticker feed records about 8.28 million dollars in quote volume for its own observation period. These figures should not be combined because they may represent different venues and timestamps. They do show that QUSDT is attracting substantial short-term activity relative to its reported market capitalization.
𝗧𝗵𝗲 𝗰𝗵𝗮𝗿𝘁 𝘀𝗵𝗼𝘄𝘀 𝘃𝗼𝗹𝗮𝘁𝗶𝗹𝗶𝘁𝘆, 𝗻𝗼𝘁 𝗮 𝘀𝗶𝗺𝗽𝗹𝗲 𝗱𝗼𝘄𝗻𝘁𝗿𝗲𝗻𝗱
The 24-hour picture is clearly negative. CoinGecko reports a price near 0.023885, down 14.12% over 24 hours, with a high near 0.025647 and a low near 0.020582. The ticker feed records an opening price around 0.027871, a high of 0.028372, a low of 0.020357, and a latest price near 0.023973. Its reported change is approximately negative 13.986%.
The scanner records a 15-minute move of negative 0.436%, indicating that selling pressure was still present when the signal was generated, although the short-term move was less severe than the earlier breakdown.
The hourly and four-hour candles show a rapid expansion followed by unstable recovery attempts. QUSDT moved from the mid-0.025 area toward 0.028, then fell through 0.024 and reached the 0.0203 to 0.0207 zone. A rebound carried price back above 0.024, but later candles repeatedly struggled to hold gains around 0.0242 to 0.0246.
That pattern creates a market with long wicks, fast reversals, and a high risk of stop-driven moves rather than a smooth directional trend. The recovery from the low is important, but it has not yet removed the evidence of heavy selling.
The broader performance record adds another layer. Q is down 6.16% over seven days but remains up 10.59% over 30 days, 28.62% over 60 days, and 46.39% over one year in the supplied CoinGecko data. The current weakness therefore sits inside a longer period of gains. Describing the entire trend as bearish would ignore that context, while treating the sell-off as harmless would ignore its size.
𝗪𝗵𝘆 𝘁𝗵𝗲 𝘀𝗰𝗮𝗻𝗻𝗲𝗿 𝗳𝗮𝘃𝗼𝗿𝘀 𝗮 𝘀𝗵𝗼𝗿𝘁-𝘀𝗶𝗱𝗲 𝘀𝗰𝗲𝗻𝗮𝗿𝗶𝗼
The scanner marks QUSDT as SHORT with a 99.2 confidence score, a hot priority of 14.82625, a selection score of 173.33, and a TOP_LOSER rank of two. Its suggested entry band is 0.024239 to 0.024263, close to the scanner’s resistance reference at 0.024253. The listed stop-loss reference is 0.0243817, while the three profit references are 0.0239606, 0.0238213, and 0.0236821. The scanner calculates a risk-reward ratio of approximately 2.35.
The apparent logic is a failed-recovery or resistance-retest setup. After the breakdown toward 0.0203, price rebounded but did not establish a clear sequence of higher highs. The scanner is therefore watching whether the market can reclaim and hold the narrow 0.02424 to 0.02426 area. Repeated rejection below that zone would leave the earlier breakdown in control of the immediate structure.
The volume ratio is 0.855, indicating that current volume is below the scanner’s comparison baseline. That may fit a cautious continuation thesis, but it also suggests that conviction is not overwhelming. Lower comparative volume can accompany a pause, a consolidation phase, or a move that is vulnerable to a sudden reversal.
Open interest is reported at 266,430,283 Q units. Open interest by itself does not show whether positions are predominantly long or short. Without funding, liquidation, or position-side data, it cannot confirm the direction of derivatives positioning. Still, the combination of substantial open interest and a sharp price move means that squeezes remain possible in either direction.
𝗞𝗲𝘆 𝗹𝗲𝘃𝗲𝗹𝘀 𝗮𝗻𝗱 𝘁𝗵𝗲 𝗕𝗧𝗖 𝗯𝗮𝗰𝗸𝗱𝗿𝗼𝗽
The scanner’s immediate resistance is 0.024253, with the reference entry band positioned around that level. A move above 0.0243817 would invalidate the scanner’s stated stop reference and weaken the immediate bearish setup. It would not automatically create a bullish trend, but it would show that sellers had failed to defend the nearby rejection area.
On the downside, the scanner lists support at 0.0240412, followed by references at 0.0239606, 0.0238213, and 0.0236821. These levels are close together, so execution conditions and spread may matter more than the apparent distance between them.
The wider ticker range gives additional context. The low near 0.020357 is the main breakdown-and-recovery floor in the supplied data. The 0.0254 to 0.0257 region acted as an upper area after the collapse, while 0.028372 is the recorded high for the observation window. A recovery above those areas would require a fresh assessment of the short-term structure rather than an automatic continuation of the current signal.
Bitcoin is relatively stable compared with QUSDT in the same snapshot. BTC is listed near 77,165.10 USDT, down 0.18%, with a range between 76,942.70 and 77,477.40. This suggests that QUSDT’s approximately 14% decline was primarily token-specific rather than the direct result of a comparable Bitcoin sell-off. That interpretation has limits, but the contrast is notable: QUSDT weakened sharply while BTC moved only modestly.
𝗖𝗮𝘁𝗮𝗹𝘆𝘀𝘁𝘀 𝗮𝗻𝗱 𝘄𝗵𝗮𝘁 𝘁𝗵𝗲 𝗿𝗲𝘀𝗲𝗮𝗿𝗰𝗵 𝗱𝗼𝗲𝘀 𝗻𝗼𝘁 𝘀𝗵𝗼𝘄
The supplied news feed includes stories about Bitcoin encryption, crypto-related political donations, a data exposure incident, regulatory risk surrounding another trading platform, and corporate Bitcoin strategy. None of those headlines directly confirms a Quack AI partnership, product launch, token unlock, exchange announcement, governance vote, security incident, or revenue update.
There is therefore no verified project-specific catalyst in the supplied news that clearly explains the QUSDT sell-off. The move may be driven by market positioning, token-specific order flow, or information not included in the research, but the available material does not establish a precise cause.
The AI-agent theme remains the project’s main potential long-term narrative. Confirmed integrations, measurable transaction growth, or a transparent update on governance and token utility would provide stronger evidence than general enthusiasm around artificial intelligence. Conversely, slower delivery, limited visible usage, or continued uncertainty around the token’s practical role could weaken the valuation case.
General AI headlines should not be treated as direct evidence of Q adoption. The supplied data supports a description of the project’s intended infrastructure, not a conclusion that the system has reached broad usage.
𝗥𝗶𝘀𝗸𝘀 𝗮𝗻𝗱 𝘁𝗵𝗲 𝗻𝗲𝘅𝘁 𝗱𝗲𝗰𝗶𝘀𝗶𝗼𝗻 𝗽𝗼𝗶𝗻𝘁
The first major risk is volatility. QUSDT moved from 0.028372 to 0.020357 within the supplied ticker range before recovering toward 0.024. Such a swing can produce slippage, liquidation cascades, and false breakouts. The scanner’s narrow levels are reference points, not guarantees that the market will respect them.
The second risk is supply visibility. With less than half of the maximum supply circulating and the market capitalization well below FDV, future supply changes could become a source of pressure. Because the research does not provide an unlock schedule or holder-concentration data, that risk remains unresolved rather than precisely measurable.
The third risk concerns verification. The project describes sophisticated infrastructure, but the supplied data does not verify adoption, code quality, independent audits, smart-contract risk, governance decentralization, or the financial condition of an operating entity. Different sources also report slightly different prices, which is expected across timestamps and venues, but the exact market and instrument still matter when interpreting the chart.
The immediate technical question is whether QUSDT can reclaim and hold the 0.024253 to 0.024382 area or whether rallies continue to fail below it. A move toward 0.0239606, 0.0238213, and 0.0236821 would keep the scanner’s downside structure active. A sustained recovery above the invalidation area would challenge that view.
The balanced conclusion is that QUSDT combines a timely AI-agent narrative with an aggressive short-term chart. Quack AI is positioned around agent payments, policy controls, and governance, but important adoption and tokenomics details remain unavailable. Technically, the scanner sees a high-confidence pullback setup after a sharp breakdown, while the longer performance record shows that Q has also delivered substantial gains over broader periods. The next meaningful signal will come from the battle around 0.02425, the behavior of derivatives positioning, and evidence that the project’s stated utility is becoming measurable rather than remaining only a market narrative.
QUSDT Faces a Volatile Test After a Sharp Sell-Off
𝗧𝗵𝗲 𝘀𝗵𝗮𝗿𝗽 𝗺𝗼𝘃𝗲 𝗽𝘂𝘁𝘀 𝗤𝗨𝗦𝗗𝗧 𝗯𝗮𝗰𝗸 𝗶𝗻𝘁𝗼 𝗳𝗼𝗰𝘂𝘀
QUSDT has become one of the market’s most active losers during the latest observation window. The RR Trader scanner selected the pair with a SHORT direction, a 99.2 confidence score, a TOP_LOSER rank of two, and a selection score of 173.33. That is a technical alert, not proof that the decline must continue. It does, however, explain why the token deserves attention after such a large move.
The supplied data shows QUSDT trading close to 0.024 USDT, with prices differing slightly between the scanner, ticker feed, and CoinGecko snapshot. The scanner reference price is 0.024227, the ticker feed reports a latest price of 0.023973, and CoinGecko lists 0.023885. These readings cover different timestamps and data sources. The consistent message is that QUSDT has fallen sharply and is now trading near the lower portion of a recently expanded range.
The central question is whether this move represents a violent reset after a strong period of performance or the beginning of a deeper change in market structure.
𝗪𝗵𝗮𝘁 𝗤𝘂𝗮𝗰𝗸 𝗔𝗜 𝗶𝘀 𝗱𝗲𝘀𝗶𝗴𝗻𝗲𝗱 𝘁𝗼 𝗱𝗼
The Q token is identified with Quack AI, a project positioned around what it describes as the agent economy. Its stated focus is an environment where artificial-intelligence agents, users, and applications interact and transact on-chain under verifiable rules.
The project description presents Quack AI as a governance layer for this environment. Its stated components include the x402 standard, sign-to-pay and gasless transactions across blockchains, a facilitator relay system, a policy engine, and governance-intelligence modules. Together, these are intended to support automated on-chain actions while addressing issues such as authorization, spending rules, compliance, and accountability.
The use case is straightforward in theory. An autonomous agent may need to pay for data, call an external service, follow a policy, or execute a transaction without waiting for a person to approve every step. A system built for that setting would need rules governing what the agent can do, how payments are authorized, and how actions can be reviewed.
The available research describes the intended architecture, but it does not establish the scale of adoption. It contains no independently verified figures for active users, agent transactions, revenue, or the number of applications using the system. The project’s narrative may be timely, but a narrative alone does not show that the infrastructure has achieved meaningful production usage.
𝗣𝗿𝗼𝗷𝗲𝗰𝘁 𝗶𝗱𝗲𝗻𝘁𝗶𝘁𝘆 𝗮𝗻𝗱 𝗲𝗰𝗼𝘀𝘆𝘀𝘁𝗲𝗺 𝗳𝗼𝗼𝘁𝗽𝗿𝗶𝗻𝘁
The available records categorize Quack AI under artificial intelligence, AI applications, governance, the BNB Chain ecosystem, and the Ethereum ecosystem. The supplied token information includes the same contract address for Ethereum and BNB Chain listings. The asset is also included in a Binance Alpha Spotlight category in the market data.
The research does not provide a fully verified founding history, named founding team, launch chronology, funding-round details, or a complete investor-allocation record. Those omissions are important for anyone assessing the project beyond its chart. A technically attractive description can still leave unanswered questions about development responsibility, governance control, delivery speed, and the distribution of decision-making power.
The supplied project records include a homepage, documentation, community publication channels, and a public code repository. However, the research does not verify the quality, activity, security, or production status of those resources. It also does not establish whether the listed code is actively maintained or whether the described modules are operating at scale.
The available information suggests that Q’s intended role is connected to governance and the infrastructure surrounding AI-agent payments and policies. It does not specify a complete list of governance rights, fee-capture mechanisms, staking functions, or required token sinks. Those features should not be assumed without further documentation.
𝗦𝘂𝗽𝗽𝗹𝘆 𝗮𝗻𝗱 𝘁𝗵𝗲 𝗙𝗗𝗩 𝗴𝗮𝗽
QUSDT has a reported total supply and maximum supply of 10 billion tokens. Circulating supply is listed at approximately 4.4458 billion, meaning about 44.46% of the maximum supply is circulating. CoinGecko reports a market capitalization of approximately 106.1 million US dollars and a fully diluted valuation of about 238.6 million dollars. The market-cap-to-FDV ratio is listed at 0.44.
That difference between current market capitalization and fully diluted valuation is one of the main fundamental issues in the QUSDT profile. If the remaining supply enters circulation, it could create additional selling pressure unless demand grows quickly enough to absorb it. The available research does not include a verified unlock calendar, vesting schedule, allocation breakdown, treasury policy, or holder distribution.
As a result, the potential dilution risk cannot be timed or measured precisely from the supplied data. It is possible to identify the gap, but not to say when future tokens may enter the market or which groups control them. The absence of that information limits confidence in any long-term valuation assessment.
CoinGecko places the asset around rank 260 by market capitalization in the supplied snapshot. Reported total market volume is approximately 5.49 million dollars, while the ticker feed records about 8.28 million dollars in quote volume for its own observation period. These figures should not be combined because they may represent different venues and timestamps. They do show that QUSDT is attracting substantial short-term activity relative to its reported market capitalization.
𝗧𝗵𝗲 𝗰𝗵𝗮𝗿𝘁 𝘀𝗵𝗼𝘄𝘀 𝘃𝗼𝗹𝗮𝘁𝗶𝗹𝗶𝘁𝘆, 𝗻𝗼𝘁 𝗮 𝘀𝗶𝗺𝗽𝗹𝗲 𝗱𝗼𝘄𝗻𝘁𝗿𝗲𝗻𝗱
The 24-hour picture is clearly negative. CoinGecko reports a price near 0.023885, down 14.12% over 24 hours, with a high near 0.025647 and a low near 0.020582. The ticker feed records an opening price around 0.027871, a high of 0.028372, a low of 0.020357, and a latest price near 0.023973. Its reported change is approximately negative 13.986%.
The scanner records a 15-minute move of negative 0.436%, indicating that selling pressure was still present when the signal was generated, although the short-term move was less severe than the earlier breakdown.
The hourly and four-hour candles show a rapid expansion followed by unstable recovery attempts. QUSDT moved from the mid-0.025 area toward 0.028, then fell through 0.024 and reached the 0.0203 to 0.0207 zone. A rebound carried price back above 0.024, but later candles repeatedly struggled to hold gains around 0.0242 to 0.0246.
That pattern creates a market with long wicks, fast reversals, and a high risk of stop-driven moves rather than a smooth directional trend. The recovery from the low is important, but it has not yet removed the evidence of heavy selling.
The broader performance record adds another layer. Q is down 6.16% over seven days but remains up 10.59% over 30 days, 28.62% over 60 days, and 46.39% over one year in the supplied CoinGecko data. The current weakness therefore sits inside a longer period of gains. Describing the entire trend as bearish would ignore that context, while treating the sell-off as harmless would ignore its size.
𝗪𝗵𝘆 𝘁𝗵𝗲 𝘀𝗰𝗮𝗻𝗻𝗲𝗿 𝗳𝗮𝘃𝗼𝗿𝘀 𝗮 𝘀𝗵𝗼𝗿𝘁-𝘀𝗶𝗱𝗲 𝘀𝗰𝗲𝗻𝗮𝗿𝗶𝗼
The scanner marks QUSDT as SHORT with a 99.2 confidence score, a hot priority of 14.82625, a selection score of 173.33, and a TOP_LOSER rank of two. Its suggested entry band is 0.024239 to 0.024263, close to the scanner’s resistance reference at 0.024253. The listed stop-loss reference is 0.0243817, while the three profit references are 0.0239606, 0.0238213, and 0.0236821. The scanner calculates a risk-reward ratio of approximately 2.35.
The apparent logic is a failed-recovery or resistance-retest setup. After the breakdown toward 0.0203, price rebounded but did not establish a clear sequence of higher highs. The scanner is therefore watching whether the market can reclaim and hold the narrow 0.02424 to 0.02426 area. Repeated rejection below that zone would leave the earlier breakdown in control of the immediate structure.
The volume ratio is 0.855, indicating that current volume is below the scanner’s comparison baseline. That may fit a cautious continuation thesis, but it also suggests that conviction is not overwhelming. Lower comparative volume can accompany a pause, a consolidation phase, or a move that is vulnerable to a sudden reversal.
Open interest is reported at 266,430,283 Q units. Open interest by itself does not show whether positions are predominantly long or short. Without funding, liquidation, or position-side data, it cannot confirm the direction of derivatives positioning. Still, the combination of substantial open interest and a sharp price move means that squeezes remain possible in either direction.
𝗞𝗲𝘆 𝗹𝗲𝘃𝗲𝗹𝘀 𝗮𝗻𝗱 𝘁𝗵𝗲 𝗕𝗧𝗖 𝗯𝗮𝗰𝗸𝗱𝗿𝗼𝗽
The scanner’s immediate resistance is 0.024253, with the reference entry band positioned around that level. A move above 0.0243817 would invalidate the scanner’s stated stop reference and weaken the immediate bearish setup. It would not automatically create a bullish trend, but it would show that sellers had failed to defend the nearby rejection area.
On the downside, the scanner lists support at 0.0240412, followed by references at 0.0239606, 0.0238213, and 0.0236821. These levels are close together, so execution conditions and spread may matter more than the apparent distance between them.
The wider ticker range gives additional context. The low near 0.020357 is the main breakdown-and-recovery floor in the supplied data. The 0.0254 to 0.0257 region acted as an upper area after the collapse, while 0.028372 is the recorded high for the observation window. A recovery above those areas would require a fresh assessment of the short-term structure rather than an automatic continuation of the current signal.
Bitcoin is relatively stable compared with QUSDT in the same snapshot. BTC is listed near 77,165.10 USDT, down 0.18%, with a range between 76,942.70 and 77,477.40. This suggests that QUSDT’s approximately 14% decline was primarily token-specific rather than the direct result of a comparable Bitcoin sell-off. That interpretation has limits, but the contrast is notable: QUSDT weakened sharply while BTC moved only modestly.
𝗖𝗮𝘁𝗮𝗹𝘆𝘀𝘁𝘀 𝗮𝗻𝗱 𝘄𝗵𝗮𝘁 𝘁𝗵𝗲 𝗿𝗲𝘀𝗲𝗮𝗿𝗰𝗵 𝗱𝗼𝗲𝘀 𝗻𝗼𝘁 𝘀𝗵𝗼𝘄
The supplied news feed includes stories about Bitcoin encryption, crypto-related political donations, a data exposure incident, regulatory risk surrounding another trading platform, and corporate Bitcoin strategy. None of those headlines directly confirms a Quack AI partnership, product launch, token unlock, exchange announcement, governance vote, security incident, or revenue update.
There is therefore no verified project-specific catalyst in the supplied news that clearly explains the QUSDT sell-off. The move may be driven by market positioning, token-specific order flow, or information not included in the research, but the available material does not establish a precise cause.
The AI-agent theme remains the project’s main potential long-term narrative. Confirmed integrations, measurable transaction growth, or a transparent update on governance and token utility would provide stronger evidence than general enthusiasm around artificial intelligence. Conversely, slower delivery, limited visible usage, or continued uncertainty around the token’s practical role could weaken the valuation case.
General AI headlines should not be treated as direct evidence of Q adoption. The supplied data supports a description of the project’s intended infrastructure, not a conclusion that the system has reached broad usage.
𝗥𝗶𝘀𝗸𝘀 𝗮𝗻𝗱 𝘁𝗵𝗲 𝗻𝗲𝘅𝘁 𝗱𝗲𝗰𝗶𝘀𝗶𝗼𝗻 𝗽𝗼𝗶𝗻𝘁
The first major risk is volatility. QUSDT moved from 0.028372 to 0.020357 within the supplied ticker range before recovering toward 0.024. Such a swing can produce slippage, liquidation cascades, and false breakouts. The scanner’s narrow levels are reference points, not guarantees that the market will respect them.
The second risk is supply visibility. With less than half of the maximum supply circulating and the market capitalization well below FDV, future supply changes could become a source of pressure. Because the research does not provide an unlock schedule or holder-concentration data, that risk remains unresolved rather than precisely measurable.
The third risk concerns verification. The project describes sophisticated infrastructure, but the supplied data does not verify adoption, code quality, independent audits, smart-contract risk, governance decentralization, or the financial condition of an operating entity. Different sources also report slightly different prices, which is expected across timestamps and venues, but the exact market and instrument still matter when interpreting the chart.
The immediate technical question is whether QUSDT can reclaim and hold the 0.024253 to 0.024382 area or whether rallies continue to fail below it. A move toward 0.0239606, 0.0238213, and 0.0236821 would keep the scanner’s downside structure active. A sustained recovery above the invalidation area would challenge that view.
The balanced conclusion is that QUSDT combines a timely AI-agent narrative with an aggressive short-term chart. Quack AI is positioned around agent payments, policy controls, and governance, but important adoption and tokenomics details remain unavailable. Technically, the scanner sees a high-confidence pullback setup after a sharp breakdown, while the longer performance record shows that Q has also delivered substantial gains over broader periods. The next meaningful signal will come from the battle around 0.02425, the behavior of derivatives positioning, and evidence that the project’s stated utility is becoming measurable rather than remaining only a market narrative.
QUSDT has become one of the market’s most active losers during the latest observation window. The RR Trader scanner selected the pair with a SHORT direction, a 99.2 confidence score, a TOP_LOSER rank of two, and a selection score of 173.33. That is a technical alert, not proof that the decline must continue. It does, however, explain why the token deserves attention after such a large move.
The supplied data shows QUSDT trading close to 0.024 USDT, with prices differing slightly between the scanner, ticker feed, and CoinGecko snapshot. The scanner reference price is 0.024227, the ticker feed reports a latest price of 0.023973, and CoinGecko lists 0.023885. These readings cover different timestamps and data sources. The consistent message is that QUSDT has fallen sharply and is now trading near the lower portion of a recently expanded range.
The central question is whether this move represents a violent reset after a strong period of performance or the beginning of a deeper change in market structure.
𝗪𝗵𝗮𝘁 𝗤𝘂𝗮𝗰𝗸 𝗔𝗜 𝗶𝘀 𝗱𝗲𝘀𝗶𝗴𝗻𝗲𝗱 𝘁𝗼 𝗱𝗼
The Q token is identified with Quack AI, a project positioned around what it describes as the agent economy. Its stated focus is an environment where artificial-intelligence agents, users, and applications interact and transact on-chain under verifiable rules.
The project description presents Quack AI as a governance layer for this environment. Its stated components include the x402 standard, sign-to-pay and gasless transactions across blockchains, a facilitator relay system, a policy engine, and governance-intelligence modules. Together, these are intended to support automated on-chain actions while addressing issues such as authorization, spending rules, compliance, and accountability.
The use case is straightforward in theory. An autonomous agent may need to pay for data, call an external service, follow a policy, or execute a transaction without waiting for a person to approve every step. A system built for that setting would need rules governing what the agent can do, how payments are authorized, and how actions can be reviewed.
The available research describes the intended architecture, but it does not establish the scale of adoption. It contains no independently verified figures for active users, agent transactions, revenue, or the number of applications using the system. The project’s narrative may be timely, but a narrative alone does not show that the infrastructure has achieved meaningful production usage.
𝗣𝗿𝗼𝗷𝗲𝗰𝘁 𝗶𝗱𝗲𝗻𝘁𝗶𝘁𝘆 𝗮𝗻𝗱 𝗲𝗰𝗼𝘀𝘆𝘀𝘁𝗲𝗺 𝗳𝗼𝗼𝘁𝗽𝗿𝗶𝗻𝘁
The available records categorize Quack AI under artificial intelligence, AI applications, governance, the BNB Chain ecosystem, and the Ethereum ecosystem. The supplied token information includes the same contract address for Ethereum and BNB Chain listings. The asset is also included in a Binance Alpha Spotlight category in the market data.
The research does not provide a fully verified founding history, named founding team, launch chronology, funding-round details, or a complete investor-allocation record. Those omissions are important for anyone assessing the project beyond its chart. A technically attractive description can still leave unanswered questions about development responsibility, governance control, delivery speed, and the distribution of decision-making power.
The supplied project records include a homepage, documentation, community publication channels, and a public code repository. However, the research does not verify the quality, activity, security, or production status of those resources. It also does not establish whether the listed code is actively maintained or whether the described modules are operating at scale.
The available information suggests that Q’s intended role is connected to governance and the infrastructure surrounding AI-agent payments and policies. It does not specify a complete list of governance rights, fee-capture mechanisms, staking functions, or required token sinks. Those features should not be assumed without further documentation.
𝗦𝘂𝗽𝗽𝗹𝘆 𝗮𝗻𝗱 𝘁𝗵𝗲 𝗙𝗗𝗩 𝗴𝗮𝗽
QUSDT has a reported total supply and maximum supply of 10 billion tokens. Circulating supply is listed at approximately 4.4458 billion, meaning about 44.46% of the maximum supply is circulating. CoinGecko reports a market capitalization of approximately 106.1 million US dollars and a fully diluted valuation of about 238.6 million dollars. The market-cap-to-FDV ratio is listed at 0.44.
That difference between current market capitalization and fully diluted valuation is one of the main fundamental issues in the QUSDT profile. If the remaining supply enters circulation, it could create additional selling pressure unless demand grows quickly enough to absorb it. The available research does not include a verified unlock calendar, vesting schedule, allocation breakdown, treasury policy, or holder distribution.
As a result, the potential dilution risk cannot be timed or measured precisely from the supplied data. It is possible to identify the gap, but not to say when future tokens may enter the market or which groups control them. The absence of that information limits confidence in any long-term valuation assessment.
CoinGecko places the asset around rank 260 by market capitalization in the supplied snapshot. Reported total market volume is approximately 5.49 million dollars, while the ticker feed records about 8.28 million dollars in quote volume for its own observation period. These figures should not be combined because they may represent different venues and timestamps. They do show that QUSDT is attracting substantial short-term activity relative to its reported market capitalization.
𝗧𝗵𝗲 𝗰𝗵𝗮𝗿𝘁 𝘀𝗵𝗼𝘄𝘀 𝘃𝗼𝗹𝗮𝘁𝗶𝗹𝗶𝘁𝘆, 𝗻𝗼𝘁 𝗮 𝘀𝗶𝗺𝗽𝗹𝗲 𝗱𝗼𝘄𝗻𝘁𝗿𝗲𝗻𝗱
The 24-hour picture is clearly negative. CoinGecko reports a price near 0.023885, down 14.12% over 24 hours, with a high near 0.025647 and a low near 0.020582. The ticker feed records an opening price around 0.027871, a high of 0.028372, a low of 0.020357, and a latest price near 0.023973. Its reported change is approximately negative 13.986%.
The scanner records a 15-minute move of negative 0.436%, indicating that selling pressure was still present when the signal was generated, although the short-term move was less severe than the earlier breakdown.
The hourly and four-hour candles show a rapid expansion followed by unstable recovery attempts. QUSDT moved from the mid-0.025 area toward 0.028, then fell through 0.024 and reached the 0.0203 to 0.0207 zone. A rebound carried price back above 0.024, but later candles repeatedly struggled to hold gains around 0.0242 to 0.0246.
That pattern creates a market with long wicks, fast reversals, and a high risk of stop-driven moves rather than a smooth directional trend. The recovery from the low is important, but it has not yet removed the evidence of heavy selling.
The broader performance record adds another layer. Q is down 6.16% over seven days but remains up 10.59% over 30 days, 28.62% over 60 days, and 46.39% over one year in the supplied CoinGecko data. The current weakness therefore sits inside a longer period of gains. Describing the entire trend as bearish would ignore that context, while treating the sell-off as harmless would ignore its size.
𝗪𝗵𝘆 𝘁𝗵𝗲 𝘀𝗰𝗮𝗻𝗻𝗲𝗿 𝗳𝗮𝘃𝗼𝗿𝘀 𝗮 𝘀𝗵𝗼𝗿𝘁-𝘀𝗶𝗱𝗲 𝘀𝗰𝗲𝗻𝗮𝗿𝗶𝗼
The scanner marks QUSDT as SHORT with a 99.2 confidence score, a hot priority of 14.82625, a selection score of 173.33, and a TOP_LOSER rank of two. Its suggested entry band is 0.024239 to 0.024263, close to the scanner’s resistance reference at 0.024253. The listed stop-loss reference is 0.0243817, while the three profit references are 0.0239606, 0.0238213, and 0.0236821. The scanner calculates a risk-reward ratio of approximately 2.35.
The apparent logic is a failed-recovery or resistance-retest setup. After the breakdown toward 0.0203, price rebounded but did not establish a clear sequence of higher highs. The scanner is therefore watching whether the market can reclaim and hold the narrow 0.02424 to 0.02426 area. Repeated rejection below that zone would leave the earlier breakdown in control of the immediate structure.
The volume ratio is 0.855, indicating that current volume is below the scanner’s comparison baseline. That may fit a cautious continuation thesis, but it also suggests that conviction is not overwhelming. Lower comparative volume can accompany a pause, a consolidation phase, or a move that is vulnerable to a sudden reversal.
Open interest is reported at 266,430,283 Q units. Open interest by itself does not show whether positions are predominantly long or short. Without funding, liquidation, or position-side data, it cannot confirm the direction of derivatives positioning. Still, the combination of substantial open interest and a sharp price move means that squeezes remain possible in either direction.
𝗞𝗲𝘆 𝗹𝗲𝘃𝗲𝗹𝘀 𝗮𝗻𝗱 𝘁𝗵𝗲 𝗕𝗧𝗖 𝗯𝗮𝗰𝗸𝗱𝗿𝗼𝗽
The scanner’s immediate resistance is 0.024253, with the reference entry band positioned around that level. A move above 0.0243817 would invalidate the scanner’s stated stop reference and weaken the immediate bearish setup. It would not automatically create a bullish trend, but it would show that sellers had failed to defend the nearby rejection area.
On the downside, the scanner lists support at 0.0240412, followed by references at 0.0239606, 0.0238213, and 0.0236821. These levels are close together, so execution conditions and spread may matter more than the apparent distance between them.
The wider ticker range gives additional context. The low near 0.020357 is the main breakdown-and-recovery floor in the supplied data. The 0.0254 to 0.0257 region acted as an upper area after the collapse, while 0.028372 is the recorded high for the observation window. A recovery above those areas would require a fresh assessment of the short-term structure rather than an automatic continuation of the current signal.
Bitcoin is relatively stable compared with QUSDT in the same snapshot. BTC is listed near 77,165.10 USDT, down 0.18%, with a range between 76,942.70 and 77,477.40. This suggests that QUSDT’s approximately 14% decline was primarily token-specific rather than the direct result of a comparable Bitcoin sell-off. That interpretation has limits, but the contrast is notable: QUSDT weakened sharply while BTC moved only modestly.
𝗖𝗮𝘁𝗮𝗹𝘆𝘀𝘁𝘀 𝗮𝗻𝗱 𝘄𝗵𝗮𝘁 𝘁𝗵𝗲 𝗿𝗲𝘀𝗲𝗮𝗿𝗰𝗵 𝗱𝗼𝗲𝘀 𝗻𝗼𝘁 𝘀𝗵𝗼𝘄
The supplied news feed includes stories about Bitcoin encryption, crypto-related political donations, a data exposure incident, regulatory risk surrounding another trading platform, and corporate Bitcoin strategy. None of those headlines directly confirms a Quack AI partnership, product launch, token unlock, exchange announcement, governance vote, security incident, or revenue update.
There is therefore no verified project-specific catalyst in the supplied news that clearly explains the QUSDT sell-off. The move may be driven by market positioning, token-specific order flow, or information not included in the research, but the available material does not establish a precise cause.
The AI-agent theme remains the project’s main potential long-term narrative. Confirmed integrations, measurable transaction growth, or a transparent update on governance and token utility would provide stronger evidence than general enthusiasm around artificial intelligence. Conversely, slower delivery, limited visible usage, or continued uncertainty around the token’s practical role could weaken the valuation case.
General AI headlines should not be treated as direct evidence of Q adoption. The supplied data supports a description of the project’s intended infrastructure, not a conclusion that the system has reached broad usage.
𝗥𝗶𝘀𝗸𝘀 𝗮𝗻𝗱 𝘁𝗵𝗲 𝗻𝗲𝘅𝘁 𝗱𝗲𝗰𝗶𝘀𝗶𝗼𝗻 𝗽𝗼𝗶𝗻𝘁
The first major risk is volatility. QUSDT moved from 0.028372 to 0.020357 within the supplied ticker range before recovering toward 0.024. Such a swing can produce slippage, liquidation cascades, and false breakouts. The scanner’s narrow levels are reference points, not guarantees that the market will respect them.
The second risk is supply visibility. With less than half of the maximum supply circulating and the market capitalization well below FDV, future supply changes could become a source of pressure. Because the research does not provide an unlock schedule or holder-concentration data, that risk remains unresolved rather than precisely measurable.
The third risk concerns verification. The project describes sophisticated infrastructure, but the supplied data does not verify adoption, code quality, independent audits, smart-contract risk, governance decentralization, or the financial condition of an operating entity. Different sources also report slightly different prices, which is expected across timestamps and venues, but the exact market and instrument still matter when interpreting the chart.
The immediate technical question is whether QUSDT can reclaim and hold the 0.024253 to 0.024382 area or whether rallies continue to fail below it. A move toward 0.0239606, 0.0238213, and 0.0236821 would keep the scanner’s downside structure active. A sustained recovery above the invalidation area would challenge that view.
The balanced conclusion is that QUSDT combines a timely AI-agent narrative with an aggressive short-term chart. Quack AI is positioned around agent payments, policy controls, and governance, but important adoption and tokenomics details remain unavailable. Technically, the scanner sees a high-confidence pullback setup after a sharp breakdown, while the longer performance record shows that Q has also delivered substantial gains over broader periods. The next meaningful signal will come from the battle around 0.02425, the behavior of derivatives positioning, and evidence that the project’s stated utility is becoming measurable rather than remaining only a market narrative.
516
·
--
පරිවර්තනය බලන්න
Wait wait wait… 🔥 $VTHO is ready to move DOWN!
Entry: 0.000665433 - 0.000666098
SL: 0.000667762
TP1: 0.000661186 | TP2: 0.000659062 | TP3: 0.000656939
Wait wait wait… 🔥 $VTHO is ready to move DOWN!
Entry: 0.000665433 - 0.000666098
SL: 0.000667762
TP1: 0.000661186 | TP2: 0.000659062 | TP3: 0.000656939
Entry: 0.000665433 - 0.000666098
SL: 0.000667762
TP1: 0.000661186 | TP2: 0.000659062 | TP3: 0.000656939
714
·
--
පරිවර්තනය බලන්න
Wait wait wait… 🚨 $PARTI UP!
Entry: 0.024274 - 0.024298
SL: 0.024116
TP1: 0.024648 | TP2: 0.024823 | TP3: 0.024998
Wait wait wait… 🚨 $PARTI UP!
Entry: 0.024274 - 0.024298
SL: 0.024116
TP1: 0.024648 | TP2: 0.024823 | TP3: 0.024998
Entry: 0.024274 - 0.024298
SL: 0.024116
TP1: 0.024648 | TP2: 0.024823 | TP3: 0.024998
737
·
--
පරිවර්තනය බලන්න
Wait… $UAI is getting serious! ⚡ DOWN!
Entry: 0.58449 - 0.58508
SL: 0.58703
TP1: 0.5794 | TP2: 0.57685 | TP3: 0.57431
Wait… $UAI is getting serious! ⚡ DOWN!
Entry: 0.58449 - 0.58508
SL: 0.58703
TP1: 0.5794 | TP2: 0.57685 | TP3: 0.57431
Entry: 0.58449 - 0.58508
SL: 0.58703
TP1: 0.5794 | TP2: 0.57685 | TP3: 0.57431
2
779
·
--
පරිවර්තනය බලන්න
NEAR Protocol Tests Its Rally as Short-Term Momentum Fades𝗧𝗵𝗲 𝗿𝗮𝗹𝗹𝘆 𝗵𝗮𝘀 𝗰𝗵𝗮𝗻𝗴𝗲𝗱 𝗰𝗵𝗮𝗿𝗮𝗰𝘁𝗲𝗿
NEAR Protocol is facing a meaningful short-term test after a strong advance. The project remains associated with artificial intelligence, chain abstraction, cross-chain activity, and scalable decentralized applications. At the same time, its market structure has weakened sharply from the recent highs, and the RR Trader scanner has identified NEARUSDT as a short-direction setup.
The contrast is clear in the supplied data. NEAR is up 44.25% over 30 days and 27.42% over 14 days, but it is down about 6% over the latest 24-hour period. That combination describes an asset that has gained substantial momentum but is now experiencing a sharp reversal. The longer-term narrative remains active, yet short-term traders are reassessing whether the latest rally can hold.
𝗪𝗵𝗮𝘁 𝗡𝗘𝗔𝗥 𝗣𝗿𝗼𝘁𝗼𝗰𝗼𝗹 𝗶𝘀 𝗱𝗲𝘀𝗶𝗴𝗻𝗲𝗱 𝘁𝗼 𝗱𝗼
The supplied project description presents NEAR Protocol as a high-performance, AI-native blockchain for decentralized applications and intelligent agents. Its stated purpose is to provide infrastructure that allows AI systems to transact, operate, and interact across Web2 and Web3.
The project highlights three related ideas. User-owned AI is intended to keep agents aligned with users’ interests. Intents and chain abstraction are designed to reduce the technical complexity of interacting with multiple blockchains, allowing users and applications to express goals without managing every network step manually. NEAR also uses sharded blockchain architecture, which is intended to support scalable and lower-cost execution.
These descriptions explain the project’s direction, but they do not establish that every proposed use case has reached broad adoption. The research does not provide independent figures for active users, application retention, agent usage, transaction revenue, or the amount of network activity generated by AI services. That distinction matters: a compelling infrastructure thesis still needs measurable and sustained usage to support a durable market valuation.
𝗨𝘁𝗶𝗹𝗶𝘁𝘆 𝗮𝗻𝗱 𝗲𝗰𝗼𝘀𝘆𝘀𝘁𝗲𝗺 𝗰𝗼𝗻𝘁𝗲𝘅𝘁
The research categorizes NEAR as a smart contract platform, Layer 1 network, proof-of-stake project, data-availability platform, chain-abstraction ecosystem, and artificial-intelligence-related project. These classifications reflect a broad technology focus rather than a network built around a single application.
NEAR’s ecosystem direction includes cross-chain interactions and AI services. The supplied news feed contains reports that NEAR AI launched an OpenAI-compatible cloud API and that Intel and NVIDIA technology was involved in a new NEAR Protocol AI cloud offering. Those reports connect the project’s AI positioning with software and infrastructure initiatives, giving the market additional themes to evaluate.
However, the available research does not quantify the number of users for those products, the revenue they generate, or the amount of token demand they create. It also does not show how much activity on the network comes directly from AI services. The developments may increase visibility, but their long-term economic effect remains unconfirmed in the supplied data.
The research also identifies official development repositories and blockchain explorers associated with the project. Market data places NEAR among established large-cap crypto assets rather than a newly launched micro-cap token. That provides useful context, but it does not by itself demonstrate that the current valuation is supported by growing fundamentals.
𝗧𝗼𝗸𝗲𝗻𝗼𝗺𝗶𝗰𝘀 𝗮𝗻𝗱 𝗺𝗮𝗿𝗸𝗲𝘁 𝘀𝗶𝘇𝗲
The latest supplied data lists circulating supply at approximately 1.306 billion NEAR and total supply at approximately 1.306 billion. No maximum supply is listed, and the dataset marks maximum supply as infinite or unavailable. The reported market-cap-to-fully-diluted-valuation ratio is effectively 1, so the figures do not show a separate large gap between market capitalization and fully diluted valuation in this snapshot.
At a price near $2.36, the reported market capitalization is approximately $3.08 billion, with NEAR ranked 33 by market capitalization in the supplied data. CoinGecko reports total 24-hour volume of approximately $326.85 million, while the Binance NEARUSDT ticker shows quote volume of about $213.19 million. These are separate figures from different data coverage and measurement windows and should not be added together.
The supplied all-time high is $20.44, recorded in January 2022. At approximately $2.36, NEAR remains about 88.5% below that peak. The token is up 140.55% over 200 days but down 15.19% over one year. Those figures show a substantial recovery from longer-term lows without indicating that the previous cycle high has been recovered.
𝗧𝗵𝗲 𝗰𝘂𝗿𝗿𝗲𝗻𝘁 𝗽𝗿𝗶𝗰𝗲 𝘀𝘁𝗿𝘂𝗰𝘁𝘂𝗿𝗲
The scanner records NEARUSDT at $2.382. The Binance ticker and CoinGecko snapshot place the latest price near $2.36. The feeds are not identical, but they agree that NEAR is trading in the low-$2.30s after a volatile session.
The Binance ticker reports an open price of $2.509, a high of $2.533, a low of $2.326, and a last price of $2.360, representing a 5.939% decline over its supplied 24-hour window. CoinGecko reports a similar 6.01% decline, with a 24-hour high of $2.53 and low of $2.33. CoinGecko also reports a market-cap decline of approximately $194.36 million over that period.
The four-hour candles show a rapid change in structure. NEAR reached $2.727 during a high-volume four-hour period and then closed at $2.505. Later candles moved through lows and closes around $2.478, $2.396, and $2.349 before trading in the $2.35 to $2.42 area. The data shows a sharp rejection from the higher intraday range, although it does not by itself establish a complete trend reversal.
Volume was particularly heavy during the move toward $2.727. The relevant four-hour candle recorded approximately $192.75 million in quote volume. High activity accompanied the rally, but the subsequent decline shows that heavy participation did not immediately establish lasting support. The scanner records a negative 15-minute move of 0.667% and a volume ratio of 0.935, indicating short-term weakness without an extreme volume expansion at the exact scan point.
𝗪𝗵𝘆 𝘁𝗵𝗲 𝘀𝗰𝗮𝗻𝗻𝗲𝗿 𝗶𝘀 𝗳𝗹𝗮𝗴𝗴𝗶𝗻𝗴 𝗡𝗘𝗔𝗥𝗨𝗦𝗗𝗧
The RR Trader scanner selected NEARUSDT in the short direction with a confidence score of 100. Its recorded entry zone is between $2.383191 and $2.385573. The scanner places nearby resistance at $2.387343 and support at $2.356015. It lists an invalidation or stop reference at $2.400193, with downside objectives at $2.350444, $2.334070, and $2.317697. The reported risk-reward value is 2.2399.
The setup is focused on a possible failed bounce into the low-$2.38s after the larger decline. Price is close to the proposed entry area and below the scanner’s resistance reference. If the market continues to reject that zone, the chart could revisit nearby support levels.
The confidence score describes the scanner’s internal conditions; it does not represent a 100% probability of success. The setup is also relatively tight. A move above $2.400193 would invalidate the stated short structure, while sustained acceptance above $2.387343 and $2.40 would weaken the immediate bearish interpretation.
𝗕𝗶𝘁𝗰𝗼𝗶𝗻 𝗮𝗻𝗱 𝘁𝗵𝗲 𝗯𝗿𝗼𝗮𝗱𝗲𝗿 𝗺𝗮𝗿𝗸𝗲𝘁
Bitcoin is not confirming a broad panic move in the supplied ticker data. BTCUSDT is shown near $77,132.60, up 0.062% over its tracked period, with a high of $77,495.30 and low of $76,942.70. That is considerably more stable than NEAR’s roughly 6% decline.
NEAR’s underperformance while Bitcoin remains broadly flat to slightly positive is an important part of the current picture. The immediate pressure is not simply a direct Bitcoin selloff in the supplied data. It may reflect profit-taking after NEAR’s advance, rotation away from high-beta altcoins, or leveraged-position pressure, although the research does not establish one definitive cause.
The news feed also describes a market influenced by inflation data, Federal Reserve expectations, Bitcoin ETF flow concerns, and episodes of heavy liquidation. Those reports confirm that macro headlines remain capable of affecting crypto prices quickly, but they do not prove that any single headline caused NEAR’s decline.
𝗥𝗲𝗰𝗲𝗻𝘁 𝗰𝗮𝘁𝗮𝗹𝘆𝘀𝘁𝘀 𝗮𝗻𝗱 𝗿𝗲𝗺𝗮𝗶𝗻𝗶𝗻𝗴 𝗾𝘂𝗲𝘀𝘁𝗶𝗼𝗻𝘀
Several reports in the supplied news feed describe constructive developments around NEAR. One report said the token had risen 58% in a week while Bitcoin and major assets were relatively stable. Another attributed a 6% advance to $10.1 million in institutional inflows. Other coverage connected NEAR’s volatility with the AI narrative and altcoin rotation.
The same feed reports the launch of an OpenAI-compatible NEAR AI cloud API and a new AI cloud offering involving Intel and NVIDIA technology. These developments may support the project’s visibility and reinforce its AI-related positioning. They do not, however, provide independently verified user numbers, revenue, token purchases, or evidence of sustained on-chain demand.
The institutional-inflow figure comes from a news report rather than a full audited flow statement in the supplied research. It is therefore best treated as reported market context rather than conclusive proof of continuing institutional demand.
The reversal also raises a broader question about the recent rally. When an asset rises strongly over several weeks and then loses approximately 6% in a day, the market may reassess whether the move reflected durable accumulation or a crowded narrative trade. Continued product development and measurable usage could support renewed interest. A lack of follow-through could leave the earlier surge vulnerable to further cooling.
𝗟𝗲𝘃𝗲𝗹𝘀 𝘁𝗵𝗮𝘁 𝗺𝗮𝘁𝘁𝗲𝗿 𝗻𝗲𝘅𝘁
The first reference area is the scanner’s resistance near $2.387343, together with the proposed entry band between $2.383191 and $2.385573. Repeated rejection below this zone would be consistent with the scanner’s failed-bounce interpretation.
The scanner’s invalidation reference is $2.400193. A move above that level would challenge the immediate bearish setup, although it would not automatically establish a complete bullish reversal. A stronger recovery would need to hold above the recent four-hour high area near $2.42 and then address the $2.48 to $2.53 region where the latest decline developed.
On the downside, the scanner identifies support near $2.356015 and objectives at $2.350444, $2.334070, and $2.317697. The recent market low near $2.326 makes the $2.32 to $2.35 region especially important. Sustained trading below that area would indicate weaker support, while a sharp rebound would show that demand remains present.
These are reference points from the scanner and supplied candles, not certain outcomes. NEAR has demonstrated that it can move several percentage points quickly, so sustained closes and volume behavior may provide more information than isolated intraday wicks.
𝗕𝗮𝗹𝗮𝗻𝗰𝗲𝗱 𝗰𝗼𝗻𝗰𝗹𝘂𝘀𝗶𝗼𝗻
NEAR Protocol has an ambitious infrastructure story built around sharding, proof-of-stake technology, chain abstraction, cross-chain intents, and AI-native applications. Recent AI cloud and API reports have added fresh attention, while the token’s 14-day, 30-day, and 200-day performance shows that the market has already rewarded part of that narrative.
The short-term chart, however, is no longer clean. NEAR has fallen about 6% over 24 hours after reaching $2.53 on the ticker and $2.727 in the supplied four-hour data. Bitcoin has been comparatively steady, making NEAR’s relative weakness notable. The scanner’s bearish setup is supported by the sharp rejection, nearby resistance, and the possibility of a failed bounce.
That setup would weaken if NEAR reclaims the $2.387 to $2.40 area with sustained activity. A decline through the $2.35 region would expose the lower scanner objectives near $2.334 and $2.318. Beyond the next few candles, the larger question is whether NEAR can turn its AI and chain-abstraction positioning into measurable usage. For now, the project combines substantial market attention and technology ambitions with a chart that is testing whether its latest rally can become durable or needs further consolidation.
NEAR Protocol Tests Its Rally as Short-Term Momentum Fades
𝗧𝗵𝗲 𝗿𝗮𝗹𝗹𝘆 𝗵𝗮𝘀 𝗰𝗵𝗮𝗻𝗴𝗲𝗱 𝗰𝗵𝗮𝗿𝗮𝗰𝘁𝗲𝗿
NEAR Protocol is facing a meaningful short-term test after a strong advance. The project remains associated with artificial intelligence, chain abstraction, cross-chain activity, and scalable decentralized applications. At the same time, its market structure has weakened sharply from the recent highs, and the RR Trader scanner has identified NEARUSDT as a short-direction setup.
The contrast is clear in the supplied data. NEAR is up 44.25% over 30 days and 27.42% over 14 days, but it is down about 6% over the latest 24-hour period. That combination describes an asset that has gained substantial momentum but is now experiencing a sharp reversal. The longer-term narrative remains active, yet short-term traders are reassessing whether the latest rally can hold.
𝗪𝗵𝗮𝘁 𝗡𝗘𝗔𝗥 𝗣𝗿𝗼𝘁𝗼𝗰𝗼𝗹 𝗶𝘀 𝗱𝗲𝘀𝗶𝗴𝗻𝗲𝗱 𝘁𝗼 𝗱𝗼
The supplied project description presents NEAR Protocol as a high-performance, AI-native blockchain for decentralized applications and intelligent agents. Its stated purpose is to provide infrastructure that allows AI systems to transact, operate, and interact across Web2 and Web3.
The project highlights three related ideas. User-owned AI is intended to keep agents aligned with users’ interests. Intents and chain abstraction are designed to reduce the technical complexity of interacting with multiple blockchains, allowing users and applications to express goals without managing every network step manually. NEAR also uses sharded blockchain architecture, which is intended to support scalable and lower-cost execution.
These descriptions explain the project’s direction, but they do not establish that every proposed use case has reached broad adoption. The research does not provide independent figures for active users, application retention, agent usage, transaction revenue, or the amount of network activity generated by AI services. That distinction matters: a compelling infrastructure thesis still needs measurable and sustained usage to support a durable market valuation.
𝗨𝘁𝗶𝗹𝗶𝘁𝘆 𝗮𝗻𝗱 𝗲𝗰𝗼𝘀𝘆𝘀𝘁𝗲𝗺 𝗰𝗼𝗻𝘁𝗲𝘅𝘁
The research categorizes NEAR as a smart contract platform, Layer 1 network, proof-of-stake project, data-availability platform, chain-abstraction ecosystem, and artificial-intelligence-related project. These classifications reflect a broad technology focus rather than a network built around a single application.
NEAR’s ecosystem direction includes cross-chain interactions and AI services. The supplied news feed contains reports that NEAR AI launched an OpenAI-compatible cloud API and that Intel and NVIDIA technology was involved in a new NEAR Protocol AI cloud offering. Those reports connect the project’s AI positioning with software and infrastructure initiatives, giving the market additional themes to evaluate.
However, the available research does not quantify the number of users for those products, the revenue they generate, or the amount of token demand they create. It also does not show how much activity on the network comes directly from AI services. The developments may increase visibility, but their long-term economic effect remains unconfirmed in the supplied data.
The research also identifies official development repositories and blockchain explorers associated with the project. Market data places NEAR among established large-cap crypto assets rather than a newly launched micro-cap token. That provides useful context, but it does not by itself demonstrate that the current valuation is supported by growing fundamentals.
𝗧𝗼𝗸𝗲𝗻𝗼𝗺𝗶𝗰𝘀 𝗮𝗻𝗱 𝗺𝗮𝗿𝗸𝗲𝘁 𝘀𝗶𝘇𝗲
The latest supplied data lists circulating supply at approximately 1.306 billion NEAR and total supply at approximately 1.306 billion. No maximum supply is listed, and the dataset marks maximum supply as infinite or unavailable. The reported market-cap-to-fully-diluted-valuation ratio is effectively 1, so the figures do not show a separate large gap between market capitalization and fully diluted valuation in this snapshot.
At a price near $2.36, the reported market capitalization is approximately $3.08 billion, with NEAR ranked 33 by market capitalization in the supplied data. CoinGecko reports total 24-hour volume of approximately $326.85 million, while the Binance NEARUSDT ticker shows quote volume of about $213.19 million. These are separate figures from different data coverage and measurement windows and should not be added together.
The supplied all-time high is $20.44, recorded in January 2022. At approximately $2.36, NEAR remains about 88.5% below that peak. The token is up 140.55% over 200 days but down 15.19% over one year. Those figures show a substantial recovery from longer-term lows without indicating that the previous cycle high has been recovered.
𝗧𝗵𝗲 𝗰𝘂𝗿𝗿𝗲𝗻𝘁 𝗽𝗿𝗶𝗰𝗲 𝘀𝘁𝗿𝘂𝗰𝘁𝘂𝗿𝗲
The scanner records NEARUSDT at $2.382. The Binance ticker and CoinGecko snapshot place the latest price near $2.36. The feeds are not identical, but they agree that NEAR is trading in the low-$2.30s after a volatile session.
The Binance ticker reports an open price of $2.509, a high of $2.533, a low of $2.326, and a last price of $2.360, representing a 5.939% decline over its supplied 24-hour window. CoinGecko reports a similar 6.01% decline, with a 24-hour high of $2.53 and low of $2.33. CoinGecko also reports a market-cap decline of approximately $194.36 million over that period.
The four-hour candles show a rapid change in structure. NEAR reached $2.727 during a high-volume four-hour period and then closed at $2.505. Later candles moved through lows and closes around $2.478, $2.396, and $2.349 before trading in the $2.35 to $2.42 area. The data shows a sharp rejection from the higher intraday range, although it does not by itself establish a complete trend reversal.
Volume was particularly heavy during the move toward $2.727. The relevant four-hour candle recorded approximately $192.75 million in quote volume. High activity accompanied the rally, but the subsequent decline shows that heavy participation did not immediately establish lasting support. The scanner records a negative 15-minute move of 0.667% and a volume ratio of 0.935, indicating short-term weakness without an extreme volume expansion at the exact scan point.
𝗪𝗵𝘆 𝘁𝗵𝗲 𝘀𝗰𝗮𝗻𝗻𝗲𝗿 𝗶𝘀 𝗳𝗹𝗮𝗴𝗴𝗶𝗻𝗴 𝗡𝗘𝗔𝗥𝗨𝗦𝗗𝗧
The RR Trader scanner selected NEARUSDT in the short direction with a confidence score of 100. Its recorded entry zone is between $2.383191 and $2.385573. The scanner places nearby resistance at $2.387343 and support at $2.356015. It lists an invalidation or stop reference at $2.400193, with downside objectives at $2.350444, $2.334070, and $2.317697. The reported risk-reward value is 2.2399.
The setup is focused on a possible failed bounce into the low-$2.38s after the larger decline. Price is close to the proposed entry area and below the scanner’s resistance reference. If the market continues to reject that zone, the chart could revisit nearby support levels.
The confidence score describes the scanner’s internal conditions; it does not represent a 100% probability of success. The setup is also relatively tight. A move above $2.400193 would invalidate the stated short structure, while sustained acceptance above $2.387343 and $2.40 would weaken the immediate bearish interpretation.
𝗕𝗶𝘁𝗰𝗼𝗶𝗻 𝗮𝗻𝗱 𝘁𝗵𝗲 𝗯𝗿𝗼𝗮𝗱𝗲𝗿 𝗺𝗮𝗿𝗸𝗲𝘁
Bitcoin is not confirming a broad panic move in the supplied ticker data. BTCUSDT is shown near $77,132.60, up 0.062% over its tracked period, with a high of $77,495.30 and low of $76,942.70. That is considerably more stable than NEAR’s roughly 6% decline.
NEAR’s underperformance while Bitcoin remains broadly flat to slightly positive is an important part of the current picture. The immediate pressure is not simply a direct Bitcoin selloff in the supplied data. It may reflect profit-taking after NEAR’s advance, rotation away from high-beta altcoins, or leveraged-position pressure, although the research does not establish one definitive cause.
The news feed also describes a market influenced by inflation data, Federal Reserve expectations, Bitcoin ETF flow concerns, and episodes of heavy liquidation. Those reports confirm that macro headlines remain capable of affecting crypto prices quickly, but they do not prove that any single headline caused NEAR’s decline.
𝗥𝗲𝗰𝗲𝗻𝘁 𝗰𝗮𝘁𝗮𝗹𝘆𝘀𝘁𝘀 𝗮𝗻𝗱 𝗿𝗲𝗺𝗮𝗶𝗻𝗶𝗻𝗴 𝗾𝘂𝗲𝘀𝘁𝗶𝗼𝗻𝘀
Several reports in the supplied news feed describe constructive developments around NEAR. One report said the token had risen 58% in a week while Bitcoin and major assets were relatively stable. Another attributed a 6% advance to $10.1 million in institutional inflows. Other coverage connected NEAR’s volatility with the AI narrative and altcoin rotation.
The same feed reports the launch of an OpenAI-compatible NEAR AI cloud API and a new AI cloud offering involving Intel and NVIDIA technology. These developments may support the project’s visibility and reinforce its AI-related positioning. They do not, however, provide independently verified user numbers, revenue, token purchases, or evidence of sustained on-chain demand.
The institutional-inflow figure comes from a news report rather than a full audited flow statement in the supplied research. It is therefore best treated as reported market context rather than conclusive proof of continuing institutional demand.
The reversal also raises a broader question about the recent rally. When an asset rises strongly over several weeks and then loses approximately 6% in a day, the market may reassess whether the move reflected durable accumulation or a crowded narrative trade. Continued product development and measurable usage could support renewed interest. A lack of follow-through could leave the earlier surge vulnerable to further cooling.
𝗟𝗲𝘃𝗲𝗹𝘀 𝘁𝗵𝗮𝘁 𝗺𝗮𝘁𝘁𝗲𝗿 𝗻𝗲𝘅𝘁
The first reference area is the scanner’s resistance near $2.387343, together with the proposed entry band between $2.383191 and $2.385573. Repeated rejection below this zone would be consistent with the scanner’s failed-bounce interpretation.
The scanner’s invalidation reference is $2.400193. A move above that level would challenge the immediate bearish setup, although it would not automatically establish a complete bullish reversal. A stronger recovery would need to hold above the recent four-hour high area near $2.42 and then address the $2.48 to $2.53 region where the latest decline developed.
On the downside, the scanner identifies support near $2.356015 and objectives at $2.350444, $2.334070, and $2.317697. The recent market low near $2.326 makes the $2.32 to $2.35 region especially important. Sustained trading below that area would indicate weaker support, while a sharp rebound would show that demand remains present.
These are reference points from the scanner and supplied candles, not certain outcomes. NEAR has demonstrated that it can move several percentage points quickly, so sustained closes and volume behavior may provide more information than isolated intraday wicks.
𝗕𝗮𝗹𝗮𝗻𝗰𝗲𝗱 𝗰𝗼𝗻𝗰𝗹𝘂𝘀𝗶𝗼𝗻
NEAR Protocol has an ambitious infrastructure story built around sharding, proof-of-stake technology, chain abstraction, cross-chain intents, and AI-native applications. Recent AI cloud and API reports have added fresh attention, while the token’s 14-day, 30-day, and 200-day performance shows that the market has already rewarded part of that narrative.
The short-term chart, however, is no longer clean. NEAR has fallen about 6% over 24 hours after reaching $2.53 on the ticker and $2.727 in the supplied four-hour data. Bitcoin has been comparatively steady, making NEAR’s relative weakness notable. The scanner’s bearish setup is supported by the sharp rejection, nearby resistance, and the possibility of a failed bounce.
That setup would weaken if NEAR reclaims the $2.387 to $2.40 area with sustained activity. A decline through the $2.35 region would expose the lower scanner objectives near $2.334 and $2.318. Beyond the next few candles, the larger question is whether NEAR can turn its AI and chain-abstraction positioning into measurable usage. For now, the project combines substantial market attention and technology ambitions with a chart that is testing whether its latest rally can become durable or needs further consolidation.
NEAR Protocol is facing a meaningful short-term test after a strong advance. The project remains associated with artificial intelligence, chain abstraction, cross-chain activity, and scalable decentralized applications. At the same time, its market structure has weakened sharply from the recent highs, and the RR Trader scanner has identified NEARUSDT as a short-direction setup.
The contrast is clear in the supplied data. NEAR is up 44.25% over 30 days and 27.42% over 14 days, but it is down about 6% over the latest 24-hour period. That combination describes an asset that has gained substantial momentum but is now experiencing a sharp reversal. The longer-term narrative remains active, yet short-term traders are reassessing whether the latest rally can hold.
𝗪𝗵𝗮𝘁 𝗡𝗘𝗔𝗥 𝗣𝗿𝗼𝘁𝗼𝗰𝗼𝗹 𝗶𝘀 𝗱𝗲𝘀𝗶𝗴𝗻𝗲𝗱 𝘁𝗼 𝗱𝗼
The supplied project description presents NEAR Protocol as a high-performance, AI-native blockchain for decentralized applications and intelligent agents. Its stated purpose is to provide infrastructure that allows AI systems to transact, operate, and interact across Web2 and Web3.
The project highlights three related ideas. User-owned AI is intended to keep agents aligned with users’ interests. Intents and chain abstraction are designed to reduce the technical complexity of interacting with multiple blockchains, allowing users and applications to express goals without managing every network step manually. NEAR also uses sharded blockchain architecture, which is intended to support scalable and lower-cost execution.
These descriptions explain the project’s direction, but they do not establish that every proposed use case has reached broad adoption. The research does not provide independent figures for active users, application retention, agent usage, transaction revenue, or the amount of network activity generated by AI services. That distinction matters: a compelling infrastructure thesis still needs measurable and sustained usage to support a durable market valuation.
𝗨𝘁𝗶𝗹𝗶𝘁𝘆 𝗮𝗻𝗱 𝗲𝗰𝗼𝘀𝘆𝘀𝘁𝗲𝗺 𝗰𝗼𝗻𝘁𝗲𝘅𝘁
The research categorizes NEAR as a smart contract platform, Layer 1 network, proof-of-stake project, data-availability platform, chain-abstraction ecosystem, and artificial-intelligence-related project. These classifications reflect a broad technology focus rather than a network built around a single application.
NEAR’s ecosystem direction includes cross-chain interactions and AI services. The supplied news feed contains reports that NEAR AI launched an OpenAI-compatible cloud API and that Intel and NVIDIA technology was involved in a new NEAR Protocol AI cloud offering. Those reports connect the project’s AI positioning with software and infrastructure initiatives, giving the market additional themes to evaluate.
However, the available research does not quantify the number of users for those products, the revenue they generate, or the amount of token demand they create. It also does not show how much activity on the network comes directly from AI services. The developments may increase visibility, but their long-term economic effect remains unconfirmed in the supplied data.
The research also identifies official development repositories and blockchain explorers associated with the project. Market data places NEAR among established large-cap crypto assets rather than a newly launched micro-cap token. That provides useful context, but it does not by itself demonstrate that the current valuation is supported by growing fundamentals.
𝗧𝗼𝗸𝗲𝗻𝗼𝗺𝗶𝗰𝘀 𝗮𝗻𝗱 𝗺𝗮𝗿𝗸𝗲𝘁 𝘀𝗶𝘇𝗲
The latest supplied data lists circulating supply at approximately 1.306 billion NEAR and total supply at approximately 1.306 billion. No maximum supply is listed, and the dataset marks maximum supply as infinite or unavailable. The reported market-cap-to-fully-diluted-valuation ratio is effectively 1, so the figures do not show a separate large gap between market capitalization and fully diluted valuation in this snapshot.
At a price near $2.36, the reported market capitalization is approximately $3.08 billion, with NEAR ranked 33 by market capitalization in the supplied data. CoinGecko reports total 24-hour volume of approximately $326.85 million, while the Binance NEARUSDT ticker shows quote volume of about $213.19 million. These are separate figures from different data coverage and measurement windows and should not be added together.
The supplied all-time high is $20.44, recorded in January 2022. At approximately $2.36, NEAR remains about 88.5% below that peak. The token is up 140.55% over 200 days but down 15.19% over one year. Those figures show a substantial recovery from longer-term lows without indicating that the previous cycle high has been recovered.
𝗧𝗵𝗲 𝗰𝘂𝗿𝗿𝗲𝗻𝘁 𝗽𝗿𝗶𝗰𝗲 𝘀𝘁𝗿𝘂𝗰𝘁𝘂𝗿𝗲
The scanner records NEARUSDT at $2.382. The Binance ticker and CoinGecko snapshot place the latest price near $2.36. The feeds are not identical, but they agree that NEAR is trading in the low-$2.30s after a volatile session.
The Binance ticker reports an open price of $2.509, a high of $2.533, a low of $2.326, and a last price of $2.360, representing a 5.939% decline over its supplied 24-hour window. CoinGecko reports a similar 6.01% decline, with a 24-hour high of $2.53 and low of $2.33. CoinGecko also reports a market-cap decline of approximately $194.36 million over that period.
The four-hour candles show a rapid change in structure. NEAR reached $2.727 during a high-volume four-hour period and then closed at $2.505. Later candles moved through lows and closes around $2.478, $2.396, and $2.349 before trading in the $2.35 to $2.42 area. The data shows a sharp rejection from the higher intraday range, although it does not by itself establish a complete trend reversal.
Volume was particularly heavy during the move toward $2.727. The relevant four-hour candle recorded approximately $192.75 million in quote volume. High activity accompanied the rally, but the subsequent decline shows that heavy participation did not immediately establish lasting support. The scanner records a negative 15-minute move of 0.667% and a volume ratio of 0.935, indicating short-term weakness without an extreme volume expansion at the exact scan point.
𝗪𝗵𝘆 𝘁𝗵𝗲 𝘀𝗰𝗮𝗻𝗻𝗲𝗿 𝗶𝘀 𝗳𝗹𝗮𝗴𝗴𝗶𝗻𝗴 𝗡𝗘𝗔𝗥𝗨𝗦𝗗𝗧
The RR Trader scanner selected NEARUSDT in the short direction with a confidence score of 100. Its recorded entry zone is between $2.383191 and $2.385573. The scanner places nearby resistance at $2.387343 and support at $2.356015. It lists an invalidation or stop reference at $2.400193, with downside objectives at $2.350444, $2.334070, and $2.317697. The reported risk-reward value is 2.2399.
The setup is focused on a possible failed bounce into the low-$2.38s after the larger decline. Price is close to the proposed entry area and below the scanner’s resistance reference. If the market continues to reject that zone, the chart could revisit nearby support levels.
The confidence score describes the scanner’s internal conditions; it does not represent a 100% probability of success. The setup is also relatively tight. A move above $2.400193 would invalidate the stated short structure, while sustained acceptance above $2.387343 and $2.40 would weaken the immediate bearish interpretation.
𝗕𝗶𝘁𝗰𝗼𝗶𝗻 𝗮𝗻𝗱 𝘁𝗵𝗲 𝗯𝗿𝗼𝗮𝗱𝗲𝗿 𝗺𝗮𝗿𝗸𝗲𝘁
Bitcoin is not confirming a broad panic move in the supplied ticker data. BTCUSDT is shown near $77,132.60, up 0.062% over its tracked period, with a high of $77,495.30 and low of $76,942.70. That is considerably more stable than NEAR’s roughly 6% decline.
NEAR’s underperformance while Bitcoin remains broadly flat to slightly positive is an important part of the current picture. The immediate pressure is not simply a direct Bitcoin selloff in the supplied data. It may reflect profit-taking after NEAR’s advance, rotation away from high-beta altcoins, or leveraged-position pressure, although the research does not establish one definitive cause.
The news feed also describes a market influenced by inflation data, Federal Reserve expectations, Bitcoin ETF flow concerns, and episodes of heavy liquidation. Those reports confirm that macro headlines remain capable of affecting crypto prices quickly, but they do not prove that any single headline caused NEAR’s decline.
𝗥𝗲𝗰𝗲𝗻𝘁 𝗰𝗮𝘁𝗮𝗹𝘆𝘀𝘁𝘀 𝗮𝗻𝗱 𝗿𝗲𝗺𝗮𝗶𝗻𝗶𝗻𝗴 𝗾𝘂𝗲𝘀𝘁𝗶𝗼𝗻𝘀
Several reports in the supplied news feed describe constructive developments around NEAR. One report said the token had risen 58% in a week while Bitcoin and major assets were relatively stable. Another attributed a 6% advance to $10.1 million in institutional inflows. Other coverage connected NEAR’s volatility with the AI narrative and altcoin rotation.
The same feed reports the launch of an OpenAI-compatible NEAR AI cloud API and a new AI cloud offering involving Intel and NVIDIA technology. These developments may support the project’s visibility and reinforce its AI-related positioning. They do not, however, provide independently verified user numbers, revenue, token purchases, or evidence of sustained on-chain demand.
The institutional-inflow figure comes from a news report rather than a full audited flow statement in the supplied research. It is therefore best treated as reported market context rather than conclusive proof of continuing institutional demand.
The reversal also raises a broader question about the recent rally. When an asset rises strongly over several weeks and then loses approximately 6% in a day, the market may reassess whether the move reflected durable accumulation or a crowded narrative trade. Continued product development and measurable usage could support renewed interest. A lack of follow-through could leave the earlier surge vulnerable to further cooling.
𝗟𝗲𝘃𝗲𝗹𝘀 𝘁𝗵𝗮𝘁 𝗺𝗮𝘁𝘁𝗲𝗿 𝗻𝗲𝘅𝘁
The first reference area is the scanner’s resistance near $2.387343, together with the proposed entry band between $2.383191 and $2.385573. Repeated rejection below this zone would be consistent with the scanner’s failed-bounce interpretation.
The scanner’s invalidation reference is $2.400193. A move above that level would challenge the immediate bearish setup, although it would not automatically establish a complete bullish reversal. A stronger recovery would need to hold above the recent four-hour high area near $2.42 and then address the $2.48 to $2.53 region where the latest decline developed.
On the downside, the scanner identifies support near $2.356015 and objectives at $2.350444, $2.334070, and $2.317697. The recent market low near $2.326 makes the $2.32 to $2.35 region especially important. Sustained trading below that area would indicate weaker support, while a sharp rebound would show that demand remains present.
These are reference points from the scanner and supplied candles, not certain outcomes. NEAR has demonstrated that it can move several percentage points quickly, so sustained closes and volume behavior may provide more information than isolated intraday wicks.
𝗕𝗮𝗹𝗮𝗻𝗰𝗲𝗱 𝗰𝗼𝗻𝗰𝗹𝘂𝘀𝗶𝗼𝗻
NEAR Protocol has an ambitious infrastructure story built around sharding, proof-of-stake technology, chain abstraction, cross-chain intents, and AI-native applications. Recent AI cloud and API reports have added fresh attention, while the token’s 14-day, 30-day, and 200-day performance shows that the market has already rewarded part of that narrative.
The short-term chart, however, is no longer clean. NEAR has fallen about 6% over 24 hours after reaching $2.53 on the ticker and $2.727 in the supplied four-hour data. Bitcoin has been comparatively steady, making NEAR’s relative weakness notable. The scanner’s bearish setup is supported by the sharp rejection, nearby resistance, and the possibility of a failed bounce.
That setup would weaken if NEAR reclaims the $2.387 to $2.40 area with sustained activity. A decline through the $2.35 region would expose the lower scanner objectives near $2.334 and $2.318. Beyond the next few candles, the larger question is whether NEAR can turn its AI and chain-abstraction positioning into measurable usage. For now, the project combines substantial market attention and technology ambitions with a chart that is testing whether its latest rally can become durable or needs further consolidation.
201
තවත් අන්තර්ගතයන් ගවේෂණය කිරීමට ඇතුල් වන්න
Binance චතුරශ්රය හි ගෝලීය ක්රිප්ටෝ පරිශීලකයින් හා එක්වන්න
⚡️ ක්රිප්ටෝ පිළිබඳ නවතම සහ ප්රයෝජනවත් තොරතුරු ලබා ගන්න.
💬 ලොව විශාලතම ක්රිප්ටෝ හුවමාරුව මගින් විශ්වාස කෙරේ.
👍 සත්යායනය කරන ලද නිර්මාණකරුවන්ගෙන් සැබෑ විදසුන් සොයා ගන්න.
විද්යුත් තැපෑල / දුරකථන අංකය
නැගී එන මාතෘකා
SECReceivesGrayscaleLitecoinTrustETFFiling
11,813 views
265 සාකච්ඡා කරමින්
💎 ලයිට්කොయిన్ කෙරෙහි ආයතනික අවධානය ළඟා වෙයි
Grayscale විසින් සිදුකර ඇති ETF ගොනුකිරීම $LTC වඩා පුළුල් සංවාදයකට කැඳවා ඇත. ස්පොට් ට්රේඩර්වරුන් සඳහා, මෙවැනි සිදුවීම් ඕනෑම ඇතුළත් වීමක් කිරීමට පෙර ශක්තිමත් වත්කම් ගැන අධ්යයනය කිරීමට මතක් කිරීමකි.
#secreceivesgrayscalelitecointrustetffiling
CryptoMahibaloch
·1 කැමත්ත දැක්වීම්
·909 views
ClarityActFacesProceduralVoteSept15
106,880 views
1,240 සාකච්ඡා කරමින්
US10YearTreasuryYieldNears5%
36,853 views
637 සාකච්ඡා කරමින්