
Birendra Adhikari
4 පෝස්ටු

Birendra Adhikari
වාර්තා කරන්න
පරිශීලක අවහිර කරන්න
Only Believe In Bitcoin.
විවෘත වෙළෙඳාම

{ටෝකන්} දරන්නා
නිතර වෙළෙන්දා
{වේලාව} වසර
1 හඹා යමින්
0 හඹා යන්නන්
0 කැමති විය
පෝස්ටු
ආයෝජන කළඹ
සියල්ල
වීඩියෝ
$BTC Daily Update: Dipped Below $75K, Bounced Back 👀
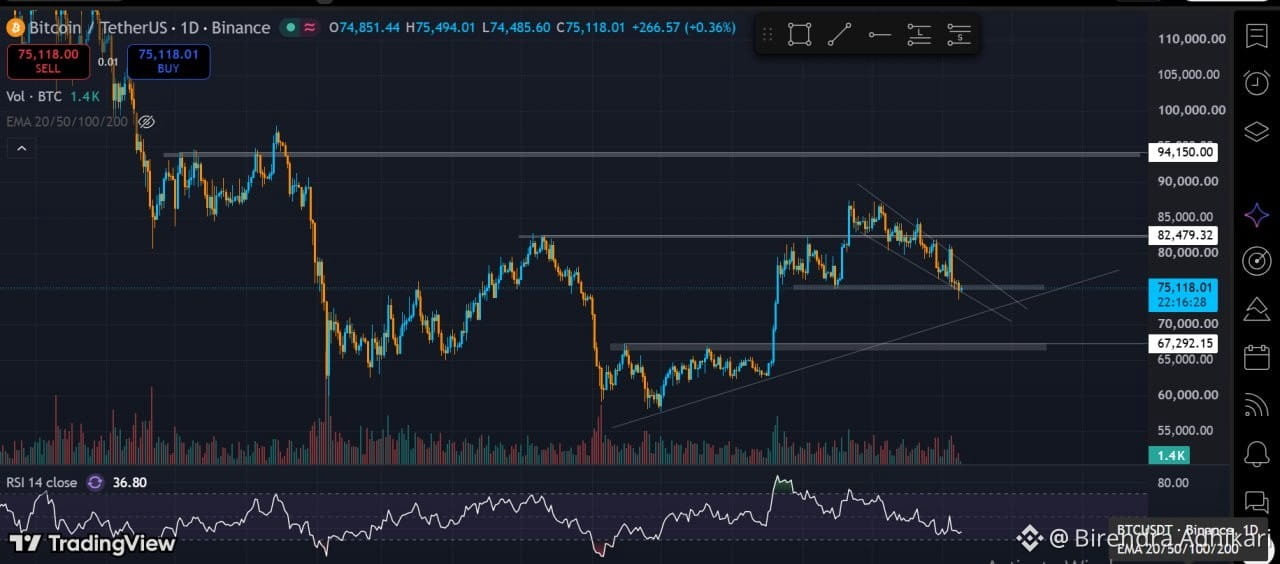
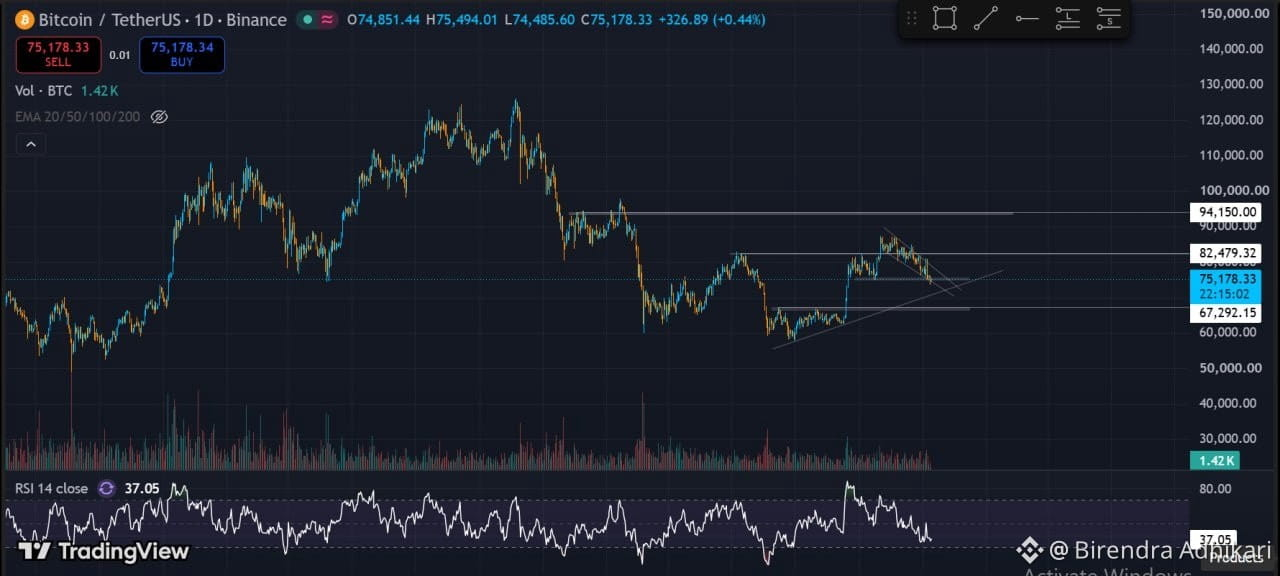
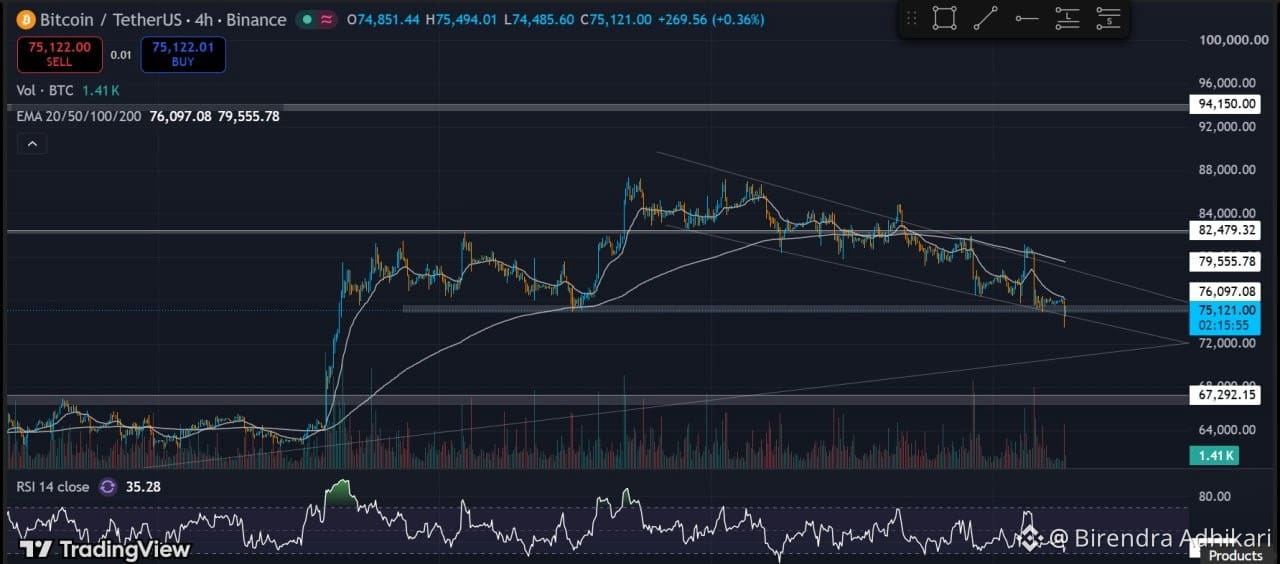
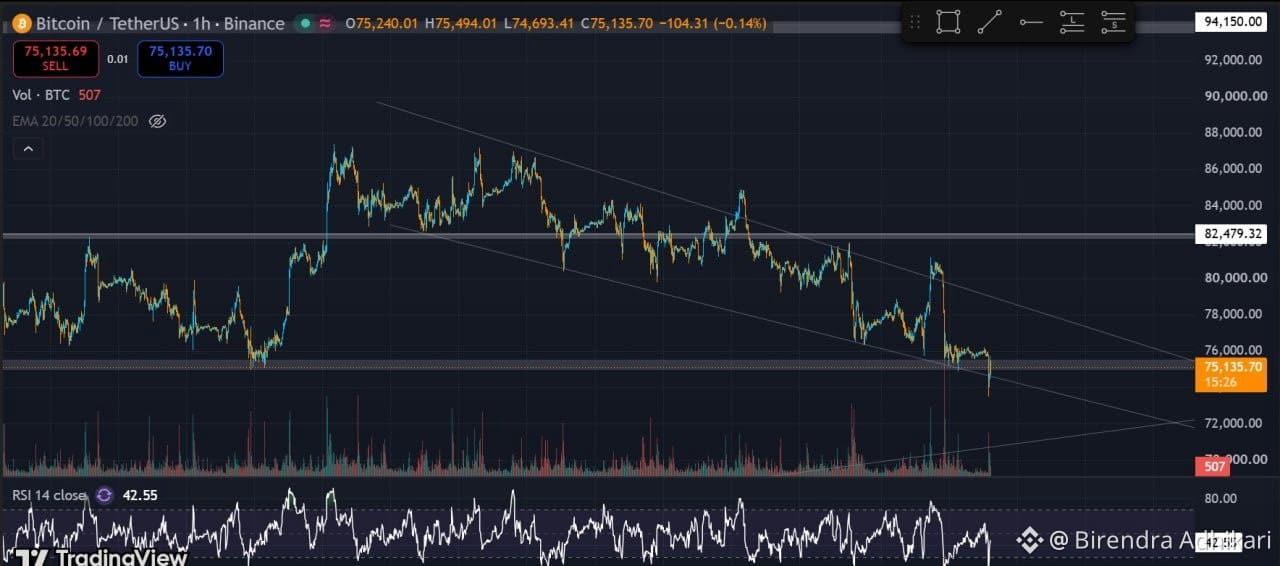
BTC is trading around $75,100 on the 1D chart. Yesterday closed near $74,850, and today price dipped to $74,485 before bouncing back above $75K.
Key levels:
🟢 Support: $75K zone, then trendline $70–71K
🔴 Resistance: $76K (4H EMA), $80K, then $82,479
⚠️ Major support: $67,292
📉 RSI: 37 (1D), 35 (4H), nearing oversold
🗓 CPI tomorrow, Nov 10 at 8:30 AM ET (7:15 PM Nepal time). Expect volatility.
My view: if $75K holds and BTC reclaims $76K, a bounce toward $80K is po
ssible. A daily close below $74.5K opens the way to $70–71K.
What's your level, bounce or breakdown? 👇
Not financial advice. Do your own research.
#BTC #Bitcoin #CryptoAnalysis #BinanceSquare
{spot}(BTCUSDT)
$BTC Daily Update: Dipped Below $75K, Bounced Back 👀
BTC is trading around $75,100 on the 1D chart. Yesterday closed near $74,850, and today price dipped to $74,485 before bouncing back above $75K.
Key levels:
🟢 Support: $75K zone, then trendline $70–71K
🔴 Resistance: $76K (4H EMA), $80K, then $82,479
⚠️ Major support: $67,292
📉 RSI: 37 (1D), 35 (4H), nearing oversold
🗓 CPI tomorrow, Nov 10 at 8:30 AM ET (7:15 PM Nepal time). Expect volatility.
My view: if $75K holds and BTC reclaims $76K, a bounce toward $80K is po
ssible. A daily close below $74.5K opens the way to $70–71K.
What's your level, bounce or breakdown? 👇
Not financial advice. Do your own research.
#BTC #Bitcoin #CryptoAnalysis #BinanceSquare
BTC is trading around $75,100 on the 1D chart. Yesterday closed near $74,850, and today price dipped to $74,485 before bouncing back above $75K.
Key levels:
🟢 Support: $75K zone, then trendline $70–71K
🔴 Resistance: $76K (4H EMA), $80K, then $82,479
⚠️ Major support: $67,292
📉 RSI: 37 (1D), 35 (4H), nearing oversold
🗓 CPI tomorrow, Nov 10 at 8:30 AM ET (7:15 PM Nepal time). Expect volatility.
My view: if $75K holds and BTC reclaims $76K, a bounce toward $80K is po
ssible. A daily close below $74.5K opens the way to $70–71K.
What's your level, bounce or breakdown? 👇
Not financial advice. Do your own research.
#BTC #Bitcoin #CryptoAnalysis #BinanceSquare
75
$BTC Weekly Outlook: Can $75K Hold? | Nov 8, 2026
$BTC Weekly Outlook: Can $75K Hold? | Nov 8, 2026
127
සත්යායනය කළ
ලිපිය
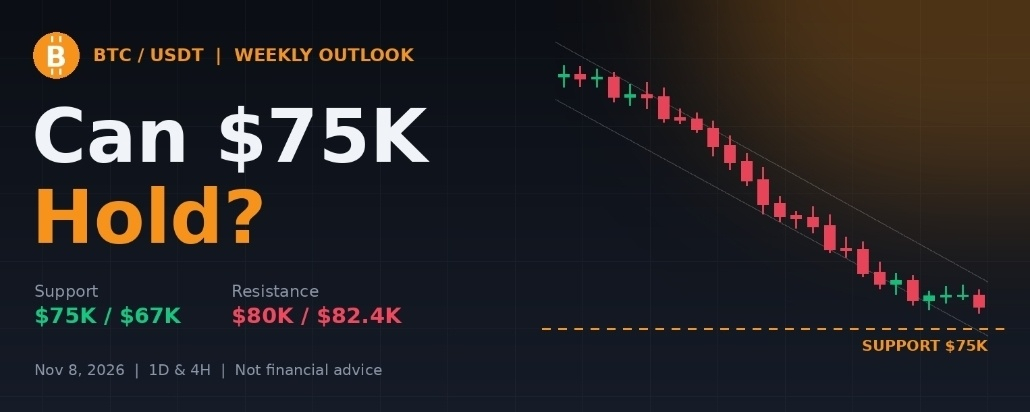
$BTC Weekly Outlook: Can $75K Hold Into a Heavy News Week? 08 November 2026📊Weekly analysis | November 8, 2026 | BTC/USDT, 1D and 4H charts
Market Overview
$BTC is trading near $75,900 after a difficult month. October closed about 7.3% lower, near $77,500, as credit conditions tightened and a record $6.3B hack hit Binance in the last days of the month. This week price dipped under $76K on Nov 5, bounced from around $75,200, and is down about 2% on the week. Despite heavy headlines, price has held the $75K zone.
Daily Chart (1D)
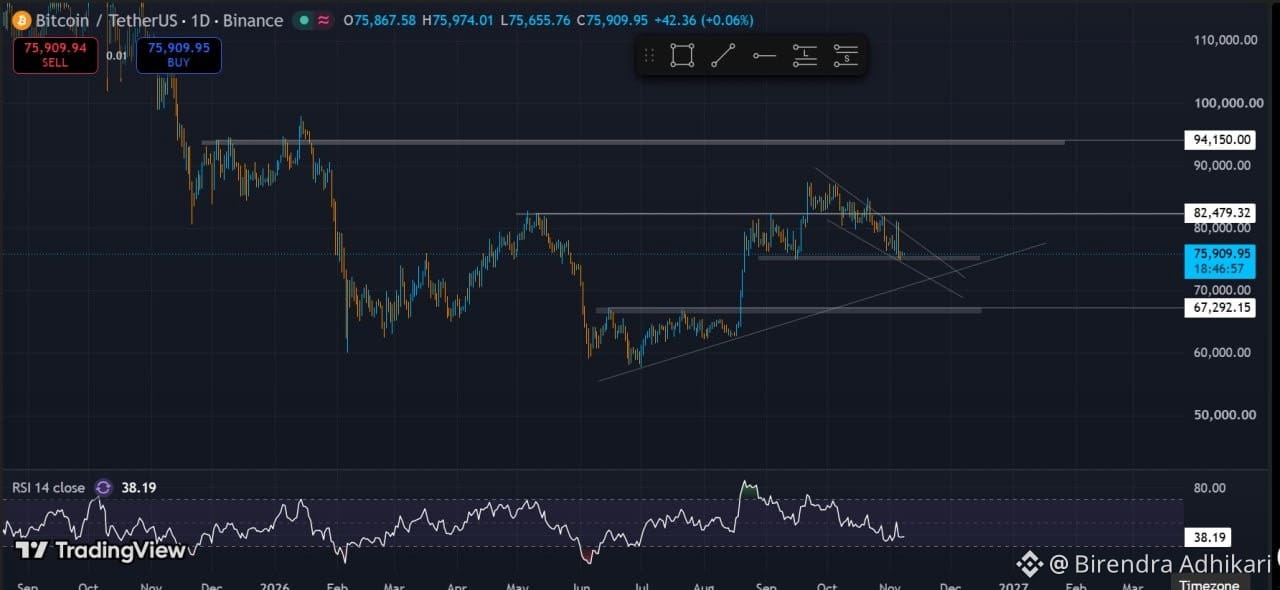
- 🟢 Support: $75K zone, tested again this week. Analysts also point to a cluster of long-term averages around $75.8K–76.2K.
- 📈 Rising trendline: around $70–71K
- ⚠️ Major support: $67,292
- 🔴 Resistance: EMAs near $76.5K and $78.6K, then $80K (channel top), $82,479 and $94,150
- 📉 RSI: 38, so momentum is weak but not oversold
- 📊 Volume: light during the sideways bounce, so buyers are not rushing in yet
4-Hour Chart (4H)
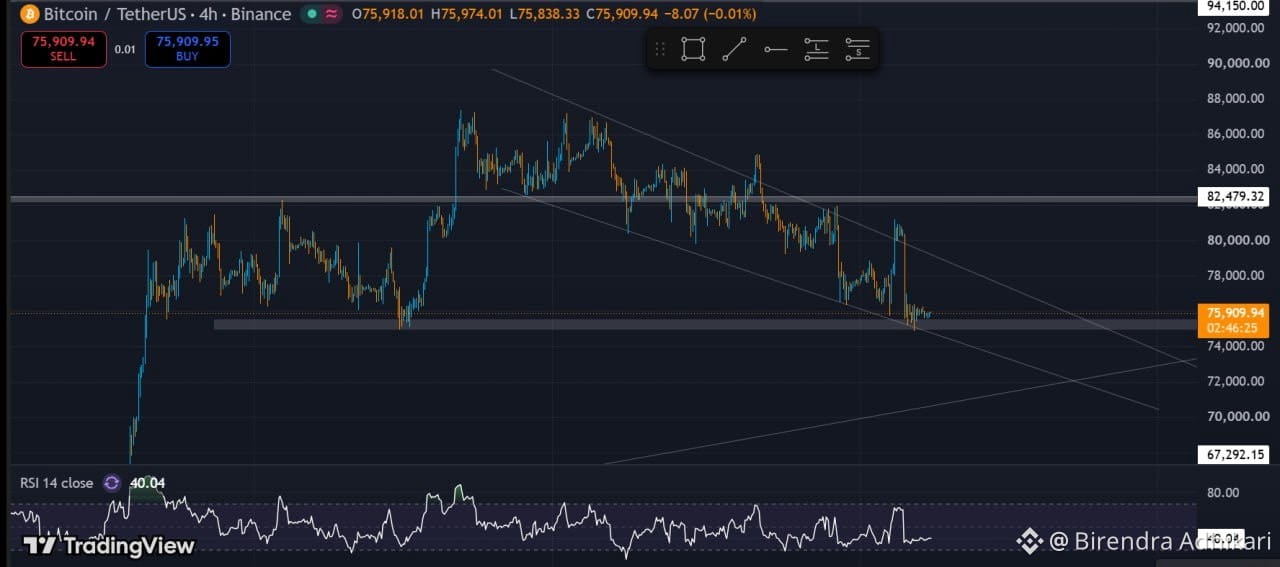
Price is moving sideways just above $75K, below the 4H EMAs (about $76.4K and $79.7K). RSI is near 40. This looks like a pause, not a reversal.
News to Watch
- 🏦 Fed and inflation: The Fed held in late October with no sign of easing. October CPI comes out Tuesday, Nov 10 at 8:30 AM ET. Economists expect +0.3% for the month and 3.7% year over year. A hotter number could pressure BTC, and a cooler one could help.
- 📉 ETF flows: ETFs saw roughly $290M of net outflows in October. I want to see inflows return.
- 🔐 Binance: Withdrawals reopened on Nov 1, and Binance says it has replaced about 95% of the stolen assets. Smooth completion of withdrawals matters for trust.
- 🏢 MSCI, Nov 11: The index provider decides which bitcoin treasury companies, such as Strategy, may be removed from its indices. This could affect sentiment.
Scenarios
🟢 Bullish: $75K holds, CPI is calm, and BTC breaks above $78.6K and then $80K with rising volume. Next targets are $82.4K, then the top of the range.
🔴 Bearish: $75K breaks on a hot CPI or weak flows. The next stops are the trendline at $70–71K, then $67.3K.
My Takeaway
$75K is the line this week. I'm waiting for confirmation instead of guessing, and I'll be careful around CPI day. Patience matters more than speed here.
What's your view this week: bounce or breakdown? 👇
📚 Sources
Price levels, RSI, EMAs and volume come from my own TradingView charts. The news comes from public reports:
- Charts: TradingView, BTC/USDT on Binance (1D and 4H)
- October recap, Binance hack, Fed, MSCI date: 21Shares, "Bitcoin post-Binance hack: What recovery needs in November" (Nov 3, 2026)
- This week's price move: 24/7 Wall St, "Best Crypto to Buy in November 2026" (Nov 7, 2026)
- CPI date: US Bureau of Labor Statistics release schedule
- CPI expectations: Economic Weekly (Nov 6, 2026)
Disclaimer: This is my personal analysis for education only, not financial advice. Crypto is high risk. Do your own research and manage your risk.
#BTC #Bitcoin #WeeklyOutlook #CryptoAnalysis #BinanceSquare
$BTC Weekly Outlook: Can $75K Hold Into a Heavy News Week? 08 November 2026📊
Weekly analysis | November 8, 2026 | BTC/USDT, 1D and 4H charts
Market Overview
$BTC is trading near $75,900 after a difficult month. October closed about 7.3% lower, near $77,500, as credit conditions tightened and a record $6.3B hack hit Binance in the last days of the month. This week price dipped under $76K on Nov 5, bounced from around $75,200, and is down about 2% on the week. Despite heavy headlines, price has held the $75K zone.
Daily Chart (1D)
- 🟢 Support: $75K zone, tested again this week. Analysts also point to a cluster of long-term averages around $75.8K–76.2K.
- 📈 Rising trendline: around $70–71K
- ⚠️ Major support: $67,292
- 🔴 Resistance: EMAs near $76.5K and $78.6K, then $80K (channel top), $82,479 and $94,150
- 📉 RSI: 38, so momentum is weak but not oversold
- 📊 Volume: light during the sideways bounce, so buyers are not rushing in yet
4-Hour Chart (4H)
Price is moving sideways just above $75K, below the 4H EMAs (about $76.4K and $79.7K). RSI is near 40. This looks like a pause, not a reversal.
News to Watch
- 🏦 Fed and inflation: The Fed held in late October with no sign of easing. October CPI comes out Tuesday, Nov 10 at 8:30 AM ET. Economists expect +0.3% for the month and 3.7% year over year. A hotter number could pressure BTC, and a cooler one could help.
- 📉 ETF flows: ETFs saw roughly $290M of net outflows in October. I want to see inflows return.
- 🔐 Binance: Withdrawals reopened on Nov 1, and Binance says it has replaced about 95% of the stolen assets. Smooth completion of withdrawals matters for trust.
- 🏢 MSCI, Nov 11: The index provider decides which bitcoin treasury companies, such as Strategy, may be removed from its indices. This could affect sentiment.
Scenarios
🟢 Bullish: $75K holds, CPI is calm, and BTC breaks above $78.6K and then $80K with rising volume. Next targets are $82.4K, then the top of the range.
🔴 Bearish: $75K breaks on a hot CPI or weak flows. The next stops are the trendline at $70–71K, then $67.3K.
My Takeaway
$75K is the line this week. I'm waiting for confirmation instead of guessing, and I'll be careful around CPI day. Patience matters more than speed here.
What's your view this week: bounce or breakdown? 👇
📚 Sources
Price levels, RSI, EMAs and volume come from my own TradingView charts. The news comes from public reports:
- Charts: TradingView, BTC/USDT on Binance (1D and 4H)
- October recap, Binance hack, Fed, MSCI date: 21Shares, "Bitcoin post-Binance hack: What recovery needs in November" (Nov 3, 2026)
- This week's price move: 24/7 Wall St, "Best Crypto to Buy in November 2026" (Nov 7, 2026)
- CPI date: US Bureau of Labor Statistics release schedule
- CPI expectations: Economic Weekly (Nov 6, 2026)
Disclaimer: This is my personal analysis for education only, not financial advice. Crypto is high risk. Do your own research and manage your risk.
#BTC #Bitcoin #WeeklyOutlook #CryptoAnalysis #BinanceSquare
Market Overview
$BTC is trading near $75,900 after a difficult month. October closed about 7.3% lower, near $77,500, as credit conditions tightened and a record $6.3B hack hit Binance in the last days of the month. This week price dipped under $76K on Nov 5, bounced from around $75,200, and is down about 2% on the week. Despite heavy headlines, price has held the $75K zone.
Daily Chart (1D)
- 🟢 Support: $75K zone, tested again this week. Analysts also point to a cluster of long-term averages around $75.8K–76.2K.
- 📈 Rising trendline: around $70–71K
- ⚠️ Major support: $67,292
- 🔴 Resistance: EMAs near $76.5K and $78.6K, then $80K (channel top), $82,479 and $94,150
- 📉 RSI: 38, so momentum is weak but not oversold
- 📊 Volume: light during the sideways bounce, so buyers are not rushing in yet
4-Hour Chart (4H)
Price is moving sideways just above $75K, below the 4H EMAs (about $76.4K and $79.7K). RSI is near 40. This looks like a pause, not a reversal.
News to Watch
- 🏦 Fed and inflation: The Fed held in late October with no sign of easing. October CPI comes out Tuesday, Nov 10 at 8:30 AM ET. Economists expect +0.3% for the month and 3.7% year over year. A hotter number could pressure BTC, and a cooler one could help.
- 📉 ETF flows: ETFs saw roughly $290M of net outflows in October. I want to see inflows return.
- 🔐 Binance: Withdrawals reopened on Nov 1, and Binance says it has replaced about 95% of the stolen assets. Smooth completion of withdrawals matters for trust.
- 🏢 MSCI, Nov 11: The index provider decides which bitcoin treasury companies, such as Strategy, may be removed from its indices. This could affect sentiment.
Scenarios
🟢 Bullish: $75K holds, CPI is calm, and BTC breaks above $78.6K and then $80K with rising volume. Next targets are $82.4K, then the top of the range.
🔴 Bearish: $75K breaks on a hot CPI or weak flows. The next stops are the trendline at $70–71K, then $67.3K.
My Takeaway
$75K is the line this week. I'm waiting for confirmation instead of guessing, and I'll be careful around CPI day. Patience matters more than speed here.
What's your view this week: bounce or breakdown? 👇
📚 Sources
Price levels, RSI, EMAs and volume come from my own TradingView charts. The news comes from public reports:
- Charts: TradingView, BTC/USDT on Binance (1D and 4H)
- October recap, Binance hack, Fed, MSCI date: 21Shares, "Bitcoin post-Binance hack: What recovery needs in November" (Nov 3, 2026)
- This week's price move: 24/7 Wall St, "Best Crypto to Buy in November 2026" (Nov 7, 2026)
- CPI date: US Bureau of Labor Statistics release schedule
- CPI expectations: Economic Weekly (Nov 6, 2026)
Disclaimer: This is my personal analysis for education only, not financial advice. Crypto is high risk. Do your own research and manage your risk.
#BTC #Bitcoin #WeeklyOutlook #CryptoAnalysis #BinanceSquare
266
$BTC Daily Update: Holding the $75K Support 👀
BTC is trading around $75,900 on the 1D chart, sitting right on support after pulling back inside a falling channel. On the 4H chart, price is moving sideways, which could mean a pause before the next move.
Key levels:
🟢 Support: $75K zone
📈 Trendline support: around $70K–71K
⚠️ Major support: $67,292
🔴 Resistance: $80K (channel top), then $82,479
🎯 Next big resistance: $94,150
📉 RSI: 38 on the 1D and 40 on the 4H, so momentum is weak but selling is slowing
My view: If $75K holds and BTC breaks above $80K, a move toward $82K is possible. If $75K breaks, I'm watching the trendline near $70K–71K, then $67K.
What's your level, bounce or breakdown? 👇
Not financial advice. Do your own research.
#BTC #Bitcoin #CryptoAnalysis #BinanceSquare
$BTC Daily Update: Holding the $75K Support 👀
BTC is trading around $75,900 on the 1D chart, sitting right on support after pulling back inside a falling channel. On the 4H chart, price is moving sideways, which could mean a pause before the next move.
Key levels:
🟢 Support: $75K zone
📈 Trendline support: around $70K–71K
⚠️ Major support: $67,292
🔴 Resistance: $80K (channel top), then $82,479
🎯 Next big resistance: $94,150
📉 RSI: 38 on the 1D and 40 on the 4H, so momentum is weak but selling is slowing
My view: If $75K holds and BTC breaks above $80K, a move toward $82K is possible. If $75K breaks, I'm watching the trendline near $70K–71K, then $67K.
What's your level, bounce or breakdown? 👇
Not financial advice. Do your own research.
#BTC #Bitcoin #CryptoAnalysis #BinanceSquare
BTC is trading around $75,900 on the 1D chart, sitting right on support after pulling back inside a falling channel. On the 4H chart, price is moving sideways, which could mean a pause before the next move.
Key levels:
🟢 Support: $75K zone
📈 Trendline support: around $70K–71K
⚠️ Major support: $67,292
🔴 Resistance: $80K (channel top), then $82,479
🎯 Next big resistance: $94,150
📉 RSI: 38 on the 1D and 40 on the 4H, so momentum is weak but selling is slowing
My view: If $75K holds and BTC breaks above $80K, a move toward $82K is possible. If $75K breaks, I'm watching the trendline near $70K–71K, then $67K.
What's your level, bounce or breakdown? 👇
Not financial advice. Do your own research.
#BTC #Bitcoin #CryptoAnalysis #BinanceSquare
116
තවත් අන්තර්ගතයන් ගවේෂණය කිරීමට ඇතුල් වන්න
Binance චතුරශ්රය හි ගෝලීය ක්රිප්ටෝ පරිශීලකයින් හා එක්වන්න
⚡️ ක්රිප්ටෝ පිළිබඳ නවතම සහ ප්රයෝජනවත් තොරතුරු ලබා ගන්න.
💬 ලොව විශාලතම ක්රිප්ටෝ හුවමාරුව මගින් විශ්වාස කෙරේ.
👍 සත්යායනය කරන ලද නිර්මාණකරුවන්ගෙන් සැබෑ විදසුන් සොයා ගන්න.
විද්යුත් තැපෑල / දුරකථන අංකය
නැගී එන මාතෘකා
NvidiaInvestigatesAfterHuang’sAffairApology
18,635 නැරඹීම්
269 සාකච්ඡා කරමින්
Nvidia Board Opens Probe Into Whether Huang Was Target of Foreign Intelligence Effort
Binance News
·7 කැමත්ත දැක්වීම්
·10.2k නැරඹීම්
BitcoinFiveWeeklyLosses
34,572 නැරඹීම්
705 සාකච්ඡා කරමින්
AIChipSlumpNasdaq
18,861 නැරඹීම්
395 සාකච්ඡා කරමින්