
asiftahsin
2.3k පෝස්ටු

asiftahsin
වාර්තා කරන්න
පරිශීලක අවහිර කරන්න
Share Crypto Related Market Analysis, Share Crypto Related knowledge for my follower(brother and Sister)
32 හඹා යමින්
335 හඹා යන්නන්
1.3K+ කැමති විය
පෝස්ටු
සියල්ල
උපුටා දැක්වීම්
·
--
ලිපිය
පරිවර්තනය බලන්න
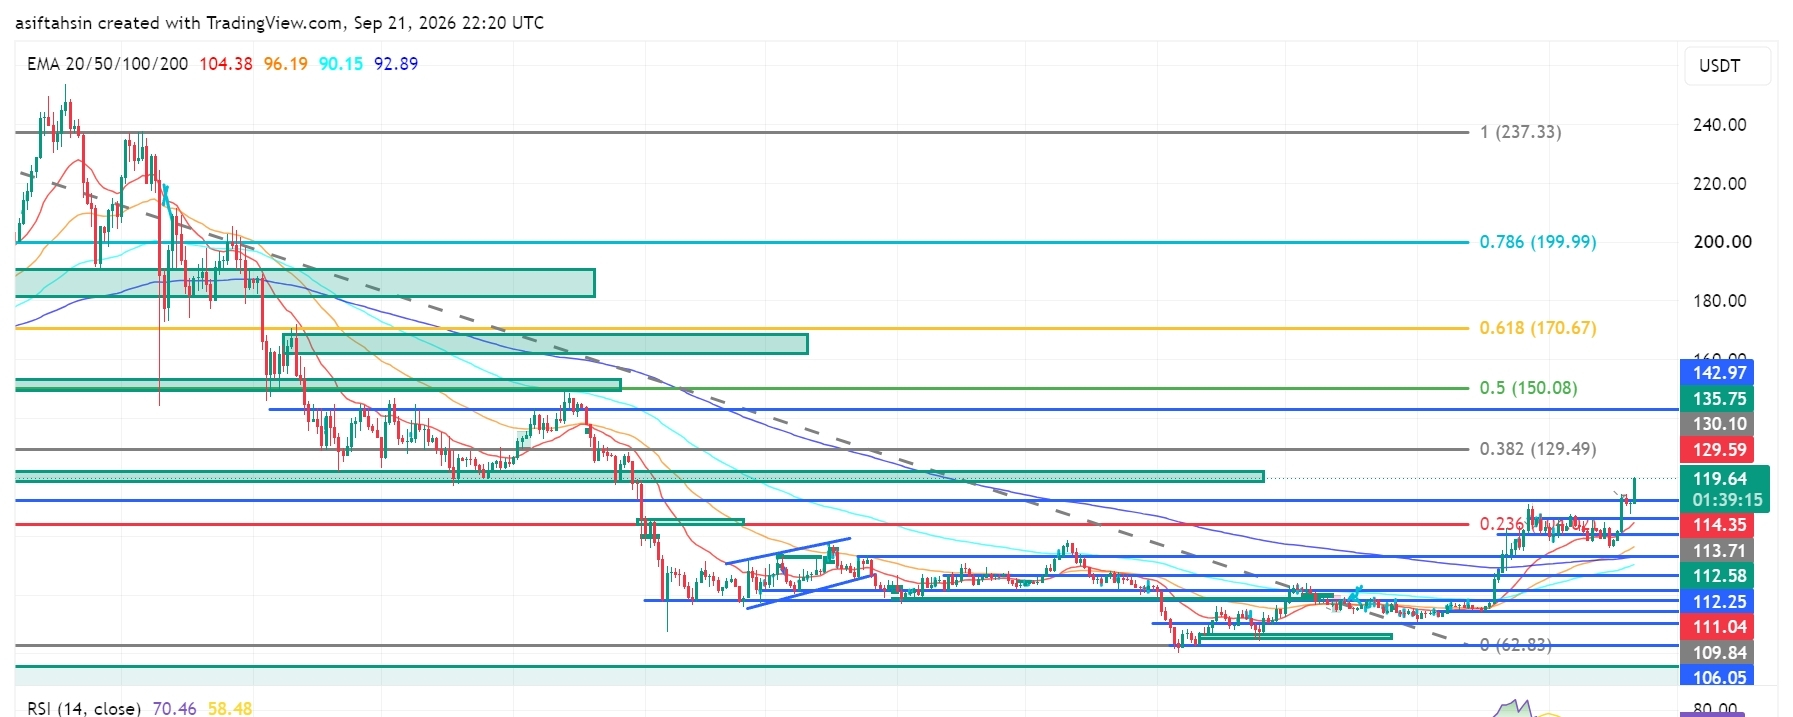
SOL Technical Outlook: Solana Pushes Toward $120 as Breakout Structure StrengthensSOL is currently trading around $119.61, holding well above the $112–$114 region after a strong recovery from the $104–$110 support zone.
The broader structure has improved significantly, with SOL reclaiming the $110–$114 area and now testing the $119–$120 resistance zone. A sustained breakout above this region would bring the higher Fibonacci levels back into focus.
📈 EMA Structure
20 EMA: $104.38
50 EMA: $96.19
100 EMA: $90.15
200 EMA: $92.89
SOL is trading significantly above all four major EMAs.
The 20 EMA remains above the 50 EMA, while the 50 EMA is also above the 200 EMA. This alignment reflects a strong recovery structure and improving medium-term trend.
The $104–$106 region is now an important deeper support zone, while the $110–$114 area has developed into a key structural support region after the recent breakout.
📐 Fibonacci Levels
0.236: $114.35
0.382: $129.49
0.5: $150.08
0.618: $170.67
0.786: $199.99
1.0: $237.33
SOL has reclaimed the 0.236 Fibonacci level around $114.35 and is now trading above it.
The next major Fibonacci resistance is $129.49, followed by $150.08.
🟢 Bullish Scenario
Immediate resistance is around:
$119.61 → $120
A clean breakout and sustained close above the $119–$120 zone could open the path toward:
$129.49 → $135.75 → $142.97 → $150.08
The $129.49 level is the next major Fibonacci resistance. A successful breakout and retest above $129.49 would strengthen the continuation structure and put the $150.08 level into focus.
Above $150.08, the higher Fibonacci references are:
$170.67 → $199.99 → $237.33
🔴 Pullback Scenario
Key support levels:
$114.35
$113.71
$112.58
$112.25
$111.04
$109.84
$106.05
$104.38
$96.19
$92.89
$90.15
The $111–$114 zone is particularly important.
A pullback into this area followed by a successful hold would keep the breakout structure constructive. Losing $109.84–$106.05 would indicate deeper consolidation, while a sustained move below the $104.38 20 EMA would significantly weaken the current recovery structure.
🧠 Market Structure & Liquidity
Liquidity Sweep → Accumulation → Higher Lows → Breakout → Expansion → Retest → Consolidation → Continuation
SOL has moved through several important structural phases, recovering from the June low around $62.83, building higher lows, reclaiming the $100 area, and then breaking above the previous $110–$114 resistance region.
The current move toward $120 represents another expansion phase, with $119–$120 acting as the immediate decision zone.
📊 RSI Momentum
RSI: 70.46
RSI MA: 58.48
RSI has moved above 70, showing strong bullish momentum but also entering an overbought region.
This does not automatically mean a reversal. However, after the recent expansion, SOL could experience short-term consolidation or a pullback before attempting another leg higher.
The key will be whether RSI can remain elevated while price holds the $114–$119 structure.
🎯 Key Levels
Resistance:
$119.61 → $120 → $129.49 → $135.75 → $142.97 → $150.08 → $170.67 → $199.99
Support:
$114.35 → $113.71 → $112.58 → $112.25 → $111.04 → $109.84 → $106.05 → $104.38
Major EMA Support:
$104.38 / $96.19 / $92.89 / $90.15
📌 Final Outlook
SOL has strengthened considerably after reclaiming the $110–$114 region and pushing toward $120.
The key battle now is $119–$120.
A sustained breakout above this zone could open the path toward $129.49, followed by $135.75–$142.97 and the major $150.08 Fibonacci level.
On the downside, $111–$114 is the first major retest zone. Holding this area would keep the breakout structure intact, while a deeper move below $106.05–$104.38 would weaken the current setup.
Bias: Recovery structure remains strong above $104.38. A sustained breakout above $119–$120 could open the path toward $129.49, with $150.08 as the next major Fibonacci objective.
$SOL
{future}(SOLUSDT)
SOL Technical Outlook: Solana Pushes Toward $120 as Breakout Structure Strengthens
SOL is currently trading around $119.61, holding well above the $112–$114 region after a strong recovery from the $104–$110 support zone.
The broader structure has improved significantly, with SOL reclaiming the $110–$114 area and now testing the $119–$120 resistance zone. A sustained breakout above this region would bring the higher Fibonacci levels back into focus.
📈 EMA Structure
20 EMA: $104.38
50 EMA: $96.19
100 EMA: $90.15
200 EMA: $92.89
SOL is trading significantly above all four major EMAs.
The 20 EMA remains above the 50 EMA, while the 50 EMA is also above the 200 EMA. This alignment reflects a strong recovery structure and improving medium-term trend.
The $104–$106 region is now an important deeper support zone, while the $110–$114 area has developed into a key structural support region after the recent breakout.
📐 Fibonacci Levels
0.236: $114.35
0.382: $129.49
0.5: $150.08
0.618: $170.67
0.786: $199.99
1.0: $237.33
SOL has reclaimed the 0.236 Fibonacci level around $114.35 and is now trading above it.
The next major Fibonacci resistance is $129.49, followed by $150.08.
🟢 Bullish Scenario
Immediate resistance is around:
$119.61 → $120
A clean breakout and sustained close above the $119–$120 zone could open the path toward:
$129.49 → $135.75 → $142.97 → $150.08
The $129.49 level is the next major Fibonacci resistance. A successful breakout and retest above $129.49 would strengthen the continuation structure and put the $150.08 level into focus.
Above $150.08, the higher Fibonacci references are:
$170.67 → $199.99 → $237.33
🔴 Pullback Scenario
Key support levels:
$114.35
$113.71
$112.58
$112.25
$111.04
$109.84
$106.05
$104.38
$96.19
$92.89
$90.15
The $111–$114 zone is particularly important.
A pullback into this area followed by a successful hold would keep the breakout structure constructive. Losing $109.84–$106.05 would indicate deeper consolidation, while a sustained move below the $104.38 20 EMA would significantly weaken the current recovery structure.
🧠 Market Structure & Liquidity
Liquidity Sweep → Accumulation → Higher Lows → Breakout → Expansion → Retest → Consolidation → Continuation
SOL has moved through several important structural phases, recovering from the June low around $62.83, building higher lows, reclaiming the $100 area, and then breaking above the previous $110–$114 resistance region.
The current move toward $120 represents another expansion phase, with $119–$120 acting as the immediate decision zone.
📊 RSI Momentum
RSI: 70.46
RSI MA: 58.48
RSI has moved above 70, showing strong bullish momentum but also entering an overbought region.
This does not automatically mean a reversal. However, after the recent expansion, SOL could experience short-term consolidation or a pullback before attempting another leg higher.
The key will be whether RSI can remain elevated while price holds the $114–$119 structure.
🎯 Key Levels
Resistance:
$119.61 → $120 → $129.49 → $135.75 → $142.97 → $150.08 → $170.67 → $199.99
Support:
$114.35 → $113.71 → $112.58 → $112.25 → $111.04 → $109.84 → $106.05 → $104.38
Major EMA Support:
$104.38 / $96.19 / $92.89 / $90.15
📌 Final Outlook
SOL has strengthened considerably after reclaiming the $110–$114 region and pushing toward $120.
The key battle now is $119–$120.
A sustained breakout above this zone could open the path toward $129.49, followed by $135.75–$142.97 and the major $150.08 Fibonacci level.
On the downside, $111–$114 is the first major retest zone. Holding this area would keep the breakout structure intact, while a deeper move below $106.05–$104.38 would weaken the current setup.
Bias: Recovery structure remains strong above $104.38. A sustained breakout above $119–$120 could open the path toward $129.49, with $150.08 as the next major Fibonacci objective.
$SOL
The broader structure has improved significantly, with SOL reclaiming the $110–$114 area and now testing the $119–$120 resistance zone. A sustained breakout above this region would bring the higher Fibonacci levels back into focus.
📈 EMA Structure
20 EMA: $104.38
50 EMA: $96.19
100 EMA: $90.15
200 EMA: $92.89
SOL is trading significantly above all four major EMAs.
The 20 EMA remains above the 50 EMA, while the 50 EMA is also above the 200 EMA. This alignment reflects a strong recovery structure and improving medium-term trend.
The $104–$106 region is now an important deeper support zone, while the $110–$114 area has developed into a key structural support region after the recent breakout.
📐 Fibonacci Levels
0.236: $114.35
0.382: $129.49
0.5: $150.08
0.618: $170.67
0.786: $199.99
1.0: $237.33
SOL has reclaimed the 0.236 Fibonacci level around $114.35 and is now trading above it.
The next major Fibonacci resistance is $129.49, followed by $150.08.
🟢 Bullish Scenario
Immediate resistance is around:
$119.61 → $120
A clean breakout and sustained close above the $119–$120 zone could open the path toward:
$129.49 → $135.75 → $142.97 → $150.08
The $129.49 level is the next major Fibonacci resistance. A successful breakout and retest above $129.49 would strengthen the continuation structure and put the $150.08 level into focus.
Above $150.08, the higher Fibonacci references are:
$170.67 → $199.99 → $237.33
🔴 Pullback Scenario
Key support levels:
$114.35
$113.71
$112.58
$112.25
$111.04
$109.84
$106.05
$104.38
$96.19
$92.89
$90.15
The $111–$114 zone is particularly important.
A pullback into this area followed by a successful hold would keep the breakout structure constructive. Losing $109.84–$106.05 would indicate deeper consolidation, while a sustained move below the $104.38 20 EMA would significantly weaken the current recovery structure.
🧠 Market Structure & Liquidity
Liquidity Sweep → Accumulation → Higher Lows → Breakout → Expansion → Retest → Consolidation → Continuation
SOL has moved through several important structural phases, recovering from the June low around $62.83, building higher lows, reclaiming the $100 area, and then breaking above the previous $110–$114 resistance region.
The current move toward $120 represents another expansion phase, with $119–$120 acting as the immediate decision zone.
📊 RSI Momentum
RSI: 70.46
RSI MA: 58.48
RSI has moved above 70, showing strong bullish momentum but also entering an overbought region.
This does not automatically mean a reversal. However, after the recent expansion, SOL could experience short-term consolidation or a pullback before attempting another leg higher.
The key will be whether RSI can remain elevated while price holds the $114–$119 structure.
🎯 Key Levels
Resistance:
$119.61 → $120 → $129.49 → $135.75 → $142.97 → $150.08 → $170.67 → $199.99
Support:
$114.35 → $113.71 → $112.58 → $112.25 → $111.04 → $109.84 → $106.05 → $104.38
Major EMA Support:
$104.38 / $96.19 / $92.89 / $90.15
📌 Final Outlook
SOL has strengthened considerably after reclaiming the $110–$114 region and pushing toward $120.
The key battle now is $119–$120.
A sustained breakout above this zone could open the path toward $129.49, followed by $135.75–$142.97 and the major $150.08 Fibonacci level.
On the downside, $111–$114 is the first major retest zone. Holding this area would keep the breakout structure intact, while a deeper move below $106.05–$104.38 would weaken the current setup.
Bias: Recovery structure remains strong above $104.38. A sustained breakout above $119–$120 could open the path toward $129.49, with $150.08 as the next major Fibonacci objective.
$SOL
35
·
--
ලිපිය
පරිවර්තනය බලන්න
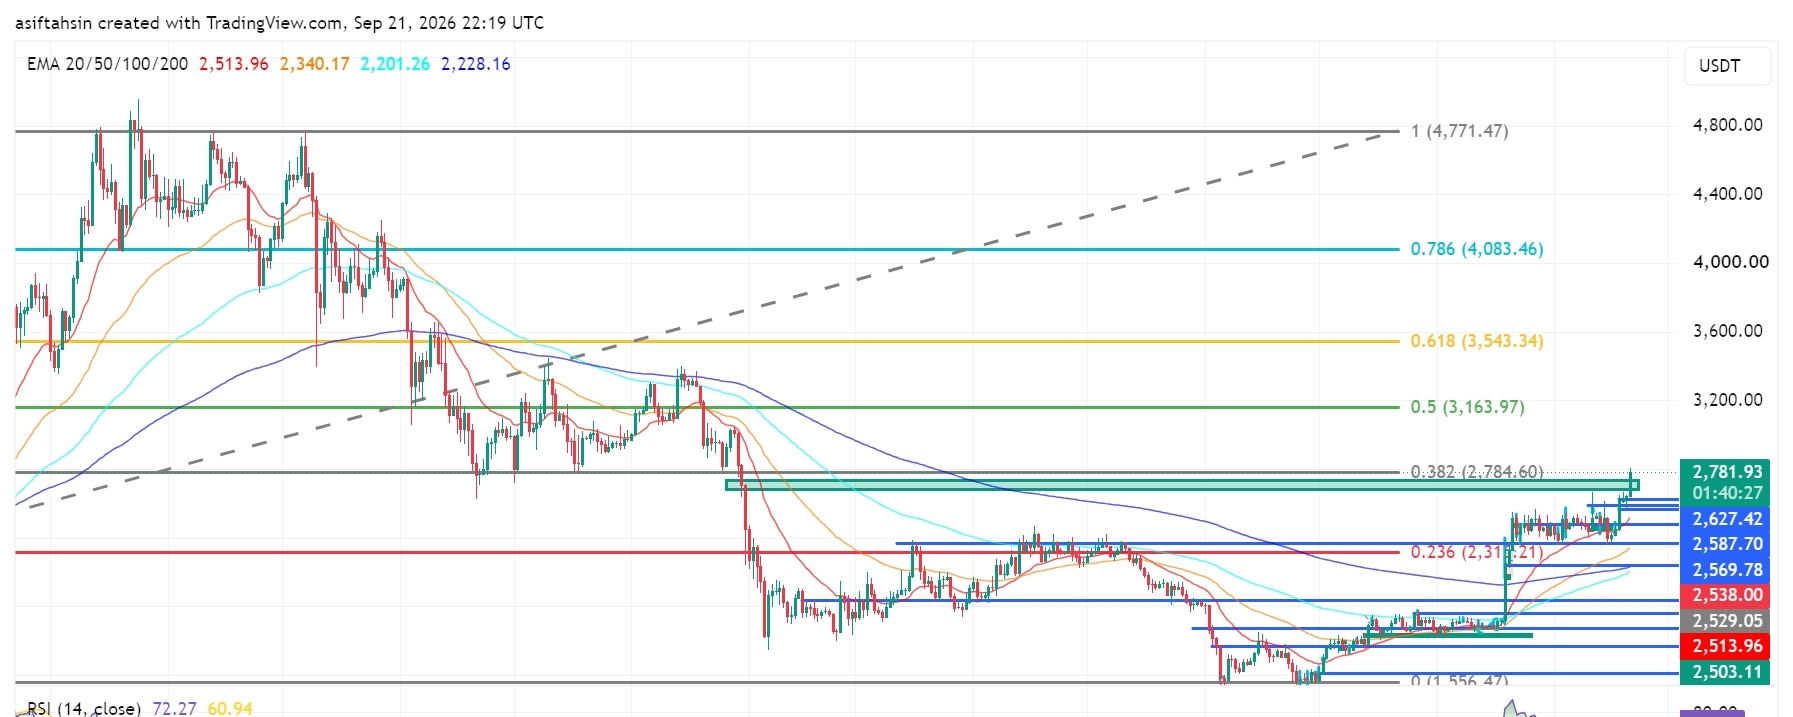
ETH Technical Outlook: Ethereum Reclaims $2.78K as Breakout Structure StrengthensETH is currently trading around $2,781.93, pushing into the major $2,784.60 Fibonacci resistance after a strong recovery from the $2,475–$2,500 area.
The broader structure has improved significantly, with ETH reclaiming the $2,500–$2,600 region and breaking above the previous consolidation range. A sustained breakout above $2,784.60 would bring the higher Fibonacci levels into focus.
📈 EMA Structure
20 EMA: $2,513.96
50 EMA: $2,340.17
100 EMA: $2,201.26
200 EMA: $2,228.16
ETH is trading well above all four major EMAs.
The 20 EMA remains above the 50 EMA, while the 100 EMA and 200 EMA are positioned significantly lower. This alignment reflects a strong recovery structure and improving medium-term momentum.
The $2,500–$2,540 region is now an important EMA/support zone.
📐 Fibonacci Levels
0.236: $2,315.21
0.382: $2,784.60
0.5: $3,163.97
0.618: $3,543.34
0.786: $4,083.46
1.0: $4,771.47
ETH is currently testing the 0.382 Fibonacci level at $2,784.60.
A clean breakout and sustained close above this level would shift attention toward $3,163.97, followed by the higher Fibonacci extensions.
🟢 Bullish Scenario
Immediate resistance sits around:
$2,784.60 → $2,800
A confirmed breakout above this area could open the path toward:
$3,163.97 → $3,543.34 → $4,083.46 → $4,771.47
The first major objective is the 0.5 Fibonacci level at $3,163.97. If ETH can establish support above $2,784.60 after the breakout, the recovery structure would become substantially stronger.
🔴 Pullback Scenario
Key support levels:
$2,672.47
$2,627.42
$2,587.70
$2,569.78
$2,538.00
$2,529.05
$2,513.96
$2,503.11
$2,479.06
$2,475.84
The $2,570–$2,630 zone is particularly important for a healthy retest.
Holding this area after a breakout would allow ETH to consolidate before another attempt higher. A deeper move below $2,500 would weaken the current breakout structure and bring the lower support zone back into focus.
🧠 Market Structure & Liquidity
Liquidity Sweep → Accumulation → Higher Lows → Breakout → Expansion → Retest → Consolidation → Continuation
ETH has transitioned from the prolonged decline into a clear recovery structure. The recent move above the $2,600–$2,670 region represents an important expansion phase, while the current move toward $2,784.60 is testing the next major structural resistance.
📊 RSI Momentum
RSI: 72.27
RSI MA: 60.94
RSI has moved above 70, showing strong momentum but also indicating that ETH is entering an overbought zone on this chart.
That does not automatically mean a reversal; however, after such a strong expansion, a short-term consolidation or pullback would be technically normal before another continuation attempt.
🎯 Key Levels
Resistance:
$2,784.60 → $2,800 → $3,163.97 → $3,543.34 → $4,083.46 → $4,771.47
Support:
$2,672.47 → $2,627.42 → $2,587.70 → $2,569.78 → $2,538 → $2,513.96 → $2,503.11 → $2,479.06
Major EMA Support:
$2,513.96 / $2,340.17 / $2,228.16 / $2,201.26
📌 Final Outlook
ETH has strengthened considerably after reclaiming the $2,500–$2,600 region and pushing toward the $2,784.60 Fibonacci resistance.
The key battle now is $2,784.60–$2,800.
A sustained breakout above this zone could open the path toward $3,163.97, followed by $3,543.34 and potentially $4,083.46.
On the downside, $2,570–$2,630 is the first major retest zone, while $2,500–$2,514 remains critical structural support.
Bias: Recovery structure remains strong above $2,500. A sustained breakout above $2,784.60 could open the path toward $3,163.97, with $3,543.34 as the next major Fibonacci level.
$ETH
{future}(ETHUSDT)
ETH Technical Outlook: Ethereum Reclaims $2.78K as Breakout Structure Strengthens
ETH is currently trading around $2,781.93, pushing into the major $2,784.60 Fibonacci resistance after a strong recovery from the $2,475–$2,500 area.
The broader structure has improved significantly, with ETH reclaiming the $2,500–$2,600 region and breaking above the previous consolidation range. A sustained breakout above $2,784.60 would bring the higher Fibonacci levels into focus.
📈 EMA Structure
20 EMA: $2,513.96
50 EMA: $2,340.17
100 EMA: $2,201.26
200 EMA: $2,228.16
ETH is trading well above all four major EMAs.
The 20 EMA remains above the 50 EMA, while the 100 EMA and 200 EMA are positioned significantly lower. This alignment reflects a strong recovery structure and improving medium-term momentum.
The $2,500–$2,540 region is now an important EMA/support zone.
📐 Fibonacci Levels
0.236: $2,315.21
0.382: $2,784.60
0.5: $3,163.97
0.618: $3,543.34
0.786: $4,083.46
1.0: $4,771.47
ETH is currently testing the 0.382 Fibonacci level at $2,784.60.
A clean breakout and sustained close above this level would shift attention toward $3,163.97, followed by the higher Fibonacci extensions.
🟢 Bullish Scenario
Immediate resistance sits around:
$2,784.60 → $2,800
A confirmed breakout above this area could open the path toward:
$3,163.97 → $3,543.34 → $4,083.46 → $4,771.47
The first major objective is the 0.5 Fibonacci level at $3,163.97. If ETH can establish support above $2,784.60 after the breakout, the recovery structure would become substantially stronger.
🔴 Pullback Scenario
Key support levels:
$2,672.47
$2,627.42
$2,587.70
$2,569.78
$2,538.00
$2,529.05
$2,513.96
$2,503.11
$2,479.06
$2,475.84
The $2,570–$2,630 zone is particularly important for a healthy retest.
Holding this area after a breakout would allow ETH to consolidate before another attempt higher. A deeper move below $2,500 would weaken the current breakout structure and bring the lower support zone back into focus.
🧠 Market Structure & Liquidity
Liquidity Sweep → Accumulation → Higher Lows → Breakout → Expansion → Retest → Consolidation → Continuation
ETH has transitioned from the prolonged decline into a clear recovery structure. The recent move above the $2,600–$2,670 region represents an important expansion phase, while the current move toward $2,784.60 is testing the next major structural resistance.
📊 RSI Momentum
RSI: 72.27
RSI MA: 60.94
RSI has moved above 70, showing strong momentum but also indicating that ETH is entering an overbought zone on this chart.
That does not automatically mean a reversal; however, after such a strong expansion, a short-term consolidation or pullback would be technically normal before another continuation attempt.
🎯 Key Levels
Resistance:
$2,784.60 → $2,800 → $3,163.97 → $3,543.34 → $4,083.46 → $4,771.47
Support:
$2,672.47 → $2,627.42 → $2,587.70 → $2,569.78 → $2,538 → $2,513.96 → $2,503.11 → $2,479.06
Major EMA Support:
$2,513.96 / $2,340.17 / $2,228.16 / $2,201.26
📌 Final Outlook
ETH has strengthened considerably after reclaiming the $2,500–$2,600 region and pushing toward the $2,784.60 Fibonacci resistance.
The key battle now is $2,784.60–$2,800.
A sustained breakout above this zone could open the path toward $3,163.97, followed by $3,543.34 and potentially $4,083.46.
On the downside, $2,570–$2,630 is the first major retest zone, while $2,500–$2,514 remains critical structural support.
Bias: Recovery structure remains strong above $2,500. A sustained breakout above $2,784.60 could open the path toward $3,163.97, with $3,543.34 as the next major Fibonacci level.
$ETH
The broader structure has improved significantly, with ETH reclaiming the $2,500–$2,600 region and breaking above the previous consolidation range. A sustained breakout above $2,784.60 would bring the higher Fibonacci levels into focus.
📈 EMA Structure
20 EMA: $2,513.96
50 EMA: $2,340.17
100 EMA: $2,201.26
200 EMA: $2,228.16
ETH is trading well above all four major EMAs.
The 20 EMA remains above the 50 EMA, while the 100 EMA and 200 EMA are positioned significantly lower. This alignment reflects a strong recovery structure and improving medium-term momentum.
The $2,500–$2,540 region is now an important EMA/support zone.
📐 Fibonacci Levels
0.236: $2,315.21
0.382: $2,784.60
0.5: $3,163.97
0.618: $3,543.34
0.786: $4,083.46
1.0: $4,771.47
ETH is currently testing the 0.382 Fibonacci level at $2,784.60.
A clean breakout and sustained close above this level would shift attention toward $3,163.97, followed by the higher Fibonacci extensions.
🟢 Bullish Scenario
Immediate resistance sits around:
$2,784.60 → $2,800
A confirmed breakout above this area could open the path toward:
$3,163.97 → $3,543.34 → $4,083.46 → $4,771.47
The first major objective is the 0.5 Fibonacci level at $3,163.97. If ETH can establish support above $2,784.60 after the breakout, the recovery structure would become substantially stronger.
🔴 Pullback Scenario
Key support levels:
$2,672.47
$2,627.42
$2,587.70
$2,569.78
$2,538.00
$2,529.05
$2,513.96
$2,503.11
$2,479.06
$2,475.84
The $2,570–$2,630 zone is particularly important for a healthy retest.
Holding this area after a breakout would allow ETH to consolidate before another attempt higher. A deeper move below $2,500 would weaken the current breakout structure and bring the lower support zone back into focus.
🧠 Market Structure & Liquidity
Liquidity Sweep → Accumulation → Higher Lows → Breakout → Expansion → Retest → Consolidation → Continuation
ETH has transitioned from the prolonged decline into a clear recovery structure. The recent move above the $2,600–$2,670 region represents an important expansion phase, while the current move toward $2,784.60 is testing the next major structural resistance.
📊 RSI Momentum
RSI: 72.27
RSI MA: 60.94
RSI has moved above 70, showing strong momentum but also indicating that ETH is entering an overbought zone on this chart.
That does not automatically mean a reversal; however, after such a strong expansion, a short-term consolidation or pullback would be technically normal before another continuation attempt.
🎯 Key Levels
Resistance:
$2,784.60 → $2,800 → $3,163.97 → $3,543.34 → $4,083.46 → $4,771.47
Support:
$2,672.47 → $2,627.42 → $2,587.70 → $2,569.78 → $2,538 → $2,513.96 → $2,503.11 → $2,479.06
Major EMA Support:
$2,513.96 / $2,340.17 / $2,228.16 / $2,201.26
📌 Final Outlook
ETH has strengthened considerably after reclaiming the $2,500–$2,600 region and pushing toward the $2,784.60 Fibonacci resistance.
The key battle now is $2,784.60–$2,800.
A sustained breakout above this zone could open the path toward $3,163.97, followed by $3,543.34 and potentially $4,083.46.
On the downside, $2,570–$2,630 is the first major retest zone, while $2,500–$2,514 remains critical structural support.
Bias: Recovery structure remains strong above $2,500. A sustained breakout above $2,784.60 could open the path toward $3,163.97, with $3,543.34 as the next major Fibonacci level.
$ETH
58
·
--
ලිපිය
XRP තාක්ෂණික දැක්ම: ප්රතිශක්තිමත් වීමේ ව්යුහය ශක්තිමත් වන විට XRP $1.40ට ඉහළින් රැඳී සිටියිXRP තාක්ෂණික දැක්ම: ප්රතිශක්තිමත් වීමේ ව්යුහය ශක්තිමත් වෙද්දී XRP $1.40ට ඉහළින් රැඳී සිටියි
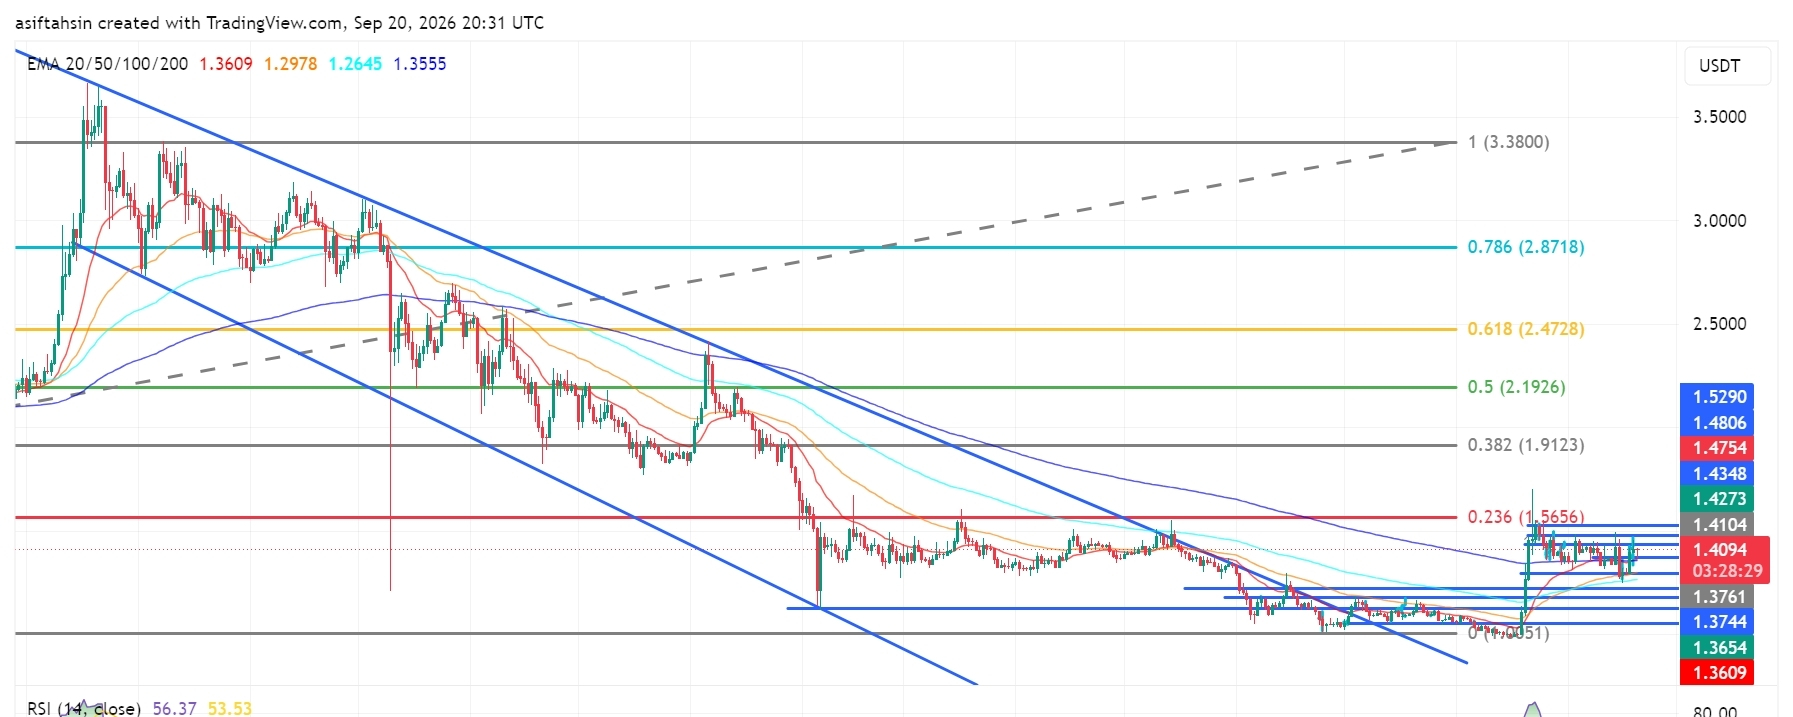
දැනට XRP $1.41 වටා වෙළඳාම් කරමින් සිටින අතර, $1.25–$1.30 සහාය කලාපයෙන් මෑත නැවත යථා තත්ත්වයට පත්වීමෙන් පසු $1.37–$1.40 කලාපය ඉහළින් රැඳී සිටියි.
පුළුල් ව්යුහය වැඩි දියුණු වී ඇත; මිල දැන් $1.40 කලාපය නැවත අත්කරගෙන $1.41–$1.48 ප්රධාන ප්රතිරෝධ කලාපය වෙත නැවත යමින් සිටී. මෙම කලාපය හරහා දිගටම ස්ථාවරව ගමන් කිරීමෙන් ඉහළ Fibonacci මට්ටම් නැවත අවධානයට එයි.
මීට අමතරව මෑත වෙළඳපොළ අදහස් ද $1.40 කලාපය වැදගත් ප්රතිරෝධය/නැවත අත්කර ගැනීමේ මට්ටමක් ලෙස හඳුනාගෙන ඇත; නමුත් කෙටි කාලීන momentum මෙම කලාපය වටා සංවේදී වේ.
XRP තාක්ෂණික දැක්ම: ප්රතිශක්තිමත් වීමේ ව්යුහය ශක්තිමත් වන විට XRP $1.40ට ඉහළින් රැඳී සිටියි
XRP තාක්ෂණික දැක්ම: ප්රතිශක්තිමත් වීමේ ව්යුහය ශක්තිමත් වෙද්දී XRP $1.40ට ඉහළින් රැඳී සිටියි
දැනට XRP $1.41 වටා වෙළඳාම් කරමින් සිටින අතර, $1.25–$1.30 සහාය කලාපයෙන් මෑත නැවත යථා තත්ත්වයට පත්වීමෙන් පසු $1.37–$1.40 කලාපය ඉහළින් රැඳී සිටියි.
පුළුල් ව්යුහය වැඩි දියුණු වී ඇත; මිල දැන් $1.40 කලාපය නැවත අත්කරගෙන $1.41–$1.48 ප්රධාන ප්රතිරෝධ කලාපය වෙත නැවත යමින් සිටී. මෙම කලාපය හරහා දිගටම ස්ථාවරව ගමන් කිරීමෙන් ඉහළ Fibonacci මට්ටම් නැවත අවධානයට එයි.
මීට අමතරව මෑත වෙළඳපොළ අදහස් ද $1.40 කලාපය වැදගත් ප්රතිරෝධය/නැවත අත්කර ගැනීමේ මට්ටමක් ලෙස හඳුනාගෙන ඇත; නමුත් කෙටි කාලීන momentum මෙම කලාපය වටා සංවේදී වේ.
දැනට XRP $1.41 වටා වෙළඳාම් කරමින් සිටින අතර, $1.25–$1.30 සහාය කලාපයෙන් මෑත නැවත යථා තත්ත්වයට පත්වීමෙන් පසු $1.37–$1.40 කලාපය ඉහළින් රැඳී සිටියි.
පුළුල් ව්යුහය වැඩි දියුණු වී ඇත; මිල දැන් $1.40 කලාපය නැවත අත්කරගෙන $1.41–$1.48 ප්රධාන ප්රතිරෝධ කලාපය වෙත නැවත යමින් සිටී. මෙම කලාපය හරහා දිගටම ස්ථාවරව ගමන් කිරීමෙන් ඉහළ Fibonacci මට්ටම් නැවත අවධානයට එයි.
මීට අමතරව මෑත වෙළඳපොළ අදහස් ද $1.40 කලාපය වැදගත් ප්රතිරෝධය/නැවත අත්කර ගැනීමේ මට්ටමක් ලෙස හඳුනාගෙන ඇත; නමුත් කෙටි කාලීන momentum මෙම කලාපය වටා සංවේදී වේ.
2
1.2k
·
--
ලිපිය
පරිවර්තනය බලන්න
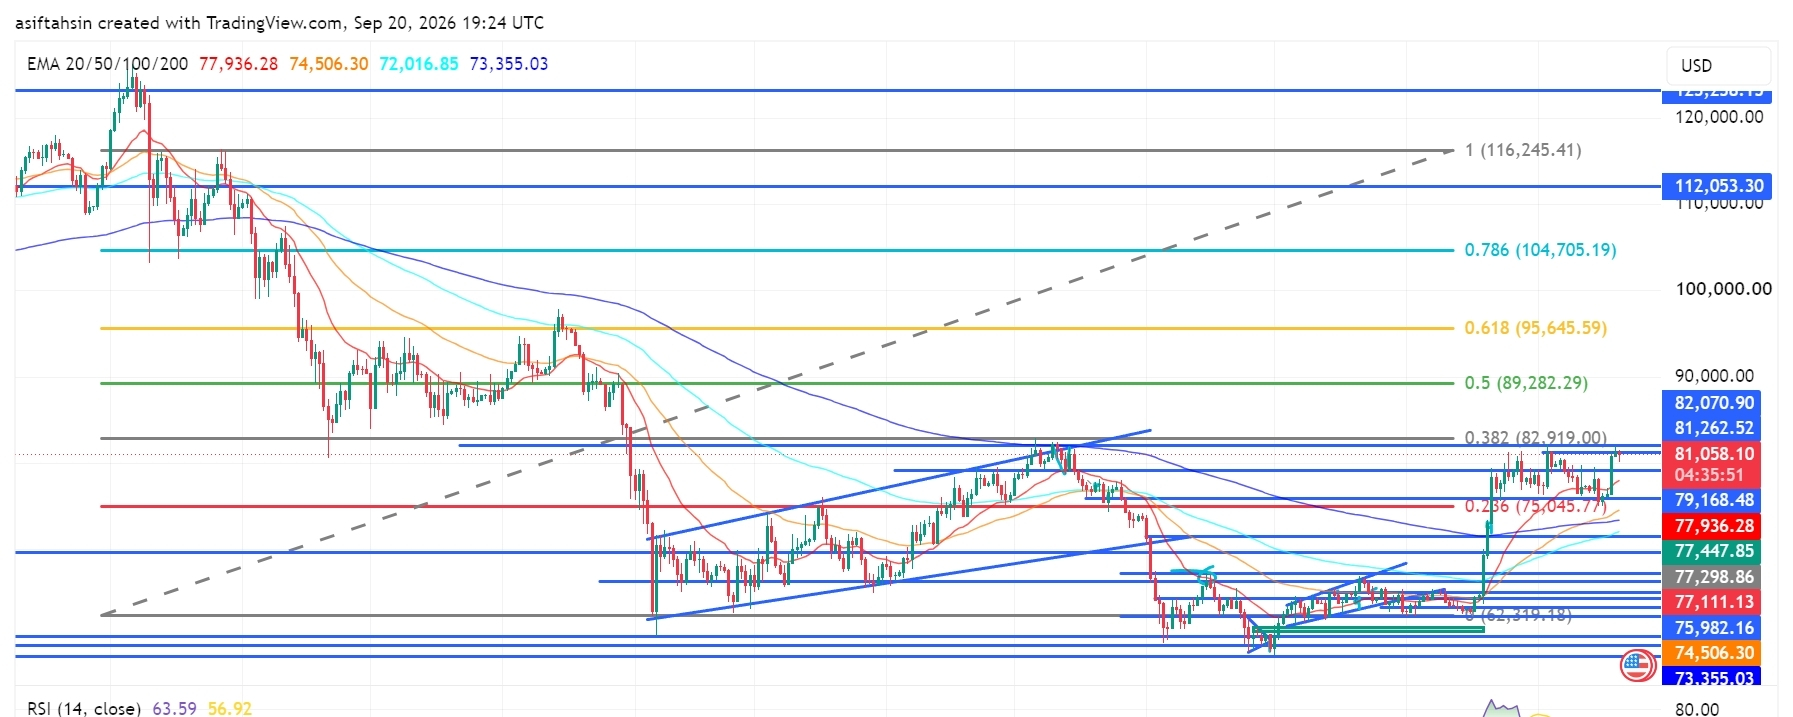
BTC Technical Outlook: Bitcoin Reclaims $81K as Recovery Structure StrengthensBTC is currently trading around $81,058, holding above the $79K–$80K region after the recent recovery from the $72K–$75K support area.
The broader structure has improved, with price reclaiming the $80K area and moving back toward the major $81.26K–$82.92K resistance zone. A sustained move through this area would put the higher Fibonacci levels back into focus.
📈 EMA Structure
20 EMA: $77,936.12
50 EMA: $74,506.24
100 EMA: $72,016.82
200 EMA: $73,355.02
BTC is currently trading well above the 20 EMA at $77,936.
The recovery above the 50 EMA at $74,506, 100 EMA at $72,016, and 200 EMA at $73,355 keeps the broader recovery structure constructive.
The 20 EMA remains above the longer-term EMA levels, showing improving short-term structure.
The $77.9K area remains an important dynamic support during any short-term pullback.
📐 Fibonacci Levels
Key Fibonacci levels:
0.236: $75,045.77
0.382: $82,919.00
0.5: $89,282.29
0.618: $95,645.59
0.786: $104,705.19
1.0: $116,245.41
BTC is currently trading above the 0.236 Fibonacci level at $75,045.77.
The next major Fibonacci reference is $82,919 — 0.382 Fib.
A sustained move above the $81K–$82.9K resistance area could bring $89,282 into focus, followed by $95,645.
🟢 Bullish Scenario
BTC has recovered strongly from the lower support structure and is now consolidating around $80K–$81K.
Immediate resistance:
$81,262.52
$82,070.90
$82,919.00 — 0.382 Fibonacci
$89,282.29 — 0.5 Fibonacci
$95,645.59 — 0.618 Fibonacci
A clean breakout and sustained close above $82K–$82.92K would provide stronger confirmation of continued recovery.
🎯 Target 1: $82,070.90
🎯 Target 2: $82,919.00 — 0.382 Fibonacci
🎯 Target 3: $89,282.29 — 0.5 Fibonacci
🎯 Target 4: $95,645.59 — 0.618 Fibonacci
🎯 Target 5: $104,705.19 — 0.786 Fibonacci
🎯 Target 6: $112,053.30
🎯 Target 7: $116,245.41 — 1.0 Fibonacci
A confirmed move through the $82.92K zone could strengthen the medium-term recovery structure and bring the $89K–$95K region into focus.
🔴 Pullback Scenario
After the recent expansion from the $75K region toward $81K, a retest of the breakout area would be normal.
Key supports:
$79,168.48
$77,936.12 — 20 EMA
$77,447.85
$77,298.86
$77,111.13
$75,982.16
$75,045.77 — 0.236 Fibonacci
$74,506.24 — 50 EMA
$73,355.02 — 200 EMA
$72,016.82 — 100 EMA
The $77K–$79K zone is particularly important.
If BTC continues to hold this area during a pullback, the current recovery structure remains active.
A sustained loss of $75,045 would weaken the current structure and bring the lower EMA support region back into focus.
🧠 Market Structure & Liquidity
BTC has formed a recovery structure after sweeping liquidity around the $72K–$75K region.
The recent move produced a strong recovery through $75K, followed by a breakout toward $80K–$81K.
BTC is now moving through an important:
Liquidity Sweep → Accumulation → Higher Lows → Breakout → Expansion → Retest → Consolidation → Continuation
structure.
The major upside liquidity and resistance are concentrated around the $81.26K–$82.92K region.
A decisive move through this area would place $89,282 as the next major Fibonacci reference.
📊 RSI Momentum
RSI (14): 63.59
RSI MA: 56.92
RSI has moved above the neutral 50 level and remains firmly in positive territory after the recent expansion.
The current reading around 63.59 shows stronger short-term momentum while remaining below the traditional 70 overbought threshold.
A sustained RSI above 60 would keep momentum supportive, while a move back below 50 would indicate increasing short-term weakness.
🎯 Key Levels
🔴 Major Resistance:
$81,262.52 → $82,070.90 → $82,919.00 → $89,282.29 → $95,645.59
🟢 Major Support:
$79,168.48 → $77,936.12 → $77,447.85 → $77,298.86 → $77,111.13 → $75,982.16 → $75,045.77
📉 Dynamic EMA Support:
$77,936.12 — 20 EMA | $74,506.24 — 50 EMA | $73,355.02 — 200 EMA | $72,016.82 — 100 EMA
🚀 Upside References:
$82,919 → $89,282 → $95,645 → $104,705 → $112,053 → $116,245
📌 Final Outlook
BTC's broader structure has strengthened after the recent recovery, with price now holding around $81K and above the major $75K–$79K support structure.
The $77K–$79K area is now an important short-term support region, while $81.26K–$82.92K remains the immediate major resistance zone.
A confirmed move above $82,919 could open the path toward $89,282, followed by $95,645 and $104,705.
However, rejection from the upper resistance area followed by a sustained loss of $75,045 would weaken the current recovery structure and bring the lower support zones back into focus.
Bias: 🟢 Recovery structure intact above $75,045. A sustained move above $82,919 could open the path toward $89,282, with $95,645 as the next major Fibonacci reference.
$BTC
{future}(BTCUSDT)
BTC Technical Outlook: Bitcoin Reclaims $81K as Recovery Structure Strengthens
BTC is currently trading around $81,058, holding above the $79K–$80K region after the recent recovery from the $72K–$75K support area.
The broader structure has improved, with price reclaiming the $80K area and moving back toward the major $81.26K–$82.92K resistance zone. A sustained move through this area would put the higher Fibonacci levels back into focus.
📈 EMA Structure
20 EMA: $77,936.12
50 EMA: $74,506.24
100 EMA: $72,016.82
200 EMA: $73,355.02
BTC is currently trading well above the 20 EMA at $77,936.
The recovery above the 50 EMA at $74,506, 100 EMA at $72,016, and 200 EMA at $73,355 keeps the broader recovery structure constructive.
The 20 EMA remains above the longer-term EMA levels, showing improving short-term structure.
The $77.9K area remains an important dynamic support during any short-term pullback.
📐 Fibonacci Levels
Key Fibonacci levels:
0.236: $75,045.77
0.382: $82,919.00
0.5: $89,282.29
0.618: $95,645.59
0.786: $104,705.19
1.0: $116,245.41
BTC is currently trading above the 0.236 Fibonacci level at $75,045.77.
The next major Fibonacci reference is $82,919 — 0.382 Fib.
A sustained move above the $81K–$82.9K resistance area could bring $89,282 into focus, followed by $95,645.
🟢 Bullish Scenario
BTC has recovered strongly from the lower support structure and is now consolidating around $80K–$81K.
Immediate resistance:
$81,262.52
$82,070.90
$82,919.00 — 0.382 Fibonacci
$89,282.29 — 0.5 Fibonacci
$95,645.59 — 0.618 Fibonacci
A clean breakout and sustained close above $82K–$82.92K would provide stronger confirmation of continued recovery.
🎯 Target 1: $82,070.90
🎯 Target 2: $82,919.00 — 0.382 Fibonacci
🎯 Target 3: $89,282.29 — 0.5 Fibonacci
🎯 Target 4: $95,645.59 — 0.618 Fibonacci
🎯 Target 5: $104,705.19 — 0.786 Fibonacci
🎯 Target 6: $112,053.30
🎯 Target 7: $116,245.41 — 1.0 Fibonacci
A confirmed move through the $82.92K zone could strengthen the medium-term recovery structure and bring the $89K–$95K region into focus.
🔴 Pullback Scenario
After the recent expansion from the $75K region toward $81K, a retest of the breakout area would be normal.
Key supports:
$79,168.48
$77,936.12 — 20 EMA
$77,447.85
$77,298.86
$77,111.13
$75,982.16
$75,045.77 — 0.236 Fibonacci
$74,506.24 — 50 EMA
$73,355.02 — 200 EMA
$72,016.82 — 100 EMA
The $77K–$79K zone is particularly important.
If BTC continues to hold this area during a pullback, the current recovery structure remains active.
A sustained loss of $75,045 would weaken the current structure and bring the lower EMA support region back into focus.
🧠 Market Structure & Liquidity
BTC has formed a recovery structure after sweeping liquidity around the $72K–$75K region.
The recent move produced a strong recovery through $75K, followed by a breakout toward $80K–$81K.
BTC is now moving through an important:
Liquidity Sweep → Accumulation → Higher Lows → Breakout → Expansion → Retest → Consolidation → Continuation
structure.
The major upside liquidity and resistance are concentrated around the $81.26K–$82.92K region.
A decisive move through this area would place $89,282 as the next major Fibonacci reference.
📊 RSI Momentum
RSI (14): 63.59
RSI MA: 56.92
RSI has moved above the neutral 50 level and remains firmly in positive territory after the recent expansion.
The current reading around 63.59 shows stronger short-term momentum while remaining below the traditional 70 overbought threshold.
A sustained RSI above 60 would keep momentum supportive, while a move back below 50 would indicate increasing short-term weakness.
🎯 Key Levels
🔴 Major Resistance:
$81,262.52 → $82,070.90 → $82,919.00 → $89,282.29 → $95,645.59
🟢 Major Support:
$79,168.48 → $77,936.12 → $77,447.85 → $77,298.86 → $77,111.13 → $75,982.16 → $75,045.77
📉 Dynamic EMA Support:
$77,936.12 — 20 EMA | $74,506.24 — 50 EMA | $73,355.02 — 200 EMA | $72,016.82 — 100 EMA
🚀 Upside References:
$82,919 → $89,282 → $95,645 → $104,705 → $112,053 → $116,245
📌 Final Outlook
BTC's broader structure has strengthened after the recent recovery, with price now holding around $81K and above the major $75K–$79K support structure.
The $77K–$79K area is now an important short-term support region, while $81.26K–$82.92K remains the immediate major resistance zone.
A confirmed move above $82,919 could open the path toward $89,282, followed by $95,645 and $104,705.
However, rejection from the upper resistance area followed by a sustained loss of $75,045 would weaken the current recovery structure and bring the lower support zones back into focus.
Bias: 🟢 Recovery structure intact above $75,045. A sustained move above $82,919 could open the path toward $89,282, with $95,645 as the next major Fibonacci reference.
$BTC
The broader structure has improved, with price reclaiming the $80K area and moving back toward the major $81.26K–$82.92K resistance zone. A sustained move through this area would put the higher Fibonacci levels back into focus.
📈 EMA Structure
20 EMA: $77,936.12
50 EMA: $74,506.24
100 EMA: $72,016.82
200 EMA: $73,355.02
BTC is currently trading well above the 20 EMA at $77,936.
The recovery above the 50 EMA at $74,506, 100 EMA at $72,016, and 200 EMA at $73,355 keeps the broader recovery structure constructive.
The 20 EMA remains above the longer-term EMA levels, showing improving short-term structure.
The $77.9K area remains an important dynamic support during any short-term pullback.
📐 Fibonacci Levels
Key Fibonacci levels:
0.236: $75,045.77
0.382: $82,919.00
0.5: $89,282.29
0.618: $95,645.59
0.786: $104,705.19
1.0: $116,245.41
BTC is currently trading above the 0.236 Fibonacci level at $75,045.77.
The next major Fibonacci reference is $82,919 — 0.382 Fib.
A sustained move above the $81K–$82.9K resistance area could bring $89,282 into focus, followed by $95,645.
🟢 Bullish Scenario
BTC has recovered strongly from the lower support structure and is now consolidating around $80K–$81K.
Immediate resistance:
$81,262.52
$82,070.90
$82,919.00 — 0.382 Fibonacci
$89,282.29 — 0.5 Fibonacci
$95,645.59 — 0.618 Fibonacci
A clean breakout and sustained close above $82K–$82.92K would provide stronger confirmation of continued recovery.
🎯 Target 1: $82,070.90
🎯 Target 2: $82,919.00 — 0.382 Fibonacci
🎯 Target 3: $89,282.29 — 0.5 Fibonacci
🎯 Target 4: $95,645.59 — 0.618 Fibonacci
🎯 Target 5: $104,705.19 — 0.786 Fibonacci
🎯 Target 6: $112,053.30
🎯 Target 7: $116,245.41 — 1.0 Fibonacci
A confirmed move through the $82.92K zone could strengthen the medium-term recovery structure and bring the $89K–$95K region into focus.
🔴 Pullback Scenario
After the recent expansion from the $75K region toward $81K, a retest of the breakout area would be normal.
Key supports:
$79,168.48
$77,936.12 — 20 EMA
$77,447.85
$77,298.86
$77,111.13
$75,982.16
$75,045.77 — 0.236 Fibonacci
$74,506.24 — 50 EMA
$73,355.02 — 200 EMA
$72,016.82 — 100 EMA
The $77K–$79K zone is particularly important.
If BTC continues to hold this area during a pullback, the current recovery structure remains active.
A sustained loss of $75,045 would weaken the current structure and bring the lower EMA support region back into focus.
🧠 Market Structure & Liquidity
BTC has formed a recovery structure after sweeping liquidity around the $72K–$75K region.
The recent move produced a strong recovery through $75K, followed by a breakout toward $80K–$81K.
BTC is now moving through an important:
Liquidity Sweep → Accumulation → Higher Lows → Breakout → Expansion → Retest → Consolidation → Continuation
structure.
The major upside liquidity and resistance are concentrated around the $81.26K–$82.92K region.
A decisive move through this area would place $89,282 as the next major Fibonacci reference.
📊 RSI Momentum
RSI (14): 63.59
RSI MA: 56.92
RSI has moved above the neutral 50 level and remains firmly in positive territory after the recent expansion.
The current reading around 63.59 shows stronger short-term momentum while remaining below the traditional 70 overbought threshold.
A sustained RSI above 60 would keep momentum supportive, while a move back below 50 would indicate increasing short-term weakness.
🎯 Key Levels
🔴 Major Resistance:
$81,262.52 → $82,070.90 → $82,919.00 → $89,282.29 → $95,645.59
🟢 Major Support:
$79,168.48 → $77,936.12 → $77,447.85 → $77,298.86 → $77,111.13 → $75,982.16 → $75,045.77
📉 Dynamic EMA Support:
$77,936.12 — 20 EMA | $74,506.24 — 50 EMA | $73,355.02 — 200 EMA | $72,016.82 — 100 EMA
🚀 Upside References:
$82,919 → $89,282 → $95,645 → $104,705 → $112,053 → $116,245
📌 Final Outlook
BTC's broader structure has strengthened after the recent recovery, with price now holding around $81K and above the major $75K–$79K support structure.
The $77K–$79K area is now an important short-term support region, while $81.26K–$82.92K remains the immediate major resistance zone.
A confirmed move above $82,919 could open the path toward $89,282, followed by $95,645 and $104,705.
However, rejection from the upper resistance area followed by a sustained loss of $75,045 would weaken the current recovery structure and bring the lower support zones back into focus.
Bias: 🟢 Recovery structure intact above $75,045. A sustained move above $82,919 could open the path toward $89,282, with $95,645 as the next major Fibonacci reference.
$BTC
43
·
--
ලිපිය
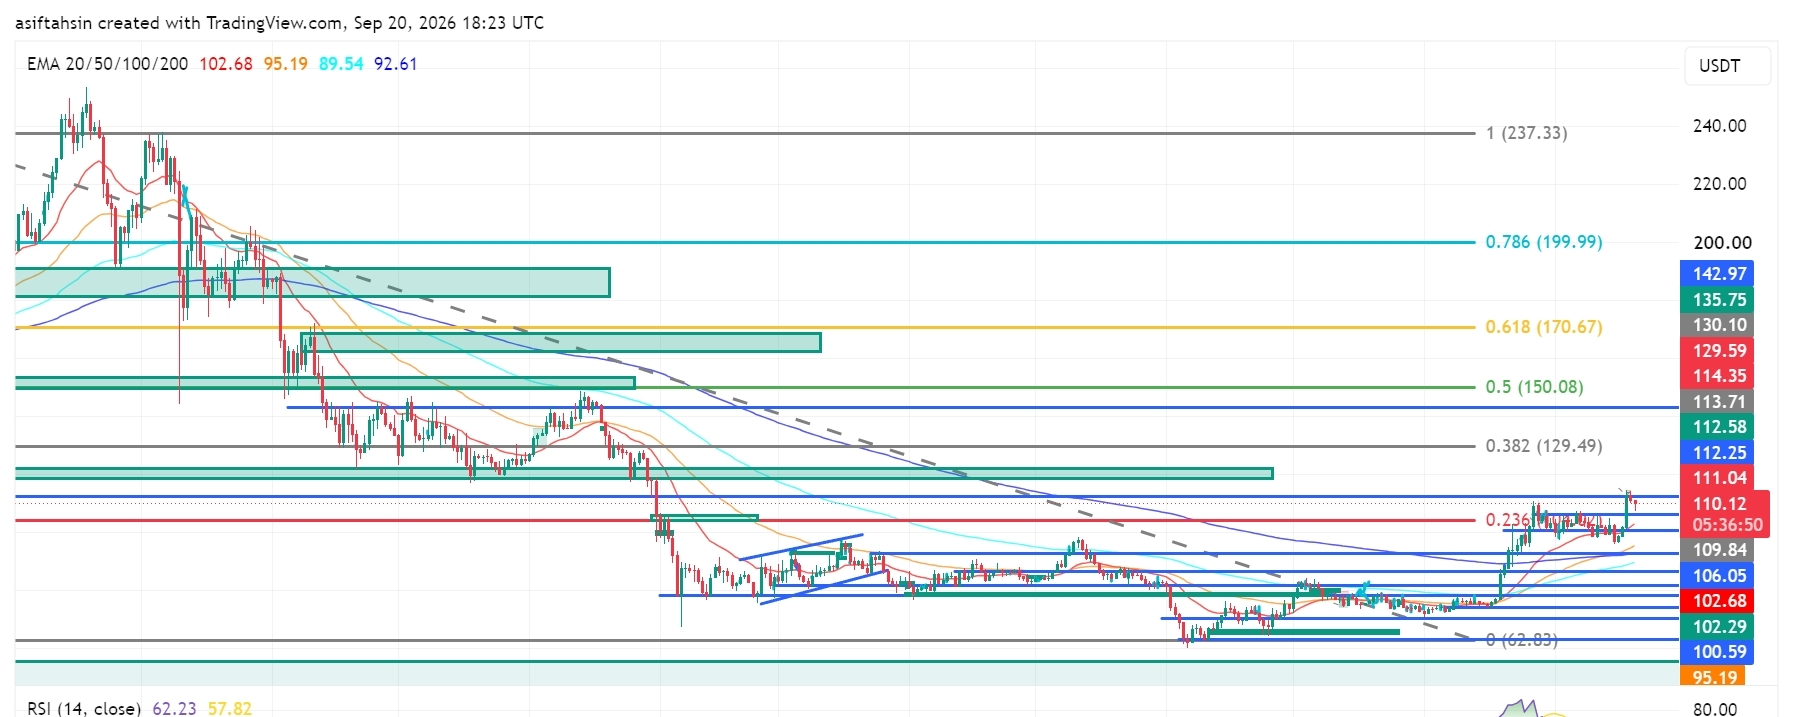
SOL टेक्निकल आउटलुक: सोलाना $110 वापस लेता है क्योंकि रिकवरी संरचना मजबूत होती हैSOL अभी लगभग $110.1 के आसपास ट्रेड कर रहा है; हालिया रिकवरी में $92–$100 सपोर्ट एरिया से उठने के बाद $106–$109 क्षेत्र के ऊपर बना हुआ है।
व्यापक संरचना में सुधार हुआ है; कीमत $100 क्षेत्र वापस ले रही है और $111–$114 के प्रमुख रेजिस्टेंस ज़ोन की ओर बढ़ रही है। इस क्षेत्र के माध्यम से एक निरंतर चाल उच्च फाइबोनैचि स्तरों को फिर से फोकस में लाएगी।
📈 EMA संरचना
20 EMA: $102.68
50 EMA: $95.19
100 EMA: $89.54
200 EMA: $92.61
SOL अभी $102.68 पर 20 EMA के काफी ऊपर ट्रेड कर रहा है।
$95.19 पर 50 EMA, $89.54 पर 100 EMA, और $92.61 पर 200 EMA के ऊपर रिकवरी जारी रहने से व्यापक रिकवरी संरचना सकारात्मक बनी हुई है।
SOL टेक्निकल आउटलुक: सोलाना $110 वापस लेता है क्योंकि रिकवरी संरचना मजबूत होती है
SOL अभी लगभग $110.1 के आसपास ट्रेड कर रहा है; हालिया रिकवरी में $92–$100 सपोर्ट एरिया से उठने के बाद $106–$109 क्षेत्र के ऊपर बना हुआ है।
व्यापक संरचना में सुधार हुआ है; कीमत $100 क्षेत्र वापस ले रही है और $111–$114 के प्रमुख रेजिस्टेंस ज़ोन की ओर बढ़ रही है। इस क्षेत्र के माध्यम से एक निरंतर चाल उच्च फाइबोनैचि स्तरों को फिर से फोकस में लाएगी।
📈 EMA संरचना
20 EMA: $102.68
50 EMA: $95.19
100 EMA: $89.54
200 EMA: $92.61
SOL अभी $102.68 पर 20 EMA के काफी ऊपर ट्रेड कर रहा है।
$95.19 पर 50 EMA, $89.54 पर 100 EMA, और $92.61 पर 200 EMA के ऊपर रिकवरी जारी रहने से व्यापक रिकवरी संरचना सकारात्मक बनी हुई है।
व्यापक संरचना में सुधार हुआ है; कीमत $100 क्षेत्र वापस ले रही है और $111–$114 के प्रमुख रेजिस्टेंस ज़ोन की ओर बढ़ रही है। इस क्षेत्र के माध्यम से एक निरंतर चाल उच्च फाइबोनैचि स्तरों को फिर से फोकस में लाएगी।
📈 EMA संरचना
20 EMA: $102.68
50 EMA: $95.19
100 EMA: $89.54
200 EMA: $92.61
SOL अभी $102.68 पर 20 EMA के काफी ऊपर ट्रेड कर रहा है।
$95.19 पर 50 EMA, $89.54 पर 100 EMA, और $92.61 पर 200 EMA के ऊपर रिकवरी जारी रहने से व्यापक रिकवरी संरचना सकारात्मक बनी हुई है।
1.1k
·
--
ලිපිය
පරිවර්තනය බලන්න
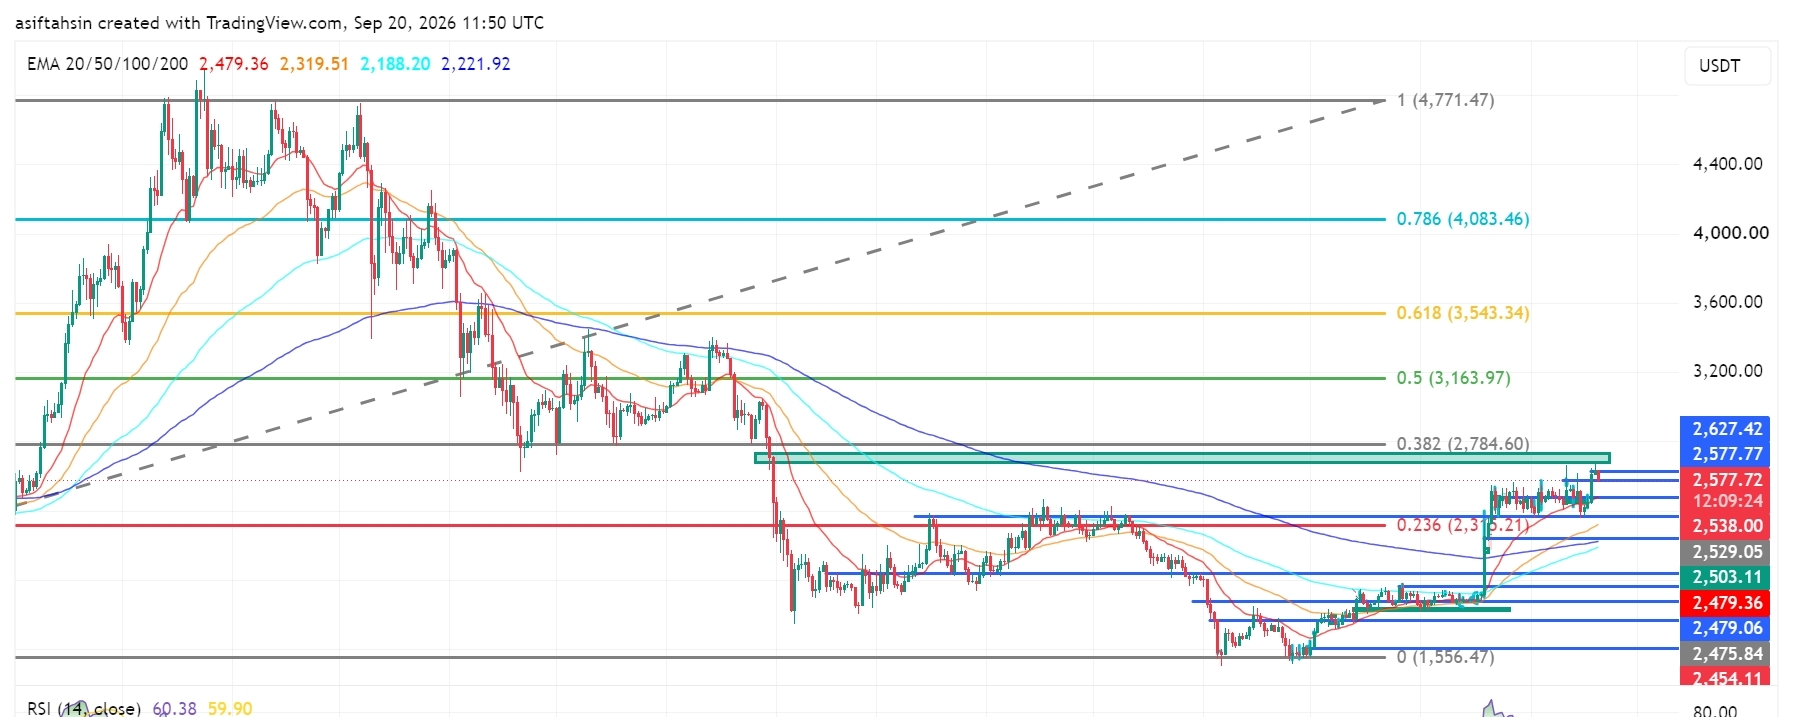
ETH Technical Outlook: Ethereum Holds Near $2.58K as Recovery ContinuesETH is currently trading around $2,577, holding above the $2,500–$2,540 support area after the recent recovery from the $2,280–$2,360 demand zone.
The broader recovery structure remains constructive, with price now approaching the important $2,627–$2,785 resistance zone. The $2,784.60 level is the major 0.382 Fibonacci reference on the chart.
📈 EMA Structure
20 EMA: $2,479.36
50 EMA: $2,319.51
100 EMA: $2,188.20
200 EMA: $2,221.92
ETH is currently trading well above the 20 EMA at $2,479.36.
The recovery above the 50 EMA at $2,319.51, 100 EMA at $2,188.20, and 200 EMA at $2,221.92 keeps the broader recovery structure constructive.
The 20 EMA is now acting as an important dynamic reference. A sustained hold above this level would keep the short-term structure supported.
📐 Fibonacci Levels
Key Fibonacci levels:
0.236: $2,315.21
0.382: $2,784.60
0.5: $3,163.97
0.618: $3,543.34
0.786: $4,083.46
1.0: $4,771.47
ETH has moved significantly above the 0.236 Fibonacci level at $2,315.21.
The next major Fibonacci resistance is $2,784.60 — 0.382 Fib.
A sustained move through the $2,627–$2,785 resistance structure would bring the higher Fibonacci levels into focus.
🟢 Upside Scenario
ETH is consolidating near $2,577 after the recent recovery and is now approaching the upper resistance structure.
Immediate resistance:
$2,577.77
$2,627.42
$2,784.60 — 0.382 Fibonacci
$3,163.97 — 0.5 Fibonacci
$3,543.34 — 0.618 Fibonacci
A clean breakout and sustained close above the $2,627–$2,785 zone would provide stronger confirmation of continued recovery.
🎯 Target 1: $2,627.42
🎯 Target 2: $2,784.60 — 0.382 Fibonacci
🎯 Target 3: $3,163.97 — 0.5 Fibonacci
🎯 Target 4: $3,543.34 — 0.618 Fibonacci
🎯 Target 5: $4,083.46 — 0.786 Fibonacci
🎯 Target 6: $4,771.47 — 1.0 Fibonacci
A sustained move above $2,784.60 could strengthen the medium-term recovery structure and bring the $3,164–$3,543 region into focus.
🔴 Pullback Scenario
After the recent expansion, a retest of the breakout area would be normal.
Key supports:
$2,538.00
$2,529.05
$2,503.11
$2,479.36 — 20 EMA
$2,479.06
$2,475.84
$2,454.11
$2,405.75
$2,319.51 — 50 EMA
The $2,475–$2,540 zone is particularly important.
If ETH continues to hold this area during a pullback, the current recovery structure remains active.
A sustained loss of the $2,475–$2,454 area would weaken the short-term structure and could expose the lower $2,405–$2,320 region.
🧠 Market Structure & Liquidity
ETH has formed a clear recovery structure after sweeping liquidity around the $2,280–$2,360 region.
The recent move produced a strong breakout from the previous consolidation and pushed price toward the $2,600 area.
ETH is now moving through an important:
Recovery → Breakout → Consolidation → Continuation
structure.
The major upside liquidity is concentrated around $2,627–$2,785. A decisive move through this zone would place $3,163.97 as the next major Fibonacci reference.
📊 RSI Momentum
RSI (14): 60.38
RSI remains above the neutral 50 level and is currently around 60, showing positive momentum.
The RSI signal line is around 59.90, keeping momentum relatively balanced near the 60 area.
A sustained RSI above 60 would support continued momentum, while a move back below 50 would indicate increasing short-term weakness.
🎯 Key Levels
🔴 Major Resistance: $2,627.42 → $2,784.60 → $3,163.97 → $3,543.34
🟢 Major Support: $2,538.00 → $2,529.05 → $2,503.11 → $2,479.36 → $2,454.11
📉 Dynamic EMA Support: $2,479.36 — 20 EMA | $2,319.51 — 50 EMA | $2,221.92 — 200 EMA | $2,188.20 — 100 EMA
🚀 Upside References: $2,784.60 → $3,163.97 → $3,543.34 → $4,083.46
📌 Final Outlook
ETH's broader structure remains constructive after the recent recovery, with price now holding around $2,577 and above the major $2,475–$2,540 support structure.
The $2,475–$2,540 area is now an important short-term support region, while $2,627–$2,785 remains the immediate major resistance zone.
A confirmed move above $2,784.60 could open the path toward $3,163.97, followed by $3,543.34 and potentially $4,083.46.
However, rejection from the upper resistance area followed by a sustained loss of $2,454.11 would weaken the current structure and bring the lower support zones back into focus.
Bias: 🟢 Recovery structure intact above $2,454.11. A sustained move above $2,784.60 could open the path toward $3,163.97, with $3,543.34 as the next major Fibonacci reference.
$ETH
{future}(ETHUSDT)
ETH Technical Outlook: Ethereum Holds Near $2.58K as Recovery Continues
ETH is currently trading around $2,577, holding above the $2,500–$2,540 support area after the recent recovery from the $2,280–$2,360 demand zone.
The broader recovery structure remains constructive, with price now approaching the important $2,627–$2,785 resistance zone. The $2,784.60 level is the major 0.382 Fibonacci reference on the chart.
📈 EMA Structure
20 EMA: $2,479.36
50 EMA: $2,319.51
100 EMA: $2,188.20
200 EMA: $2,221.92
ETH is currently trading well above the 20 EMA at $2,479.36.
The recovery above the 50 EMA at $2,319.51, 100 EMA at $2,188.20, and 200 EMA at $2,221.92 keeps the broader recovery structure constructive.
The 20 EMA is now acting as an important dynamic reference. A sustained hold above this level would keep the short-term structure supported.
📐 Fibonacci Levels
Key Fibonacci levels:
0.236: $2,315.21
0.382: $2,784.60
0.5: $3,163.97
0.618: $3,543.34
0.786: $4,083.46
1.0: $4,771.47
ETH has moved significantly above the 0.236 Fibonacci level at $2,315.21.
The next major Fibonacci resistance is $2,784.60 — 0.382 Fib.
A sustained move through the $2,627–$2,785 resistance structure would bring the higher Fibonacci levels into focus.
🟢 Upside Scenario
ETH is consolidating near $2,577 after the recent recovery and is now approaching the upper resistance structure.
Immediate resistance:
$2,577.77
$2,627.42
$2,784.60 — 0.382 Fibonacci
$3,163.97 — 0.5 Fibonacci
$3,543.34 — 0.618 Fibonacci
A clean breakout and sustained close above the $2,627–$2,785 zone would provide stronger confirmation of continued recovery.
🎯 Target 1: $2,627.42
🎯 Target 2: $2,784.60 — 0.382 Fibonacci
🎯 Target 3: $3,163.97 — 0.5 Fibonacci
🎯 Target 4: $3,543.34 — 0.618 Fibonacci
🎯 Target 5: $4,083.46 — 0.786 Fibonacci
🎯 Target 6: $4,771.47 — 1.0 Fibonacci
A sustained move above $2,784.60 could strengthen the medium-term recovery structure and bring the $3,164–$3,543 region into focus.
🔴 Pullback Scenario
After the recent expansion, a retest of the breakout area would be normal.
Key supports:
$2,538.00
$2,529.05
$2,503.11
$2,479.36 — 20 EMA
$2,479.06
$2,475.84
$2,454.11
$2,405.75
$2,319.51 — 50 EMA
The $2,475–$2,540 zone is particularly important.
If ETH continues to hold this area during a pullback, the current recovery structure remains active.
A sustained loss of the $2,475–$2,454 area would weaken the short-term structure and could expose the lower $2,405–$2,320 region.
🧠 Market Structure & Liquidity
ETH has formed a clear recovery structure after sweeping liquidity around the $2,280–$2,360 region.
The recent move produced a strong breakout from the previous consolidation and pushed price toward the $2,600 area.
ETH is now moving through an important:
Recovery → Breakout → Consolidation → Continuation
structure.
The major upside liquidity is concentrated around $2,627–$2,785. A decisive move through this zone would place $3,163.97 as the next major Fibonacci reference.
📊 RSI Momentum
RSI (14): 60.38
RSI remains above the neutral 50 level and is currently around 60, showing positive momentum.
The RSI signal line is around 59.90, keeping momentum relatively balanced near the 60 area.
A sustained RSI above 60 would support continued momentum, while a move back below 50 would indicate increasing short-term weakness.
🎯 Key Levels
🔴 Major Resistance: $2,627.42 → $2,784.60 → $3,163.97 → $3,543.34
🟢 Major Support: $2,538.00 → $2,529.05 → $2,503.11 → $2,479.36 → $2,454.11
📉 Dynamic EMA Support: $2,479.36 — 20 EMA | $2,319.51 — 50 EMA | $2,221.92 — 200 EMA | $2,188.20 — 100 EMA
🚀 Upside References: $2,784.60 → $3,163.97 → $3,543.34 → $4,083.46
📌 Final Outlook
ETH's broader structure remains constructive after the recent recovery, with price now holding around $2,577 and above the major $2,475–$2,540 support structure.
The $2,475–$2,540 area is now an important short-term support region, while $2,627–$2,785 remains the immediate major resistance zone.
A confirmed move above $2,784.60 could open the path toward $3,163.97, followed by $3,543.34 and potentially $4,083.46.
However, rejection from the upper resistance area followed by a sustained loss of $2,454.11 would weaken the current structure and bring the lower support zones back into focus.
Bias: 🟢 Recovery structure intact above $2,454.11. A sustained move above $2,784.60 could open the path toward $3,163.97, with $3,543.34 as the next major Fibonacci reference.
$ETH
The broader recovery structure remains constructive, with price now approaching the important $2,627–$2,785 resistance zone. The $2,784.60 level is the major 0.382 Fibonacci reference on the chart.
📈 EMA Structure
20 EMA: $2,479.36
50 EMA: $2,319.51
100 EMA: $2,188.20
200 EMA: $2,221.92
ETH is currently trading well above the 20 EMA at $2,479.36.
The recovery above the 50 EMA at $2,319.51, 100 EMA at $2,188.20, and 200 EMA at $2,221.92 keeps the broader recovery structure constructive.
The 20 EMA is now acting as an important dynamic reference. A sustained hold above this level would keep the short-term structure supported.
📐 Fibonacci Levels
Key Fibonacci levels:
0.236: $2,315.21
0.382: $2,784.60
0.5: $3,163.97
0.618: $3,543.34
0.786: $4,083.46
1.0: $4,771.47
ETH has moved significantly above the 0.236 Fibonacci level at $2,315.21.
The next major Fibonacci resistance is $2,784.60 — 0.382 Fib.
A sustained move through the $2,627–$2,785 resistance structure would bring the higher Fibonacci levels into focus.
🟢 Upside Scenario
ETH is consolidating near $2,577 after the recent recovery and is now approaching the upper resistance structure.
Immediate resistance:
$2,577.77
$2,627.42
$2,784.60 — 0.382 Fibonacci
$3,163.97 — 0.5 Fibonacci
$3,543.34 — 0.618 Fibonacci
A clean breakout and sustained close above the $2,627–$2,785 zone would provide stronger confirmation of continued recovery.
🎯 Target 1: $2,627.42
🎯 Target 2: $2,784.60 — 0.382 Fibonacci
🎯 Target 3: $3,163.97 — 0.5 Fibonacci
🎯 Target 4: $3,543.34 — 0.618 Fibonacci
🎯 Target 5: $4,083.46 — 0.786 Fibonacci
🎯 Target 6: $4,771.47 — 1.0 Fibonacci
A sustained move above $2,784.60 could strengthen the medium-term recovery structure and bring the $3,164–$3,543 region into focus.
🔴 Pullback Scenario
After the recent expansion, a retest of the breakout area would be normal.
Key supports:
$2,538.00
$2,529.05
$2,503.11
$2,479.36 — 20 EMA
$2,479.06
$2,475.84
$2,454.11
$2,405.75
$2,319.51 — 50 EMA
The $2,475–$2,540 zone is particularly important.
If ETH continues to hold this area during a pullback, the current recovery structure remains active.
A sustained loss of the $2,475–$2,454 area would weaken the short-term structure and could expose the lower $2,405–$2,320 region.
🧠 Market Structure & Liquidity
ETH has formed a clear recovery structure after sweeping liquidity around the $2,280–$2,360 region.
The recent move produced a strong breakout from the previous consolidation and pushed price toward the $2,600 area.
ETH is now moving through an important:
Recovery → Breakout → Consolidation → Continuation
structure.
The major upside liquidity is concentrated around $2,627–$2,785. A decisive move through this zone would place $3,163.97 as the next major Fibonacci reference.
📊 RSI Momentum
RSI (14): 60.38
RSI remains above the neutral 50 level and is currently around 60, showing positive momentum.
The RSI signal line is around 59.90, keeping momentum relatively balanced near the 60 area.
A sustained RSI above 60 would support continued momentum, while a move back below 50 would indicate increasing short-term weakness.
🎯 Key Levels
🔴 Major Resistance: $2,627.42 → $2,784.60 → $3,163.97 → $3,543.34
🟢 Major Support: $2,538.00 → $2,529.05 → $2,503.11 → $2,479.36 → $2,454.11
📉 Dynamic EMA Support: $2,479.36 — 20 EMA | $2,319.51 — 50 EMA | $2,221.92 — 200 EMA | $2,188.20 — 100 EMA
🚀 Upside References: $2,784.60 → $3,163.97 → $3,543.34 → $4,083.46
📌 Final Outlook
ETH's broader structure remains constructive after the recent recovery, with price now holding around $2,577 and above the major $2,475–$2,540 support structure.
The $2,475–$2,540 area is now an important short-term support region, while $2,627–$2,785 remains the immediate major resistance zone.
A confirmed move above $2,784.60 could open the path toward $3,163.97, followed by $3,543.34 and potentially $4,083.46.
However, rejection from the upper resistance area followed by a sustained loss of $2,454.11 would weaken the current structure and bring the lower support zones back into focus.
Bias: 🟢 Recovery structure intact above $2,454.11. A sustained move above $2,784.60 could open the path toward $3,163.97, with $3,543.34 as the next major Fibonacci reference.
$ETH
65
·
--
ලිපිය
පරිවර්තනය බලන්න
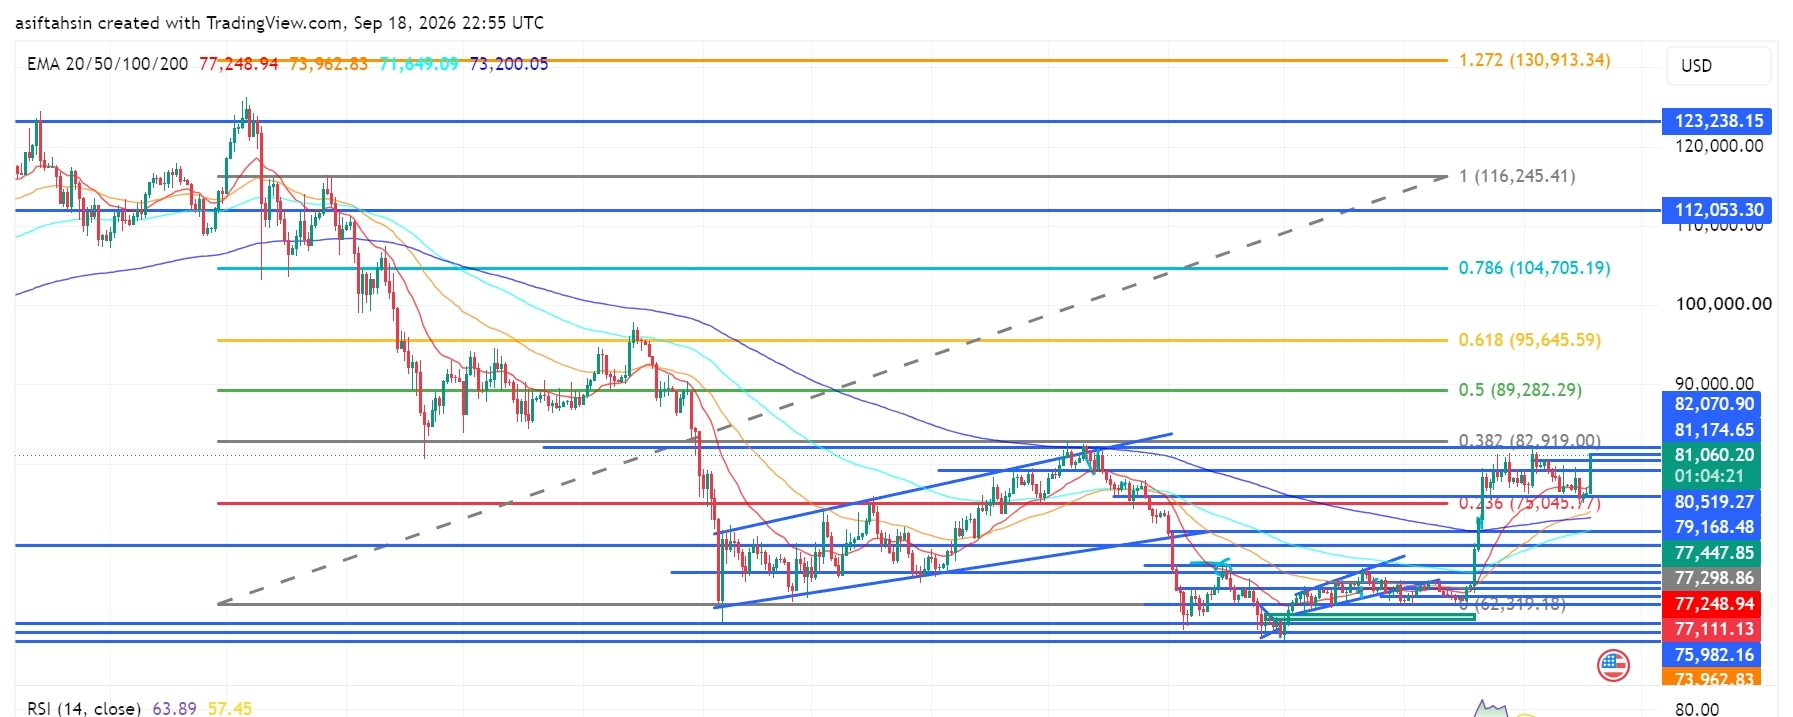
BTC Technical Outlook: Bitcoin Reclaims $81K as Recovery Structure StrengthensBTC is currently trading around $81,060, holding above the $79,000–$80,000 region after the recent recovery from the $73,000–$76,000 demand area.
The broader structure has improved, with price reclaiming the $80K area and moving back toward the major $82,070–$82,919 resistance zone. A sustained move through this area would put the higher Fibonacci levels back into focus.
📈 EMA Structure
20 EMA: $77,248.95
50 EMA: $73,962.83
100 EMA: $71,649.09
200 EMA: $73,200.05
BTC is currently trading well above the 20 EMA at $77,248.95.
The recovery above the 50 EMA at $73,962.83, 100 EMA at $71,649.09, and 200 EMA at $73,200.05 keeps the broader recovery structure constructive.
The 20 EMA has moved above the longer-term EMA levels, showing improving short-term structure.
📐 Fibonacci Levels
Key Fibonacci levels:
0.236: $75,045.77
0.382: $82,919.00
0.5: $89,282.29
0.618: $95,645.59
0.786: $104,705.19
1.0: $116,245.41
1.272: $130,913.34
BTC is currently trading between the 0.236 and 0.382 Fibonacci levels.
The next major Fibonacci reference is $82,919 — 0.382 Fib.
A sustained move above the $82,070–$82,919 zone could bring $89,282 into focus, followed by $95,645.
🟢 Bullish Scenario
BTC has recovered strongly from the lower support structure and is now consolidating around $80K–$81K.
Immediate resistance:
$81,174.65
$82,070.90
$82,919.00 — 0.382 Fibonacci
$89,282.29 — 0.5 Fibonacci
$95,645.59 — 0.618 Fibonacci
A clean breakout and sustained close above $82,070–$82,919 would provide stronger confirmation of continued recovery.
🎯 Target 1: $82,070
🎯 Target 2: $82,919 — 0.382 Fibonacci
🎯 Target 3: $89,282 — 0.5 Fibonacci
🎯 Target 4: $95,645 — 0.618 Fibonacci
🎯 Target 5: $104,705 — 0.786 Fibonacci
🎯 Target 6: $116,245 — 1.0 Fibonacci
A confirmed move through the $82K–$83K zone could strengthen the medium-term recovery structure and bring the $89K–$95K region into focus.
🔴 Pullback Scenario
After the recent expansion above $80K, a retest of the breakout area would be normal.
Key supports:
$80,519.27
$79,168.48
$77,447.85
$77,298.86
$77,248.95 — 20 EMA
$77,111.13
$75,982.16
$75,045.77 — 0.236 Fibonacci
$73,962.83 — 50 EMA
$73,200.05 — 200 EMA
The $77K–$80K zone is particularly important.
If BTC continues to hold this area during a pullback, the current recovery structure remains active.
A sustained loss of $75,045 would weaken the current recovery structure and bring the lower EMA region back into focus.
🧠 Market Structure & Liquidity
BTC has formed a recovery structure after sweeping liquidity around the $73K–$76K region.
The recent move produced a strong recovery through $77K, followed by a breakout above $80K.
BTC is now moving through an important:
Recovery → Breakout → Retest → Consolidation → Continuation
structure.
The major upside liquidity is concentrated around $81K–$83K. A decisive move through this area would place $89,282 as the next major Fibonacci reference.
📊 RSI Momentum
RSI (14): 63.89
RSI has moved above the neutral 50 level and remains in positive territory after the recent expansion.
The current reading shows stronger short-term momentum, while still remaining below the traditional 70 overbought threshold.
A sustained RSI above 60 would keep momentum supportive, while a move back below 50 would indicate increasing short-term weakness.
🎯 Key Levels
🔴 Major Resistance: $81,174.65 → $82,070.90 → $82,919 → $89,282 → $95,645
🟢 Major Support: $80,519 → $79,168 → $77,447 → $77,249 → $75,982 → $75,045
📉 Dynamic EMA Support: $77,248.95 — 20 EMA | $73,962.83 — 50 EMA | $73,200.05 — 200 EMA | $71,649.09 — 100 EMA
🚀 Upside References: $82,919 → $89,282 → $95,645 → $104,705 → $116,245
📌 Final Outlook
BTC's broader structure has strengthened after the recent recovery, with price now holding around $81K and above the major $77K–$80K support structure.
The $77K–$80K area is now an important short-term support region, while $82K–$83K remains the immediate major resistance zone.
A confirmed move above $82,919 could open the path toward $89,282, followed by $95,645 and $104,705.
However, rejection from the upper resistance area followed by a sustained loss of $75,045 would weaken the current recovery structure and bring the lower support zones back into focus.
Bias: 🟢 Recovery structure intact above $75,045. A sustained move above $82,919 could open the path toward $89,282, with $95,645 as the next major Fibonacci reference.
$BTC
{future}(BTCUSDT)
BTC Technical Outlook: Bitcoin Reclaims $81K as Recovery Structure Strengthens
BTC is currently trading around $81,060, holding above the $79,000–$80,000 region after the recent recovery from the $73,000–$76,000 demand area.
The broader structure has improved, with price reclaiming the $80K area and moving back toward the major $82,070–$82,919 resistance zone. A sustained move through this area would put the higher Fibonacci levels back into focus.
📈 EMA Structure
20 EMA: $77,248.95
50 EMA: $73,962.83
100 EMA: $71,649.09
200 EMA: $73,200.05
BTC is currently trading well above the 20 EMA at $77,248.95.
The recovery above the 50 EMA at $73,962.83, 100 EMA at $71,649.09, and 200 EMA at $73,200.05 keeps the broader recovery structure constructive.
The 20 EMA has moved above the longer-term EMA levels, showing improving short-term structure.
📐 Fibonacci Levels
Key Fibonacci levels:
0.236: $75,045.77
0.382: $82,919.00
0.5: $89,282.29
0.618: $95,645.59
0.786: $104,705.19
1.0: $116,245.41
1.272: $130,913.34
BTC is currently trading between the 0.236 and 0.382 Fibonacci levels.
The next major Fibonacci reference is $82,919 — 0.382 Fib.
A sustained move above the $82,070–$82,919 zone could bring $89,282 into focus, followed by $95,645.
🟢 Bullish Scenario
BTC has recovered strongly from the lower support structure and is now consolidating around $80K–$81K.
Immediate resistance:
$81,174.65
$82,070.90
$82,919.00 — 0.382 Fibonacci
$89,282.29 — 0.5 Fibonacci
$95,645.59 — 0.618 Fibonacci
A clean breakout and sustained close above $82,070–$82,919 would provide stronger confirmation of continued recovery.
🎯 Target 1: $82,070
🎯 Target 2: $82,919 — 0.382 Fibonacci
🎯 Target 3: $89,282 — 0.5 Fibonacci
🎯 Target 4: $95,645 — 0.618 Fibonacci
🎯 Target 5: $104,705 — 0.786 Fibonacci
🎯 Target 6: $116,245 — 1.0 Fibonacci
A confirmed move through the $82K–$83K zone could strengthen the medium-term recovery structure and bring the $89K–$95K region into focus.
🔴 Pullback Scenario
After the recent expansion above $80K, a retest of the breakout area would be normal.
Key supports:
$80,519.27
$79,168.48
$77,447.85
$77,298.86
$77,248.95 — 20 EMA
$77,111.13
$75,982.16
$75,045.77 — 0.236 Fibonacci
$73,962.83 — 50 EMA
$73,200.05 — 200 EMA
The $77K–$80K zone is particularly important.
If BTC continues to hold this area during a pullback, the current recovery structure remains active.
A sustained loss of $75,045 would weaken the current recovery structure and bring the lower EMA region back into focus.
🧠 Market Structure & Liquidity
BTC has formed a recovery structure after sweeping liquidity around the $73K–$76K region.
The recent move produced a strong recovery through $77K, followed by a breakout above $80K.
BTC is now moving through an important:
Recovery → Breakout → Retest → Consolidation → Continuation
structure.
The major upside liquidity is concentrated around $81K–$83K. A decisive move through this area would place $89,282 as the next major Fibonacci reference.
📊 RSI Momentum
RSI (14): 63.89
RSI has moved above the neutral 50 level and remains in positive territory after the recent expansion.
The current reading shows stronger short-term momentum, while still remaining below the traditional 70 overbought threshold.
A sustained RSI above 60 would keep momentum supportive, while a move back below 50 would indicate increasing short-term weakness.
🎯 Key Levels
🔴 Major Resistance: $81,174.65 → $82,070.90 → $82,919 → $89,282 → $95,645
🟢 Major Support: $80,519 → $79,168 → $77,447 → $77,249 → $75,982 → $75,045
📉 Dynamic EMA Support: $77,248.95 — 20 EMA | $73,962.83 — 50 EMA | $73,200.05 — 200 EMA | $71,649.09 — 100 EMA
🚀 Upside References: $82,919 → $89,282 → $95,645 → $104,705 → $116,245
📌 Final Outlook
BTC's broader structure has strengthened after the recent recovery, with price now holding around $81K and above the major $77K–$80K support structure.
The $77K–$80K area is now an important short-term support region, while $82K–$83K remains the immediate major resistance zone.
A confirmed move above $82,919 could open the path toward $89,282, followed by $95,645 and $104,705.
However, rejection from the upper resistance area followed by a sustained loss of $75,045 would weaken the current recovery structure and bring the lower support zones back into focus.
Bias: 🟢 Recovery structure intact above $75,045. A sustained move above $82,919 could open the path toward $89,282, with $95,645 as the next major Fibonacci reference.
$BTC
The broader structure has improved, with price reclaiming the $80K area and moving back toward the major $82,070–$82,919 resistance zone. A sustained move through this area would put the higher Fibonacci levels back into focus.
📈 EMA Structure
20 EMA: $77,248.95
50 EMA: $73,962.83
100 EMA: $71,649.09
200 EMA: $73,200.05
BTC is currently trading well above the 20 EMA at $77,248.95.
The recovery above the 50 EMA at $73,962.83, 100 EMA at $71,649.09, and 200 EMA at $73,200.05 keeps the broader recovery structure constructive.
The 20 EMA has moved above the longer-term EMA levels, showing improving short-term structure.
📐 Fibonacci Levels
Key Fibonacci levels:
0.236: $75,045.77
0.382: $82,919.00
0.5: $89,282.29
0.618: $95,645.59
0.786: $104,705.19
1.0: $116,245.41
1.272: $130,913.34
BTC is currently trading between the 0.236 and 0.382 Fibonacci levels.
The next major Fibonacci reference is $82,919 — 0.382 Fib.
A sustained move above the $82,070–$82,919 zone could bring $89,282 into focus, followed by $95,645.
🟢 Bullish Scenario
BTC has recovered strongly from the lower support structure and is now consolidating around $80K–$81K.
Immediate resistance:
$81,174.65
$82,070.90
$82,919.00 — 0.382 Fibonacci
$89,282.29 — 0.5 Fibonacci
$95,645.59 — 0.618 Fibonacci
A clean breakout and sustained close above $82,070–$82,919 would provide stronger confirmation of continued recovery.
🎯 Target 1: $82,070
🎯 Target 2: $82,919 — 0.382 Fibonacci
🎯 Target 3: $89,282 — 0.5 Fibonacci
🎯 Target 4: $95,645 — 0.618 Fibonacci
🎯 Target 5: $104,705 — 0.786 Fibonacci
🎯 Target 6: $116,245 — 1.0 Fibonacci
A confirmed move through the $82K–$83K zone could strengthen the medium-term recovery structure and bring the $89K–$95K region into focus.
🔴 Pullback Scenario
After the recent expansion above $80K, a retest of the breakout area would be normal.
Key supports:
$80,519.27
$79,168.48
$77,447.85
$77,298.86
$77,248.95 — 20 EMA
$77,111.13
$75,982.16
$75,045.77 — 0.236 Fibonacci
$73,962.83 — 50 EMA
$73,200.05 — 200 EMA
The $77K–$80K zone is particularly important.
If BTC continues to hold this area during a pullback, the current recovery structure remains active.
A sustained loss of $75,045 would weaken the current recovery structure and bring the lower EMA region back into focus.
🧠 Market Structure & Liquidity
BTC has formed a recovery structure after sweeping liquidity around the $73K–$76K region.
The recent move produced a strong recovery through $77K, followed by a breakout above $80K.
BTC is now moving through an important:
Recovery → Breakout → Retest → Consolidation → Continuation
structure.
The major upside liquidity is concentrated around $81K–$83K. A decisive move through this area would place $89,282 as the next major Fibonacci reference.
📊 RSI Momentum
RSI (14): 63.89
RSI has moved above the neutral 50 level and remains in positive territory after the recent expansion.
The current reading shows stronger short-term momentum, while still remaining below the traditional 70 overbought threshold.
A sustained RSI above 60 would keep momentum supportive, while a move back below 50 would indicate increasing short-term weakness.
🎯 Key Levels
🔴 Major Resistance: $81,174.65 → $82,070.90 → $82,919 → $89,282 → $95,645
🟢 Major Support: $80,519 → $79,168 → $77,447 → $77,249 → $75,982 → $75,045
📉 Dynamic EMA Support: $77,248.95 — 20 EMA | $73,962.83 — 50 EMA | $73,200.05 — 200 EMA | $71,649.09 — 100 EMA
🚀 Upside References: $82,919 → $89,282 → $95,645 → $104,705 → $116,245
📌 Final Outlook
BTC's broader structure has strengthened after the recent recovery, with price now holding around $81K and above the major $77K–$80K support structure.
The $77K–$80K area is now an important short-term support region, while $82K–$83K remains the immediate major resistance zone.
A confirmed move above $82,919 could open the path toward $89,282, followed by $95,645 and $104,705.
However, rejection from the upper resistance area followed by a sustained loss of $75,045 would weaken the current recovery structure and bring the lower support zones back into focus.
Bias: 🟢 Recovery structure intact above $75,045. A sustained move above $82,919 could open the path toward $89,282, with $95,645 as the next major Fibonacci reference.
$BTC
12
·
--
ලිපිය
පරිවර්තනය බලන්න
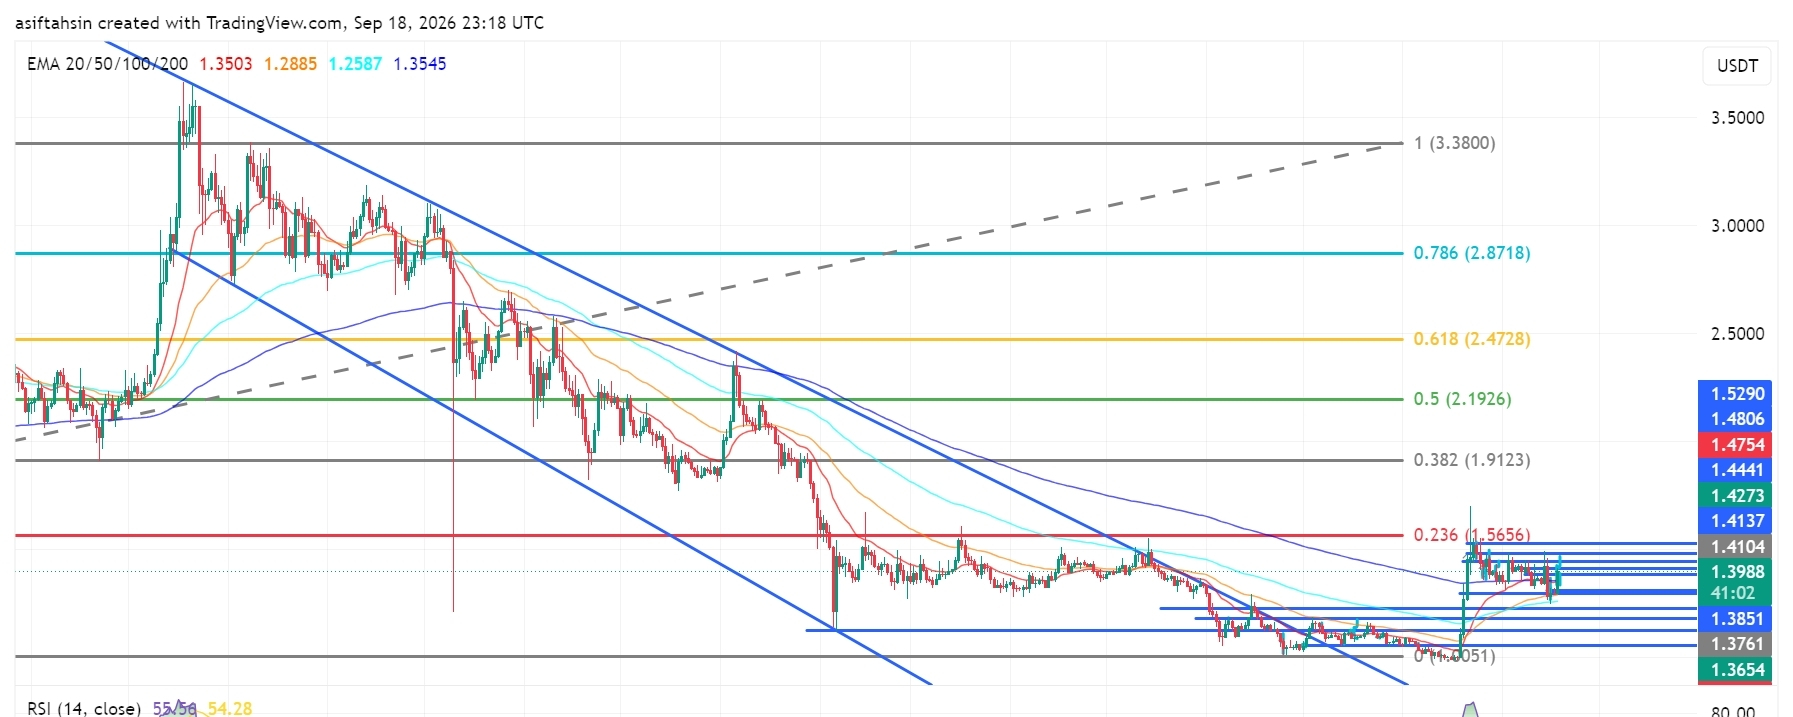
XRP Technical Outlook: XRP Holds Near $1.40 as Bulls Defend the BreakoutXRP is currently trading around $1.40, consolidating after a strong recovery from the August lows and a sharp breakout from the previous descending structure.
The broader structure has improved significantly, with XRP trading above the 20, 50 and 100 EMAs. However, price is now facing an important resistance cluster around $1.41–$1.43. Bulls need a clean breakout above this zone to confirm another upside expansion.
📈 EMA Structure
20 EMA: $1.3503
50 EMA: $1.2885
100 EMA: $1.2586
200 EMA: $1.3545
XRP is currently trading above all four major EMAs, keeping the recovery structure constructive.
The 20 EMA at $1.3503 is the key short-term dynamic support, while the 200 EMA at $1.3545 adds another important layer of support.
As long as XRP holds above the $1.35 area, buyers maintain control of the current recovery structure.
📐 Fibonacci Levels
0.236: $1.5656
0.382: $1.9123
0.5: $2.1926
0.618: $2.4728
0.786: $2.8718
1.0: $3.3800
The $1.5656 0.236 Fibonacci level is the first major higher-timeframe resistance above the current range.
A sustained breakout above $1.5656 could open the way toward $1.9123, followed by the $2.19 region.
🟢 Bullish Scenario
XRP is consolidating just below the $1.4104–$1.4137 resistance area.
A clean breakout and sustained close above $1.4137 could trigger another bullish expansion.
🎯 Target 1: $1.4273
🎯 Target 2: $1.4441
🎯 Target 3: $1.4754
🎯 Target 4: $1.4806
🎯 Target 5: $1.5290
🎯 Target 6: $1.5656
🎯 Target 7: $1.9123
The $1.5656 level is especially important because it represents the next major Fibonacci resistance.
🔴 Pullback Scenario
If XRP fails to break the $1.41–$1.43 resistance cluster, a short-term pullback could develop.
Key supports:
$1.3984
$1.3851
$1.3761
$1.3654
$1.3575
$1.3545 — 200 EMA
$1.3503 — 20 EMA
The $1.3654–$1.3503 region is particularly important.
A successful retest of this area could provide a base for another attempt at the $1.41–$1.43 resistance zone.
A sustained break below the $1.35 area would weaken the current bullish recovery structure.
🧠 Market Structure & Liquidity
XRP's recent structure can be viewed as:
Long Downtrend → Liquidity Sweep → Accumulation → Breakout → Strong Expansion → Consolidation
The major August move produced a strong recovery from the lower liquidity zone and broke the previous descending trend structure.
XRP is now consolidating around $1.38–$1.41, with buyers defending the breakout area.
The next major structural test is $1.4137–$1.4273.
A successful reclaim of this zone would strengthen the continuation setup, while rejection could send price back toward the lower support cluster.
📊 RSI Momentum
RSI: 55.56
RSI MA: 54.28
RSI remains above 50 and is slightly above its moving average, indicating that momentum is still constructive.
However, RSI is far from overbought territory, meaning there is room for momentum to strengthen if XRP breaks above the current resistance.
A move toward 60–65 RSI alongside a breakout would provide stronger confirmation of bullish continuation.
🎯 Key Levels
Resistance:
$1.4104 → $1.4137 → $1.4273 → $1.4441 → $1.4754 → $1.4806 → $1.5290 → $1.5656
Support:
$1.3984 → $1.3851 → $1.3761 → $1.3654 → $1.3575 → $1.3545 → $1.3503
📌 Final Outlook
XRP remains in a constructive recovery structure while holding above the major EMA cluster and the $1.35 area.
The immediate battle is between $1.41 and $1.43. A decisive breakout above this zone could push XRP toward $1.4441 → $1.4754 → $1.5290 → $1.5656.
If XRP fails to break higher, the $1.3851–$1.3503 zone becomes the key downside support area.
Bias: 🟢 Bullish above $1.3503 | Stronger above $1.4137
$XRP
{future}(XRPUSDT)
XRP Technical Outlook: XRP Holds Near $1.40 as Bulls Defend the Breakout
XRP is currently trading around $1.40, consolidating after a strong recovery from the August lows and a sharp breakout from the previous descending structure.
The broader structure has improved significantly, with XRP trading above the 20, 50 and 100 EMAs. However, price is now facing an important resistance cluster around $1.41–$1.43. Bulls need a clean breakout above this zone to confirm another upside expansion.
📈 EMA Structure
20 EMA: $1.3503
50 EMA: $1.2885
100 EMA: $1.2586
200 EMA: $1.3545
XRP is currently trading above all four major EMAs, keeping the recovery structure constructive.
The 20 EMA at $1.3503 is the key short-term dynamic support, while the 200 EMA at $1.3545 adds another important layer of support.
As long as XRP holds above the $1.35 area, buyers maintain control of the current recovery structure.
📐 Fibonacci Levels
0.236: $1.5656
0.382: $1.9123
0.5: $2.1926
0.618: $2.4728
0.786: $2.8718
1.0: $3.3800
The $1.5656 0.236 Fibonacci level is the first major higher-timeframe resistance above the current range.
A sustained breakout above $1.5656 could open the way toward $1.9123, followed by the $2.19 region.
🟢 Bullish Scenario
XRP is consolidating just below the $1.4104–$1.4137 resistance area.
A clean breakout and sustained close above $1.4137 could trigger another bullish expansion.
🎯 Target 1: $1.4273
🎯 Target 2: $1.4441
🎯 Target 3: $1.4754
🎯 Target 4: $1.4806
🎯 Target 5: $1.5290
🎯 Target 6: $1.5656
🎯 Target 7: $1.9123
The $1.5656 level is especially important because it represents the next major Fibonacci resistance.
🔴 Pullback Scenario
If XRP fails to break the $1.41–$1.43 resistance cluster, a short-term pullback could develop.
Key supports:
$1.3984
$1.3851
$1.3761
$1.3654
$1.3575
$1.3545 — 200 EMA
$1.3503 — 20 EMA
The $1.3654–$1.3503 region is particularly important.
A successful retest of this area could provide a base for another attempt at the $1.41–$1.43 resistance zone.
A sustained break below the $1.35 area would weaken the current bullish recovery structure.
🧠 Market Structure & Liquidity
XRP's recent structure can be viewed as:
Long Downtrend → Liquidity Sweep → Accumulation → Breakout → Strong Expansion → Consolidation
The major August move produced a strong recovery from the lower liquidity zone and broke the previous descending trend structure.
XRP is now consolidating around $1.38–$1.41, with buyers defending the breakout area.
The next major structural test is $1.4137–$1.4273.
A successful reclaim of this zone would strengthen the continuation setup, while rejection could send price back toward the lower support cluster.
📊 RSI Momentum
RSI: 55.56
RSI MA: 54.28
RSI remains above 50 and is slightly above its moving average, indicating that momentum is still constructive.
However, RSI is far from overbought territory, meaning there is room for momentum to strengthen if XRP breaks above the current resistance.
A move toward 60–65 RSI alongside a breakout would provide stronger confirmation of bullish continuation.
🎯 Key Levels
Resistance:
$1.4104 → $1.4137 → $1.4273 → $1.4441 → $1.4754 → $1.4806 → $1.5290 → $1.5656
Support:
$1.3984 → $1.3851 → $1.3761 → $1.3654 → $1.3575 → $1.3545 → $1.3503
📌 Final Outlook
XRP remains in a constructive recovery structure while holding above the major EMA cluster and the $1.35 area.
The immediate battle is between $1.41 and $1.43. A decisive breakout above this zone could push XRP toward $1.4441 → $1.4754 → $1.5290 → $1.5656.
If XRP fails to break higher, the $1.3851–$1.3503 zone becomes the key downside support area.
Bias: 🟢 Bullish above $1.3503 | Stronger above $1.4137
$XRP
The broader structure has improved significantly, with XRP trading above the 20, 50 and 100 EMAs. However, price is now facing an important resistance cluster around $1.41–$1.43. Bulls need a clean breakout above this zone to confirm another upside expansion.
📈 EMA Structure
20 EMA: $1.3503
50 EMA: $1.2885
100 EMA: $1.2586
200 EMA: $1.3545
XRP is currently trading above all four major EMAs, keeping the recovery structure constructive.
The 20 EMA at $1.3503 is the key short-term dynamic support, while the 200 EMA at $1.3545 adds another important layer of support.
As long as XRP holds above the $1.35 area, buyers maintain control of the current recovery structure.
📐 Fibonacci Levels
0.236: $1.5656
0.382: $1.9123
0.5: $2.1926
0.618: $2.4728
0.786: $2.8718
1.0: $3.3800
The $1.5656 0.236 Fibonacci level is the first major higher-timeframe resistance above the current range.
A sustained breakout above $1.5656 could open the way toward $1.9123, followed by the $2.19 region.
🟢 Bullish Scenario
XRP is consolidating just below the $1.4104–$1.4137 resistance area.
A clean breakout and sustained close above $1.4137 could trigger another bullish expansion.
🎯 Target 1: $1.4273
🎯 Target 2: $1.4441
🎯 Target 3: $1.4754
🎯 Target 4: $1.4806
🎯 Target 5: $1.5290
🎯 Target 6: $1.5656
🎯 Target 7: $1.9123
The $1.5656 level is especially important because it represents the next major Fibonacci resistance.
🔴 Pullback Scenario
If XRP fails to break the $1.41–$1.43 resistance cluster, a short-term pullback could develop.
Key supports:
$1.3984
$1.3851
$1.3761
$1.3654
$1.3575
$1.3545 — 200 EMA
$1.3503 — 20 EMA
The $1.3654–$1.3503 region is particularly important.
A successful retest of this area could provide a base for another attempt at the $1.41–$1.43 resistance zone.
A sustained break below the $1.35 area would weaken the current bullish recovery structure.
🧠 Market Structure & Liquidity
XRP's recent structure can be viewed as:
Long Downtrend → Liquidity Sweep → Accumulation → Breakout → Strong Expansion → Consolidation
The major August move produced a strong recovery from the lower liquidity zone and broke the previous descending trend structure.
XRP is now consolidating around $1.38–$1.41, with buyers defending the breakout area.
The next major structural test is $1.4137–$1.4273.
A successful reclaim of this zone would strengthen the continuation setup, while rejection could send price back toward the lower support cluster.
📊 RSI Momentum
RSI: 55.56
RSI MA: 54.28
RSI remains above 50 and is slightly above its moving average, indicating that momentum is still constructive.
However, RSI is far from overbought territory, meaning there is room for momentum to strengthen if XRP breaks above the current resistance.
A move toward 60–65 RSI alongside a breakout would provide stronger confirmation of bullish continuation.
🎯 Key Levels
Resistance:
$1.4104 → $1.4137 → $1.4273 → $1.4441 → $1.4754 → $1.4806 → $1.5290 → $1.5656
Support:
$1.3984 → $1.3851 → $1.3761 → $1.3654 → $1.3575 → $1.3545 → $1.3503
📌 Final Outlook
XRP remains in a constructive recovery structure while holding above the major EMA cluster and the $1.35 area.
The immediate battle is between $1.41 and $1.43. A decisive breakout above this zone could push XRP toward $1.4441 → $1.4754 → $1.5290 → $1.5656.
If XRP fails to break higher, the $1.3851–$1.3503 zone becomes the key downside support area.
Bias: 🟢 Bullish above $1.3503 | Stronger above $1.4137
$XRP
276
·
--
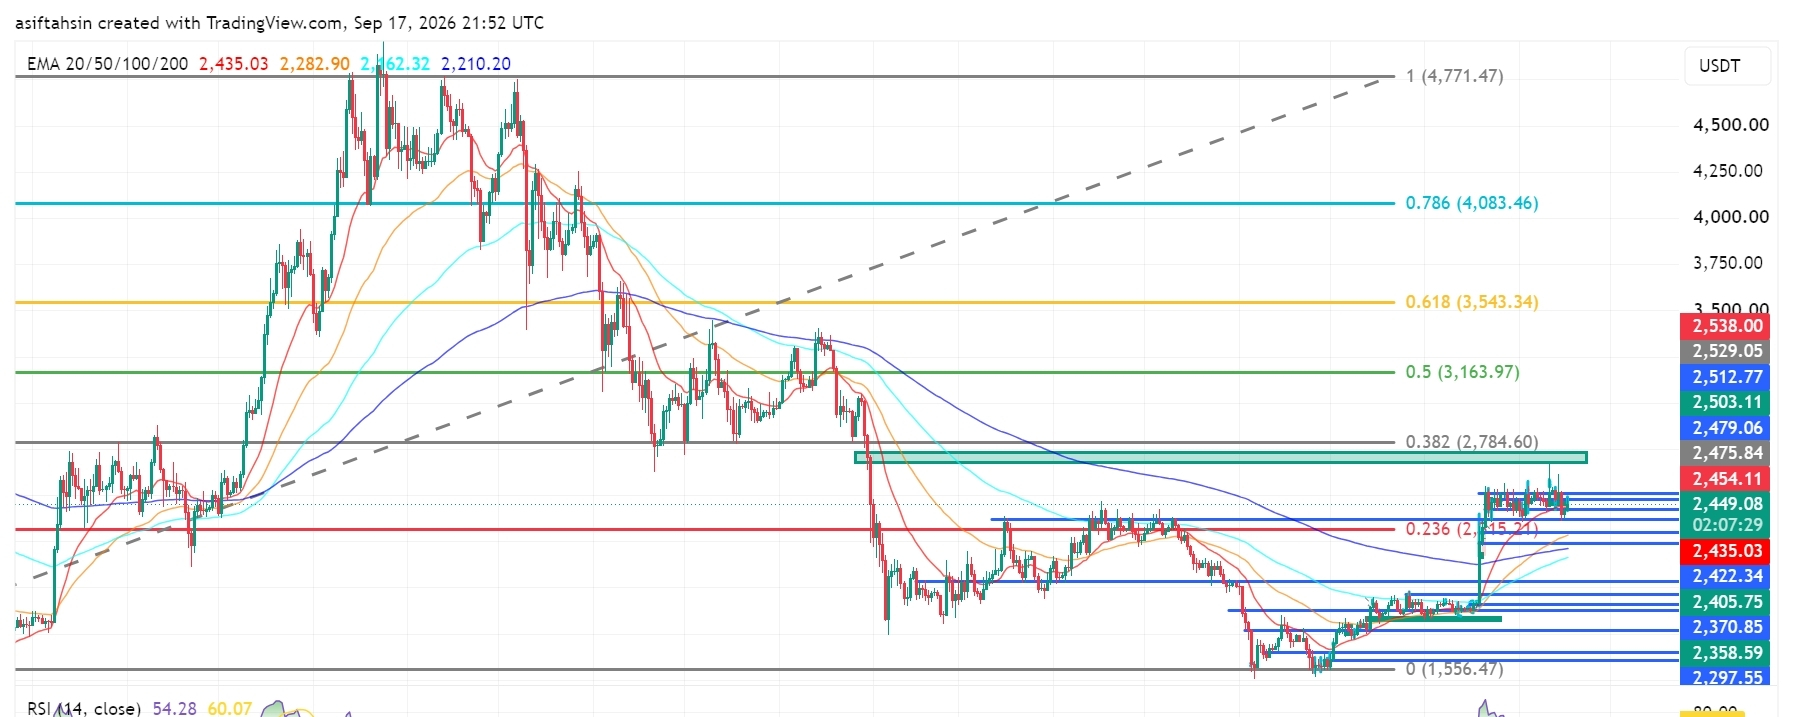
ලිපිය
පරිවර්තනය බලන්න
ETH Technical Outlook: Ethereum Holds Above $2.4K as Recovery Structure BuildsETH is currently trading around $2,450, holding above the $2,405–$2,435 support area after the recent recovery from the $2,300–$2,360 demand zone.
The broader structure is improving, but ETH is now consolidating below the $2,475–$2,538 resistance cluster. The next major chart area is around $2,784.60, which aligns with the 0.382 Fibonacci level.
📈 EMA Structure
20 EMA: $2,435.06
50 EMA: $2,282.92
100 EMA: $2,162.32
200 EMA: $2,210.20
ETH is currently trading above the 20 EMA at $2,435.06.
The recovery above the 50 EMA at $2,282.92, 100 EMA at $2,162.32, and 200 EMA at $2,210.20 keeps the broader recovery structure constructive.
A sustained hold above the 20 EMA would support short-term momentum, while losing the $2,210–$2,283 area would weaken the current structure.
📐 Fibonacci Levels
Key Fibonacci levels:
0.236: $2,315.21
0.382: $2,784.60
0.5: $3,163.97
0.618: $3,543.34
0.786: $4,083.46
1.0: $4,771.47
ETH is currently holding well above the 0.236 Fibonacci level at $2,315.21.
The next major Fibonacci resistance is $2,784.60 — 0.382 Fib.
A sustained move through the $2,475–$2,538 resistance structure could place the $2,784.60 region into focus.
🟢 Bullish Scenario
ETH is consolidating after the recent recovery and is currently holding above the $2,435 area.
Immediate resistance:
$2,454.11
$2,475.84
$2,479.06
$2,503.11
$2,512.77
$2,529.05
$2,538.00
$2,784.60 — 0.382 Fibonacci
A clean breakout and sustained close above the $2,529–$2,538 zone would provide stronger confirmation of continued recovery.
🎯 Target 1: $2,475.84
🎯 Target 2: $2,503.11
🎯 Target 3: $2,529.05
🎯 Target 4: $2,538.00
🎯 Target 5: $2,784.60 — 0.382 Fibonacci
🎯 Target 6: $3,163.97 — 0.5 Fibonacci
A confirmed move above $2,538 could strengthen the medium-term recovery structure and bring the $2,784–$3,164 region into focus.
🔴 Pullback Scenario
After the recent recovery, a retest of the breakout area would be normal.
Key supports:
$2,449.37
$2,435.06 — 20 EMA
$2,422.34
$2,405.75
$2,370.85
$2,358.59
$2,297.55
$2,282.92 — 50 EMA
$2,210.20 — 200 EMA
The $2,405–$2,435 zone is particularly important.
If ETH continues to hold this area during a pullback, the current recovery structure remains active.
A sustained loss of $2,282.92 would weaken the broader structure and could expose the $2,210–$2,162 area.
🧠 Market Structure & Liquidity
ETH has formed a clear recovery structure after sweeping liquidity around the $2,280–$2,360 region.
The recent move produced a strong recovery followed by a breakout above the previous consolidation area.
ETH is now moving through an important:
Recovery → Breakout → Retest → Consolidation
structure.
The major upside liquidity is concentrated around $2,475–$2,538. A decisive move through this zone would place $2,784.60 as the next major Fibonacci reference.
📊 RSI Momentum
RSI (14): 54.28
RSI remains above the neutral 50 level after the recent recovery.
The current reading shows moderately positive momentum, while the RSI signal line is around 60.07.
A sustained RSI move above 55–60 would indicate improving momentum toward the upper resistance area.
A move back below 50 would indicate increasing short-term momentum weakness.
🎯 Key Levels
🔴 Major Resistance: $2,454.11 → $2,475.84 → $2,503.11 → $2,529.05 → $2,538.00
🟢 Major Support: $2,435.06 → $2,422.34 → $2,405.75 → $2,370.85 → $2,358.59
📉 Dynamic EMA Support: $2,435.06 — 20 EMA | $2,282.92 — 50 EMA | $2,210.20 — 200 EMA | $2,162.32 — 100 EMA
🚀 Upside References: $2,538 → $2,784.60 → $3,163.97 → $3,543.34
📌 Final Outlook
ETH's broader structure remains constructive after the recent recovery, with price holding above the $2,405–$2,435 area.
The $2,405–$2,435 zone is now an important short-term support region. As long as ETH maintains this area, the current recovery structure remains active.
The immediate battle is around $2,475–$2,538. A confirmed move above $2,538 could open the path toward $2,784.60, followed by $3,163.97.
However, rejection from resistance followed by a sustained loss of $2,282.92 would weaken the broader structure and increase the possibility of a deeper retracement toward the $2,210–$2,162 area.
Bias: 🟢 Recovery structure intact above $2,282.92. A breakout above $2,538 could open the path toward $2,784.60, with $3,163.97 as the next major Fibonacci reference.
$ETH
{future}(ETHUSDT)
ETH Technical Outlook: Ethereum Holds Above $2.4K as Recovery Structure Builds
ETH is currently trading around $2,450, holding above the $2,405–$2,435 support area after the recent recovery from the $2,300–$2,360 demand zone.
The broader structure is improving, but ETH is now consolidating below the $2,475–$2,538 resistance cluster. The next major chart area is around $2,784.60, which aligns with the 0.382 Fibonacci level.
📈 EMA Structure
20 EMA: $2,435.06
50 EMA: $2,282.92
100 EMA: $2,162.32
200 EMA: $2,210.20
ETH is currently trading above the 20 EMA at $2,435.06.
The recovery above the 50 EMA at $2,282.92, 100 EMA at $2,162.32, and 200 EMA at $2,210.20 keeps the broader recovery structure constructive.
A sustained hold above the 20 EMA would support short-term momentum, while losing the $2,210–$2,283 area would weaken the current structure.
📐 Fibonacci Levels
Key Fibonacci levels:
0.236: $2,315.21
0.382: $2,784.60
0.5: $3,163.97
0.618: $3,543.34
0.786: $4,083.46
1.0: $4,771.47
ETH is currently holding well above the 0.236 Fibonacci level at $2,315.21.
The next major Fibonacci resistance is $2,784.60 — 0.382 Fib.
A sustained move through the $2,475–$2,538 resistance structure could place the $2,784.60 region into focus.
🟢 Bullish Scenario
ETH is consolidating after the recent recovery and is currently holding above the $2,435 area.
Immediate resistance:
$2,454.11
$2,475.84
$2,479.06
$2,503.11
$2,512.77
$2,529.05
$2,538.00
$2,784.60 — 0.382 Fibonacci
A clean breakout and sustained close above the $2,529–$2,538 zone would provide stronger confirmation of continued recovery.
🎯 Target 1: $2,475.84
🎯 Target 2: $2,503.11
🎯 Target 3: $2,529.05
🎯 Target 4: $2,538.00
🎯 Target 5: $2,784.60 — 0.382 Fibonacci
🎯 Target 6: $3,163.97 — 0.5 Fibonacci
A confirmed move above $2,538 could strengthen the medium-term recovery structure and bring the $2,784–$3,164 region into focus.
🔴 Pullback Scenario
After the recent recovery, a retest of the breakout area would be normal.
Key supports:
$2,449.37
$2,435.06 — 20 EMA
$2,422.34
$2,405.75
$2,370.85
$2,358.59
$2,297.55
$2,282.92 — 50 EMA
$2,210.20 — 200 EMA
The $2,405–$2,435 zone is particularly important.
If ETH continues to hold this area during a pullback, the current recovery structure remains active.
A sustained loss of $2,282.92 would weaken the broader structure and could expose the $2,210–$2,162 area.
🧠 Market Structure & Liquidity
ETH has formed a clear recovery structure after sweeping liquidity around the $2,280–$2,360 region.
The recent move produced a strong recovery followed by a breakout above the previous consolidation area.
ETH is now moving through an important:
Recovery → Breakout → Retest → Consolidation
structure.
The major upside liquidity is concentrated around $2,475–$2,538. A decisive move through this zone would place $2,784.60 as the next major Fibonacci reference.
📊 RSI Momentum
RSI (14): 54.28
RSI remains above the neutral 50 level after the recent recovery.
The current reading shows moderately positive momentum, while the RSI signal line is around 60.07.
A sustained RSI move above 55–60 would indicate improving momentum toward the upper resistance area.
A move back below 50 would indicate increasing short-term momentum weakness.
🎯 Key Levels
🔴 Major Resistance: $2,454.11 → $2,475.84 → $2,503.11 → $2,529.05 → $2,538.00
🟢 Major Support: $2,435.06 → $2,422.34 → $2,405.75 → $2,370.85 → $2,358.59
📉 Dynamic EMA Support: $2,435.06 — 20 EMA | $2,282.92 — 50 EMA | $2,210.20 — 200 EMA | $2,162.32 — 100 EMA
🚀 Upside References: $2,538 → $2,784.60 → $3,163.97 → $3,543.34
📌 Final Outlook
ETH's broader structure remains constructive after the recent recovery, with price holding above the $2,405–$2,435 area.
The $2,405–$2,435 zone is now an important short-term support region. As long as ETH maintains this area, the current recovery structure remains active.
The immediate battle is around $2,475–$2,538. A confirmed move above $2,538 could open the path toward $2,784.60, followed by $3,163.97.
However, rejection from resistance followed by a sustained loss of $2,282.92 would weaken the broader structure and increase the possibility of a deeper retracement toward the $2,210–$2,162 area.
Bias: 🟢 Recovery structure intact above $2,282.92. A breakout above $2,538 could open the path toward $2,784.60, with $3,163.97 as the next major Fibonacci reference.
$ETH
The broader structure is improving, but ETH is now consolidating below the $2,475–$2,538 resistance cluster. The next major chart area is around $2,784.60, which aligns with the 0.382 Fibonacci level.
📈 EMA Structure
20 EMA: $2,435.06
50 EMA: $2,282.92
100 EMA: $2,162.32
200 EMA: $2,210.20
ETH is currently trading above the 20 EMA at $2,435.06.
The recovery above the 50 EMA at $2,282.92, 100 EMA at $2,162.32, and 200 EMA at $2,210.20 keeps the broader recovery structure constructive.
A sustained hold above the 20 EMA would support short-term momentum, while losing the $2,210–$2,283 area would weaken the current structure.
📐 Fibonacci Levels
Key Fibonacci levels:
0.236: $2,315.21
0.382: $2,784.60
0.5: $3,163.97
0.618: $3,543.34
0.786: $4,083.46
1.0: $4,771.47
ETH is currently holding well above the 0.236 Fibonacci level at $2,315.21.
The next major Fibonacci resistance is $2,784.60 — 0.382 Fib.
A sustained move through the $2,475–$2,538 resistance structure could place the $2,784.60 region into focus.
🟢 Bullish Scenario
ETH is consolidating after the recent recovery and is currently holding above the $2,435 area.
Immediate resistance:
$2,454.11
$2,475.84
$2,479.06
$2,503.11
$2,512.77
$2,529.05
$2,538.00
$2,784.60 — 0.382 Fibonacci
A clean breakout and sustained close above the $2,529–$2,538 zone would provide stronger confirmation of continued recovery.
🎯 Target 1: $2,475.84
🎯 Target 2: $2,503.11
🎯 Target 3: $2,529.05
🎯 Target 4: $2,538.00
🎯 Target 5: $2,784.60 — 0.382 Fibonacci
🎯 Target 6: $3,163.97 — 0.5 Fibonacci
A confirmed move above $2,538 could strengthen the medium-term recovery structure and bring the $2,784–$3,164 region into focus.
🔴 Pullback Scenario
After the recent recovery, a retest of the breakout area would be normal.
Key supports:
$2,449.37
$2,435.06 — 20 EMA
$2,422.34
$2,405.75
$2,370.85
$2,358.59
$2,297.55
$2,282.92 — 50 EMA
$2,210.20 — 200 EMA
The $2,405–$2,435 zone is particularly important.
If ETH continues to hold this area during a pullback, the current recovery structure remains active.
A sustained loss of $2,282.92 would weaken the broader structure and could expose the $2,210–$2,162 area.
🧠 Market Structure & Liquidity
ETH has formed a clear recovery structure after sweeping liquidity around the $2,280–$2,360 region.
The recent move produced a strong recovery followed by a breakout above the previous consolidation area.
ETH is now moving through an important:
Recovery → Breakout → Retest → Consolidation
structure.
The major upside liquidity is concentrated around $2,475–$2,538. A decisive move through this zone would place $2,784.60 as the next major Fibonacci reference.
📊 RSI Momentum
RSI (14): 54.28
RSI remains above the neutral 50 level after the recent recovery.
The current reading shows moderately positive momentum, while the RSI signal line is around 60.07.
A sustained RSI move above 55–60 would indicate improving momentum toward the upper resistance area.
A move back below 50 would indicate increasing short-term momentum weakness.
🎯 Key Levels
🔴 Major Resistance: $2,454.11 → $2,475.84 → $2,503.11 → $2,529.05 → $2,538.00
🟢 Major Support: $2,435.06 → $2,422.34 → $2,405.75 → $2,370.85 → $2,358.59
📉 Dynamic EMA Support: $2,435.06 — 20 EMA | $2,282.92 — 50 EMA | $2,210.20 — 200 EMA | $2,162.32 — 100 EMA
🚀 Upside References: $2,538 → $2,784.60 → $3,163.97 → $3,543.34
📌 Final Outlook
ETH's broader structure remains constructive after the recent recovery, with price holding above the $2,405–$2,435 area.
The $2,405–$2,435 zone is now an important short-term support region. As long as ETH maintains this area, the current recovery structure remains active.
The immediate battle is around $2,475–$2,538. A confirmed move above $2,538 could open the path toward $2,784.60, followed by $3,163.97.
However, rejection from resistance followed by a sustained loss of $2,282.92 would weaken the broader structure and increase the possibility of a deeper retracement toward the $2,210–$2,162 area.
Bias: 🟢 Recovery structure intact above $2,282.92. A breakout above $2,538 could open the path toward $2,784.60, with $3,163.97 as the next major Fibonacci reference.
$ETH
75
·
--
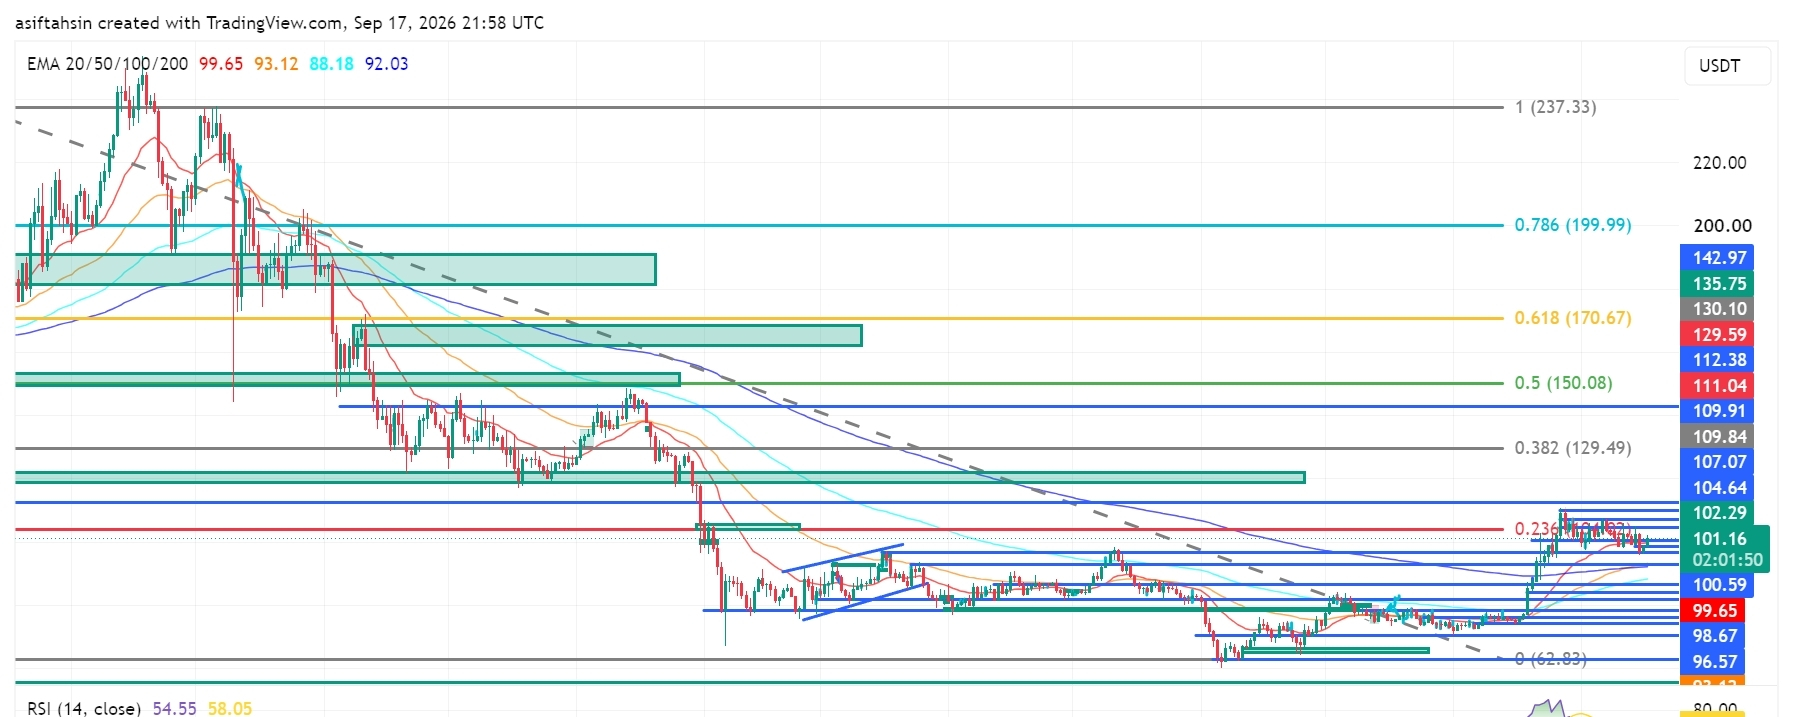
ලිපිය
පරිවර්තනය බලන්න
SOL Technical Outlook: Solana Holds Above $100 as Bulls Defend the RecoverySOL is currently trading around $101.16, holding above the $99–$100 breakout zone after the recent bullish expansion from the $92–$94 demand area.
The broader recovery structure remains constructive, but SOL is now consolidating below the $102.29–$107.07 resistance cluster. Bulls need to reclaim this area and break the $109.91–$112.38 zone for the next major upside expansion.
📈 EMA Structure
- 20 EMA: $99.65
- 50 EMA: $93.12
- 100 EMA: $88.18
- 200 EMA: $92.03
SOL is currently trading above the 20 EMA at $99.65.
The recovery above the 50 EMA at $93.12 and 200 EMA at $92.03 keeps the broader recovery structure intact.
A sustained hold above the 20 EMA would support short-term momentum, while losing the $93.12–$92.03 area would weaken the current structure.
📐 Fibonacci Levels
Key Fibonacci levels:
- 0.236: $104.64
- 0.382: $129.49
- 0.5: $150.08
- 0.618: $170.67
- 0.786: $199.99
- 1.0: $237.33
SOL is currently trading below the 0.236 Fibonacci level at $104.64.
The next major Fibonacci resistance is $129.49 — 0.382 Fib.
A sustained breakout through the $104–$112 resistance structure could open the path toward the $129.49 region.
🟢 Bullish Scenario
SOL is consolidating after the recent recovery and is currently maintaining acceptance above the $100 area.
Immediate resistance:
- $102.29
- $104.64 — 0.236 Fibonacci
- $107.07
- $109.84
- $109.91
- $111.04
- $112.38
A clean breakout and sustained close above $111.04–$112.38 would provide stronger confirmation of bullish continuation.
🎯 Target 1: $104.64
🎯 Target 2: $107.07
🎯 Target 3: $109.91
🎯 Target 4: $112.38
🎯 Target 5: $129.49 — 0.382 Fibonacci
🎯 Target 6: $150.08 — 0.5 Fibonacci
A confirmed breakout above the $111–$112 zone could strengthen the medium-term recovery structure and potentially accelerate SOL toward the $129–$150 region.
🔴 Pullback Scenario
After the recent bullish expansion, a retest of the breakout area would be normal.
Key supports:
- $100.59
- $99.65 — 20 EMA
- $98.67
- $96.57
- $93.12 — 50 EMA
- $92.94
- $92.03 — 200 EMA
- $88.18 — 100 EMA
The $96–$100 zone is particularly important.
If SOL continues to hold this area during a pullback, the current recovery structure remains active.
A sustained loss of $92.03 would weaken the current structure and could expose the $88.18 support zone.
🧠 Market Structure & Liquidity
SOL has formed a clear recovery structure after sweeping liquidity around the $92–$94 demand region.
The recent move produced a market-structure shift followed by a breakout and higher-low formation.
SOL is now moving through an important:
Breakout → Retest → Consolidation → Continuation
structure.
The major upside liquidity is concentrated around $102–$112. A decisive breakout above this zone would place $129.49 as the next major Fibonacci reference.
📊 RSI Momentum
RSI (14): 54.55
RSI remains above the neutral 50 level after cooling from the recent bullish expansion.
The current reading shows moderately positive momentum without reaching an extreme zone.
A sustained RSI move above 55–60 would indicate improving momentum toward the upper resistance area.
A move back below 50 would indicate increasing short-term momentum weakness.
🎯 Key Levels
🔴 Major Resistance: $102.29 → $104.64 → $107.07 → $109.91 → $111.04 → $112.38
🟢 Major Support: $100.59 → $99.65 → $98.67 → $96.57 → $93.12 → $92.03
📉 Dynamic EMA Support: $99.65 — 20 EMA | $93.12 — 50 EMA | $92.03 — 200 EMA | $88.18 — 100 EMA
🚀 Upside Targets: $112.38 → $129.49 → $150.08 → $170.67
📌 Final Outlook
SOL's broader structure remains constructive after the recent breakout, with price holding above the $99–$100 region.
The $96–$100 area is now an important short-term support region. As long as SOL maintains this area, the current recovery structure remains active.
The immediate battle is around $102–$112. A confirmed breakout above $112.38 could open the path toward $129.49, followed by $150.08 and potentially $170.67.
However, rejection from resistance followed by a sustained loss of $92.03 would weaken the current structure and increase the possibility of a deeper retracement toward the $88.18 area.
Bias: 🟢 Recovery structure intact above $92.03. A breakout above $112.38 could open the path toward $129.49, with $150.08 as the next major Fibonacci target.
$SOL
{future}(SOLUSDT)
SOL Technical Outlook: Solana Holds Above $100 as Bulls Defend the Recovery
SOL is currently trading around $101.16, holding above the $99–$100 breakout zone after the recent bullish expansion from the $92–$94 demand area.
The broader recovery structure remains constructive, but SOL is now consolidating below the $102.29–$107.07 resistance cluster. Bulls need to reclaim this area and break the $109.91–$112.38 zone for the next major upside expansion.
📈 EMA Structure
- 20 EMA: $99.65
- 50 EMA: $93.12
- 100 EMA: $88.18
- 200 EMA: $92.03
SOL is currently trading above the 20 EMA at $99.65.
The recovery above the 50 EMA at $93.12 and 200 EMA at $92.03 keeps the broader recovery structure intact.
A sustained hold above the 20 EMA would support short-term momentum, while losing the $93.12–$92.03 area would weaken the current structure.
📐 Fibonacci Levels
Key Fibonacci levels:
- 0.236: $104.64
- 0.382: $129.49
- 0.5: $150.08
- 0.618: $170.67
- 0.786: $199.99
- 1.0: $237.33
SOL is currently trading below the 0.236 Fibonacci level at $104.64.
The next major Fibonacci resistance is $129.49 — 0.382 Fib.
A sustained breakout through the $104–$112 resistance structure could open the path toward the $129.49 region.
🟢 Bullish Scenario
SOL is consolidating after the recent recovery and is currently maintaining acceptance above the $100 area.
Immediate resistance:
- $102.29
- $104.64 — 0.236 Fibonacci
- $107.07
- $109.84
- $109.91
- $111.04
- $112.38
A clean breakout and sustained close above $111.04–$112.38 would provide stronger confirmation of bullish continuation.
🎯 Target 1: $104.64
🎯 Target 2: $107.07
🎯 Target 3: $109.91
🎯 Target 4: $112.38
🎯 Target 5: $129.49 — 0.382 Fibonacci
🎯 Target 6: $150.08 — 0.5 Fibonacci
A confirmed breakout above the $111–$112 zone could strengthen the medium-term recovery structure and potentially accelerate SOL toward the $129–$150 region.
🔴 Pullback Scenario
After the recent bullish expansion, a retest of the breakout area would be normal.
Key supports:
- $100.59
- $99.65 — 20 EMA
- $98.67
- $96.57
- $93.12 — 50 EMA
- $92.94
- $92.03 — 200 EMA
- $88.18 — 100 EMA
The $96–$100 zone is particularly important.
If SOL continues to hold this area during a pullback, the current recovery structure remains active.
A sustained loss of $92.03 would weaken the current structure and could expose the $88.18 support zone.
🧠 Market Structure & Liquidity
SOL has formed a clear recovery structure after sweeping liquidity around the $92–$94 demand region.
The recent move produced a market-structure shift followed by a breakout and higher-low formation.
SOL is now moving through an important:
Breakout → Retest → Consolidation → Continuation
structure.
The major upside liquidity is concentrated around $102–$112. A decisive breakout above this zone would place $129.49 as the next major Fibonacci reference.
📊 RSI Momentum
RSI (14): 54.55
RSI remains above the neutral 50 level after cooling from the recent bullish expansion.
The current reading shows moderately positive momentum without reaching an extreme zone.
A sustained RSI move above 55–60 would indicate improving momentum toward the upper resistance area.
A move back below 50 would indicate increasing short-term momentum weakness.
🎯 Key Levels
🔴 Major Resistance: $102.29 → $104.64 → $107.07 → $109.91 → $111.04 → $112.38
🟢 Major Support: $100.59 → $99.65 → $98.67 → $96.57 → $93.12 → $92.03
📉 Dynamic EMA Support: $99.65 — 20 EMA | $93.12 — 50 EMA | $92.03 — 200 EMA | $88.18 — 100 EMA
🚀 Upside Targets: $112.38 → $129.49 → $150.08 → $170.67
📌 Final Outlook
SOL's broader structure remains constructive after the recent breakout, with price holding above the $99–$100 region.
The $96–$100 area is now an important short-term support region. As long as SOL maintains this area, the current recovery structure remains active.
The immediate battle is around $102–$112. A confirmed breakout above $112.38 could open the path toward $129.49, followed by $150.08 and potentially $170.67.
However, rejection from resistance followed by a sustained loss of $92.03 would weaken the current structure and increase the possibility of a deeper retracement toward the $88.18 area.
Bias: 🟢 Recovery structure intact above $92.03. A breakout above $112.38 could open the path toward $129.49, with $150.08 as the next major Fibonacci target.
$SOL
The broader recovery structure remains constructive, but SOL is now consolidating below the $102.29–$107.07 resistance cluster. Bulls need to reclaim this area and break the $109.91–$112.38 zone for the next major upside expansion.
📈 EMA Structure
- 20 EMA: $99.65
- 50 EMA: $93.12
- 100 EMA: $88.18
- 200 EMA: $92.03
SOL is currently trading above the 20 EMA at $99.65.
The recovery above the 50 EMA at $93.12 and 200 EMA at $92.03 keeps the broader recovery structure intact.
A sustained hold above the 20 EMA would support short-term momentum, while losing the $93.12–$92.03 area would weaken the current structure.
📐 Fibonacci Levels
Key Fibonacci levels:
- 0.236: $104.64
- 0.382: $129.49
- 0.5: $150.08
- 0.618: $170.67
- 0.786: $199.99
- 1.0: $237.33
SOL is currently trading below the 0.236 Fibonacci level at $104.64.
The next major Fibonacci resistance is $129.49 — 0.382 Fib.
A sustained breakout through the $104–$112 resistance structure could open the path toward the $129.49 region.
🟢 Bullish Scenario
SOL is consolidating after the recent recovery and is currently maintaining acceptance above the $100 area.
Immediate resistance:
- $102.29
- $104.64 — 0.236 Fibonacci
- $107.07
- $109.84
- $109.91
- $111.04
- $112.38
A clean breakout and sustained close above $111.04–$112.38 would provide stronger confirmation of bullish continuation.
🎯 Target 1: $104.64
🎯 Target 2: $107.07
🎯 Target 3: $109.91
🎯 Target 4: $112.38
🎯 Target 5: $129.49 — 0.382 Fibonacci
🎯 Target 6: $150.08 — 0.5 Fibonacci
A confirmed breakout above the $111–$112 zone could strengthen the medium-term recovery structure and potentially accelerate SOL toward the $129–$150 region.
🔴 Pullback Scenario
After the recent bullish expansion, a retest of the breakout area would be normal.
Key supports:
- $100.59
- $99.65 — 20 EMA
- $98.67
- $96.57
- $93.12 — 50 EMA
- $92.94
- $92.03 — 200 EMA
- $88.18 — 100 EMA
The $96–$100 zone is particularly important.
If SOL continues to hold this area during a pullback, the current recovery structure remains active.
A sustained loss of $92.03 would weaken the current structure and could expose the $88.18 support zone.
🧠 Market Structure & Liquidity
SOL has formed a clear recovery structure after sweeping liquidity around the $92–$94 demand region.
The recent move produced a market-structure shift followed by a breakout and higher-low formation.
SOL is now moving through an important:
Breakout → Retest → Consolidation → Continuation
structure.
The major upside liquidity is concentrated around $102–$112. A decisive breakout above this zone would place $129.49 as the next major Fibonacci reference.
📊 RSI Momentum
RSI (14): 54.55
RSI remains above the neutral 50 level after cooling from the recent bullish expansion.
The current reading shows moderately positive momentum without reaching an extreme zone.
A sustained RSI move above 55–60 would indicate improving momentum toward the upper resistance area.
A move back below 50 would indicate increasing short-term momentum weakness.
🎯 Key Levels
🔴 Major Resistance: $102.29 → $104.64 → $107.07 → $109.91 → $111.04 → $112.38
🟢 Major Support: $100.59 → $99.65 → $98.67 → $96.57 → $93.12 → $92.03
📉 Dynamic EMA Support: $99.65 — 20 EMA | $93.12 — 50 EMA | $92.03 — 200 EMA | $88.18 — 100 EMA
🚀 Upside Targets: $112.38 → $129.49 → $150.08 → $170.67
📌 Final Outlook
SOL's broader structure remains constructive after the recent breakout, with price holding above the $99–$100 region.
The $96–$100 area is now an important short-term support region. As long as SOL maintains this area, the current recovery structure remains active.
The immediate battle is around $102–$112. A confirmed breakout above $112.38 could open the path toward $129.49, followed by $150.08 and potentially $170.67.
However, rejection from resistance followed by a sustained loss of $92.03 would weaken the current structure and increase the possibility of a deeper retracement toward the $88.18 area.
Bias: 🟢 Recovery structure intact above $92.03. A breakout above $112.38 could open the path toward $129.49, with $150.08 as the next major Fibonacci target.
$SOL
73
·
--
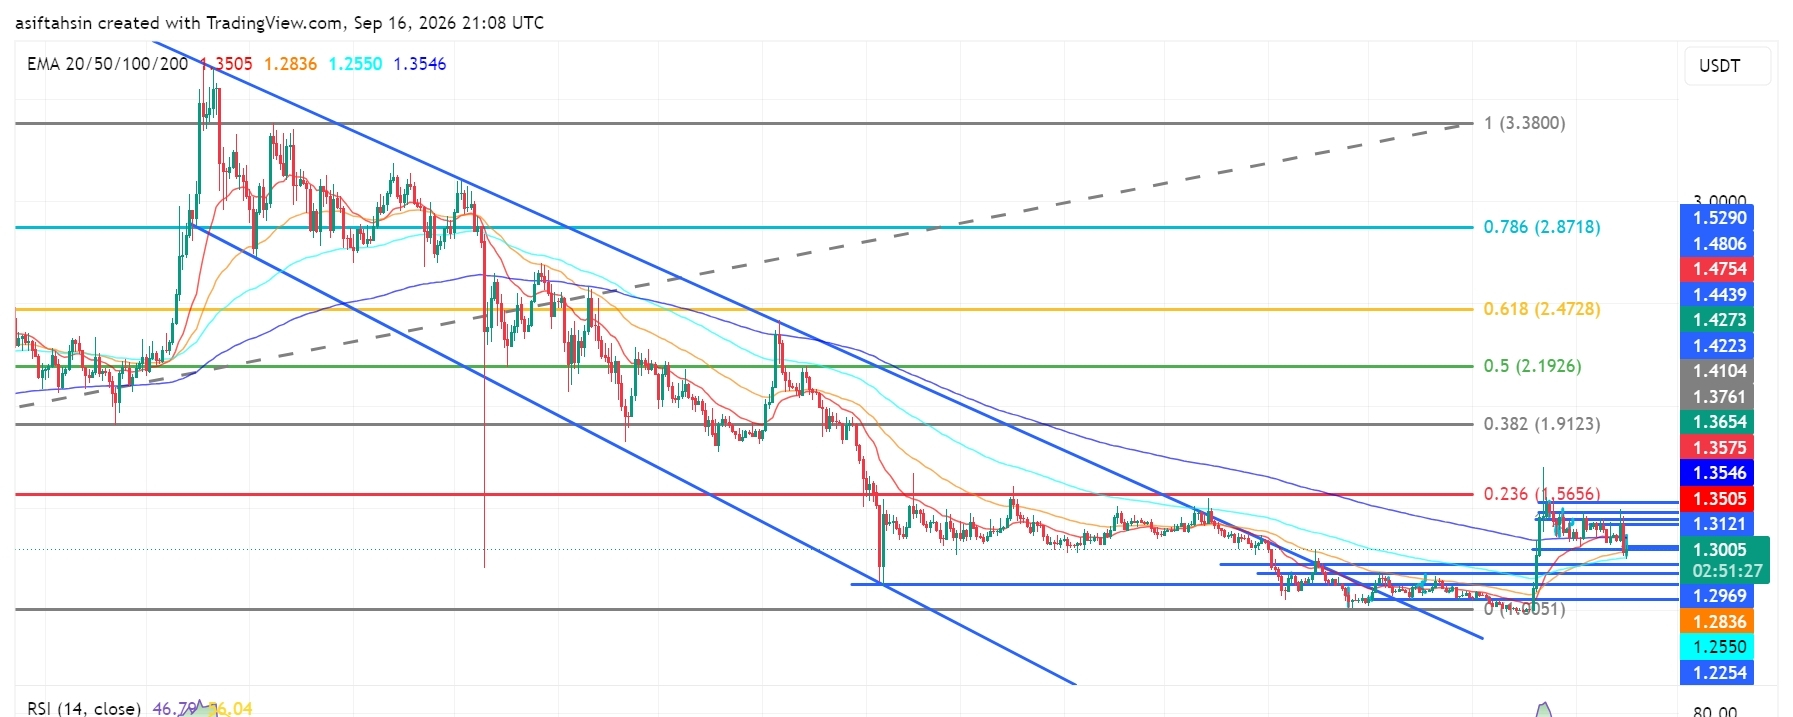
ලිපිය
පරිවර්තනය බලන්න
XRP Technical Outlook: XRP Consolidates Near $1.30 After Sharp PullbackXRP is trading around $1.30 on the chart after a sharp rejection from the $1.35–$1.43 region. Price has returned toward the breakout area, while the broader chart remains in a recovery phase from the $1.20–$1.25 zone. Current momentum is neutral, with RSI below 50.
📈 EMA Structure
20 EMA: $1.3505
50 EMA: $1.2836
100 EMA: $1.2550
200 EMA: $1.3546
XRP is currently below the 20 EMA and 200 EMA, while the 50 and 100 EMAs remain underneath price. Reclaiming the $1.35 area would improve the short-term structure.
📐 Fibonacci Levels
0.236: $1.5656
0.382: $1.9123
0.5: $2.1926
0.618: $2.4728
0.786: $2.8718
1.0: $3.3800
The $1.5656 Fibonacci level is the first major reference above the current range.
🟢 Upside Scenario
A move back above $1.3121 → $1.3505 → $1.3575 → $1.3654 → $1.3761 → $1.4104 → $1.4223 would improve the short-term chart structure.
Above the $1.4439–$1.4754 region, the next major Fibonacci reference is $1.5656.
🔴 Downside Scenario
If XRP remains below the 20/200 EMA area, the main levels to monitor are:
$1.2969 → $1.2836 → $1.2550 → $1.2254 → $1.1794
The $1.2836–$1.2550 region is particularly important because it contains the 50 and 100 EMAs.
🧠 Market Structure & Liquidity
XRP previously broke out from the long descending structure and moved toward the $1.40+ region. The latest move has brought price back into the previous consolidation zone.
The chart is now showing a breakout → expansion → pullback → consolidation structure. The next clear move around $1.28–$1.35 should provide better confirmation of direction.
📊 RSI Momentum
RSI: 46.79
RSI has moved below the neutral 50 level, showing that short-term momentum has cooled. A recovery above 50 would indicate improving momentum.
🎯 Main Chart Levels
Resistance: $1.3121 → $1.3505 → $1.3575 → $1.3654 → $1.4104 → $1.4439 → $1.4754
Support: $1.2969 → $1.2836 → $1.2550 → $1.2254 → $1.1794
📌 Final Outlook
XRP is currently consolidating around $1.30 after the recent pullback. The $1.28–$1.25 region is the main lower structure, while $1.35–$1.41 remains the key overhead area.
Above $1.4439: $1.4754 → $1.5656 → $1.9123
Below $1.2550: $1.2254 → $1.1794
Current market data also shows XRP around the $1.27–$1.28 area, confirming that the chart's $1.28 support region remains closely aligned with the broader market price.
$XRP
{future}(XRPUSDT)
XRP Technical Outlook: XRP Consolidates Near $1.30 After Sharp Pullback
XRP is trading around $1.30 on the chart after a sharp rejection from the $1.35–$1.43 region. Price has returned toward the breakout area, while the broader chart remains in a recovery phase from the $1.20–$1.25 zone. Current momentum is neutral, with RSI below 50.
📈 EMA Structure
20 EMA: $1.3505
50 EMA: $1.2836
100 EMA: $1.2550
200 EMA: $1.3546
XRP is currently below the 20 EMA and 200 EMA, while the 50 and 100 EMAs remain underneath price. Reclaiming the $1.35 area would improve the short-term structure.
📐 Fibonacci Levels
0.236: $1.5656
0.382: $1.9123
0.5: $2.1926
0.618: $2.4728
0.786: $2.8718
1.0: $3.3800
The $1.5656 Fibonacci level is the first major reference above the current range.
🟢 Upside Scenario
A move back above $1.3121 → $1.3505 → $1.3575 → $1.3654 → $1.3761 → $1.4104 → $1.4223 would improve the short-term chart structure.
Above the $1.4439–$1.4754 region, the next major Fibonacci reference is $1.5656.
🔴 Downside Scenario
If XRP remains below the 20/200 EMA area, the main levels to monitor are:
$1.2969 → $1.2836 → $1.2550 → $1.2254 → $1.1794
The $1.2836–$1.2550 region is particularly important because it contains the 50 and 100 EMAs.
🧠 Market Structure & Liquidity
XRP previously broke out from the long descending structure and moved toward the $1.40+ region. The latest move has brought price back into the previous consolidation zone.
The chart is now showing a breakout → expansion → pullback → consolidation structure. The next clear move around $1.28–$1.35 should provide better confirmation of direction.
📊 RSI Momentum
RSI: 46.79
RSI has moved below the neutral 50 level, showing that short-term momentum has cooled. A recovery above 50 would indicate improving momentum.
🎯 Main Chart Levels
Resistance: $1.3121 → $1.3505 → $1.3575 → $1.3654 → $1.4104 → $1.4439 → $1.4754
Support: $1.2969 → $1.2836 → $1.2550 → $1.2254 → $1.1794
📌 Final Outlook
XRP is currently consolidating around $1.30 after the recent pullback. The $1.28–$1.25 region is the main lower structure, while $1.35–$1.41 remains the key overhead area.
Above $1.4439: $1.4754 → $1.5656 → $1.9123
Below $1.2550: $1.2254 → $1.1794
Current market data also shows XRP around the $1.27–$1.28 area, confirming that the chart's $1.28 support region remains closely aligned with the broader market price.
$XRP
📈 EMA Structure
20 EMA: $1.3505
50 EMA: $1.2836
100 EMA: $1.2550
200 EMA: $1.3546
XRP is currently below the 20 EMA and 200 EMA, while the 50 and 100 EMAs remain underneath price. Reclaiming the $1.35 area would improve the short-term structure.
📐 Fibonacci Levels
0.236: $1.5656
0.382: $1.9123
0.5: $2.1926
0.618: $2.4728
0.786: $2.8718
1.0: $3.3800
The $1.5656 Fibonacci level is the first major reference above the current range.
🟢 Upside Scenario
A move back above $1.3121 → $1.3505 → $1.3575 → $1.3654 → $1.3761 → $1.4104 → $1.4223 would improve the short-term chart structure.
Above the $1.4439–$1.4754 region, the next major Fibonacci reference is $1.5656.
🔴 Downside Scenario
If XRP remains below the 20/200 EMA area, the main levels to monitor are:
$1.2969 → $1.2836 → $1.2550 → $1.2254 → $1.1794
The $1.2836–$1.2550 region is particularly important because it contains the 50 and 100 EMAs.
🧠 Market Structure & Liquidity
XRP previously broke out from the long descending structure and moved toward the $1.40+ region. The latest move has brought price back into the previous consolidation zone.
The chart is now showing a breakout → expansion → pullback → consolidation structure. The next clear move around $1.28–$1.35 should provide better confirmation of direction.
📊 RSI Momentum
RSI: 46.79
RSI has moved below the neutral 50 level, showing that short-term momentum has cooled. A recovery above 50 would indicate improving momentum.
🎯 Main Chart Levels
Resistance: $1.3121 → $1.3505 → $1.3575 → $1.3654 → $1.4104 → $1.4439 → $1.4754
Support: $1.2969 → $1.2836 → $1.2550 → $1.2254 → $1.1794
📌 Final Outlook
XRP is currently consolidating around $1.30 after the recent pullback. The $1.28–$1.25 region is the main lower structure, while $1.35–$1.41 remains the key overhead area.
Above $1.4439: $1.4754 → $1.5656 → $1.9123
Below $1.2550: $1.2254 → $1.1794
Current market data also shows XRP around the $1.27–$1.28 area, confirming that the chart's $1.28 support region remains closely aligned with the broader market price.
$XRP
1
3
788
·
--
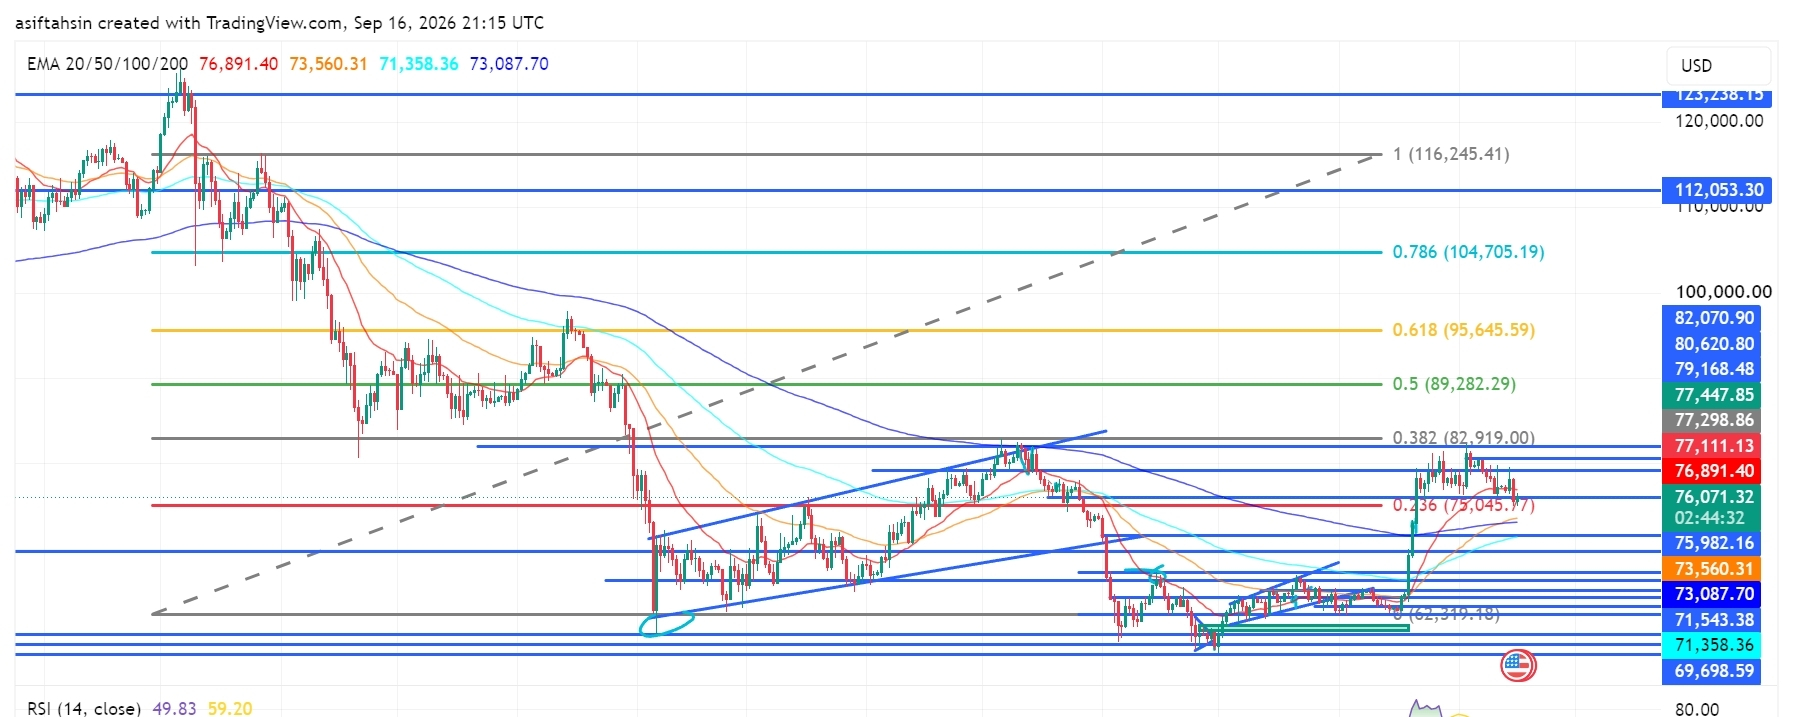
ලිපිය
පරිවර්තනය බලන්න
BTC Technical Outlook: Bitcoin Consolidates Below $77K as Bulls Defend the RecoveryBitcoin is trading around $76.9K, consolidating after the recent recovery from the $69K–$71K demand area. Price remains above the major $75K support zone, but momentum has cooled as BTC struggles below the $77.1K–$82.9K resistance region. The next breakout or breakdown should determine the short-term direction.
📈 EMA Structure
20 EMA: $76,891
50 EMA: $73,560
100 EMA: $71,358
200 EMA: $73,088
BTC is currently sitting around the 20 EMA, while the 50/100/200 EMAs remain below price. Holding above $75K keeps the broader recovery structure intact, but losing the 20 EMA could bring a deeper retest.
📐 Fibonacci Levels
0.236: $75,045
0.382: $82,919
0.5: $89,282
0.618: $95,646
0.786: $104,705
1.0: $116,245
The $75,045–$76K zone is the immediate defensive area. A clean break above $82,919 would open the higher Fibonacci levels.
🟢 Bullish Scenario
BTC needs to reclaim and hold above: $77,111 → $77,299 → $77,448 → $79,168 → $80,621 → $82,071
A decisive breakout above $82,919 would strengthen the recovery structure and expose: $89,282 → $95,646 → $104,705
🔴 Pullback Scenario
If BTC fails to reclaim the $77K area, watch: $76,071 → $75,982 → $75,045
A sustained breakdown below $75,045 would weaken the recovery and could bring $73,560 → $73,088 → $71,543 → $71,358 into focus.
🧠 Market Structure & Liquidity
The chart shows a strong recovery from the $69K–$71K demand zone, followed by a breakout toward $82K and now a consolidation phase.
BTC is currently trading between major liquidity zones. The $82K–$83K area remains significant overhead liquidity, while the $75K area is the key downside defense.
📊 RSI Momentum
RSI: 49.83
Momentum has cooled back toward neutral after the previous recovery. RSI remaining near 50 means BTC currently lacks strong directional momentum.
🎯 Key Levels
Resistance: $77,111 → $77,448 → $79,168 → $80,621 → $82,071 → $82,919
Support: $76,071 → $75,982 → $75,045 → $73,560 → $73,088 → $71,543
📌 Final Outlook
BTC remains in a recovery/consolidation structure above $75K, but bulls need to reclaim $77K–$80K and eventually break $82,919 to resume the larger upside move.
Above $82,919: $89,282 → $95,646 → $104,705
Below $75,045: recovery structure weakens and deeper support becomes relevant.
Recent market data also places BTC around the mid-$75K range, consistent with the chart’s key $75K support area.
$BTC
{future}(BTCUSDT)
BTC Technical Outlook: Bitcoin Consolidates Below $77K as Bulls Defend the Recovery
Bitcoin is trading around $76.9K, consolidating after the recent recovery from the $69K–$71K demand area. Price remains above the major $75K support zone, but momentum has cooled as BTC struggles below the $77.1K–$82.9K resistance region. The next breakout or breakdown should determine the short-term direction.
📈 EMA Structure
20 EMA: $76,891
50 EMA: $73,560
100 EMA: $71,358
200 EMA: $73,088
BTC is currently sitting around the 20 EMA, while the 50/100/200 EMAs remain below price. Holding above $75K keeps the broader recovery structure intact, but losing the 20 EMA could bring a deeper retest.
📐 Fibonacci Levels
0.236: $75,045
0.382: $82,919
0.5: $89,282
0.618: $95,646
0.786: $104,705
1.0: $116,245
The $75,045–$76K zone is the immediate defensive area. A clean break above $82,919 would open the higher Fibonacci levels.
🟢 Bullish Scenario
BTC needs to reclaim and hold above: $77,111 → $77,299 → $77,448 → $79,168 → $80,621 → $82,071
A decisive breakout above $82,919 would strengthen the recovery structure and expose: $89,282 → $95,646 → $104,705
🔴 Pullback Scenario
If BTC fails to reclaim the $77K area, watch: $76,071 → $75,982 → $75,045
A sustained breakdown below $75,045 would weaken the recovery and could bring $73,560 → $73,088 → $71,543 → $71,358 into focus.
🧠 Market Structure & Liquidity
The chart shows a strong recovery from the $69K–$71K demand zone, followed by a breakout toward $82K and now a consolidation phase.
BTC is currently trading between major liquidity zones. The $82K–$83K area remains significant overhead liquidity, while the $75K area is the key downside defense.
📊 RSI Momentum
RSI: 49.83
Momentum has cooled back toward neutral after the previous recovery. RSI remaining near 50 means BTC currently lacks strong directional momentum.
🎯 Key Levels
Resistance: $77,111 → $77,448 → $79,168 → $80,621 → $82,071 → $82,919
Support: $76,071 → $75,982 → $75,045 → $73,560 → $73,088 → $71,543
📌 Final Outlook
BTC remains in a recovery/consolidation structure above $75K, but bulls need to reclaim $77K–$80K and eventually break $82,919 to resume the larger upside move.
Above $82,919: $89,282 → $95,646 → $104,705
Below $75,045: recovery structure weakens and deeper support becomes relevant.
Recent market data also places BTC around the mid-$75K range, consistent with the chart’s key $75K support area.
$BTC
📈 EMA Structure
20 EMA: $76,891
50 EMA: $73,560
100 EMA: $71,358
200 EMA: $73,088
BTC is currently sitting around the 20 EMA, while the 50/100/200 EMAs remain below price. Holding above $75K keeps the broader recovery structure intact, but losing the 20 EMA could bring a deeper retest.
📐 Fibonacci Levels
0.236: $75,045
0.382: $82,919
0.5: $89,282
0.618: $95,646
0.786: $104,705
1.0: $116,245
The $75,045–$76K zone is the immediate defensive area. A clean break above $82,919 would open the higher Fibonacci levels.
🟢 Bullish Scenario
BTC needs to reclaim and hold above: $77,111 → $77,299 → $77,448 → $79,168 → $80,621 → $82,071
A decisive breakout above $82,919 would strengthen the recovery structure and expose: $89,282 → $95,646 → $104,705
🔴 Pullback Scenario
If BTC fails to reclaim the $77K area, watch: $76,071 → $75,982 → $75,045
A sustained breakdown below $75,045 would weaken the recovery and could bring $73,560 → $73,088 → $71,543 → $71,358 into focus.
🧠 Market Structure & Liquidity
The chart shows a strong recovery from the $69K–$71K demand zone, followed by a breakout toward $82K and now a consolidation phase.
BTC is currently trading between major liquidity zones. The $82K–$83K area remains significant overhead liquidity, while the $75K area is the key downside defense.
📊 RSI Momentum
RSI: 49.83
Momentum has cooled back toward neutral after the previous recovery. RSI remaining near 50 means BTC currently lacks strong directional momentum.
🎯 Key Levels
Resistance: $77,111 → $77,448 → $79,168 → $80,621 → $82,071 → $82,919
Support: $76,071 → $75,982 → $75,045 → $73,560 → $73,088 → $71,543
📌 Final Outlook
BTC remains in a recovery/consolidation structure above $75K, but bulls need to reclaim $77K–$80K and eventually break $82,919 to resume the larger upside move.
Above $82,919: $89,282 → $95,646 → $104,705
Below $75,045: recovery structure weakens and deeper support becomes relevant.
Recent market data also places BTC around the mid-$75K range, consistent with the chart’s key $75K support area.
$BTC
61
·
--
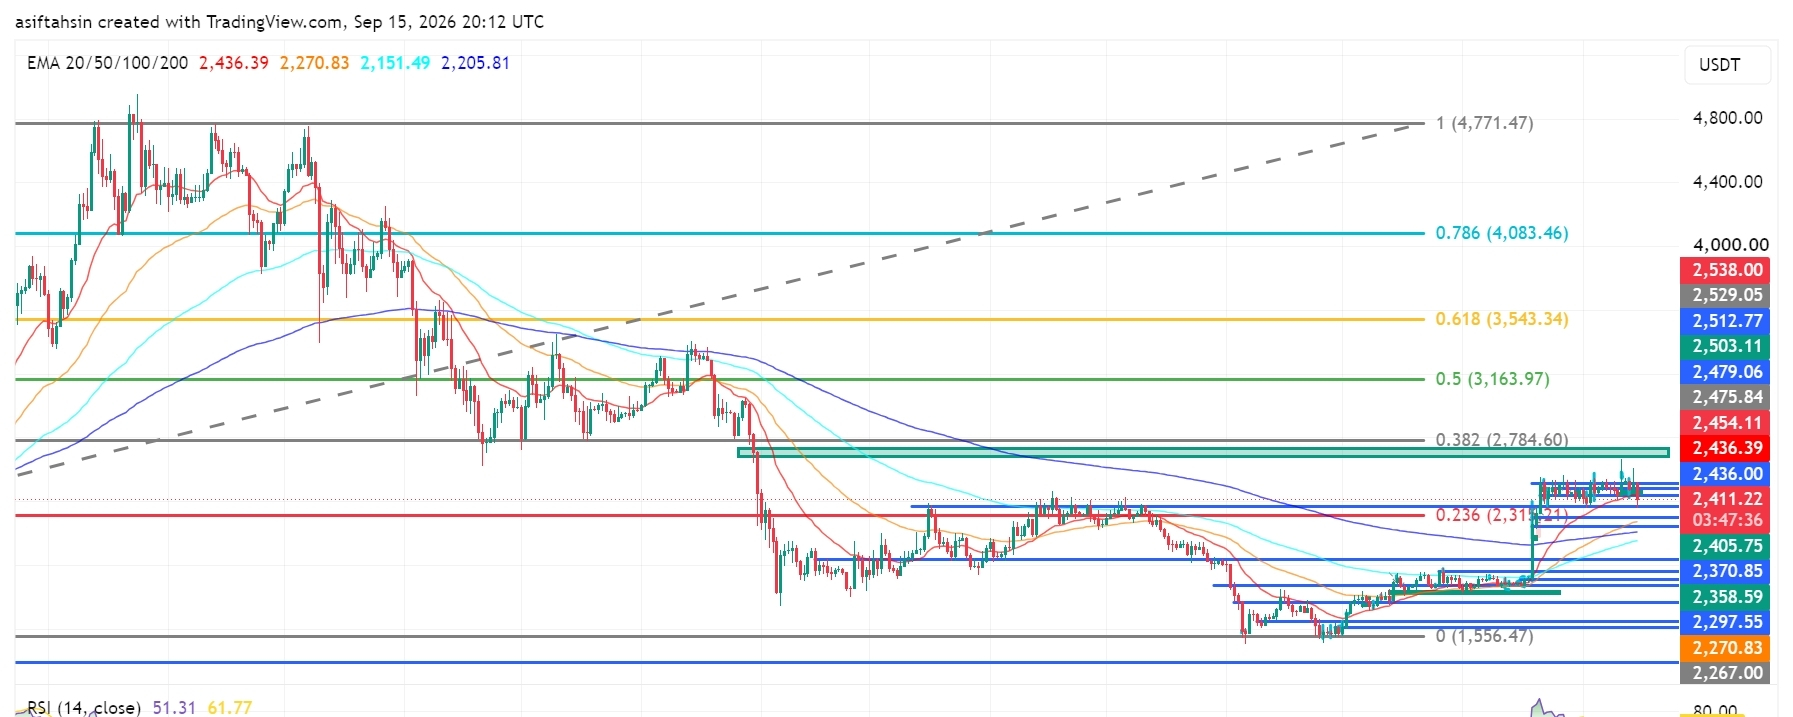
ලිපිය
SOL තාක්ෂණික දෘෂ්ටිය: Solana $100 අසල රඳා පවතී; ගොනුන් බිඳහැරීම ආරක්ෂා කරයිඋපරිමයෙන් $99.6 පමණ මට්ටමට ආසන්නව SOL වෙළඳාම් කරමින් සිටින අතර, $92–$94 ඉල්ලුම් කලාපයෙන් මෑතදී ඇති වූ ධනාත්මක පුළුල් වීමෙන් පසු $99–$100 බිඳහැරීමේ කලාපය අසල රඳාගෙන සිටී.
පුළුල් වූ ප්රකෘතිමත් වීමේ ව්යුහය තවදුරටත් ධනාත්මක ලෙස පවතී, නමුත් SOL දැන් $100.59–$104.64 ප්රතිරෝධක කලාපය යටතේ සංකේන්ද්රණය වෙමින් තිබේ. ගොනුන්ට මේ ප්රදේශය නැවත අත්පත් කරගෙන $107.07–$109.91 කලාපය බිඳ දමා ඊළඟ ප්රධාන ඉහළ ඉදිරි පුළුල් වීම සඳහා ඉඩ ලබාගත යුතුය.
📈 EMA ව්යුහය
20 EMA: $99.62
50 EMA: $92.58
100 EMA: $87.71
200 EMA: $91.88
SOL දැනට $99.62 හි 20 EMA පරීක්ෂා කරමින් සිටී.
SOL තාක්ෂණික දෘෂ්ටිය: Solana $100 අසල රඳා පවතී; ගොනුන් බිඳහැරීම ආරක්ෂා කරයි
උපරිමයෙන් $99.6 පමණ මට්ටමට ආසන්නව SOL වෙළඳාම් කරමින් සිටින අතර, $92–$94 ඉල්ලුම් කලාපයෙන් මෑතදී ඇති වූ ධනාත්මක පුළුල් වීමෙන් පසු $99–$100 බිඳහැරීමේ කලාපය අසල රඳාගෙන සිටී.
පුළුල් වූ ප්රකෘතිමත් වීමේ ව්යුහය තවදුරටත් ධනාත්මක ලෙස පවතී, නමුත් SOL දැන් $100.59–$104.64 ප්රතිරෝධක කලාපය යටතේ සංකේන්ද්රණය වෙමින් තිබේ. ගොනුන්ට මේ ප්රදේශය නැවත අත්පත් කරගෙන $107.07–$109.91 කලාපය බිඳ දමා ඊළඟ ප්රධාන ඉහළ ඉදිරි පුළුල් වීම සඳහා ඉඩ ලබාගත යුතුය.
📈 EMA ව්යුහය
20 EMA: $99.62
50 EMA: $92.58
100 EMA: $87.71
200 EMA: $91.88
SOL දැනට $99.62 හි 20 EMA පරීක්ෂා කරමින් සිටී.
පුළුල් වූ ප්රකෘතිමත් වීමේ ව්යුහය තවදුරටත් ධනාත්මක ලෙස පවතී, නමුත් SOL දැන් $100.59–$104.64 ප්රතිරෝධක කලාපය යටතේ සංකේන්ද්රණය වෙමින් තිබේ. ගොනුන්ට මේ ප්රදේශය නැවත අත්පත් කරගෙන $107.07–$109.91 කලාපය බිඳ දමා ඊළඟ ප්රධාන ඉහළ ඉදිරි පුළුල් වීම සඳහා ඉඩ ලබාගත යුතුය.
📈 EMA ව්යුහය
20 EMA: $99.62
50 EMA: $92.58
100 EMA: $87.71
200 EMA: $91.88
SOL දැනට $99.62 හි 20 EMA පරීක්ෂා කරමින් සිටී.
62
·
--
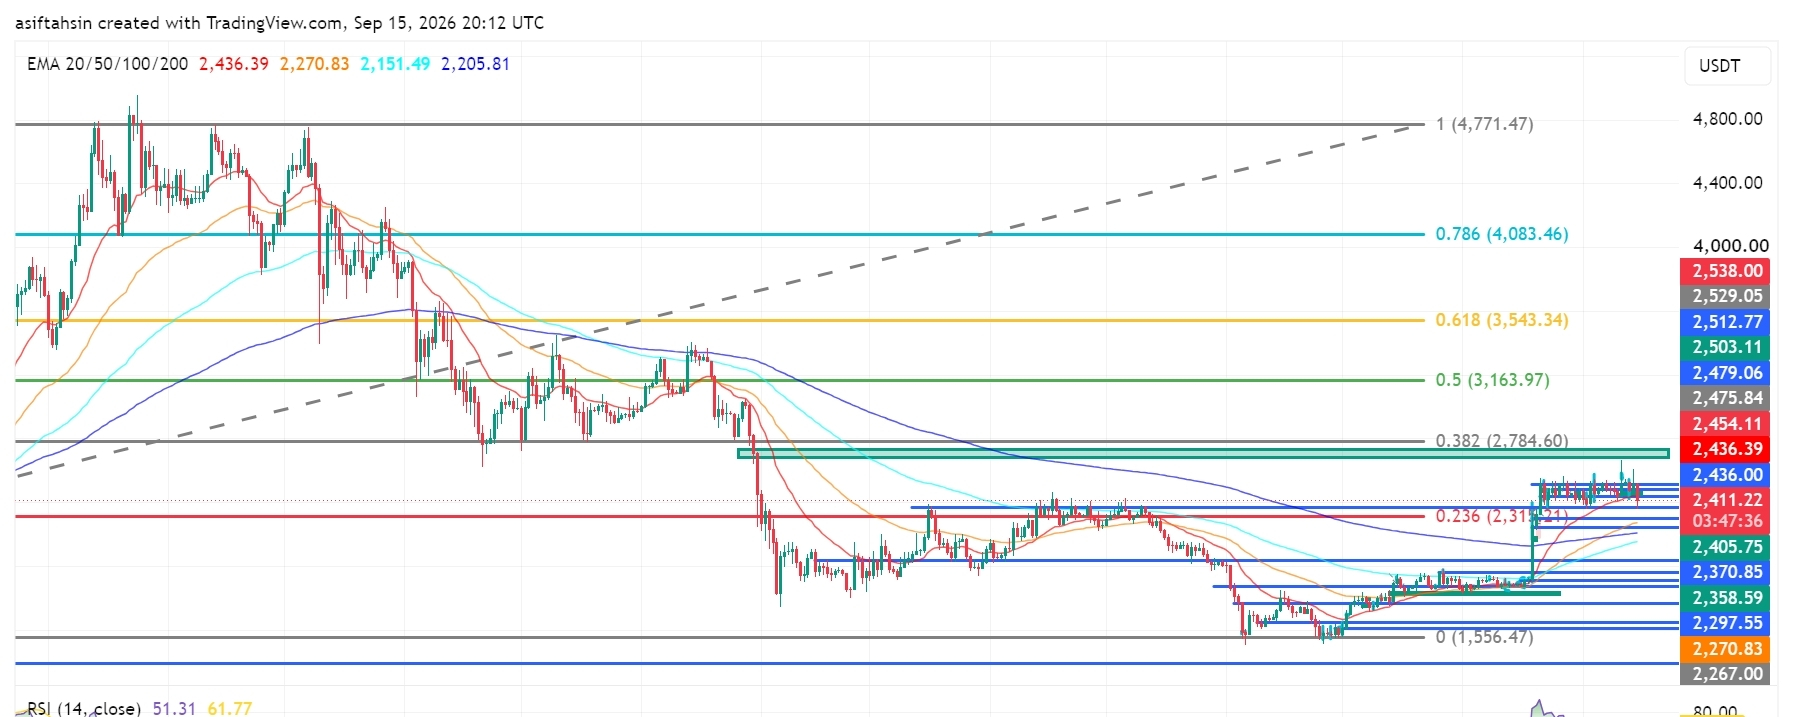
ලිපිය
ETH နည်းပညာဆိုင်ရာ အမြင်သုံးသပ်ချက်: Ethereum က $2.4K အထက်မှာ ရှိနေပြီး Bulls က ပြန်လည်တက်လာမှုကို ကာကွယ်နေသည်ETH က လက်ရှိမှာ $2.41K ဝန်းကျင်မှာ အရောင်းအဝယ်ဖြစ်နေပြီး မကြာသေးမီက $2.27K–$2.30K demand zone ကနေ ပြန်လည်တက်လာပြီးနောက် $2.40K–$2.41K support အပိုင်းထက်မှာ ဆက်လက်တည်ရှိနေပါတယ်။
ပိုမိုကျယ်ပြန့်တဲ့ ပြန်လည်ကောင်းမွန်ရေး ဖွဲ့စည်းပုံကတော့ အဆင်ပြေ (constructive) နေတုန်းပဲ၊ ဒါပေမယ့် ETH က $2.436K–$2.454K resistance cluster အောက်ဘက်မှာ အခုတော့ စုစည်းနေပါတယ်။ ဒီနယ်မြေကို ပြန်လည်သိမ်းယူပြီး နောက်တစ်ဆင့် အရေးကြီးတဲ့ အမြင့်ပိုမိုတက်လာမှုအတွက် $2,538 ကို ချိုးဖောက်ဖို့ Bulls တွေ လိုအပ်ပါတယ်။
📈 EMA ဖွဲ့စည်းပုံ
20 EMA: $2,436.39
50 EMA: $2,270.83
100 EMA: $2,151.49
200 EMA: $2,205.81
ETH က 50၊ 100 နဲ့ 200 EMA များထက်မှာ ဆက်လက်ရှိနေပါတယ်။
$2,436.39 ရှိ 20 EMA က လက်ရှိမှာ အဓိက အချိန်တိုခုခံတားဆီးမှု (short-term resistance) ဖြစ်နေပါတယ်။ ဒီအဆင့်အထက်ကို စဉ်ဆက်မပြတ် ပြန်လက်လှမ်းနိုင်ရင် bullish ပြန်လည်တက်လာတဲ့ ဖွဲ့စည်းပုံကို ပိုမိုခိုင်မာစေပါလိမ့်မယ်။
ETH နည်းပညာဆိုင်ရာ အမြင်သုံးသပ်ချက်: Ethereum က $2.4K အထက်မှာ ရှိနေပြီး Bulls က ပြန်လည်တက်လာမှုကို ကာကွယ်နေသည်
ETH က လက်ရှိမှာ $2.41K ဝန်းကျင်မှာ အရောင်းအဝယ်ဖြစ်နေပြီး မကြာသေးမီက $2.27K–$2.30K demand zone ကနေ ပြန်လည်တက်လာပြီးနောက် $2.40K–$2.41K support အပိုင်းထက်မှာ ဆက်လက်တည်ရှိနေပါတယ်။
ပိုမိုကျယ်ပြန့်တဲ့ ပြန်လည်ကောင်းမွန်ရေး ဖွဲ့စည်းပုံကတော့ အဆင်ပြေ (constructive) နေတုန်းပဲ၊ ဒါပေမယ့် ETH က $2.436K–$2.454K resistance cluster အောက်ဘက်မှာ အခုတော့ စုစည်းနေပါတယ်။ ဒီနယ်မြေကို ပြန်လည်သိမ်းယူပြီး နောက်တစ်ဆင့် အရေးကြီးတဲ့ အမြင့်ပိုမိုတက်လာမှုအတွက် $2,538 ကို ချိုးဖောက်ဖို့ Bulls တွေ လိုအပ်ပါတယ်။
📈 EMA ဖွဲ့စည်းပုံ
20 EMA: $2,436.39
50 EMA: $2,270.83
100 EMA: $2,151.49
200 EMA: $2,205.81
ETH က 50၊ 100 နဲ့ 200 EMA များထက်မှာ ဆက်လက်ရှိနေပါတယ်။
$2,436.39 ရှိ 20 EMA က လက်ရှိမှာ အဓိက အချိန်တိုခုခံတားဆီးမှု (short-term resistance) ဖြစ်နေပါတယ်။ ဒီအဆင့်အထက်ကို စဉ်ဆက်မပြတ် ပြန်လက်လှမ်းနိုင်ရင် bullish ပြန်လည်တက်လာတဲ့ ဖွဲ့စည်းပုံကို ပိုမိုခိုင်မာစေပါလိမ့်မယ်။
ပိုမိုကျယ်ပြန့်တဲ့ ပြန်လည်ကောင်းမွန်ရေး ဖွဲ့စည်းပုံကတော့ အဆင်ပြေ (constructive) နေတုန်းပဲ၊ ဒါပေမယ့် ETH က $2.436K–$2.454K resistance cluster အောက်ဘက်မှာ အခုတော့ စုစည်းနေပါတယ်။ ဒီနယ်မြေကို ပြန်လည်သိမ်းယူပြီး နောက်တစ်ဆင့် အရေးကြီးတဲ့ အမြင့်ပိုမိုတက်လာမှုအတွက် $2,538 ကို ချိုးဖောက်ဖို့ Bulls တွေ လိုအပ်ပါတယ်။
📈 EMA ဖွဲ့စည်းပုံ
20 EMA: $2,436.39
50 EMA: $2,270.83
100 EMA: $2,151.49
200 EMA: $2,205.81
ETH က 50၊ 100 နဲ့ 200 EMA များထက်မှာ ဆက်လက်ရှိနေပါတယ်။
$2,436.39 ရှိ 20 EMA က လက်ရှိမှာ အဓိက အချိန်တိုခုခံတားဆီးမှု (short-term resistance) ဖြစ်နေပါတယ်။ ဒီအဆင့်အထက်ကို စဉ်ဆက်မပြတ် ပြန်လက်လှမ်းနိုင်ရင် bullish ပြန်လည်တက်လာတဲ့ ဖွဲ့စည်းပုံကို ပိုမိုခိုင်မာစေပါလိမ့်မယ်။
63
·
--
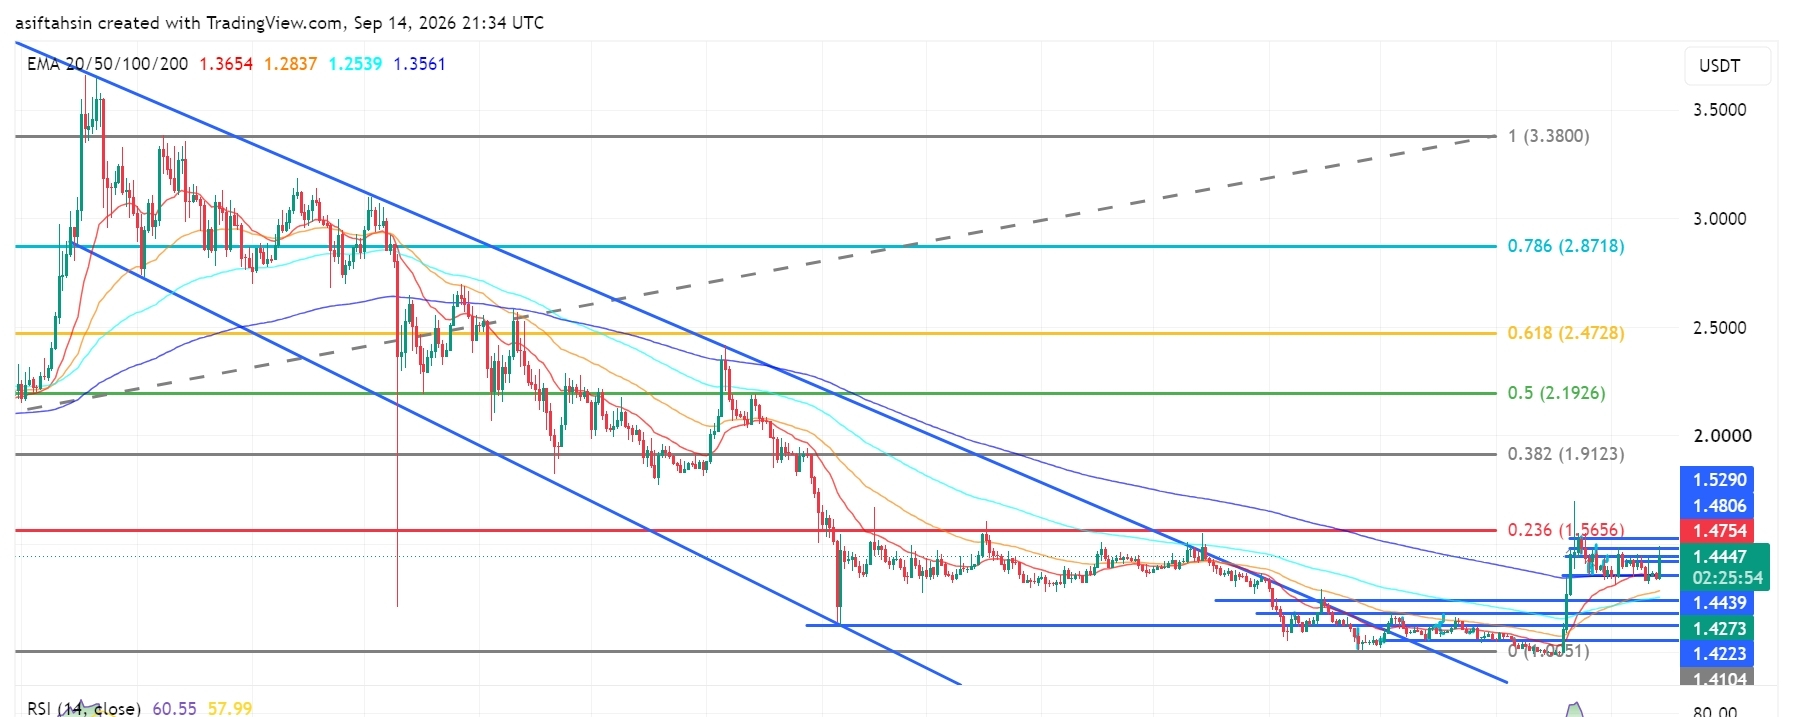
ලිපිය
XRP තාක්ෂණික දැක්ම: XRP $1.40ට ඉහළින් රැඳී සිටිමින්, ගොනුකරුවන් $1.56 ඉලක්ක කරයිXRP දැනට $1.44 පමණ වෙළෙඳාම් කරමින්, ජූනි–ජූලි අවමයන්ගෙන් දැඩි ප්රතිසාධනයක් ලැබීමෙන් පසු වැදගත් $1.40 මනෝවිද්යාත්මක මට්ටමට ඉහළින් සංකේන්ද්රණය වෙමින් පවතී.
පුළුල් ව්යුහය සැලකිය යුතු ලෙස වැඩිදියුණු වී ඇත; දැන් XRP ප්රධාන EMA හතරටම ඉහළින් වෙළෙඳාම් කරයි. එහෙත් මිල $1.475–$1.53 අතර ප්රධාන ප්රතිරෝධක කලාපයට ළඟා වෙමින් පවතී. $1.5656 ෆයිබොනාචි ප්රතිරෝධය වෙත මඟ විවෘත කරගන්න නම්, ගොනුකරුවන්ට මේ කලාපය ඉහළින් පැහැදිලි breakout එකක් අවශ්යයි.
📈 EMA ව්යුහය
20 EMA: $1.3653
50 EMA: $1.2837
100 EMA: $1.2539
200 EMA: $1.3561
XRP තාක්ෂණික දැක්ම: XRP $1.40ට ඉහළින් රැඳී සිටිමින්, ගොනුකරුවන් $1.56 ඉලක්ක කරයි
XRP දැනට $1.44 පමණ වෙළෙඳාම් කරමින්, ජූනි–ජූලි අවමයන්ගෙන් දැඩි ප්රතිසාධනයක් ලැබීමෙන් පසු වැදගත් $1.40 මනෝවිද්යාත්මක මට්ටමට ඉහළින් සංකේන්ද්රණය වෙමින් පවතී.
පුළුල් ව්යුහය සැලකිය යුතු ලෙස වැඩිදියුණු වී ඇත; දැන් XRP ප්රධාන EMA හතරටම ඉහළින් වෙළෙඳාම් කරයි. එහෙත් මිල $1.475–$1.53 අතර ප්රධාන ප්රතිරෝධක කලාපයට ළඟා වෙමින් පවතී. $1.5656 ෆයිබොනාචි ප්රතිරෝධය වෙත මඟ විවෘත කරගන්න නම්, ගොනුකරුවන්ට මේ කලාපය ඉහළින් පැහැදිලි breakout එකක් අවශ්යයි.
📈 EMA ව්යුහය
20 EMA: $1.3653
50 EMA: $1.2837
100 EMA: $1.2539
200 EMA: $1.3561
පුළුල් ව්යුහය සැලකිය යුතු ලෙස වැඩිදියුණු වී ඇත; දැන් XRP ප්රධාන EMA හතරටම ඉහළින් වෙළෙඳාම් කරයි. එහෙත් මිල $1.475–$1.53 අතර ප්රධාන ප්රතිරෝධක කලාපයට ළඟා වෙමින් පවතී. $1.5656 ෆයිබොනාචි ප්රතිරෝධය වෙත මඟ විවෘත කරගන්න නම්, ගොනුකරුවන්ට මේ කලාපය ඉහළින් පැහැදිලි breakout එකක් අවශ්යයි.
📈 EMA ව්යුහය
20 EMA: $1.3653
50 EMA: $1.2837
100 EMA: $1.2539
200 EMA: $1.3561
2
1
1.2k
·
--
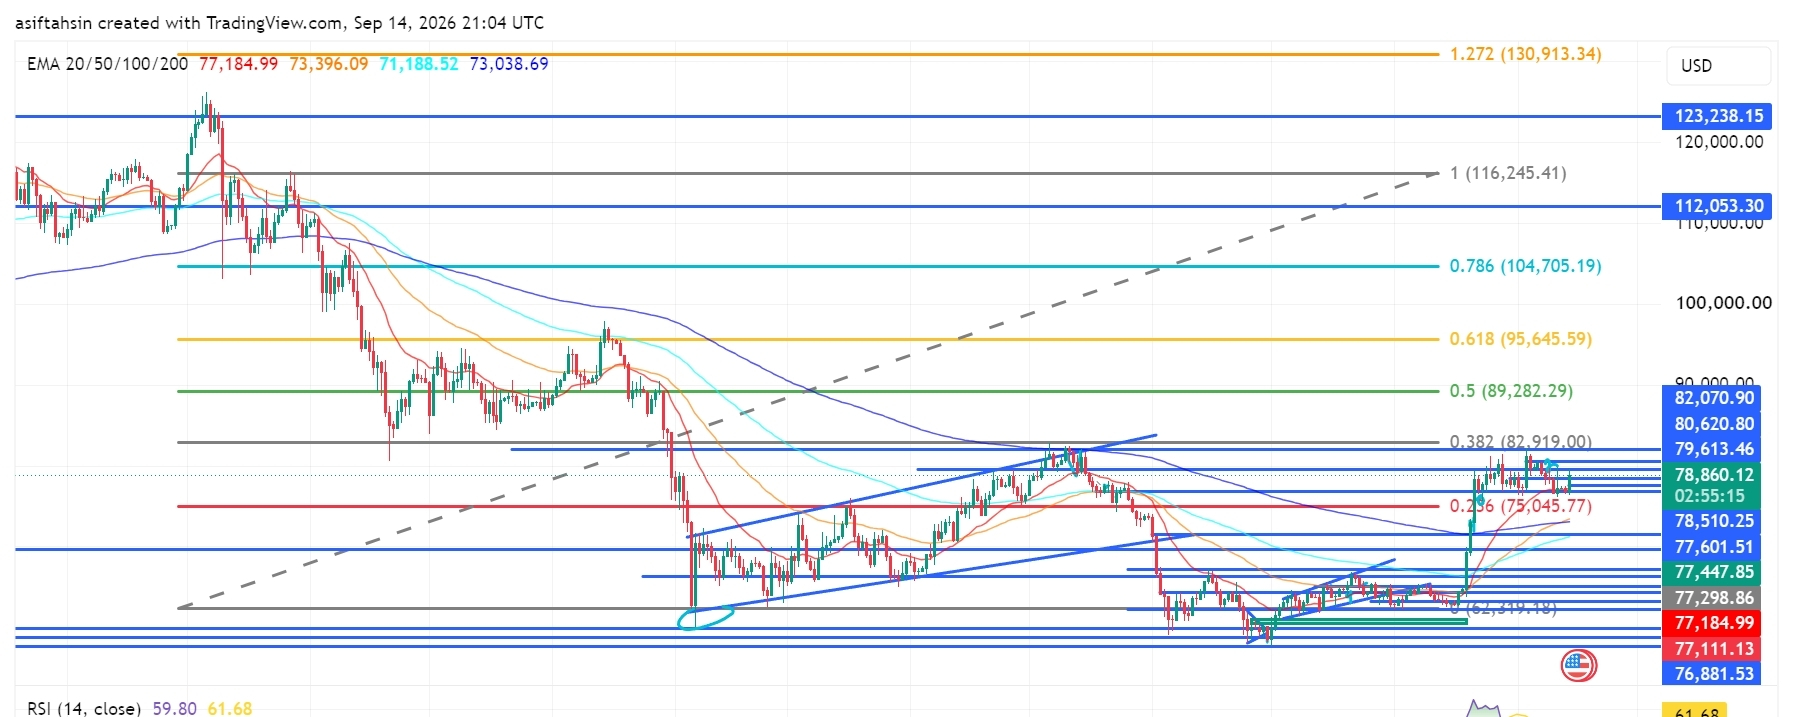
ලිපිය
බිට්කොයින් (BTC) තාක්ෂණික දැක්ම: බුල්ලා $80K–$83K ප්රතිරෝධය ඉලක්ක කරද්දී BTC $78Kට ඉහළින් රැඳී සිටියිBTC දැනට $78,860 පමණ වටා වෙළඳාම් කරමින්, ජුනි මාසයේ අඩුම මට්ටම් වලින් දැඩි ප්රතිසාධනයක් (recovery) ලැබීමෙන් පසුව $78K මට්ටමට ඉහළින් සංසන්දනය (consolidating) වෙමින් පවතී.
පුළුල් ස්ථාපිත ආකෘතිය තවමත් ධනාත්මකව පවතින අතර, BTC ප්රධාන EMA හතරටම ඉහළින් වෙළඳාම් කරයි. කෙසේ වෙතත්, මිල දැන් $79,613–$82,070 ආසන්නයේ ප්රබල ප්රතිරෝධ (resistance) කලාපයකට ළඟා වෙමින් පවතී. $82,919 ෆිබොනැචි ප්රතිරෝධය වෙත සහ ඊට ඉහළ මට්ටම් කරා යාම සඳහා බුල්ලා (bulls) මෙම කලාපය මතට පැහැදිලිව breakout (පැහැදිලි බිඳීමක්) එකක් ලබාගත යුතුය.
📈 EMA ව්යුහය
20 EMA: $77,182.98
50 EMA: $73,395.26
100 EMA: $71,188.10
බිට්කොයින් (BTC) තාක්ෂණික දැක්ම: බුල්ලා $80K–$83K ප්රතිරෝධය ඉලක්ක කරද්දී BTC $78Kට ඉහළින් රැඳී සිටියි
BTC දැනට $78,860 පමණ වටා වෙළඳාම් කරමින්, ජුනි මාසයේ අඩුම මට්ටම් වලින් දැඩි ප්රතිසාධනයක් (recovery) ලැබීමෙන් පසුව $78K මට්ටමට ඉහළින් සංසන්දනය (consolidating) වෙමින් පවතී.
පුළුල් ස්ථාපිත ආකෘතිය තවමත් ධනාත්මකව පවතින අතර, BTC ප්රධාන EMA හතරටම ඉහළින් වෙළඳාම් කරයි. කෙසේ වෙතත්, මිල දැන් $79,613–$82,070 ආසන්නයේ ප්රබල ප්රතිරෝධ (resistance) කලාපයකට ළඟා වෙමින් පවතී. $82,919 ෆිබොනැචි ප්රතිරෝධය වෙත සහ ඊට ඉහළ මට්ටම් කරා යාම සඳහා බුල්ලා (bulls) මෙම කලාපය මතට පැහැදිලිව breakout (පැහැදිලි බිඳීමක්) එකක් ලබාගත යුතුය.
📈 EMA ව්යුහය
20 EMA: $77,182.98
50 EMA: $73,395.26
100 EMA: $71,188.10
පුළුල් ස්ථාපිත ආකෘතිය තවමත් ධනාත්මකව පවතින අතර, BTC ප්රධාන EMA හතරටම ඉහළින් වෙළඳාම් කරයි. කෙසේ වෙතත්, මිල දැන් $79,613–$82,070 ආසන්නයේ ප්රබල ප්රතිරෝධ (resistance) කලාපයකට ළඟා වෙමින් පවතී. $82,919 ෆිබොනැචි ප්රතිරෝධය වෙත සහ ඊට ඉහළ මට්ටම් කරා යාම සඳහා බුල්ලා (bulls) මෙම කලාපය මතට පැහැදිලිව breakout (පැහැදිලි බිඳීමක්) එකක් ලබාගත යුතුය.
📈 EMA ව්යුහය
20 EMA: $77,182.98
50 EMA: $73,395.26
100 EMA: $71,188.10
69
·
--
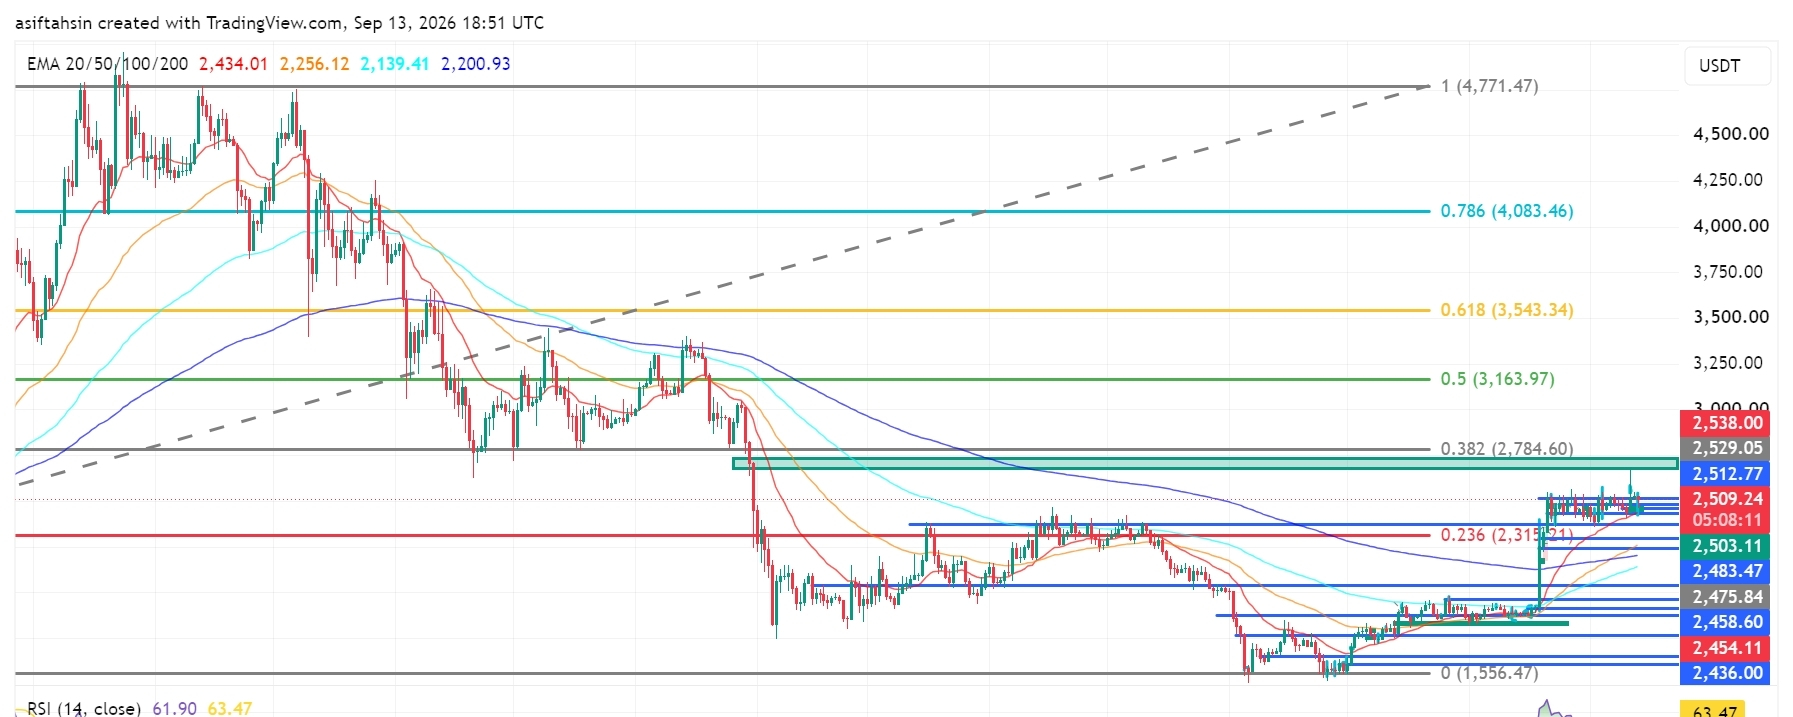
ලිපිය
Solana (SOL) နည်းပညာဆိုင်ရာ အလားအလာ: SOL သည် $100 အထက်တွင် တည်ပြီး နွားများက ပိုမိုမြင့်မားသော ခုခံမှုကို ပစ်မှတ်ထားSOL လက်ရှိတွင် $101.25 ဝန်းကျင်မှာ အေးအေးဆေးဆေး ဆက်လက်စုစည်းနေပြီး ဇွန်လအနိမ့်ပိုင်းကနေ ပြန်လည်ပြန်ကောင်းလာပြီးနောက် စိတ်ပိုင်းဆိုင်ရာ $100 အဆင့်အထက်မှာ တည်ငြိမ်နေပါသည်။
ပိုမိုကျယ်ပြန့်သောဖွဲ့စည်းပုံမှာ တိုးတက်မှုလက္ခဏာတွေ ပြသလာနေပြီး SOL သည် ယခုအချိန်တွင် အဓိက EMA လေးခုလုံးအထက်မှာ စတင်ကုန်သွယ်နေပါပြီ။ သို့သော် စျေးနှုန်းသည် $102.29–$104.64 ပတ်ဝန်းကျင်ရှိ အရေးကြီးသော ခုခံမှုအုပ်စုတစ်ခုကို သိသိသာသာ ရင်ဆိုင်နေရသည်။ နွားများက ဒီဇုန်အထက်ကို သန့်ရှင်းရှင်းဖြင့် breakout ဖြစ်မှသာ $107–$109 နယ်ပယ်ဆီသို့ လမ်းဖွင့်နိုင်ပြီး $129.49 Fibonacci ခုခံမှုအထိ ဆက်လက်သွားနိုင်မယ်လို့ ယုံကြည်ရသည်။
📈 EMA ဖွဲ့စည်းပုံ
20 EMA: $99.76
50 EMA: $92.04
100 EMA: $87.25
Solana (SOL) နည်းပညာဆိုင်ရာ အလားအလာ: SOL သည် $100 အထက်တွင် တည်ပြီး နွားများက ပိုမိုမြင့်မားသော ခုခံမှုကို ပစ်မှတ်ထား
SOL လက်ရှိတွင် $101.25 ဝန်းကျင်မှာ အေးအေးဆေးဆေး ဆက်လက်စုစည်းနေပြီး ဇွန်လအနိမ့်ပိုင်းကနေ ပြန်လည်ပြန်ကောင်းလာပြီးနောက် စိတ်ပိုင်းဆိုင်ရာ $100 အဆင့်အထက်မှာ တည်ငြိမ်နေပါသည်။
ပိုမိုကျယ်ပြန့်သောဖွဲ့စည်းပုံမှာ တိုးတက်မှုလက္ခဏာတွေ ပြသလာနေပြီး SOL သည် ယခုအချိန်တွင် အဓိက EMA လေးခုလုံးအထက်မှာ စတင်ကုန်သွယ်နေပါပြီ။ သို့သော် စျေးနှုန်းသည် $102.29–$104.64 ပတ်ဝန်းကျင်ရှိ အရေးကြီးသော ခုခံမှုအုပ်စုတစ်ခုကို သိသိသာသာ ရင်ဆိုင်နေရသည်။ နွားများက ဒီဇုန်အထက်ကို သန့်ရှင်းရှင်းဖြင့် breakout ဖြစ်မှသာ $107–$109 နယ်ပယ်ဆီသို့ လမ်းဖွင့်နိုင်ပြီး $129.49 Fibonacci ခုခံမှုအထိ ဆက်လက်သွားနိုင်မယ်လို့ ယုံကြည်ရသည်။
📈 EMA ဖွဲ့စည်းပုံ
20 EMA: $99.76
50 EMA: $92.04
100 EMA: $87.25
ပိုမိုကျယ်ပြန့်သောဖွဲ့စည်းပုံမှာ တိုးတက်မှုလက္ခဏာတွေ ပြသလာနေပြီး SOL သည် ယခုအချိန်တွင် အဓိက EMA လေးခုလုံးအထက်မှာ စတင်ကုန်သွယ်နေပါပြီ။ သို့သော် စျေးနှုန်းသည် $102.29–$104.64 ပတ်ဝန်းကျင်ရှိ အရေးကြီးသော ခုခံမှုအုပ်စုတစ်ခုကို သိသိသာသာ ရင်ဆိုင်နေရသည်။ နွားများက ဒီဇုန်အထက်ကို သန့်ရှင်းရှင်းဖြင့် breakout ဖြစ်မှသာ $107–$109 နယ်ပယ်ဆီသို့ လမ်းဖွင့်နိုင်ပြီး $129.49 Fibonacci ခုခံမှုအထိ ဆက်လက်သွားနိုင်မယ်လို့ ယုံကြည်ရသည်။
📈 EMA ဖွဲ့စည်းပုံ
20 EMA: $99.76
50 EMA: $92.04
100 EMA: $87.25
61
·
--
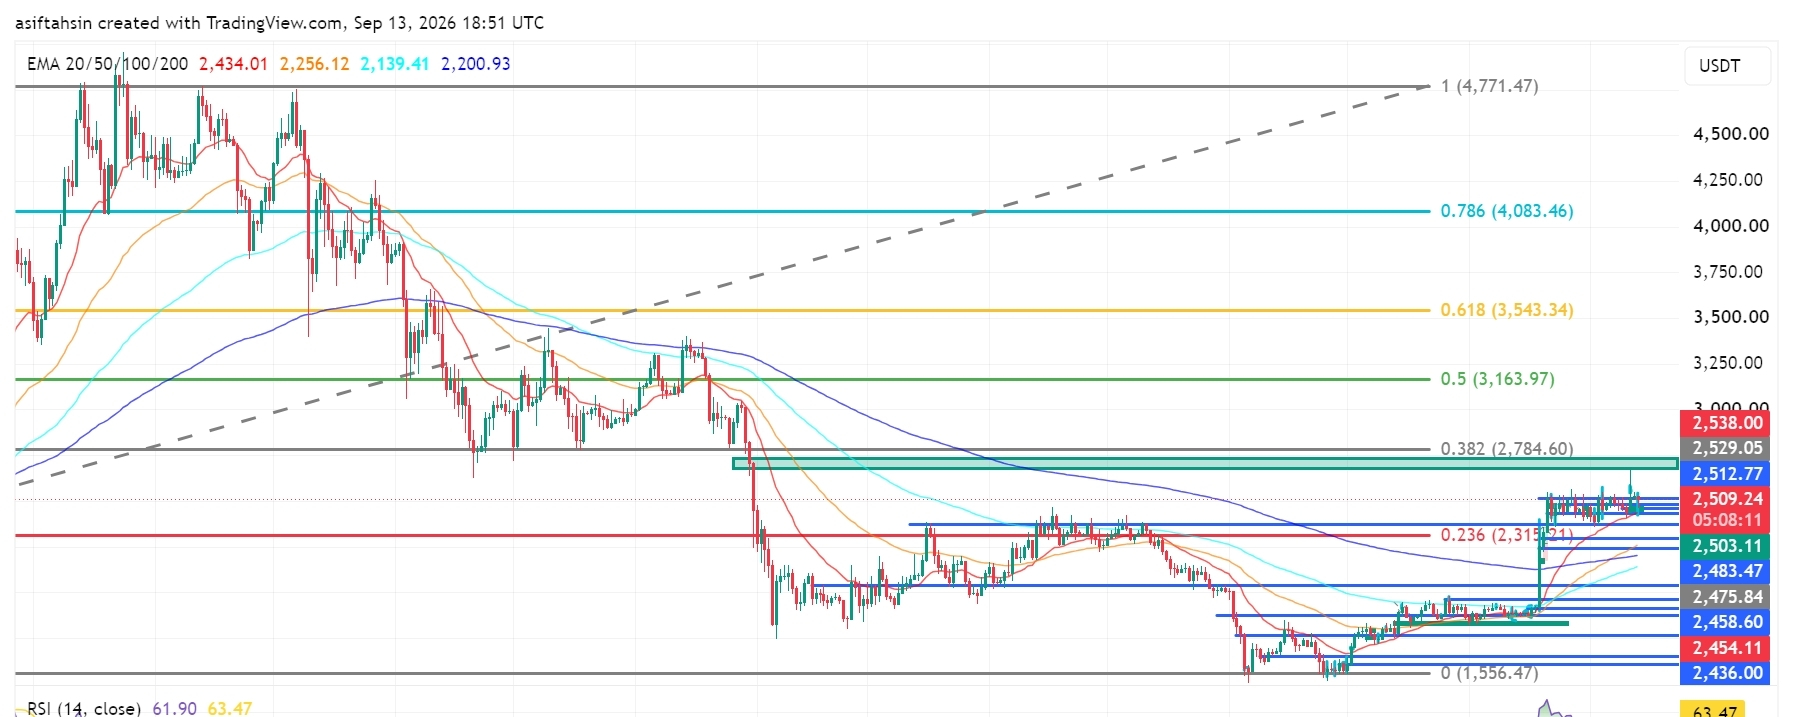
ලිපිය
ETH နည်းပညာပိုင်းဆိုင်ရာ အလားအလာ: Ethereum သည် $2.5K အထက်တွင် ရပ်တည်နေပြီး Bulls များက ပိုမိုမြင့်မားသော ခုခံမှုကို ပစ်မှတ်ထားသည်ETH သည် လက်ရှိ $2,509 ဝန်းကျင်တွင် အရောင်းအဝယ်ဖြစ်နေပြီး ဇွန်လ အနိမ့်ဆုံးအဆင့်မှ အားကောင်းစွာ ပြန်တက်လာပြီးနောက် စိတ်ပိုင်းဆိုင်ရာ $2,500 အဆင့်အထက်တွင် စုစည်းနေသည်။
ကျယ်ပြန့်သည့် ဖွဲ့စည်းပုံမှာ အပြုသဘောဆောင်နေဆဲဖြစ်ပြီး ETH သည် အဓိက EMA လေးခုလုံးအထက်တွင် ကောင်းမွန်စွာ အရောင်းအဝယ်ဖြစ်နေသည်။ သို့သော် စျေးနှုန်းသည် ယခုအခါ $2,512–$2,538 ဝန်းကျင်ရှိ အရေးကြီးသော ခုခံမှု အစုအဝေးကို နီးကပ်လာနေပြီဖြစ်သည်။ ဝက် (bulls) များအနေဖြင့် ဤဇုန်အထက်သို့ သန့်ရှင်းစွာ ပေါက်ကွဲသွားမှသာ $2,784 Fibonacci ခုခံမှုဆီသို့ လမ်းကြောင်းဖွင့်နိုင်မည်ဖြစ်သည်။
📈 EMA ၏ ဖွဲ့စည်းပုံ
20 EMA: $2,434.01
50 EMA: $2,256.12
100 EMA: $2,139.41
200 EMA: $2,200.93
ETH နည်းပညာပိုင်းဆိုင်ရာ အလားအလာ: Ethereum သည် $2.5K အထက်တွင် ရပ်တည်နေပြီး Bulls များက ပိုမိုမြင့်မားသော ခုခံမှုကို ပစ်မှတ်ထားသည်
ETH သည် လက်ရှိ $2,509 ဝန်းကျင်တွင် အရောင်းအဝယ်ဖြစ်နေပြီး ဇွန်လ အနိမ့်ဆုံးအဆင့်မှ အားကောင်းစွာ ပြန်တက်လာပြီးနောက် စိတ်ပိုင်းဆိုင်ရာ $2,500 အဆင့်အထက်တွင် စုစည်းနေသည်။
ကျယ်ပြန့်သည့် ဖွဲ့စည်းပုံမှာ အပြုသဘောဆောင်နေဆဲဖြစ်ပြီး ETH သည် အဓိက EMA လေးခုလုံးအထက်တွင် ကောင်းမွန်စွာ အရောင်းအဝယ်ဖြစ်နေသည်။ သို့သော် စျေးနှုန်းသည် ယခုအခါ $2,512–$2,538 ဝန်းကျင်ရှိ အရေးကြီးသော ခုခံမှု အစုအဝေးကို နီးကပ်လာနေပြီဖြစ်သည်။ ဝက် (bulls) များအနေဖြင့် ဤဇုန်အထက်သို့ သန့်ရှင်းစွာ ပေါက်ကွဲသွားမှသာ $2,784 Fibonacci ခုခံမှုဆီသို့ လမ်းကြောင်းဖွင့်နိုင်မည်ဖြစ်သည်။
📈 EMA ၏ ဖွဲ့စည်းပုံ
20 EMA: $2,434.01
50 EMA: $2,256.12
100 EMA: $2,139.41
200 EMA: $2,200.93
ကျယ်ပြန့်သည့် ဖွဲ့စည်းပုံမှာ အပြုသဘောဆောင်နေဆဲဖြစ်ပြီး ETH သည် အဓိက EMA လေးခုလုံးအထက်တွင် ကောင်းမွန်စွာ အရောင်းအဝယ်ဖြစ်နေသည်။ သို့သော် စျေးနှုန်းသည် ယခုအခါ $2,512–$2,538 ဝန်းကျင်ရှိ အရေးကြီးသော ခုခံမှု အစုအဝေးကို နီးကပ်လာနေပြီဖြစ်သည်။ ဝက် (bulls) များအနေဖြင့် ဤဇုန်အထက်သို့ သန့်ရှင်းစွာ ပေါက်ကွဲသွားမှသာ $2,784 Fibonacci ခုခံမှုဆီသို့ လမ်းကြောင်းဖွင့်နိုင်မည်ဖြစ်သည်။
📈 EMA ၏ ဖွဲ့စည်းပုံ
20 EMA: $2,434.01
50 EMA: $2,256.12
100 EMA: $2,139.41
200 EMA: $2,200.93
83
·
--
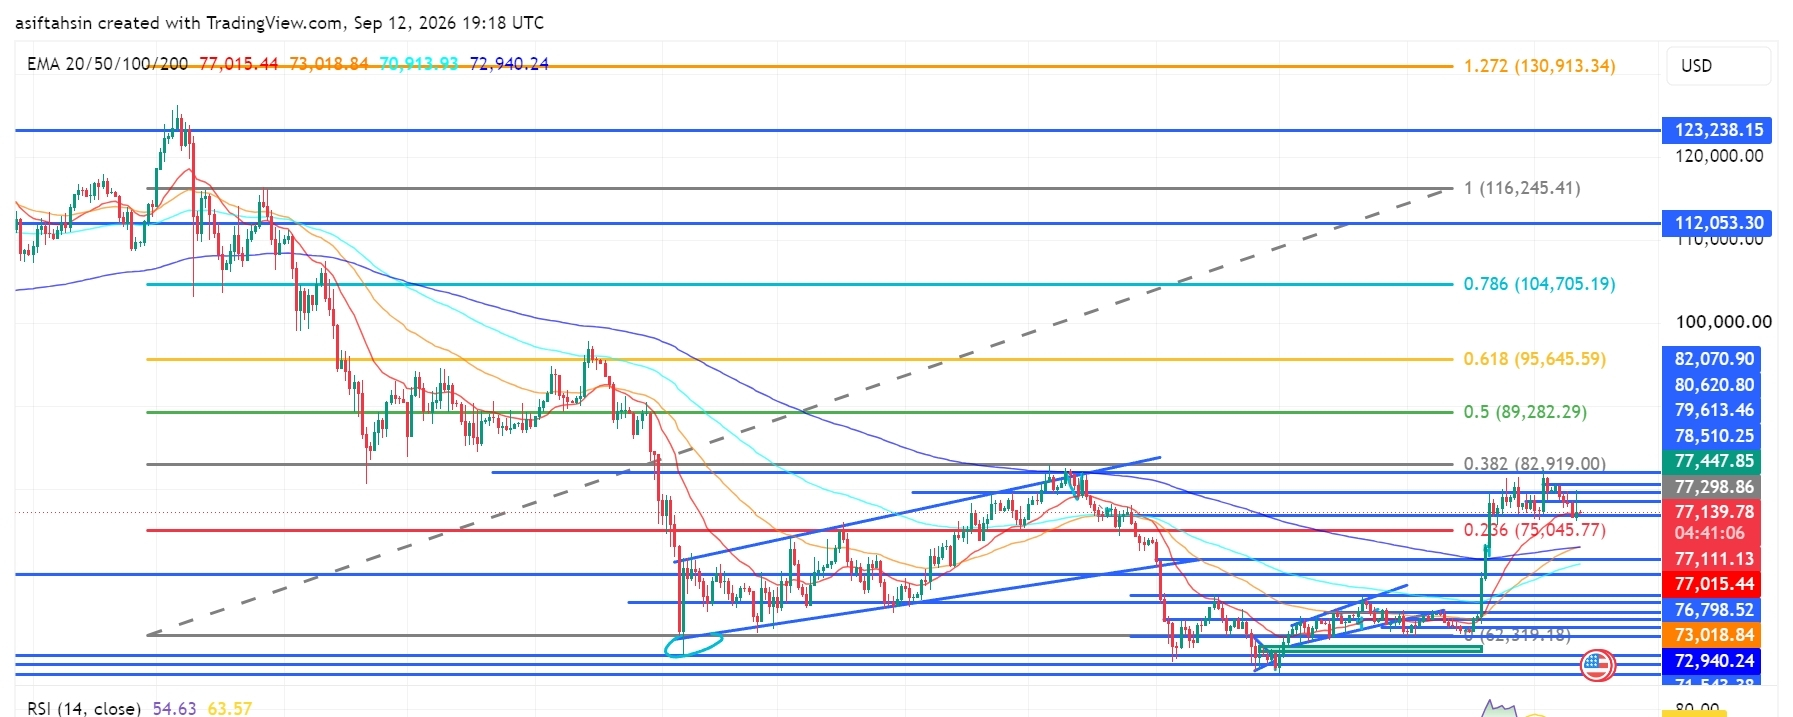
ලිපිය
BTC နည်းပညာဆိုင်ရာ အမြင်- Bitcoin သည် Bulls များ breakout ကို ကာကွယ်နေချိန်တွင် $77K အထက်တွင် ရှိနေသည်BTC သည် လက်ရှိတွင် $77.1K အနီးတွင် ရောင်းဝယ်နေပြီး မကြာသေးမီက အပြုသဘောဆောင်သော ပြန်လည်မြင့်တက်မှုနောက်နည်း $75K–$77K breakout ဇုန်အပေါ်တွင် စုစည်းနေသည်။
အကြီးမားဆုံးသော ဖွဲ့စည်းပုံမှာ ဆက်လက်အပြုသဘောဆောင်နေပါသေးသော်လည်း BTC သည် $77.4K–$82.9K အနီးတွင် ပြင်းထန်သော ခုခံမှုကို ရင်ဆိုင်နေရသည်။ ခုခံမှုအုပ်စုကို ပြန်လည် သိမ်းယူပြီး နောက်ထပ် အဓိက အထက်ဘက်သို့ တိုးချဲ့မှုကို လွှတ်ပေးရန်အတွက် $82,919 ဖီဘိုနာချီ အဆင့်ကို ကျော်တက်ဖို့ Bulls များ လိုအပ်သည်။
📈 EMA ဖွဲ့စည်းပုံ
20 EMA: $77,015.44
50 EMA: $73,018.84
100 EMA: $70,913.93
200 EMA: $72,940.24
BTC သည် လက်ရှိတွင် 20 EMA အထက်အနည်းငယ်တွင် ထိန်းထားနေပြီး 50၊ 100 နှင့် 200 EMA များအပေါ်တွင်လည်း ဆက်လက်တည်ရှိနေသည်။
BTC နည်းပညာဆိုင်ရာ အမြင်- Bitcoin သည် Bulls များ breakout ကို ကာကွယ်နေချိန်တွင် $77K အထက်တွင် ရှိနေသည်
BTC သည် လက်ရှိတွင် $77.1K အနီးတွင် ရောင်းဝယ်နေပြီး မကြာသေးမီက အပြုသဘောဆောင်သော ပြန်လည်မြင့်တက်မှုနောက်နည်း $75K–$77K breakout ဇုန်အပေါ်တွင် စုစည်းနေသည်။
အကြီးမားဆုံးသော ဖွဲ့စည်းပုံမှာ ဆက်လက်အပြုသဘောဆောင်နေပါသေးသော်လည်း BTC သည် $77.4K–$82.9K အနီးတွင် ပြင်းထန်သော ခုခံမှုကို ရင်ဆိုင်နေရသည်။ ခုခံမှုအုပ်စုကို ပြန်လည် သိမ်းယူပြီး နောက်ထပ် အဓိက အထက်ဘက်သို့ တိုးချဲ့မှုကို လွှတ်ပေးရန်အတွက် $82,919 ဖီဘိုနာချီ အဆင့်ကို ကျော်တက်ဖို့ Bulls များ လိုအပ်သည်။
📈 EMA ဖွဲ့စည်းပုံ
20 EMA: $77,015.44
50 EMA: $73,018.84
100 EMA: $70,913.93
200 EMA: $72,940.24
BTC သည် လက်ရှိတွင် 20 EMA အထက်အနည်းငယ်တွင် ထိန်းထားနေပြီး 50၊ 100 နှင့် 200 EMA များအပေါ်တွင်လည်း ဆက်လက်တည်ရှိနေသည်။
အကြီးမားဆုံးသော ဖွဲ့စည်းပုံမှာ ဆက်လက်အပြုသဘောဆောင်နေပါသေးသော်လည်း BTC သည် $77.4K–$82.9K အနီးတွင် ပြင်းထန်သော ခုခံမှုကို ရင်ဆိုင်နေရသည်။ ခုခံမှုအုပ်စုကို ပြန်လည် သိမ်းယူပြီး နောက်ထပ် အဓိက အထက်ဘက်သို့ တိုးချဲ့မှုကို လွှတ်ပေးရန်အတွက် $82,919 ဖီဘိုနာချီ အဆင့်ကို ကျော်တက်ဖို့ Bulls များ လိုအပ်သည်။
📈 EMA ဖွဲ့စည်းပုံ
20 EMA: $77,015.44
50 EMA: $73,018.84
100 EMA: $70,913.93
200 EMA: $72,940.24
BTC သည် လက်ရှိတွင် 20 EMA အထက်အနည်းငယ်တွင် ထိန်းထားနေပြီး 50၊ 100 နှင့် 200 EMA များအပေါ်တွင်လည်း ဆက်လက်တည်ရှိနေသည်။
37
තවත් අන්තර්ගතයන් ගවේෂණය කිරීමට ඇතුල් වන්න
Binance චතුරශ්රය හි ගෝලීය ක්රිප්ටෝ පරිශීලකයින් හා එක්වන්න
⚡️ ක්රිප්ටෝ පිළිබඳ නවතම සහ ප්රයෝජනවත් තොරතුරු ලබා ගන්න.
💬 ලොව විශාලතම ක්රිප්ටෝ හුවමාරුව මගින් විශ්වාස කෙරේ.
👍 සත්යායනය කරන ලද නිර්මාණකරුවන්ගෙන් සැබෑ විදසුන් සොයා ගන්න.
විද්යුත් තැපෑල / දුරකථන අංකය
නැගී එන මාතෘකා
AIStocksWhatNext
129,053 views
1,602 සාකච්ඡා කරමින්
අපගේ ඉතාමත් ජනප්රිය හැෂ්ටැග් ව්යාපාරයේදී “Share & Win” මඟින් ගමනාගමන ත්යාග ලබා ගන්න
✨මාතෘකාව: AI කොටස් ඉහළ යමින් පවතිද්දී තවත් ආයෝජන අවස්ථා මොනවාද?
👉සම්බන්ධ වන්නේ කෙසේද:
හැෂ්ටැග් #AIStocksWhatNext සමඟ කෙටි පෝස්ට් එකක් හෝ ලිපියක් පළ කරන්න
ඔබ බුලිෂ් ද බෙයරිෂ් ද යන්න සඳහන් කර ඔබේ AI කොටස් හෝ වෙළඳාම පළ කරන්න — වෙළඳ විජට් එක භාවිතා කිරීම ඔබේ සුදුසුකම වැඩි කළ හැක.
දත්ත හෝ චාර්ට් බෙදාගනිමින් සහ AI මඟින් ජනනය කළ රූප මඟහරිමින් ඔබගේ පෝස්ට් එක තවදුරටත් ශක්තිමත් කළ හැක.
✍️පහත කෝණ අනුව අන්තර්ගතය සාදන්න:
- Nvidia පවසන්නේ ලබන වසරේ චිප් විකුණුම් දෙගුණ වන බවත්, ඉහළ AI සමාගම් දිගටම වාර්තාගත ආදායම් ලබා ගැනීමත් සිදුවන බවත් ය. ඒ සඳහා ඇති compute වියදමද අතිවිශාලය. ඇත්තටම AI ඉල්ලුම ඉහළ යනවාද? තව කොතරම් කාලයක් මෙය පවතින්න පුළුවන්ද? AI කොටස් මුළුම තැනම ඉහළ ගොස් ඇත. මෙය සැබෑ breakout එකක්ද, නැත්තම් කෙටි කාලීන bounce එකක්ද?
- කර්මාන්තයේ නායකයෝ AI සංවර්ධනය මන්දගාමී කිරීමට කියා සිටින අතර, Trump “AI Force” එකක් ගොඩනඟීමට සැලසුම් කරමින්, අනාගතයේ AI එක්සත් ජනපදයේ GDP වලින් 25%ක් දක්වා ගත හැකි බව පවසයි. ඔබ කාගේ පැත්තේද? AI කොටස් සඳහා ප්රාන්ත මට්ටමේ සහාය දිගුකාලීන ජයග්රහණයක් වේද?
- ඔබ AI කොටස් මිලදී ගන්නවාද? අපගේ වෙළඳ බෙදාගැනීමේ විජට් එක හරහා ඔබේ AI-අදාළ වෙළඳාම/පැවැත්වීම් බෙදාගන්න.
⏰ව්යාපාර කාලය:
- 2026-09-22 7:00 - 2026-09-24 4:00 UTC
🎁ත්යාගය:
- ඉහත මාර්ගෝපදේශවලට අනුකූල වන අතර වචන 100කට වඩා අඩංගු සුදුසුකම් ලත් පෝස්ට් පරීක්ෂා කරනු ලබන අතර, 500 සිට 3,000 දක්වා වූ අහඹු ගමනාගමන වැඩිවීමක් ලැබීමටද ඉඩ ඇත. ඔබේ පෝස්ට් එක තෝරාගනු ලැබුවහොත් ඔබට ඔබේ feed secretary වෙතින් දැනුම්දීමක් ලැබෙනු ඇත.
- ඔබගේ ලිපිය Binance Square Official හි පළ කිරීමට අවස්ථාවක් ලබා ගන්න
ඔබේ පෝස්ට් එකට අදහස් අවශ්යද? මාතෘකා පිටුවට පිවිසෙන්න #AIStocksWhatNext හෝ Square Guide on How to Post for Better Reach.
Binance Square Official
·241 කැමත්ත දැක්වීම්
·444.2k views
BitcoinBreaksAboveMayHighNears$86K
3,178 views
58 සාකච්ඡා කරමින්
DogecoinRises15%
7,907 views
378 සාකච්ඡා කරමින්