
Kroumi
141 පෝස්ටු

Kroumi
වාර්තා කරන්න
පරිශීලක අවහිර කරන්න
Researcher • Crypto • Web3
විවෘත වෙළෙඳාම
නිතර වෙළෙන්දා
{වේලාව} වසර
3 හඹා යමින්
4.8K+ හඹා යන්නන්
1.6K+ කැමති විය
පෝස්ටු
ආයෝජන කළඹ
සියල්ල
උපුටා දැක්වීම්
අමුණා ඇත
·
--

ලිපිය
This Pattern Repeats With New Projects - How To Find The Perfect Entry Point? Knowing this feature, you'll be able to find the perfect buying zones!
Here are Top-5 examples of new projects that have come out recently and this pattern has worked:
An important note: Everything written here is purely my observation based on my experience and analysis of price behavior. Never follow other people's advice blindly, always do your own research.
So now, I'll try to convey to you my view of the charts, let's get started!
The first coin on my list - $APT
As you can see, the token dropped by 68% almost immediately after its launch after which there was rapid growth. In other words, the coin has hit a so-called bottom around 68% of the close of its first candles.
Yes, we are looking at the higher timeframes now as they are more accurate. It's important to use candle bodies, shadows are not as important.
The second one is $SUI
The situation here is similar - a 68% drop followed by a recovery. In both charts, the price bottom was literally in the same range, if we're using percentages.
Okay, you all also know ARB
Nothing changes, after a local top, the price is going for a correction of about -60%. In all cases, we see a solid rise after the dip. Knowing this technique, you can do well in the market if you implement it into your strategy.
The next coin is SEI
Look at this chart! This pattern bears a striking resemblance to past examples.
I'd also like to emphasize a rather old coin - UNI
The price made a 65% drop and quickly bounced back, which can still be attributed to the series of the same model.
A little bonus:
ID dropped by 80%. Yes, a little more than usual but you just look at the growth that happened after!
And now a final, rhetorical question:
Will $NOT repeat this pattern?
I know that there is not much information and it is too early to say. But I dare to suggest this option, maybe it will be a better buying zone.
Let's summarize:
The “-60% pattern” should not be overlooked It's important to use candle bodies Key values are 55%-65% or so Using higher timeframes (1D, 1W)
I've given you new ground to ponder. I hope you found my observations useful and you gain profit from this information in the future. Thank you for reading!
#altcoins
#educational
#notcoin
#PatternRecognition
#TrendingArticle
This Pattern Repeats With New Projects - How To Find The Perfect Entry Point?
Knowing this feature, you'll be able to find the perfect buying zones!
Here are Top-5 examples of new projects that have come out recently and this pattern has worked:
An important note: Everything written here is purely my observation based on my experience and analysis of price behavior. Never follow other people's advice blindly, always do your own research.
So now, I'll try to convey to you my view of the charts, let's get started!
The first coin on my list - $APT
As you can see, the token dropped by 68% almost immediately after its launch after which there was rapid growth. In other words, the coin has hit a so-called bottom around 68% of the close of its first candles.
Yes, we are looking at the higher timeframes now as they are more accurate. It's important to use candle bodies, shadows are not as important.
The second one is $SUI
The situation here is similar - a 68% drop followed by a recovery. In both charts, the price bottom was literally in the same range, if we're using percentages.
Okay, you all also know ARB
Nothing changes, after a local top, the price is going for a correction of about -60%. In all cases, we see a solid rise after the dip. Knowing this technique, you can do well in the market if you implement it into your strategy.
The next coin is SEI
Look at this chart! This pattern bears a striking resemblance to past examples.
I'd also like to emphasize a rather old coin - UNI
The price made a 65% drop and quickly bounced back, which can still be attributed to the series of the same model.
A little bonus:
ID dropped by 80%. Yes, a little more than usual but you just look at the growth that happened after!
And now a final, rhetorical question:
Will $NOT repeat this pattern?
I know that there is not much information and it is too early to say. But I dare to suggest this option, maybe it will be a better buying zone.
Let's summarize:
The “-60% pattern” should not be overlooked It's important to use candle bodies Key values are 55%-65% or so Using higher timeframes (1D, 1W)
I've given you new ground to ponder. I hope you found my observations useful and you gain profit from this information in the future. Thank you for reading!
#altcoins
#educational
#notcoin
#PatternRecognition
#TrendingArticle
Here are Top-5 examples of new projects that have come out recently and this pattern has worked:
An important note: Everything written here is purely my observation based on my experience and analysis of price behavior. Never follow other people's advice blindly, always do your own research.
So now, I'll try to convey to you my view of the charts, let's get started!
The first coin on my list - $APT
As you can see, the token dropped by 68% almost immediately after its launch after which there was rapid growth. In other words, the coin has hit a so-called bottom around 68% of the close of its first candles.
Yes, we are looking at the higher timeframes now as they are more accurate. It's important to use candle bodies, shadows are not as important.
The second one is $SUI
The situation here is similar - a 68% drop followed by a recovery. In both charts, the price bottom was literally in the same range, if we're using percentages.
Okay, you all also know ARB
Nothing changes, after a local top, the price is going for a correction of about -60%. In all cases, we see a solid rise after the dip. Knowing this technique, you can do well in the market if you implement it into your strategy.
The next coin is SEI
Look at this chart! This pattern bears a striking resemblance to past examples.
I'd also like to emphasize a rather old coin - UNI
The price made a 65% drop and quickly bounced back, which can still be attributed to the series of the same model.
A little bonus:
ID dropped by 80%. Yes, a little more than usual but you just look at the growth that happened after!
And now a final, rhetorical question:
Will $NOT repeat this pattern?
I know that there is not much information and it is too early to say. But I dare to suggest this option, maybe it will be a better buying zone.
Let's summarize:
The “-60% pattern” should not be overlooked It's important to use candle bodies Key values are 55%-65% or so Using higher timeframes (1D, 1W)
I've given you new ground to ponder. I hope you found my observations useful and you gain profit from this information in the future. Thank you for reading!
#altcoins
#educational
#notcoin
#PatternRecognition
#TrendingArticle
2
2
26
18.1k
·
--
උසබ තත්ත්වය
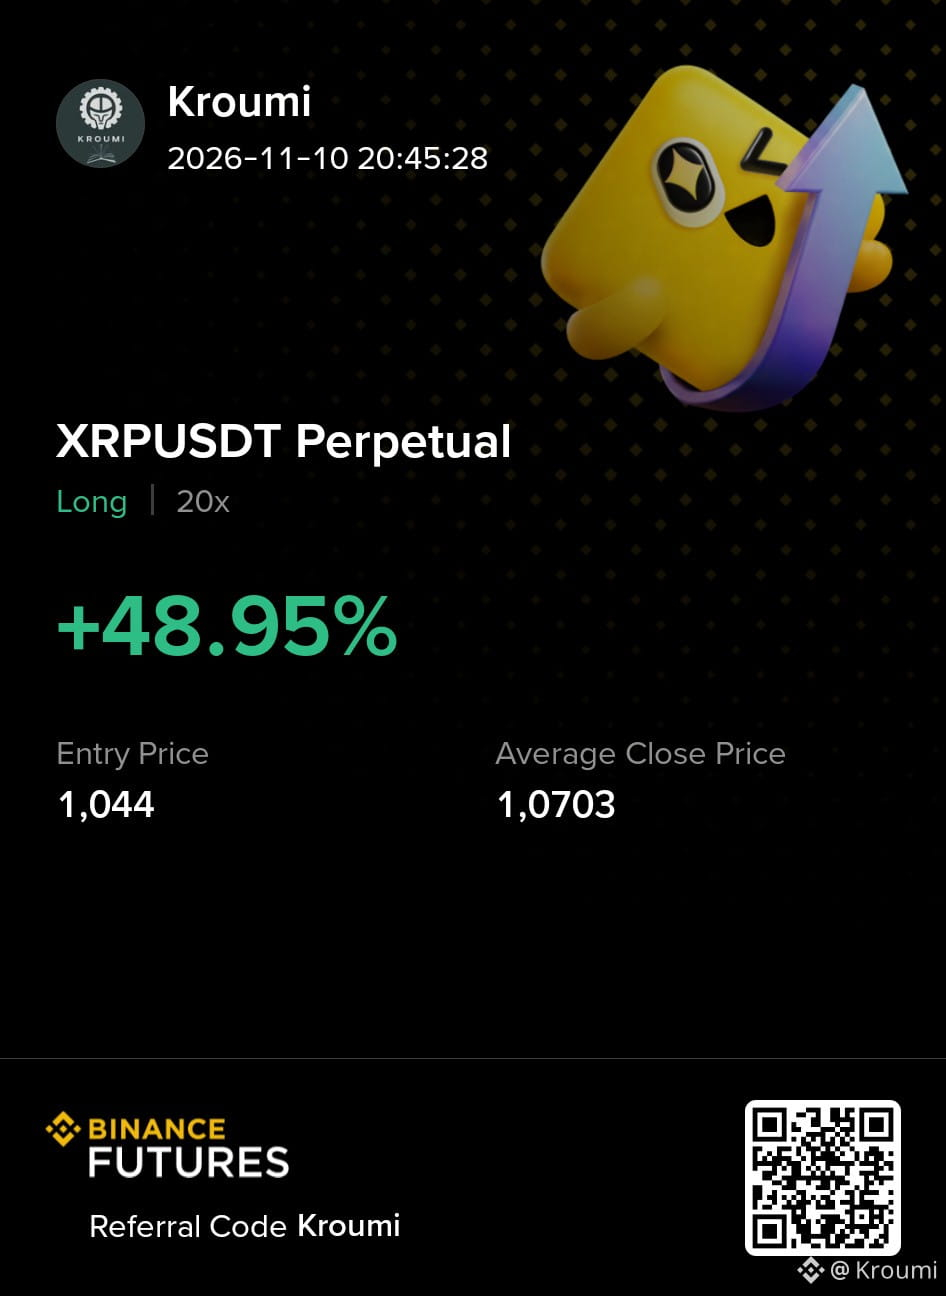
$XRP has almost reached the $1 mark, and it's good to scalp on a short timeframe.
Based on my observations, when approaching round psychological levels, it’s worth taking a closer look at the 1-minute timeframe, for example.
Do you think the rebound will be stronger, or did I close my position too early?
$XRP has almost reached the $1 mark, and it's good to scalp on a short timeframe.
Based on my observations, when approaching round psychological levels, it’s worth taking a closer look at the 1-minute timeframe, for example.
Do you think the rebound will be stronger, or did I close my position too early?
Based on my observations, when approaching round psychological levels, it’s worth taking a closer look at the 1-minute timeframe, for example.
Do you think the rebound will be stronger, or did I close my position too early?
1
200
·
--
උසබ තත්ත්වය
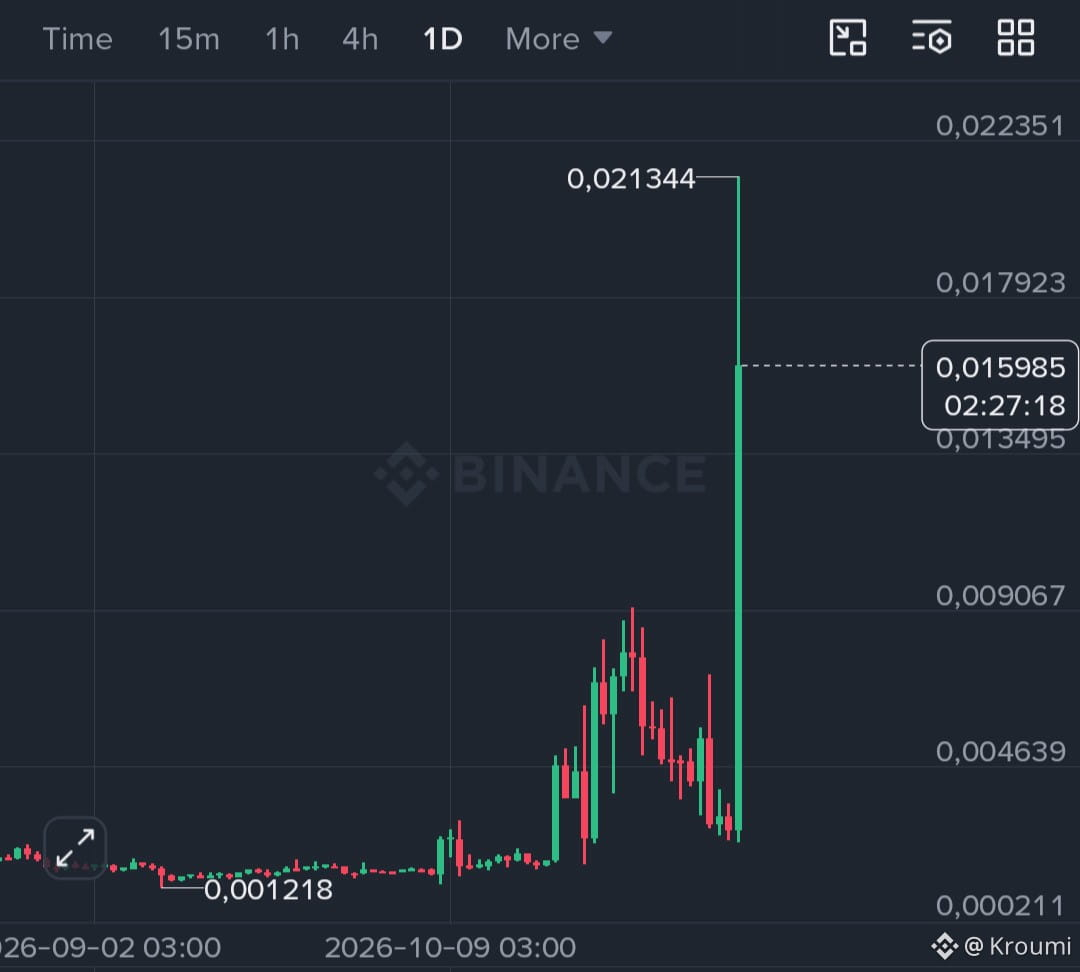
$JCT is going hard!
+460% per day — long time no see such a big move.
The open interest is growing up so this is why many people are drawn to this anomaly in a falling market.
I think this is a good opportunity for short-term traders, as long as the chart is analyzed carefully.
{future}(JCTUSDT)
$JCT is going hard!
+460% per day — long time no see such a big move.
The open interest is growing up so this is why many people are drawn to this anomaly in a falling market.
I think this is a good opportunity for short-term traders, as long as the chart is analyzed carefully.
+460% per day — long time no see such a big move.
The open interest is growing up so this is why many people are drawn to this anomaly in a falling market.
I think this is a good opportunity for short-term traders, as long as the chart is analyzed carefully.
112
·
--
උසබ තත්ත්වය
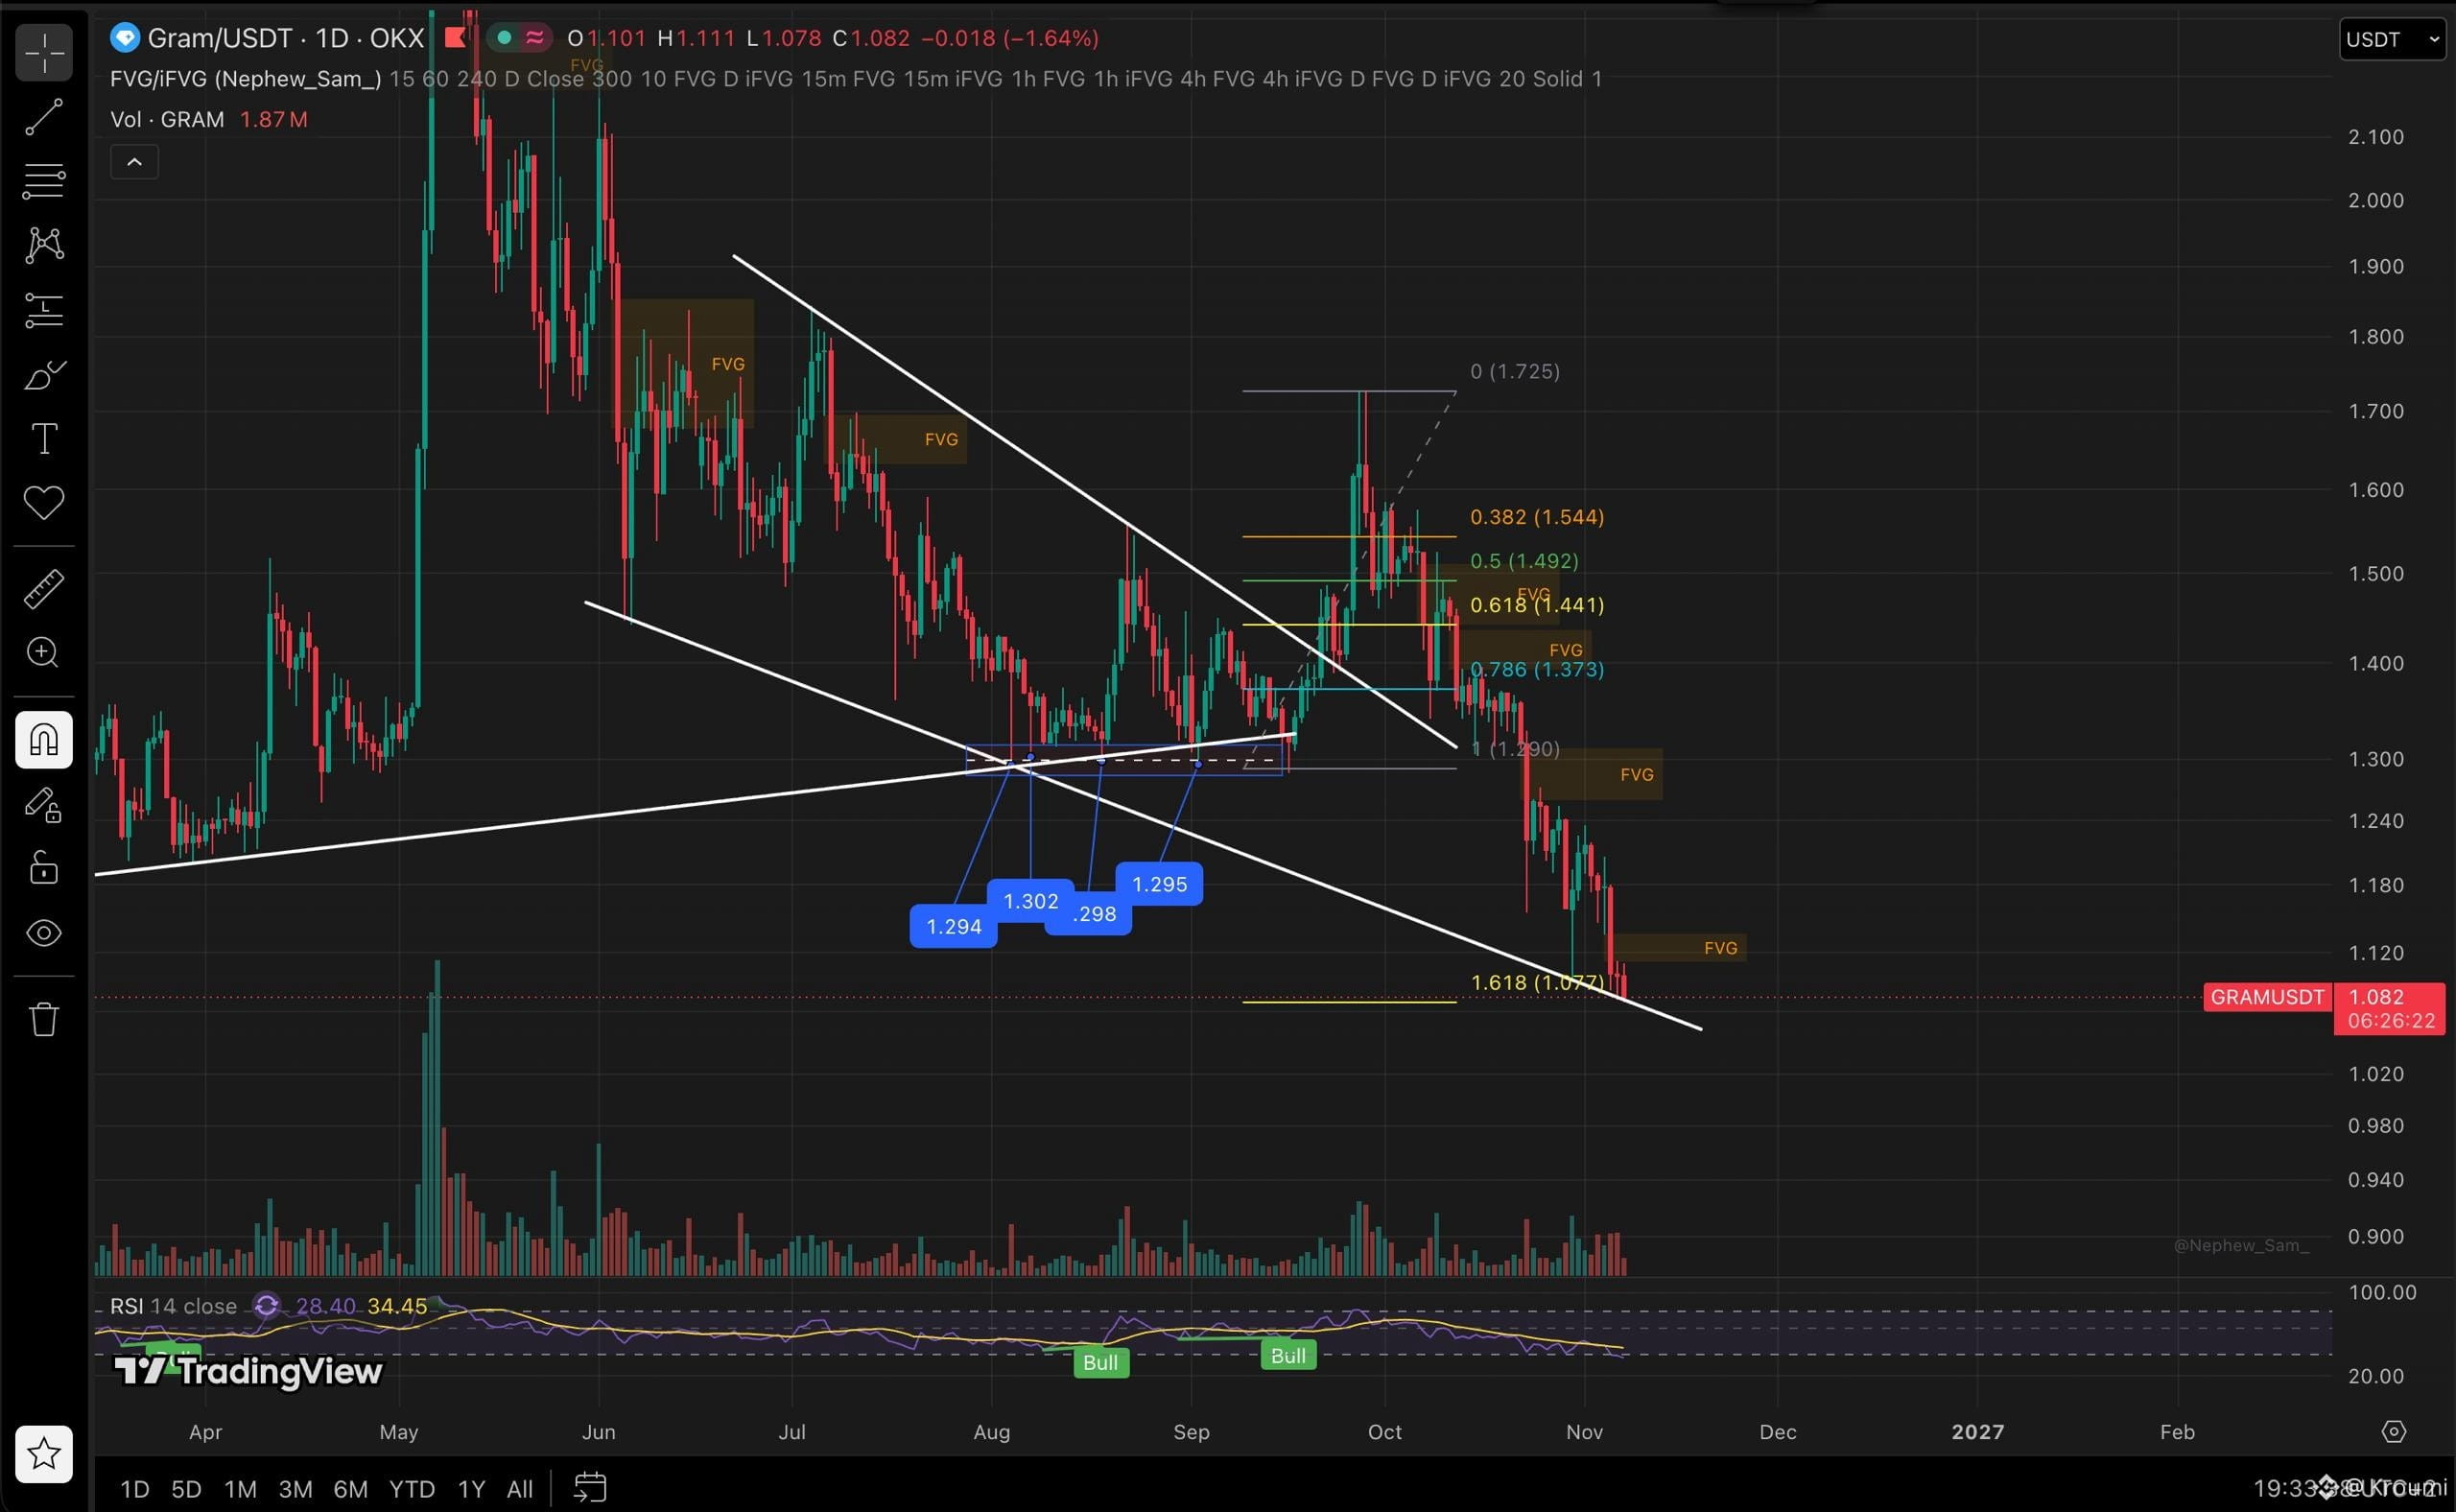
$GRAM is ready for a bounce!
The trend line and support zone are holding the price level.
I'm expecting a reversal and a move back toward $1.7
According to the charts, soon we will see a reversal of the prolonged downtrend, so I think right now is a good opportunity to go long or buy on the spot.
Actions need to be taken near key areas of interest, and we are currently near one of them.
{future}(GRAMUSDT)
$GRAM is ready for a bounce!
The trend line and support zone are holding the price level.
I'm expecting a reversal and a move back toward $1.7
According to the charts, soon we will see a reversal of the prolonged downtrend, so I think right now is a good opportunity to go long or buy on the spot.
Actions need to be taken near key areas of interest, and we are currently near one of them.
The trend line and support zone are holding the price level.
I'm expecting a reversal and a move back toward $1.7
According to the charts, soon we will see a reversal of the prolonged downtrend, so I think right now is a good opportunity to go long or buy on the spot.
Actions need to be taken near key areas of interest, and we are currently near one of them.
8
6.2k
·
--
උසබ තත්ත්වය
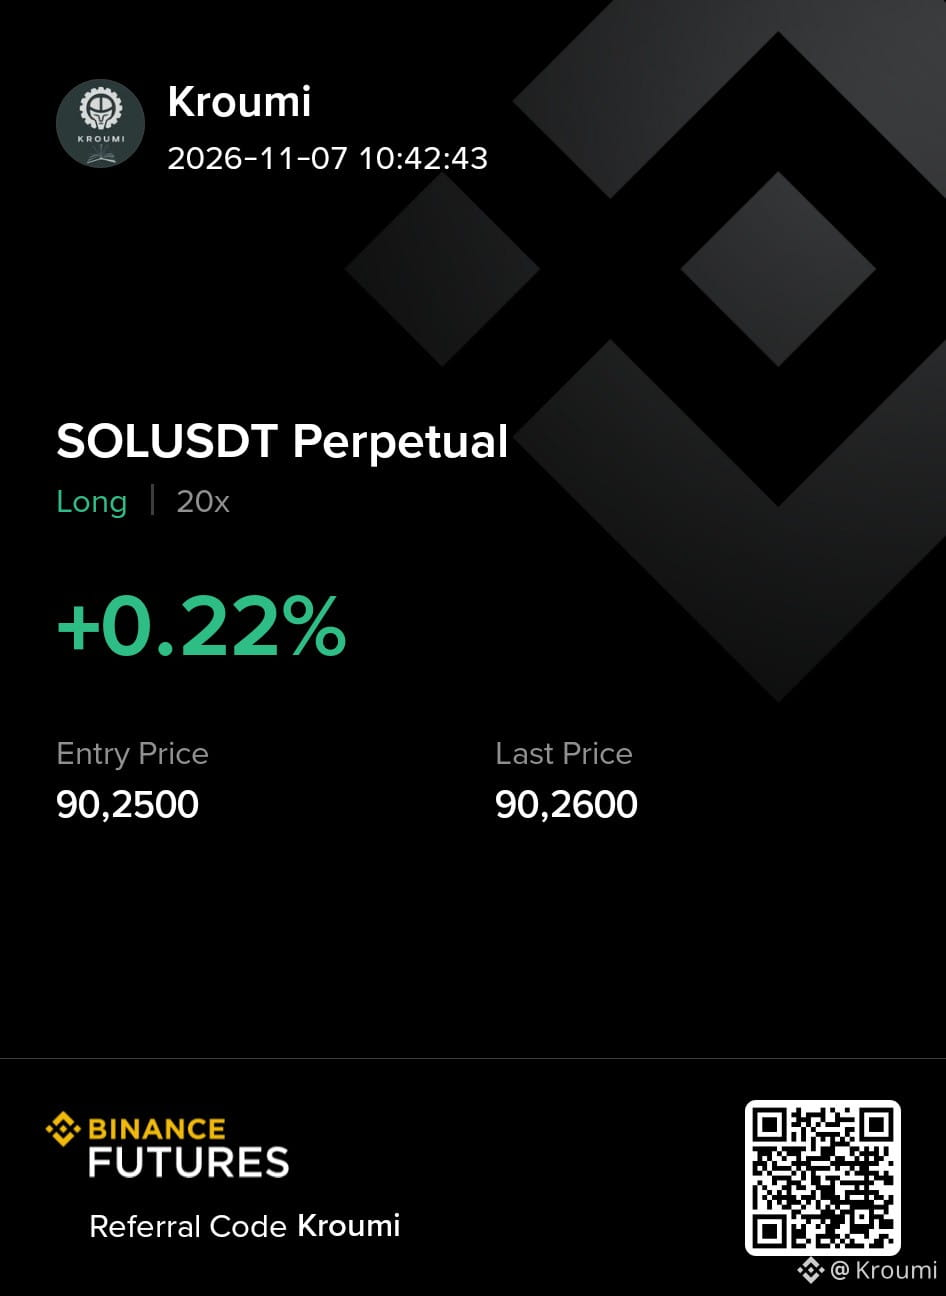
$SOL — LONG
Entry: 90.25
Take: 94
Stop: 88.5
There is a large bearish candle on the chart, and we can try to catch the price as it retraces toward the middle of that candle.
Risk/reward ratio is 1:2
{future}(SOLUSDT)
$SOL — LONG
Entry: 90.25
Take: 94
Stop: 88.5
There is a large bearish candle on the chart, and we can try to catch the price as it retraces toward the middle of that candle.
Risk/reward ratio is 1:2
Entry: 90.25
Take: 94
Stop: 88.5
There is a large bearish candle on the chart, and we can try to catch the price as it retraces toward the middle of that candle.
Risk/reward ratio is 1:2
165
·
--
උසබ තත්ත්වය
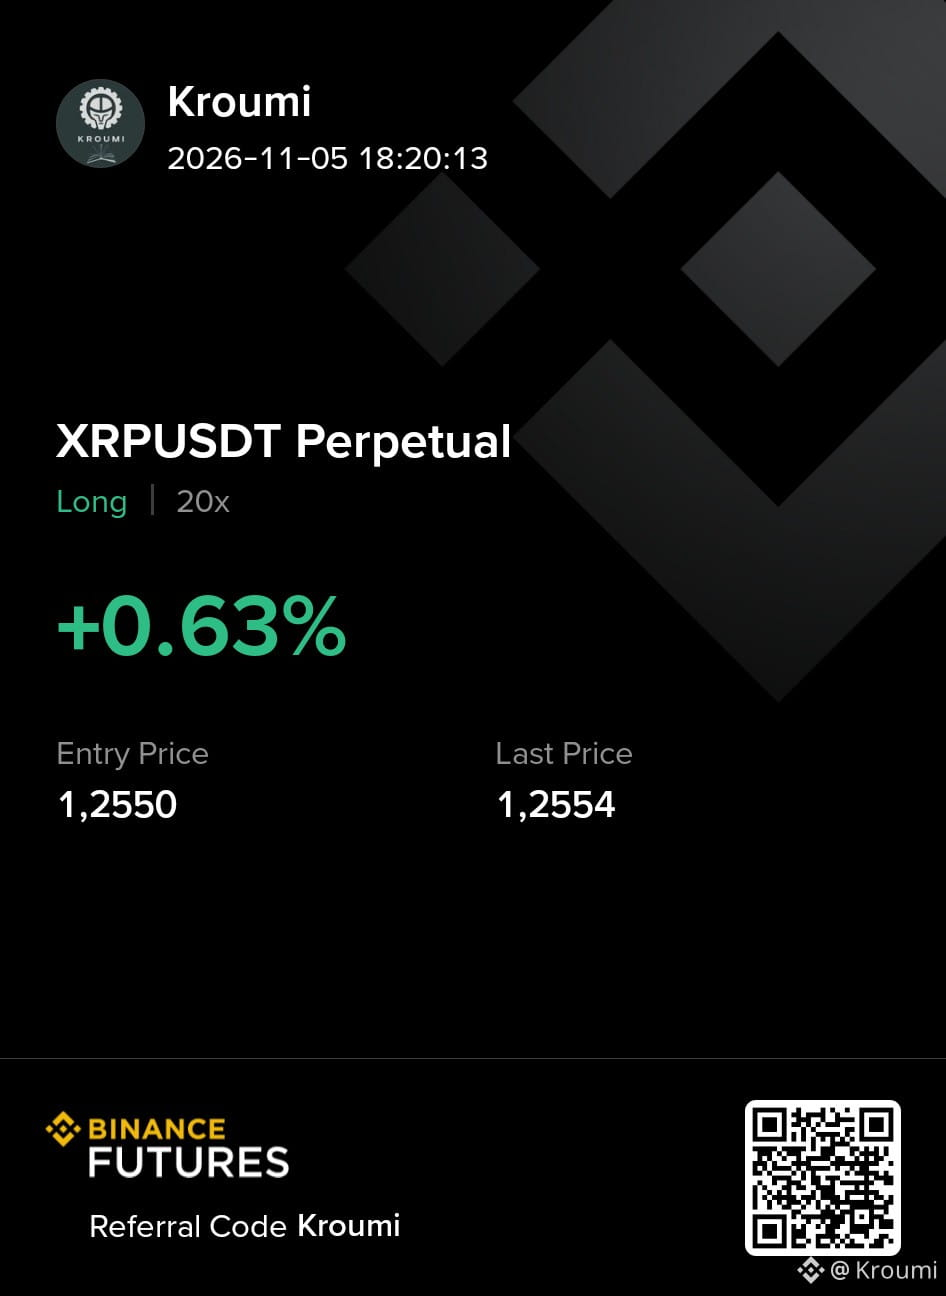
$XRP LONG right now (RR 1:2)
Entry: 1.255
Take: 1.287
Stop: 1.24
While the market is showing signs of weakness, there's an opportunity to catch a local rebound, so I'm trying a long position with good risk management.
{future}(XRPUSDT)
$XRP LONG right now (RR 1:2)
Entry: 1.255
Take: 1.287
Stop: 1.24
While the market is showing signs of weakness, there's an opportunity to catch a local rebound, so I'm trying a long position with good risk management.
Entry: 1.255
Take: 1.287
Stop: 1.24
While the market is showing signs of weakness, there's an opportunity to catch a local rebound, so I'm trying a long position with good risk management.
181
·
--
උසබ තත්ත්වය
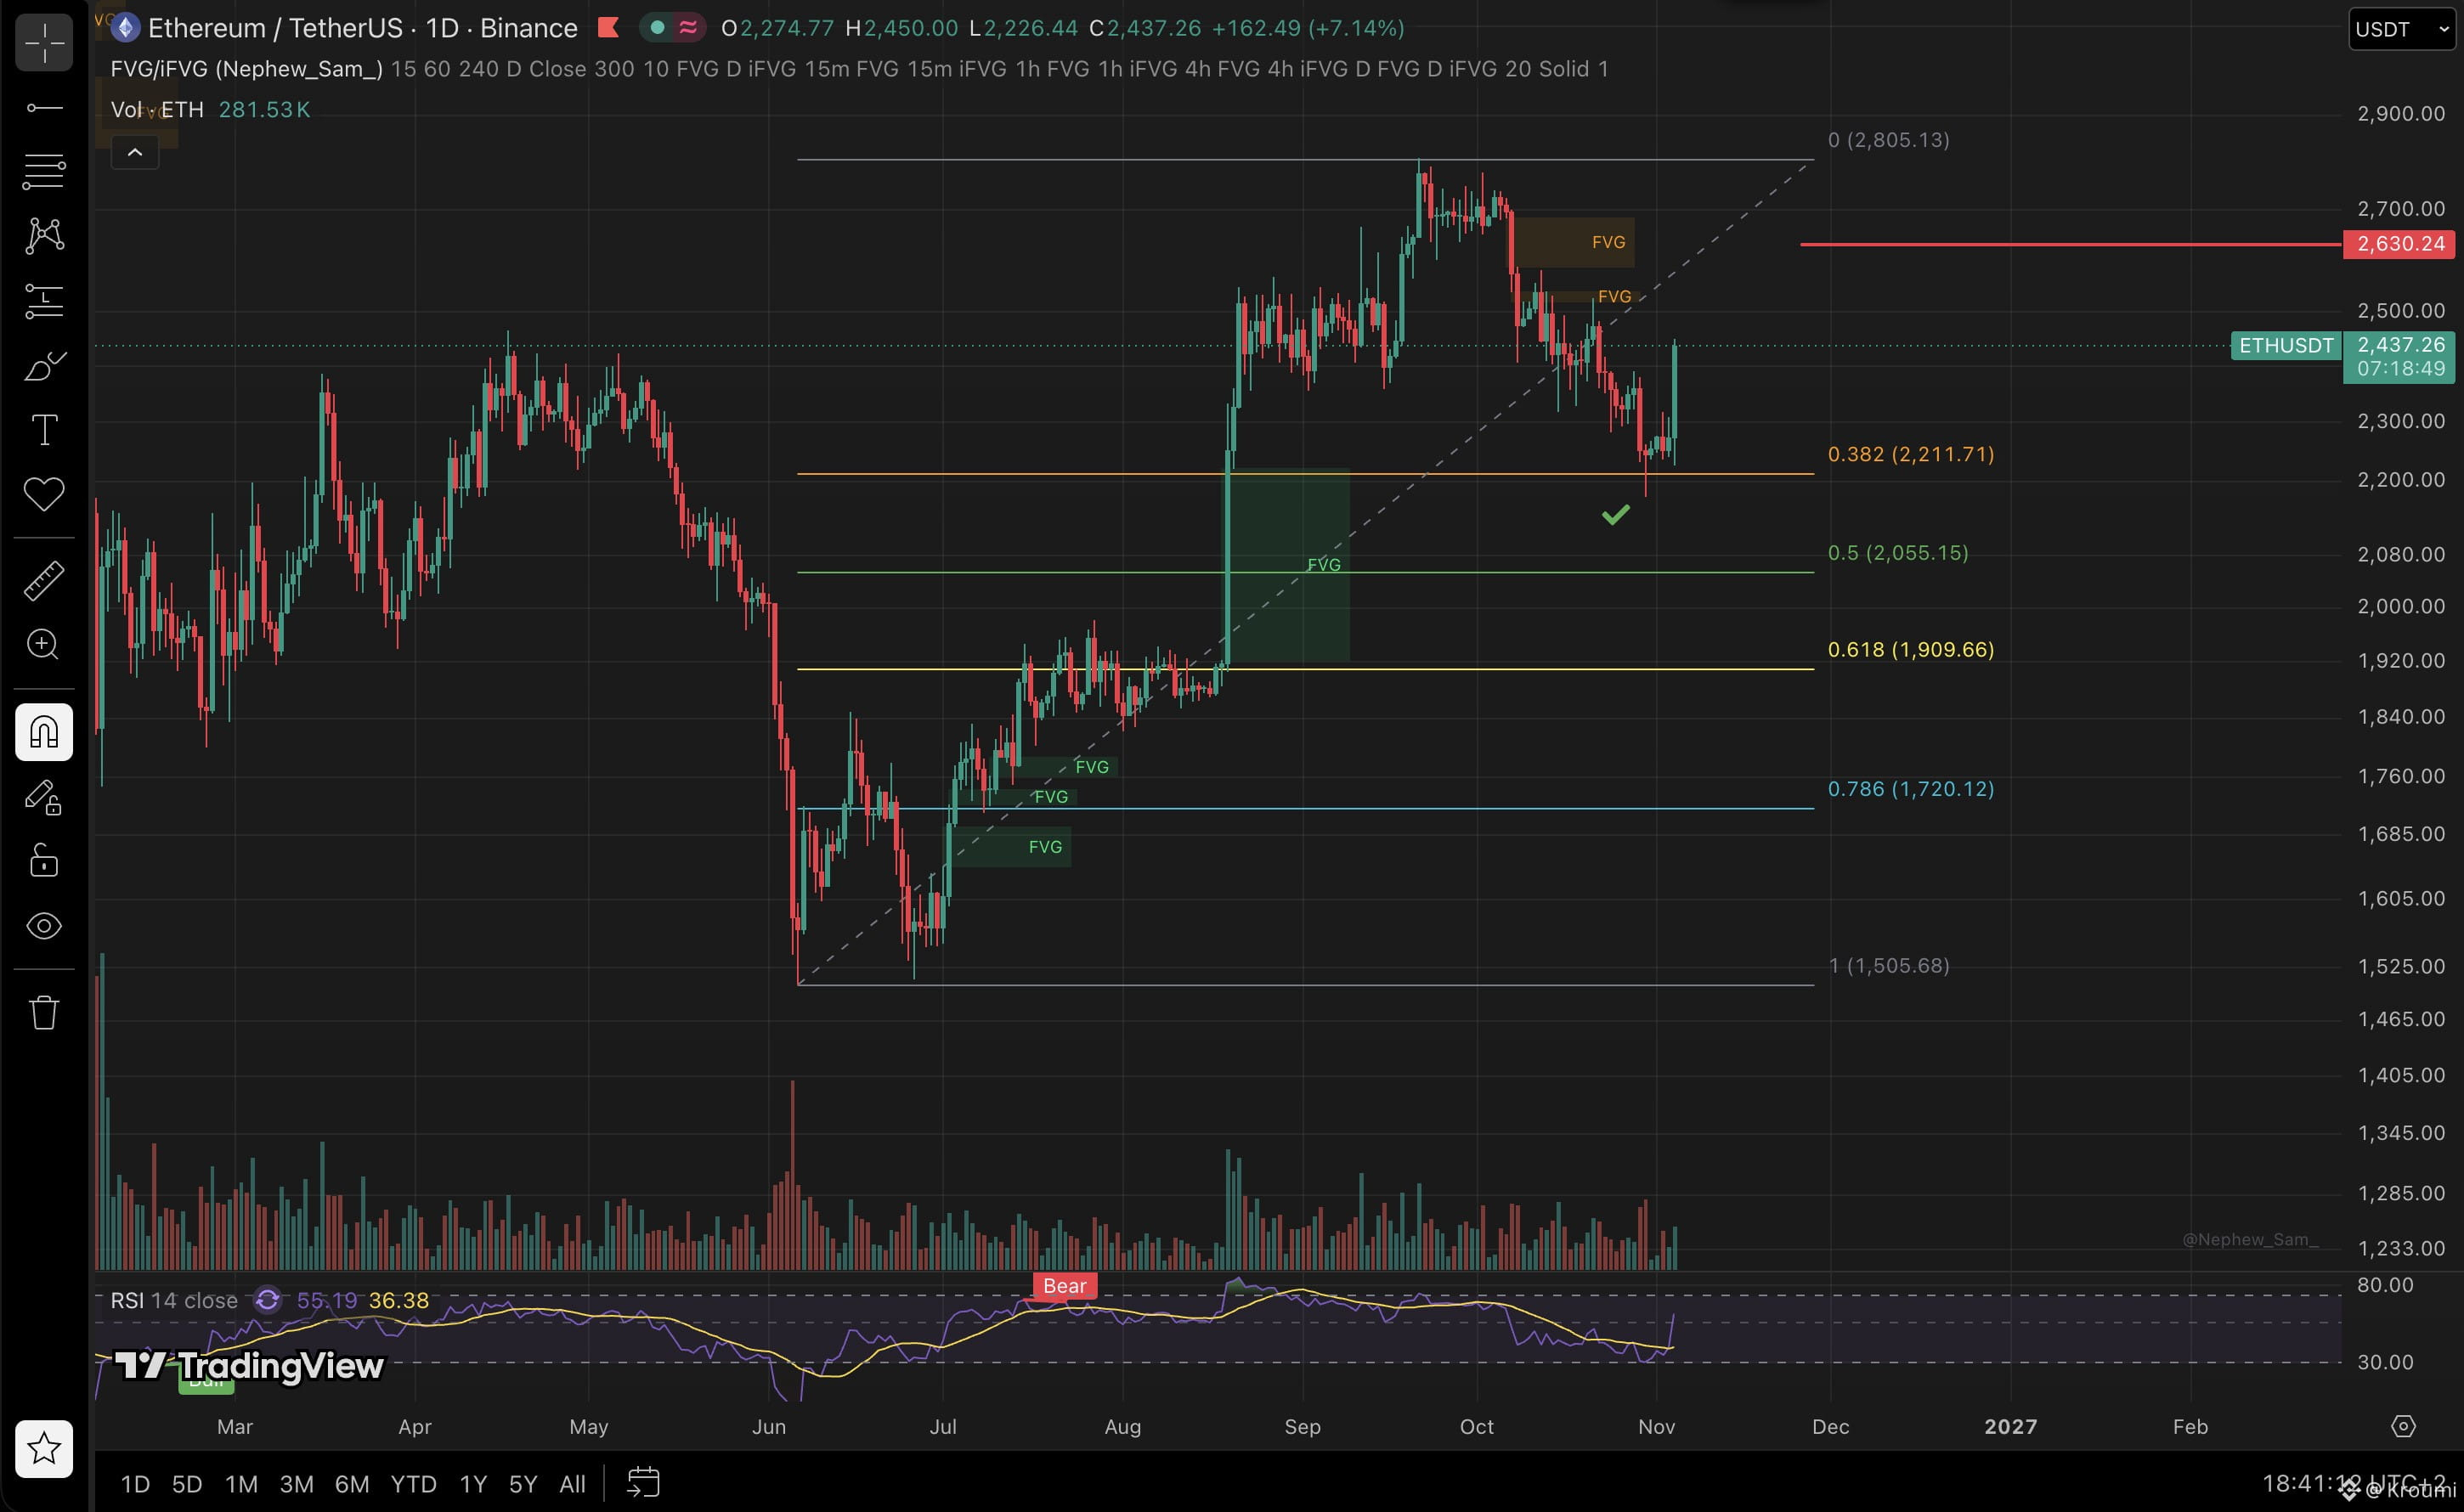
$ETH showed a strong reaction from a key level!
I tend to think it'll be $3,000 soon, but 2600 is a first target.
Here is the next most likely outcome:
On the daily timeframe, the price filled a large gap and absorbed liquidity, breaking through the previous low.
There's no reason for it not to rise unless the entire market takes another downturn, but as far as I'm concerned, $ETH will perform better than $BTC .
If the day closes strongly, I expect positive trends for the leading altcoin in the future.
{future}(BTCUSDT)
{future}(ETHUSDT)
$ETH showed a strong reaction from a key level!
I tend to think it'll be $3,000 soon, but 2600 is a first target.
Here is the next most likely outcome:
On the daily timeframe, the price filled a large gap and absorbed liquidity, breaking through the previous low.
There's no reason for it not to rise unless the entire market takes another downturn, but as far as I'm concerned, $ETH will perform better than $BTC .
If the day closes strongly, I expect positive trends for the leading altcoin in the future.
I tend to think it'll be $3,000 soon, but 2600 is a first target.
Here is the next most likely outcome:
On the daily timeframe, the price filled a large gap and absorbed liquidity, breaking through the previous low.
There's no reason for it not to rise unless the entire market takes another downturn, but as far as I'm concerned, $ETH will perform better than $BTC .
If the day closes strongly, I expect positive trends for the leading altcoin in the future.
1
136
·
--
උසබ තත්ත්වය
$QQQ LONG from now:
Entry: 697
Take: 701
Stop: 695.5
The risk-reward ratio is about 1:3, so I'm trying a long position with a good ratio. I'm hoping for a slight recovery before the start of the new week.
$QQQ LONG from now:
Entry: 697
Take: 701
Stop: 695.5
The risk-reward ratio is about 1:3, so I'm trying a long position with a good ratio. I'm hoping for a slight recovery before the start of the new week.
Entry: 697
Take: 701
Stop: 695.5
The risk-reward ratio is about 1:3, so I'm trying a long position with a good ratio. I'm hoping for a slight recovery before the start of the new week.
458
·
--
බෙයාරිෂ්
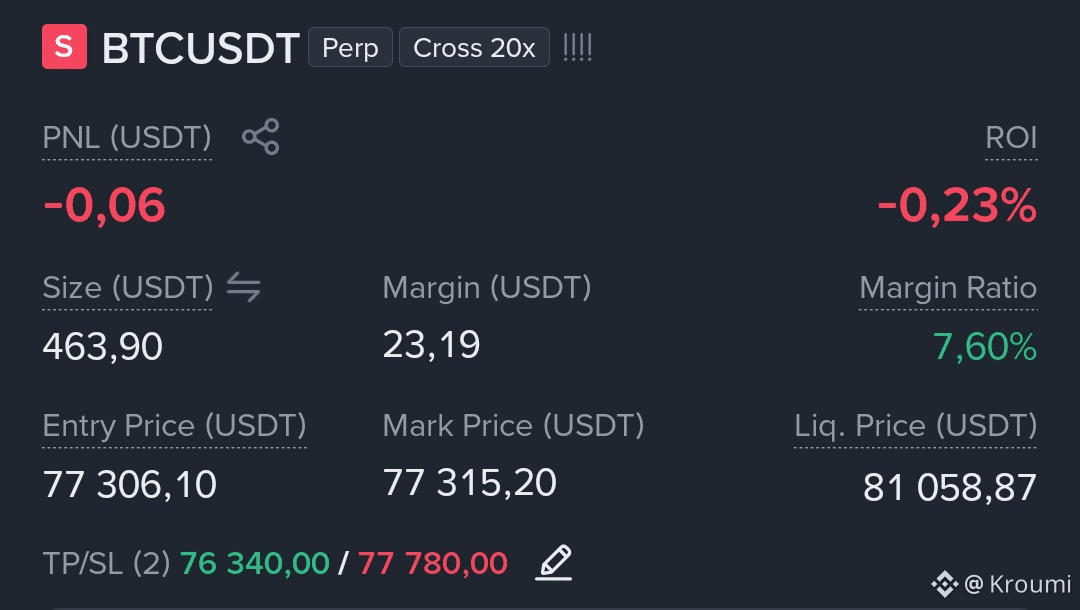
$BTC short
Entry: 77,306
Tp: 76,340
Stop: 77,780
I'm trying the local setup for a short position again.
It looks like the chart is set, and selling pressure may prevail in the near future.
$BTC short
Entry: 77,306
Tp: 76,340
Stop: 77,780
I'm trying the local setup for a short position again.
It looks like the chart is set, and selling pressure may prevail in the near future.
Entry: 77,306
Tp: 76,340
Stop: 77,780
I'm trying the local setup for a short position again.
It looks like the chart is set, and selling pressure may prevail in the near future.
169
·
--
අර්ධ වශයෙන් සත්යයි
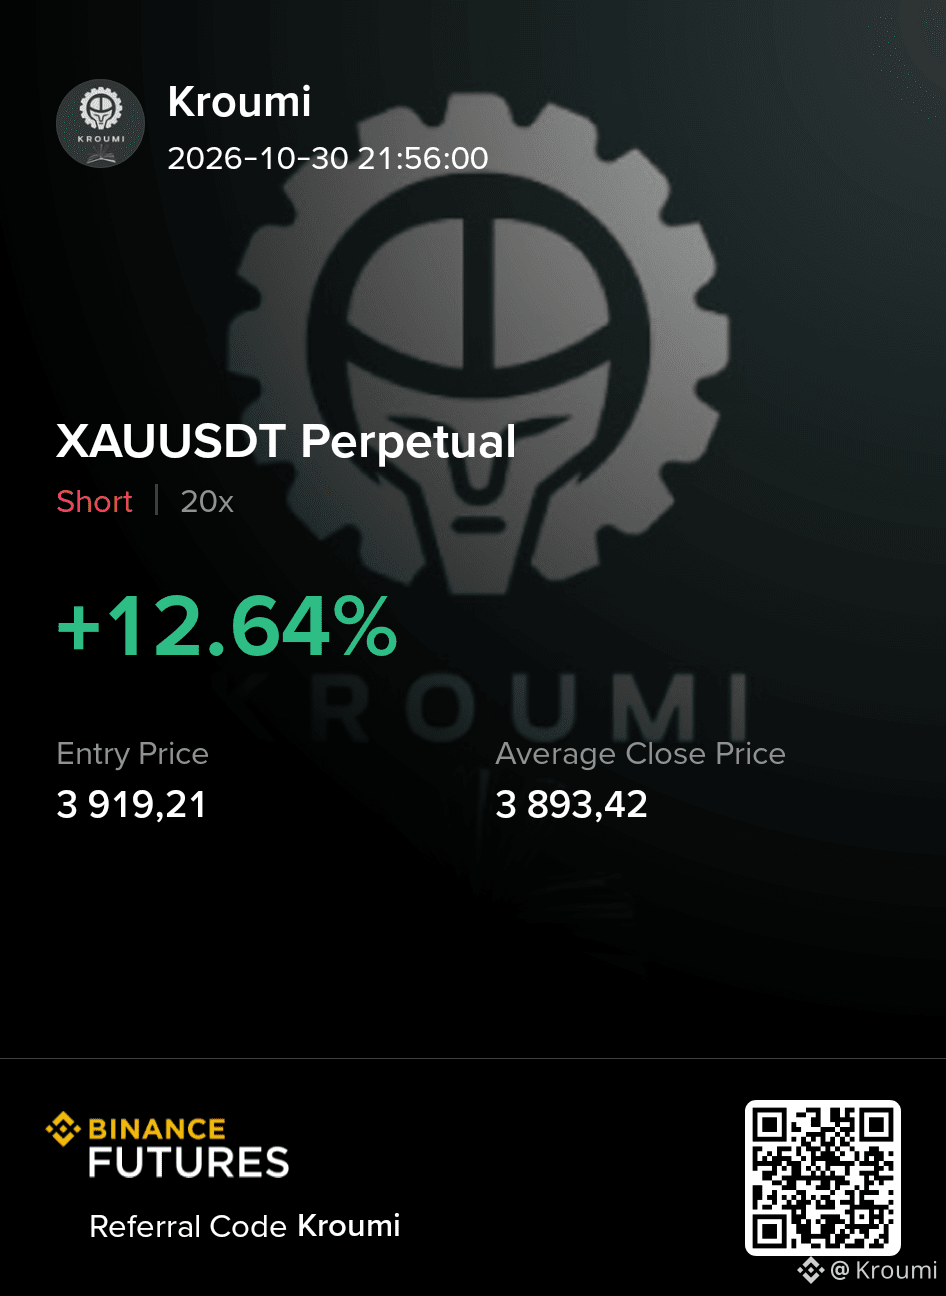
$XAU closed short ✅
Locally, the 5-minute candles turned out to be stronger, so I decided to close my position.
Today, all global markets are experiencing stagnation and capital outflows.
It's interesting to watch this unfold, don't you?
$XAU closed short ✅
Locally, the 5-minute candles turned out to be stronger, so I decided to close my position.
Today, all global markets are experiencing stagnation and capital outflows.
It's interesting to watch this unfold, don't you?
Locally, the 5-minute candles turned out to be stronger, so I decided to close my position.
Today, all global markets are experiencing stagnation and capital outflows.
It's interesting to watch this unfold, don't you?
658
·
--
බෙයාරිෂ්
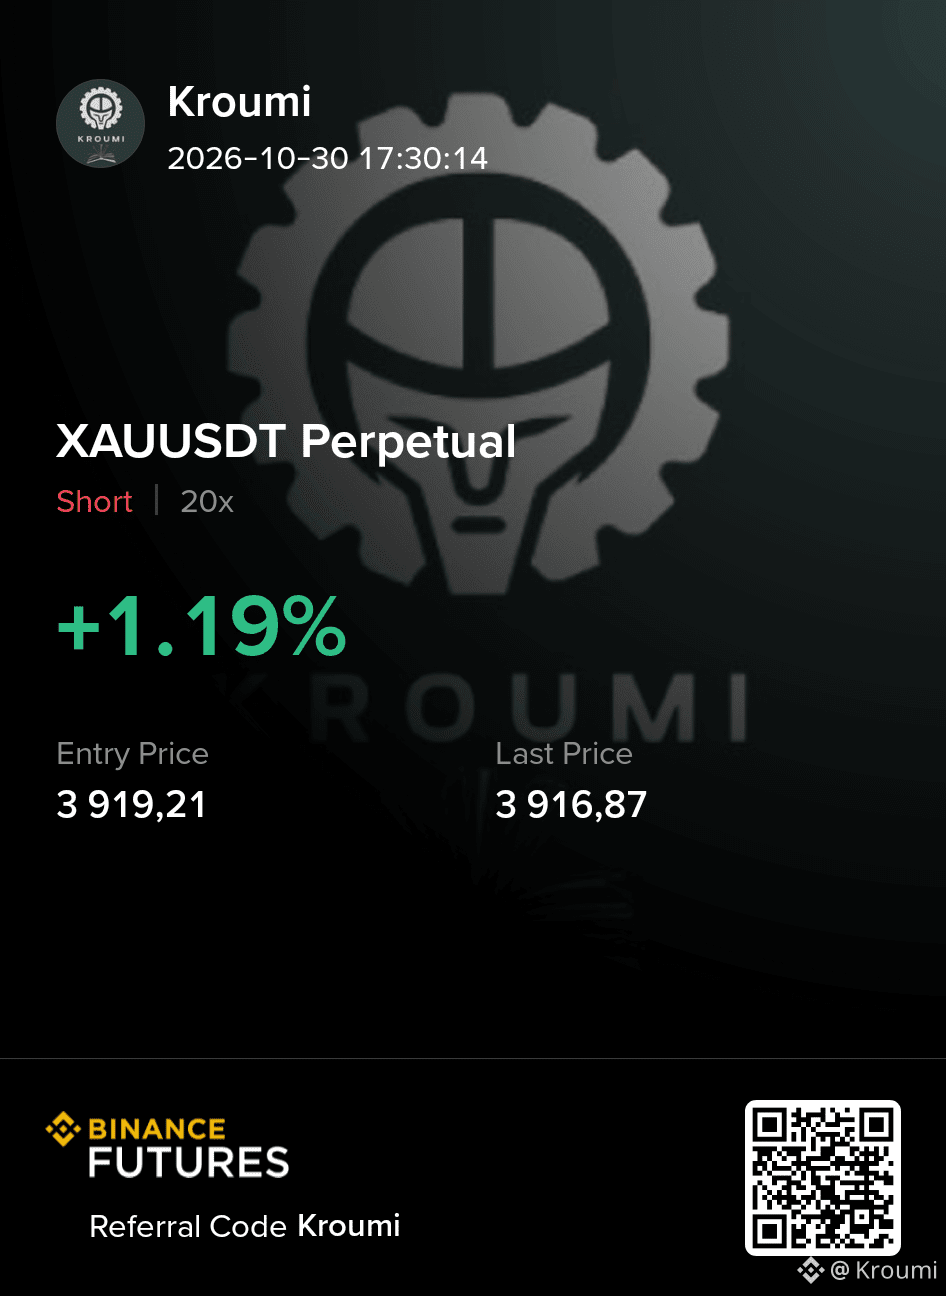
$XAU SHORT setup: (RR1:3)🔴
Entry: 3919 (market)
Tp: 3880
Stop: 3936
At this time, I expect prices to fall and buying pressure to ease
#gold
$XAU SHORT setup: (RR1:3)🔴
Entry: 3919 (market)
Tp: 3880
Stop: 3936
At this time, I expect prices to fall and buying pressure to ease
#gold
Entry: 3919 (market)
Tp: 3880
Stop: 3936
At this time, I expect prices to fall and buying pressure to ease
#gold
602
·
--
💥 CRYPTO CATASTROPHE: Record-Breaking $6 BILLION Drained from Binance?!
Alarming reports are rapidly spreading online about an unprecedented security breach at the world's largest crypto exchange. Here is what we know right now:
🔸 Potential losses: A staggering $6 billion.
🔸 Current status: Awaiting official confirmation that the funds were indeed stolen by hackers.
🔸 Scale of the attack: The amount is nearly double the previous all-time high and roughly equals the four largest crypto heists in history combined.
😱 Biggest crypto hacks in history that now look like a warm-up (value at the time of attack):
• LuBian (2020) — around $3.5B stolen
• Bybit (2025) — hackers took $1.5B
• Ronin (2022) — exploited for $624M
• Poly Network (2021) — $611M drained
If a breach of this magnitude is confirmed, the industry is facing the biggest shockwave in its entire existence. Staying tuned and waiting for official statements from Binance!
$BTC $ETH $XMR
{future}(XMRUSDT)
{future}(ETHUSDT)
{future}(BTCUSDT)
#Binancehack
💥 CRYPTO CATASTROPHE: Record-Breaking $6 BILLION Drained from Binance?!
Alarming reports are rapidly spreading online about an unprecedented security breach at the world's largest crypto exchange. Here is what we know right now:
🔸 Potential losses: A staggering $6 billion.
🔸 Current status: Awaiting official confirmation that the funds were indeed stolen by hackers.
🔸 Scale of the attack: The amount is nearly double the previous all-time high and roughly equals the four largest crypto heists in history combined.
😱 Biggest crypto hacks in history that now look like a warm-up (value at the time of attack):
• LuBian (2020) — around $3.5B stolen
• Bybit (2025) — hackers took $1.5B
• Ronin (2022) — exploited for $624M
• Poly Network (2021) — $611M drained
If a breach of this magnitude is confirmed, the industry is facing the biggest shockwave in its entire existence. Staying tuned and waiting for official statements from Binance!
$BTC $ETH $XMR
#Binancehack
Alarming reports are rapidly spreading online about an unprecedented security breach at the world's largest crypto exchange. Here is what we know right now:
🔸 Potential losses: A staggering $6 billion.
🔸 Current status: Awaiting official confirmation that the funds were indeed stolen by hackers.
🔸 Scale of the attack: The amount is nearly double the previous all-time high and roughly equals the four largest crypto heists in history combined.
😱 Biggest crypto hacks in history that now look like a warm-up (value at the time of attack):
• LuBian (2020) — around $3.5B stolen
• Bybit (2025) — hackers took $1.5B
• Ronin (2022) — exploited for $624M
• Poly Network (2021) — $611M drained
If a breach of this magnitude is confirmed, the industry is facing the biggest shockwave in its entire existence. Staying tuned and waiting for official statements from Binance!
$BTC $ETH $XMR
#Binancehack
423
·
--
උසබ තත්ත්වය
$HYPE LONG🟢
Limit order: 93.4
Stop: 91.4
TP: 99.1
I'm just going to try to take advantage of the trading activity and the increased attention on the coin.
The volatility is good, let's see.
$HYPE LONG🟢
Limit order: 93.4
Stop: 91.4
TP: 99.1
I'm just going to try to take advantage of the trading activity and the increased attention on the coin.
The volatility is good, let's see.
Limit order: 93.4
Stop: 91.4
TP: 99.1
I'm just going to try to take advantage of the trading activity and the increased attention on the coin.
The volatility is good, let's see.
2
2.4k
·
--
උසබ තත්ත්වය
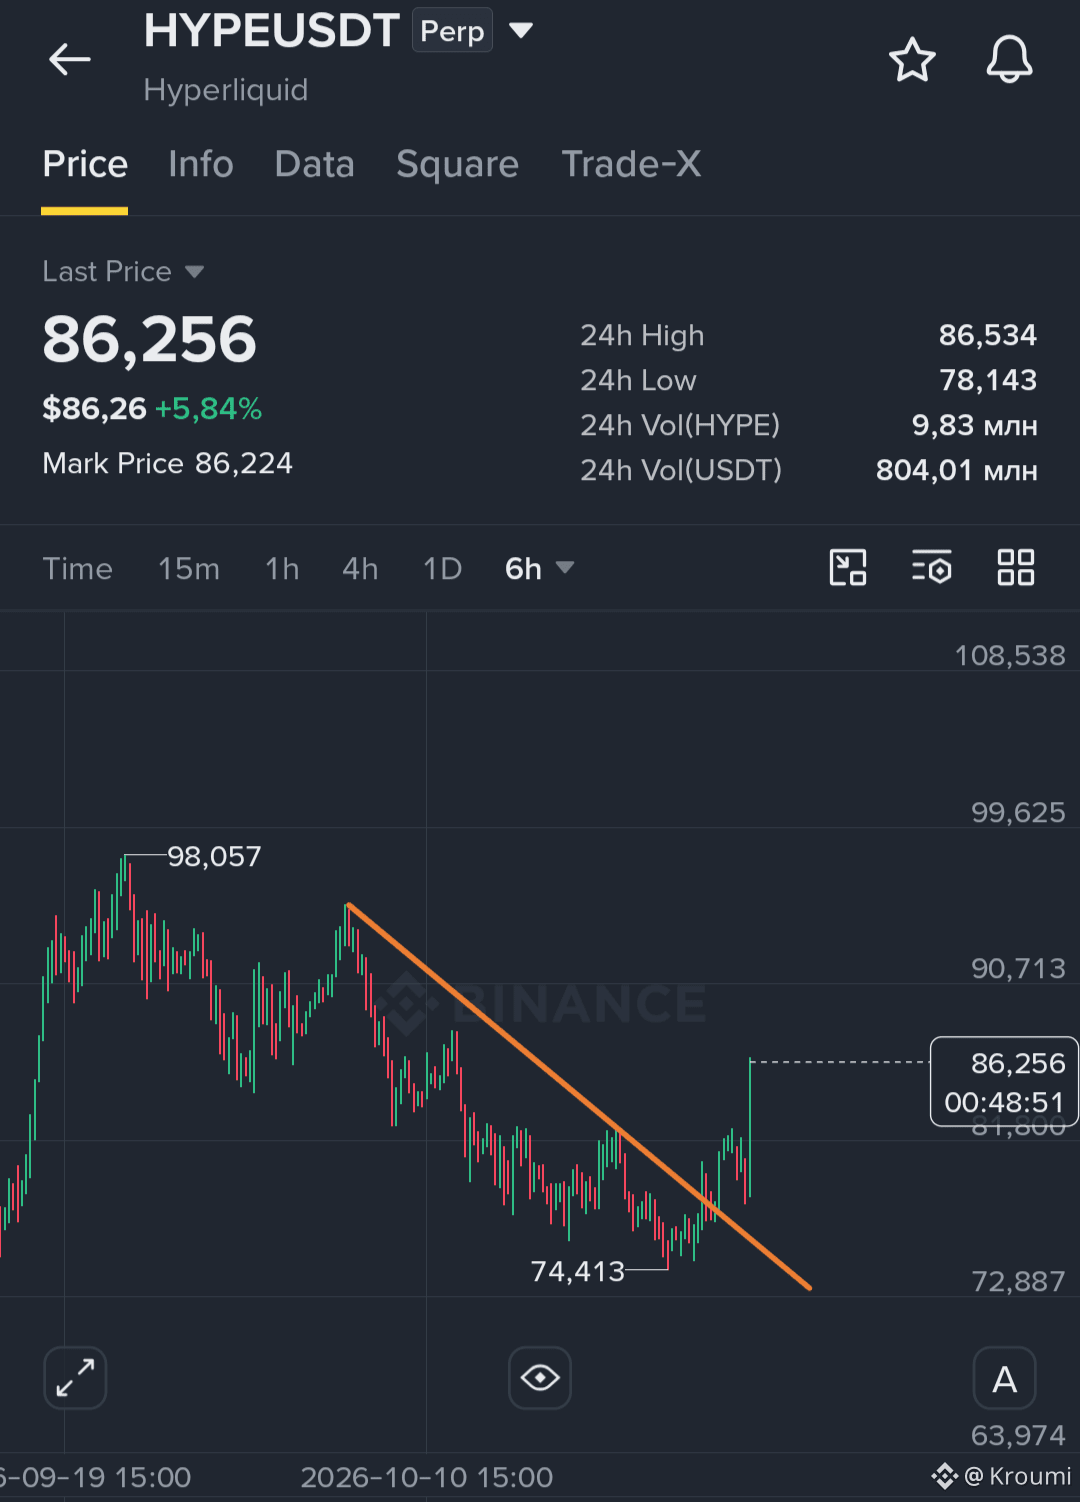
$HYPE breakout confirmed — ATH will be soon!
I think we'll see HYPE reach $100 in the near future.
This round psychological level will be broken, and given the recent news and rumors about the NYSE, it will happen sooner than we think.
Let's wait and see how this weekly candle closes.
{future}(HYPEUSDT)
$HYPE breakout confirmed — ATH will be soon!
I think we'll see HYPE reach $100 in the near future.
This round psychological level will be broken, and given the recent news and rumors about the NYSE, it will happen sooner than we think.
Let's wait and see how this weekly candle closes.
I think we'll see HYPE reach $100 in the near future.
This round psychological level will be broken, and given the recent news and rumors about the NYSE, it will happen sooner than we think.
Let's wait and see how this weekly candle closes.
2
1.7k
·
--
උසබ තත්ත්වය
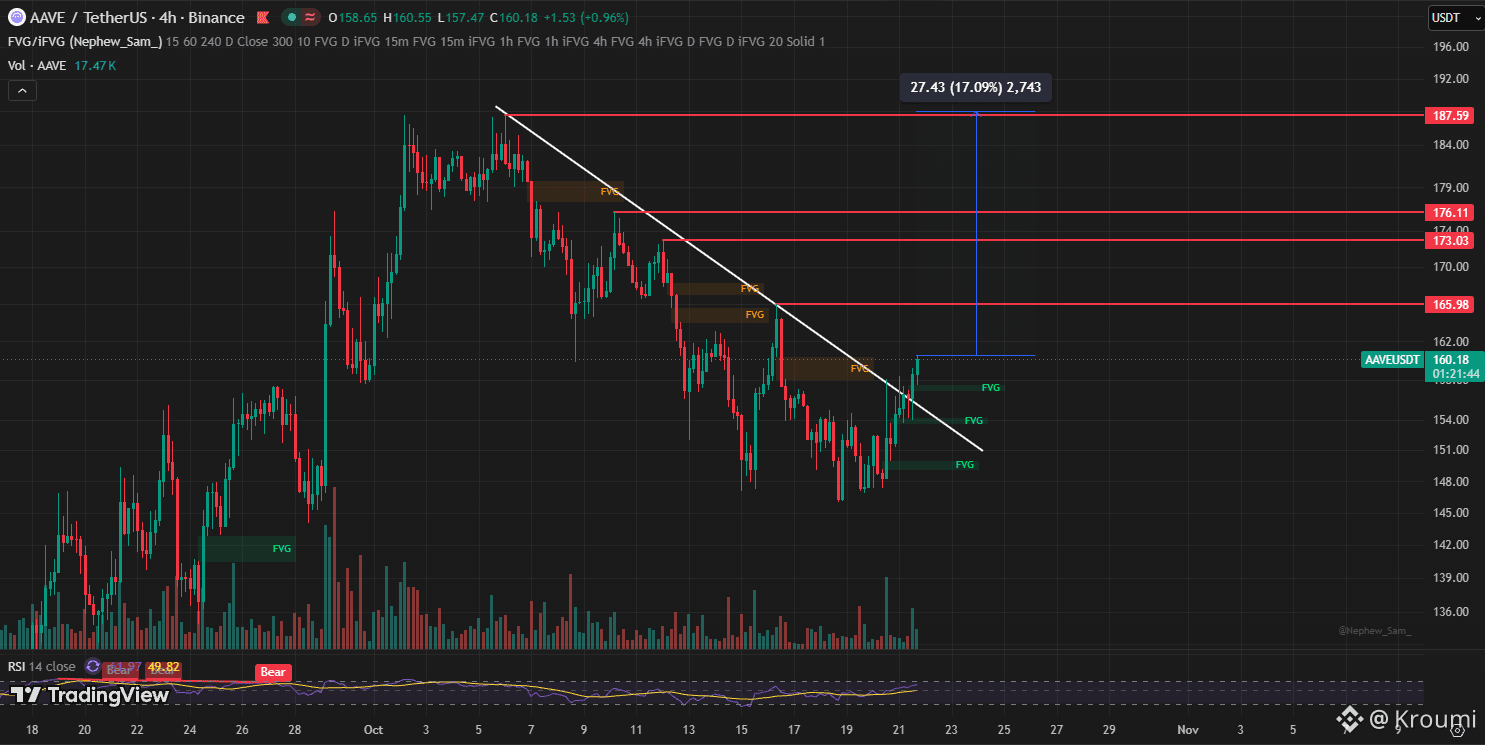
$AAVE is forming a massive LONG setup! 🟢
Smart money is accumulating around $150-155, and if this level holds, we are heading straight for a rapid liquidity sweep to $187 (17% move).
Targets:
🎯 $165
🎯 $173
🎯 $176
🎯 $187
Just my two cents, NFA
👇 What is your target for AAVE today? Are you holding or fading this move? Drop your thoughts below!
{future}(AAVEUSDT)
$AAVE is forming a massive LONG setup! 🟢
Smart money is accumulating around $150-155, and if this level holds, we are heading straight for a rapid liquidity sweep to $187 (17% move).
Targets:
🎯 $165
🎯 $173
🎯 $176
🎯 $187
Just my two cents, NFA
👇 What is your target for AAVE today? Are you holding or fading this move? Drop your thoughts below!
Smart money is accumulating around $150-155, and if this level holds, we are heading straight for a rapid liquidity sweep to $187 (17% move).
Targets:
🎯 $165
🎯 $173
🎯 $176
🎯 $187
Just my two cents, NFA
👇 What is your target for AAVE today? Are you holding or fading this move? Drop your thoughts below!
524
·
--
බෙයාරිෂ්
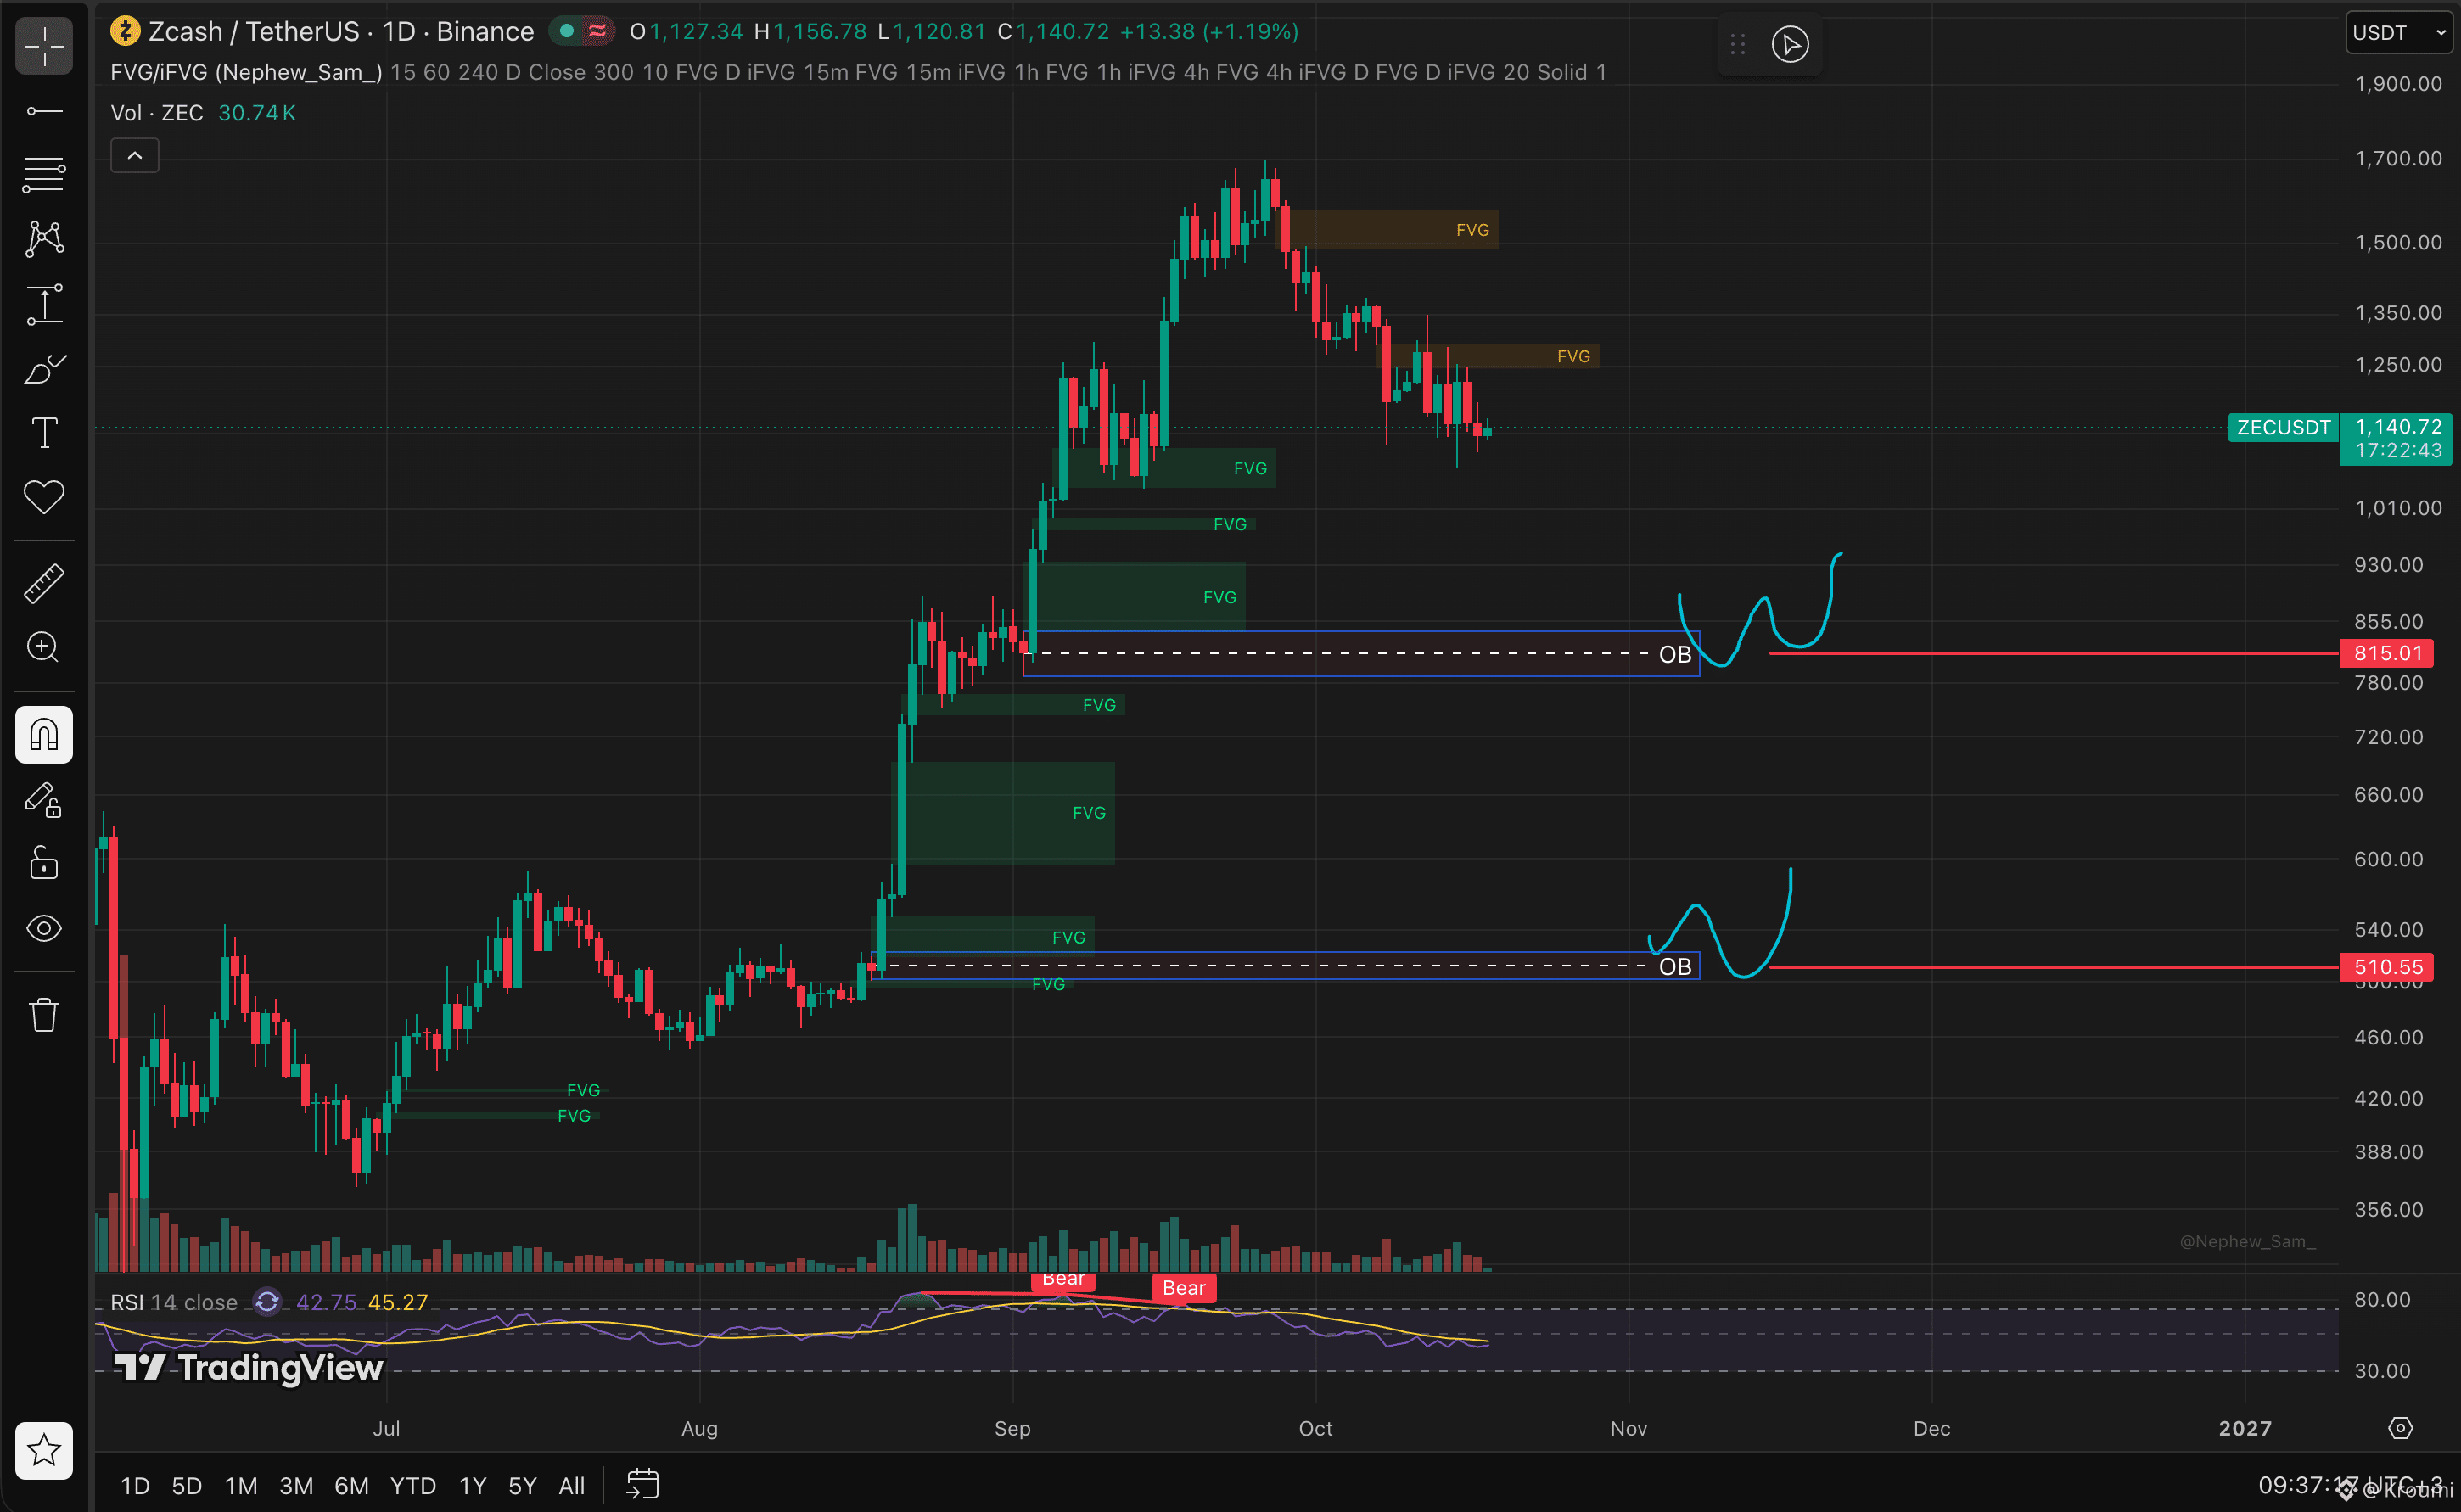
$ZEC is ready for a big drop
I've highlighted two major interest areas
The price often returns to the order block zone, so these can serve as good support and resistance levels
It would also be logical to expect these imbalances to be resolved below
Key targets: 815 and 510
#zcash
{future}(ZECUSDT)
$ZEC is ready for a big drop
I've highlighted two major interest areas
The price often returns to the order block zone, so these can serve as good support and resistance levels
It would also be logical to expect these imbalances to be resolved below
Key targets: 815 and 510
#zcash
I've highlighted two major interest areas
The price often returns to the order block zone, so these can serve as good support and resistance levels
It would also be logical to expect these imbalances to be resolved below
Key targets: 815 and 510
#zcash
1
336
·
--
බෙයාරිෂ්
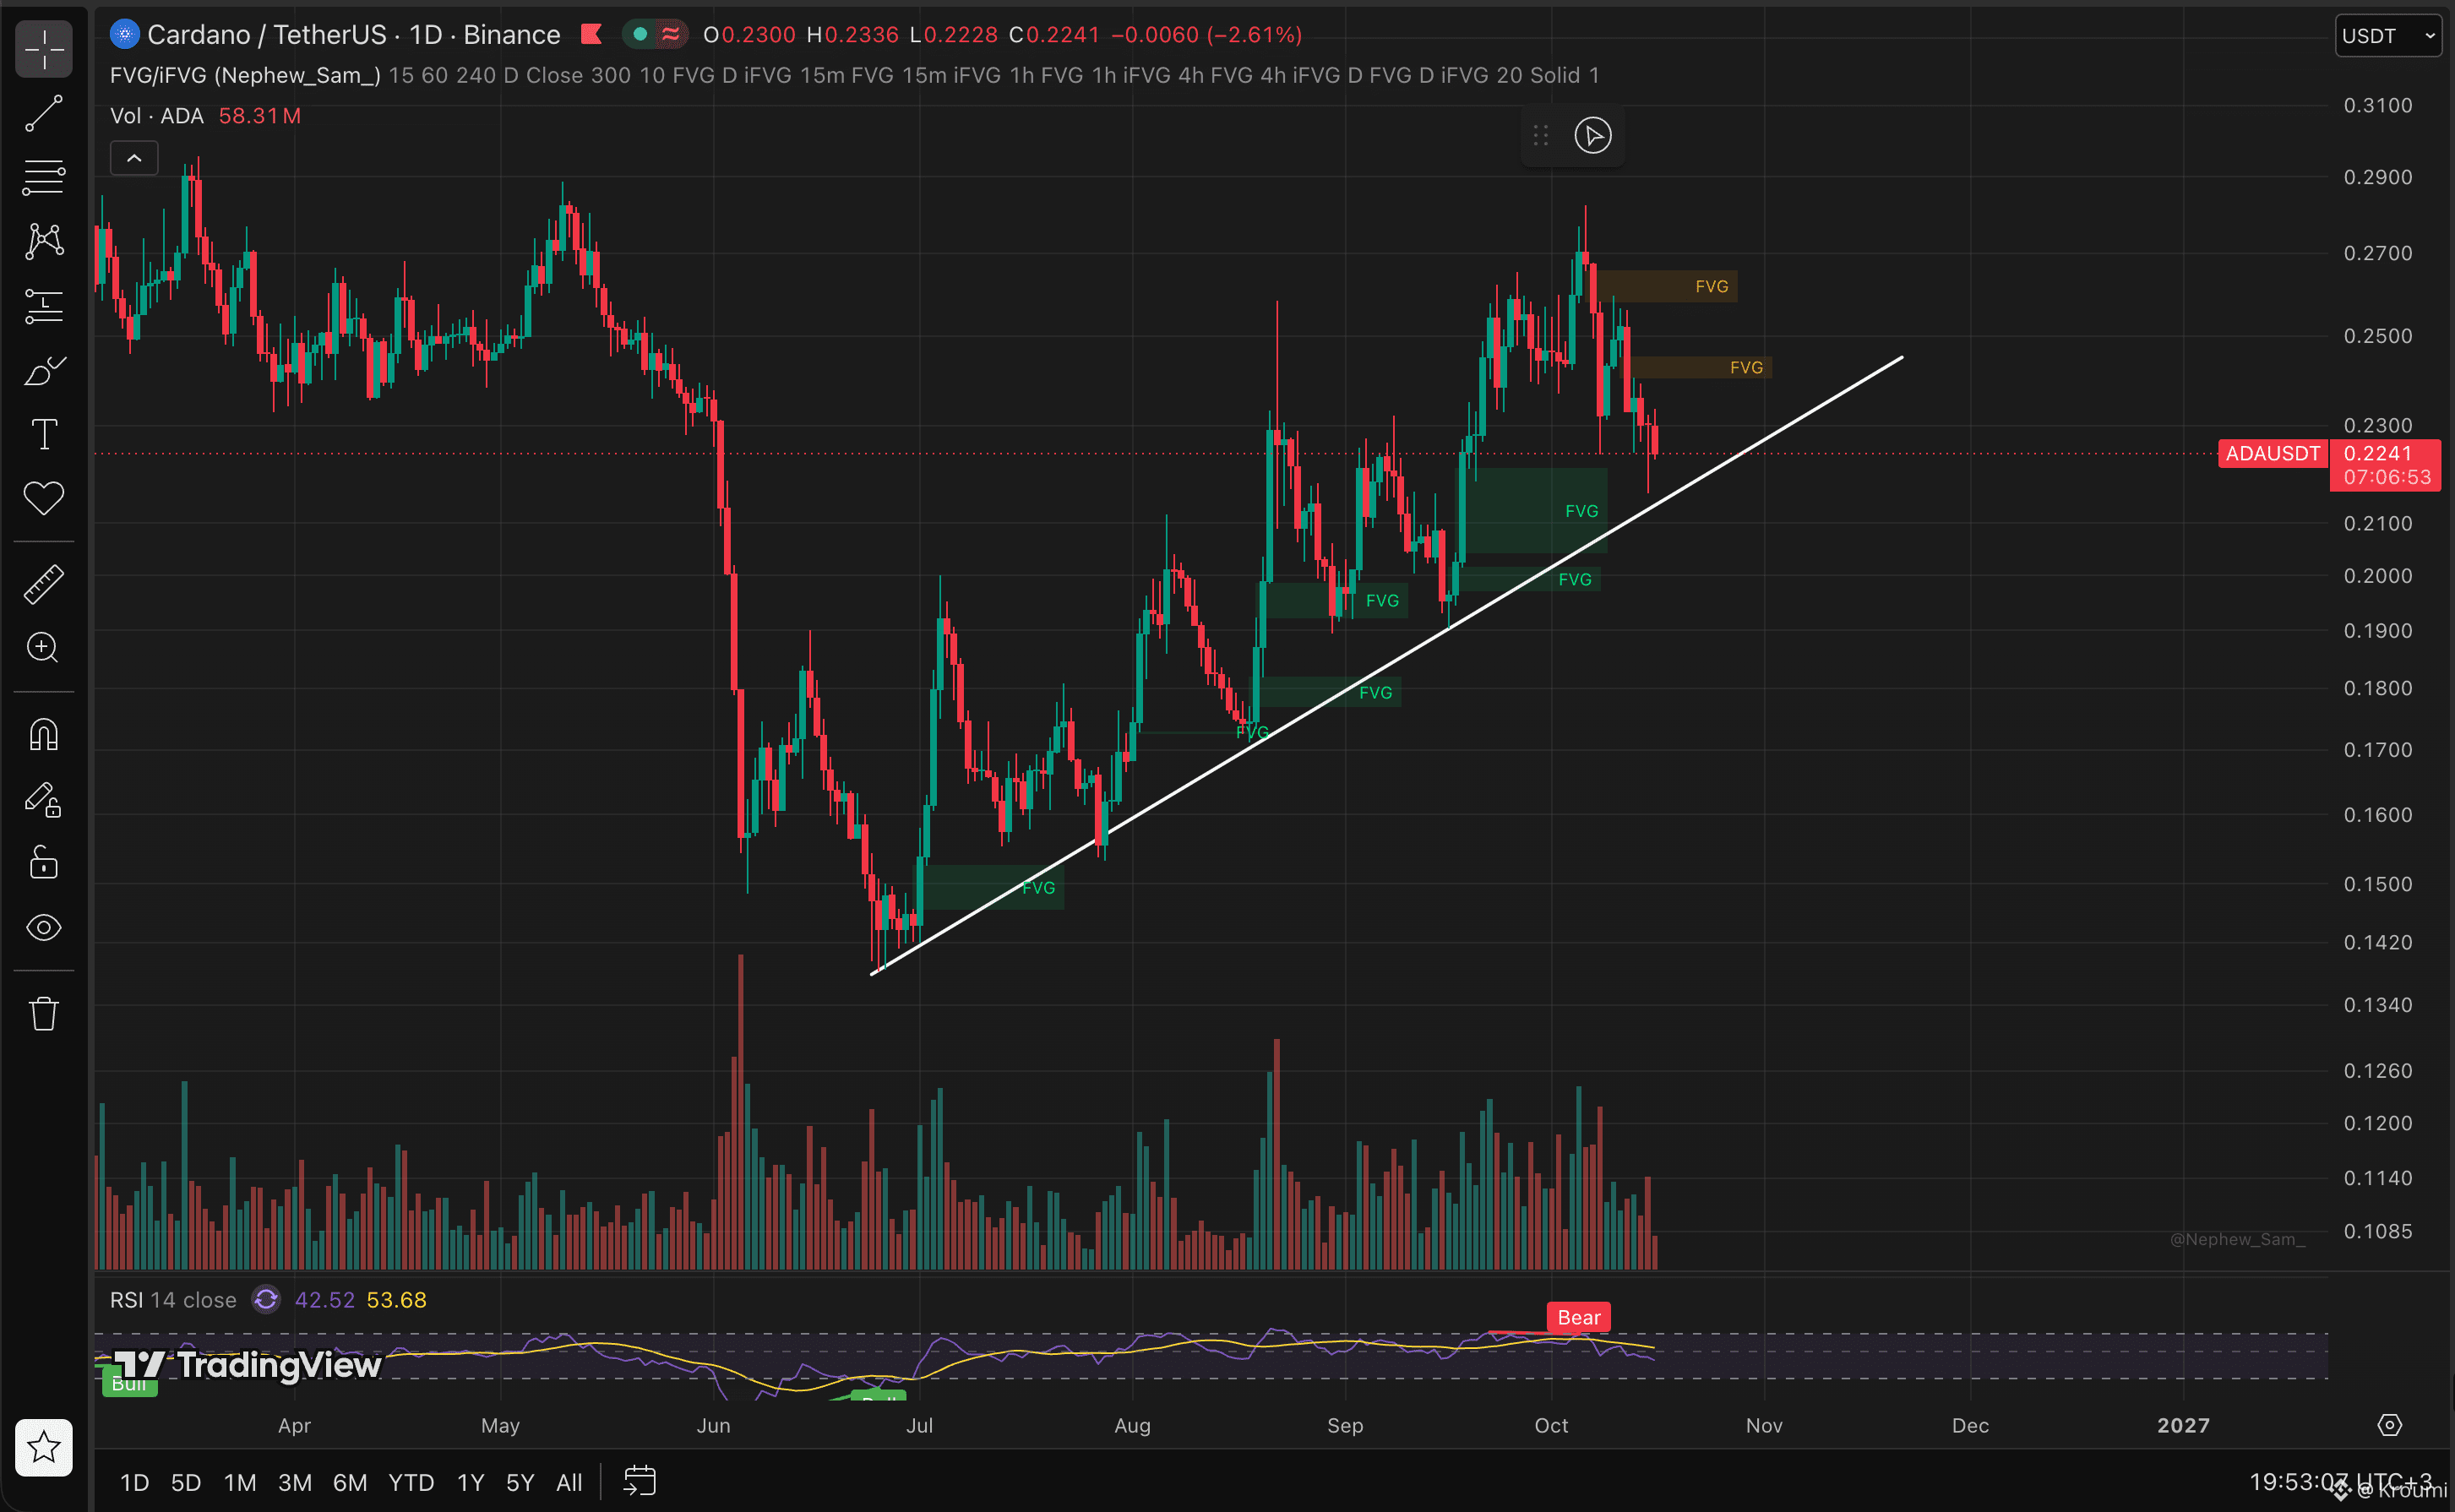
$ADA is moving precisely along the trend line.
Do you think it will bounce back again next time, or will the trend be broken?
I think that if the entire market crashes, this trend will end as well, and there may not be enough buying pressure to sustain it.
The price is approaching the trend line for the 5th time — the longer it tests the level, the greater the chance that a momentum move will break it.
Moreover, I see a bearish divergence on the chart, so things could turn out very differently this time.
{future}(ADAUSDT)
$ADA is moving precisely along the trend line.
Do you think it will bounce back again next time, or will the trend be broken?
I think that if the entire market crashes, this trend will end as well, and there may not be enough buying pressure to sustain it.
The price is approaching the trend line for the 5th time — the longer it tests the level, the greater the chance that a momentum move will break it.
Moreover, I see a bearish divergence on the chart, so things could turn out very differently this time.
Do you think it will bounce back again next time, or will the trend be broken?
I think that if the entire market crashes, this trend will end as well, and there may not be enough buying pressure to sustain it.
The price is approaching the trend line for the 5th time — the longer it tests the level, the greater the chance that a momentum move will break it.
Moreover, I see a bearish divergence on the chart, so things could turn out very differently this time.
587
·
--
උසබ තත්ත්වය
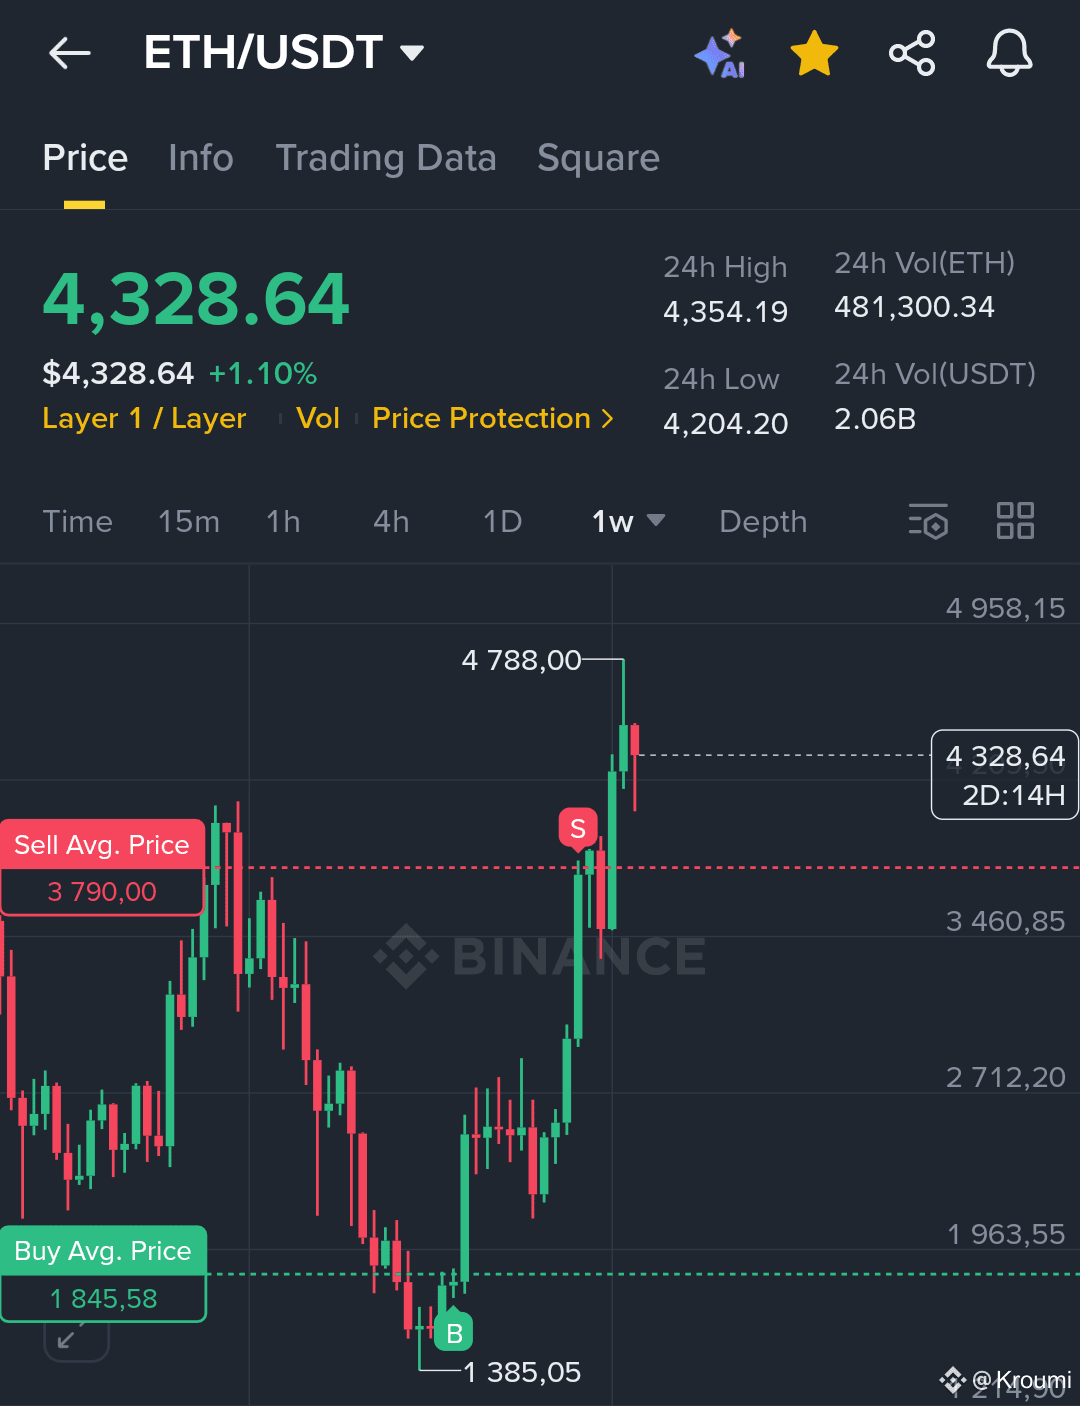
$ETH on the weekly chart looks strong.
But did I do the right thing by selling it early?
It needs a correction so I think yes.
But still, I still have some left over for the longer term because I'm sure I'll need it later.
Are you keeping it or have you gotten rid of it already?
#Ethereum
{spot}(ETHUSDT)
$ETH on the weekly chart looks strong.
But did I do the right thing by selling it early?
It needs a correction so I think yes.
But still, I still have some left over for the longer term because I'm sure I'll need it later.
Are you keeping it or have you gotten rid of it already?
#Ethereum
But did I do the right thing by selling it early?
It needs a correction so I think yes.
But still, I still have some left over for the longer term because I'm sure I'll need it later.
Are you keeping it or have you gotten rid of it already?
#Ethereum
3
2.4k
·
--
බෙයාරිෂ්
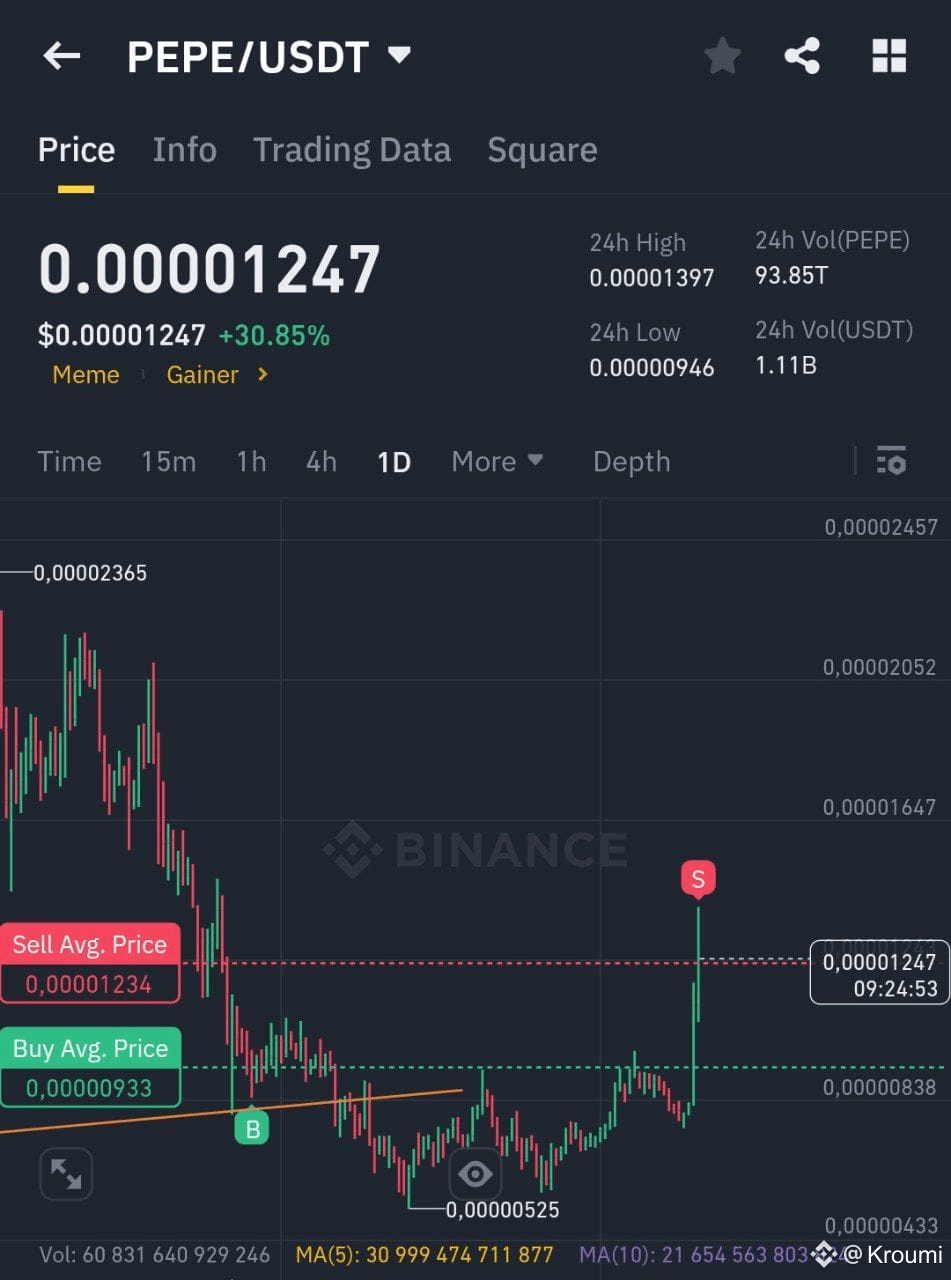
Just sold all my $PEPE
I'm not interested in this memecoin anymore.
I believe now the second wave has started, which is a corrective wave and further decline will be the final third wave.
Because of this, I decided to get rid of it by taking 30% of the profits.
What do you think , guys?
Just sold all my $PEPE
I'm not interested in this memecoin anymore.
I believe now the second wave has started, which is a corrective wave and further decline will be the final third wave.
Because of this, I decided to get rid of it by taking 30% of the profits.
What do you think , guys?
I'm not interested in this memecoin anymore.
I believe now the second wave has started, which is a corrective wave and further decline will be the final third wave.
Because of this, I decided to get rid of it by taking 30% of the profits.
What do you think , guys?
213
96
195
522.5k
·
--
බෙයාරිෂ්
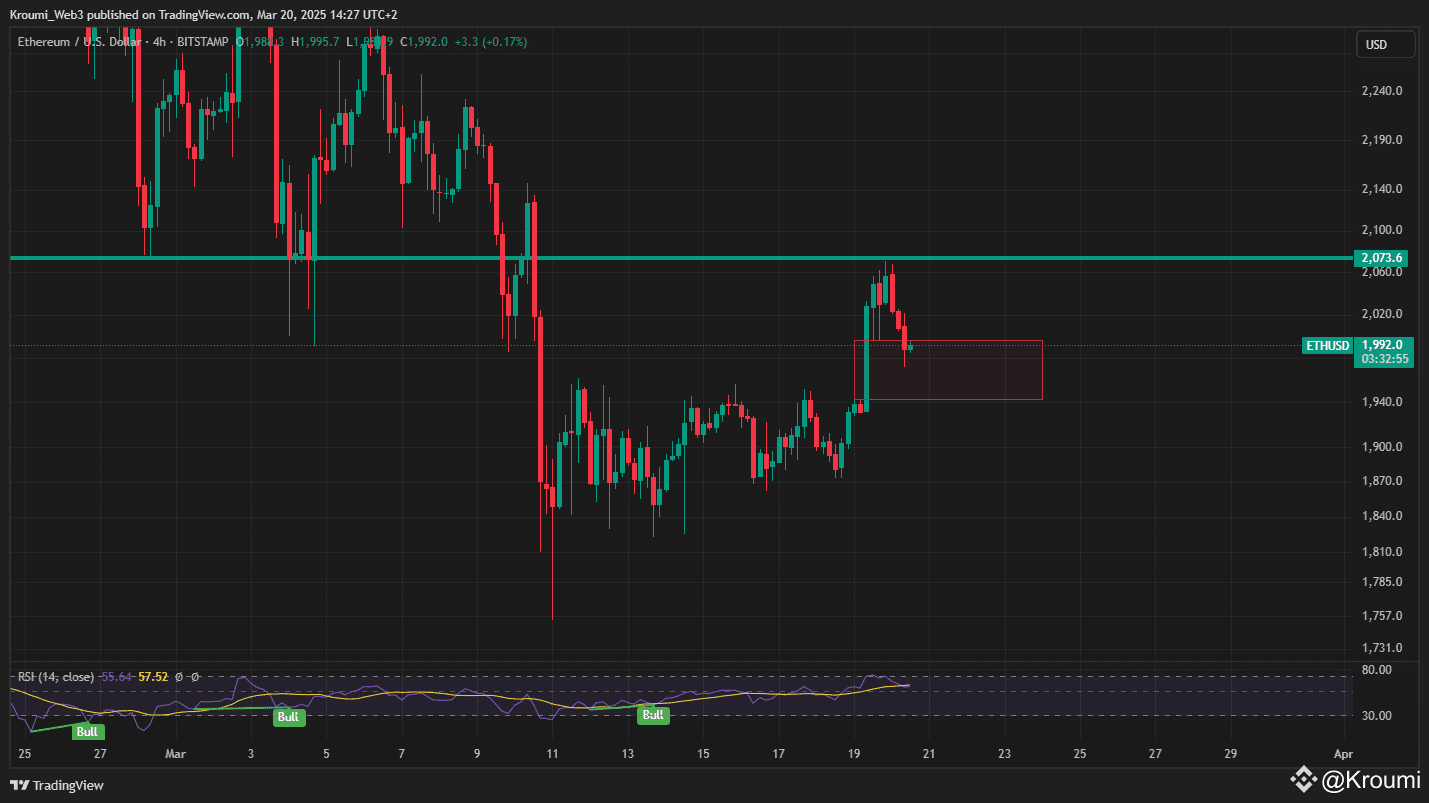
$ETH in the local picture:
Price has bounced back from the resistance zone and successfully tested the imbalance.
We have to look at further reactions depending on what Trump says today at the conference in 3 hours.
But as usual, I can assume that there will be increased volatility, as a result of which I would like to see the asset rise.
So for now there is uncertainty in the market, which a neutral fear and greed indicator can evidence.
{spot}(ETHUSDT)
$ETH in the local picture:
Price has bounced back from the resistance zone and successfully tested the imbalance.
We have to look at further reactions depending on what Trump says today at the conference in 3 hours.
But as usual, I can assume that there will be increased volatility, as a result of which I would like to see the asset rise.
So for now there is uncertainty in the market, which a neutral fear and greed indicator can evidence.
Price has bounced back from the resistance zone and successfully tested the imbalance.
We have to look at further reactions depending on what Trump says today at the conference in 3 hours.
But as usual, I can assume that there will be increased volatility, as a result of which I would like to see the asset rise.
So for now there is uncertainty in the market, which a neutral fear and greed indicator can evidence.
1.1k
තවත් අන්තර්ගතයන් ගවේෂණය කිරීමට ඇතුල් වන්න
Binance චතුරශ්රය හි ගෝලීය ක්රිප්ටෝ පරිශීලකයින් හා එක්වන්න
⚡️ ක්රිප්ටෝ පිළිබඳ නවතම සහ ප්රයෝජනවත් තොරතුරු ලබා ගන්න.
💬 ලොව විශාලතම ක්රිප්ටෝ හුවමාරුව මගින් විශ්වාස කෙරේ.
👍 සත්යායනය කරන ලද නිර්මාණකරුවන්ගෙන් සැබෑ විදසුන් සොයා ගන්න.
විද්යුත් තැපෑල / දුරකථන අංකය
නැගී එන මාතෘකා
HotCPIDecemberHikePriced
73,998 නැරඹීම්
912 සාකච්ඡා කරමින්
CPI Market Watch | US CPI Rises 0.4% in October, Hotter Than 0.3% Forecast
Binance News
·26 කැමත්ත දැක්වීම්
·41k නැරඹීම්
AnthropicRejectsIPODelayValuationinQuestion
203,579 නැරඹීම්
1,718 සාකච්ඡා කරමින්
NvidiaInvestigatesAfterHuang’sAffairApology
488,742 නැරඹීම්
3,134 සාකච්ඡා කරමින්