SnEmroz

Crypto Trader | Scalper | Challenge Master Sharing smart setups & Trade Psychology | Quality - Quantity I DYOR I (X- Marks_BTC )
32 හඹා යමින්
8.7K+ හඹා යන්නන්
9.5K+ කැමති විය
පෝස්ටු
·
--
උසබ තත්ත්වය
Many people say you cannot make profit in trading. That is 99% true for those who do not understand the rules. Let me tell you something. You do not need to trade every day. Why? Because not every analysis is accurate and not every setup matches the market trend. First, you need to identify the trend. Then analyze if the market looks good and ready to move. Only then you should take a trade. If your analysis is correct but does not align with the trend, that trade will likely end in loss. The key is patience. Wait for the right trend, then trade with it. That is how you can make consistent profit. If you didn’t open any trade and your that day are breakevens. That's also good for you. Because Loosing is not better than Without Profit. Keep it on your Mind. #btccrash $BTC $ETH $SOL
Many people say you cannot make profit in trading. That is 99% true for those who do not understand the rules. Let me tell you something.

You do not need to trade every day. Why?

Because not every analysis is accurate and not every setup matches the market trend.

First, you need to identify the trend. Then analyze if the market looks good and ready to move. Only then you should take a trade. If your analysis is correct but does not align with the trend, that trade will likely end in loss.

The key is patience. Wait for the right trend, then trade with it. That is how you can make consistent profit.

If you didn’t open any trade and your that day are breakevens. That's also good for you. Because Loosing is not better than Without Profit. Keep it on your Mind.
#btccrash $BTC $ETH $SOL
·
--
බෙයාරිෂ්
·
--
බෙයාරිෂ්
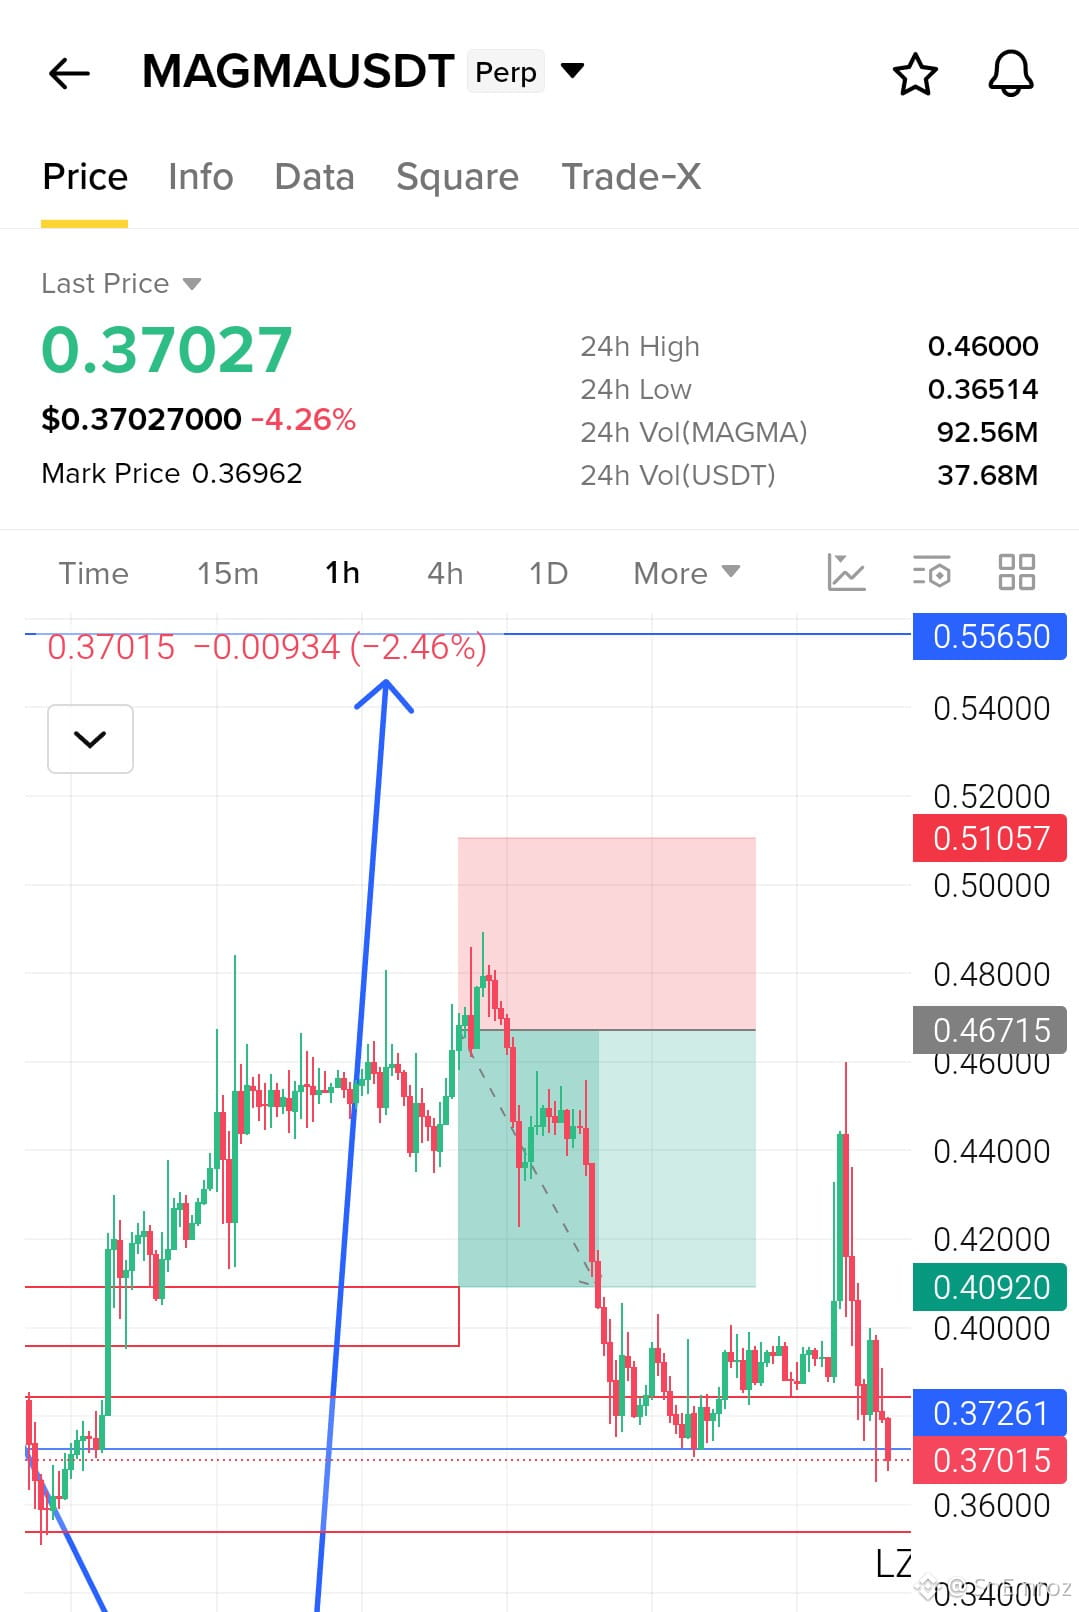
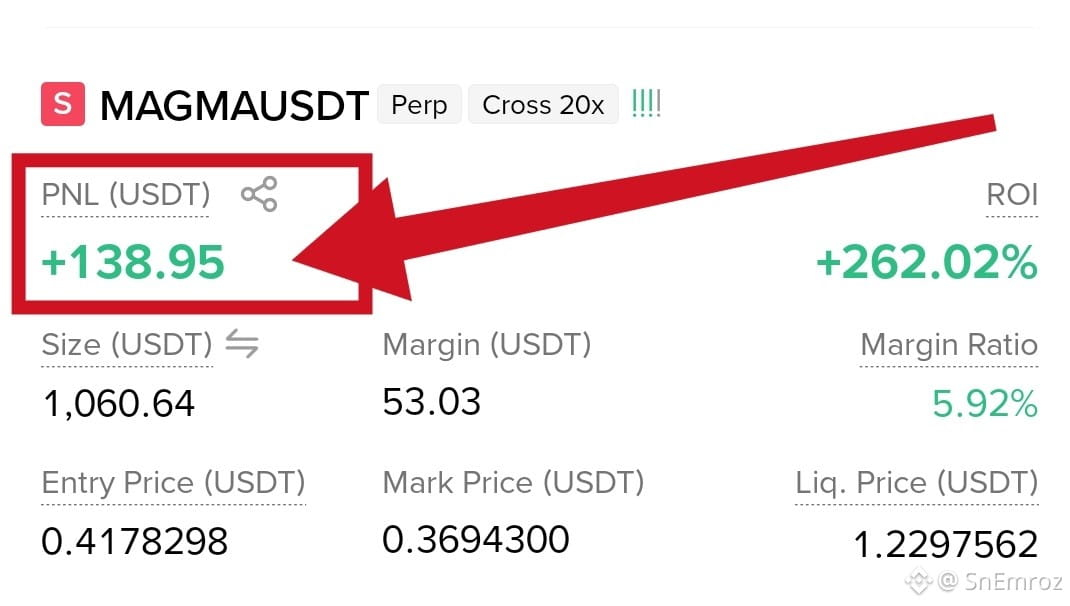
$MAGMA Short Setup played out and price is now sitting near the 24h low. Earlier we marked a short at 0.46715 after sellers rejected price from the highs. The target was 0.40920 and the stop loss was 0.51057. Price dropped from there and hit the target. $MAGMA is now at 0.37027 and down 4.26% today. The 24h range is 0.36514 to 0.46000. Price is trading just under 0.37261 and the 24h low is only a small step below. {future}(MAGMAUSDT) My own short from 0.41783 is at +138.95 USDT with +262.02% ROI on 20x cross. If price keeps closing below 0.37261 a move to 0.36514 and then 0.36000 is likely. A bounce can retest 0.37261 from below. Only a strong close back above it weakens the short idea and opens a move toward 0.40920. For now MAGMA stays weak under 0.37261. #magma
$MAGMA Short Setup played out and price is now sitting near the 24h low.

Earlier we marked a short at 0.46715 after sellers rejected price from the highs. The target was 0.40920 and the stop loss was 0.51057. Price dropped from there and hit the target.

$MAGMA is now at 0.37027 and down 4.26% today. The 24h range is 0.36514 to 0.46000. Price is trading just under 0.37261 and the 24h low is only a small step below.


My own short from 0.41783 is at +138.95 USDT with +262.02% ROI on 20x cross.

If price keeps closing below 0.37261 a move to 0.36514 and then 0.36000 is likely.

A bounce can retest 0.37261 from below. Only a strong close back above it weakens the short idea and opens a move toward 0.40920.

For now MAGMA stays weak under 0.37261.

#magma
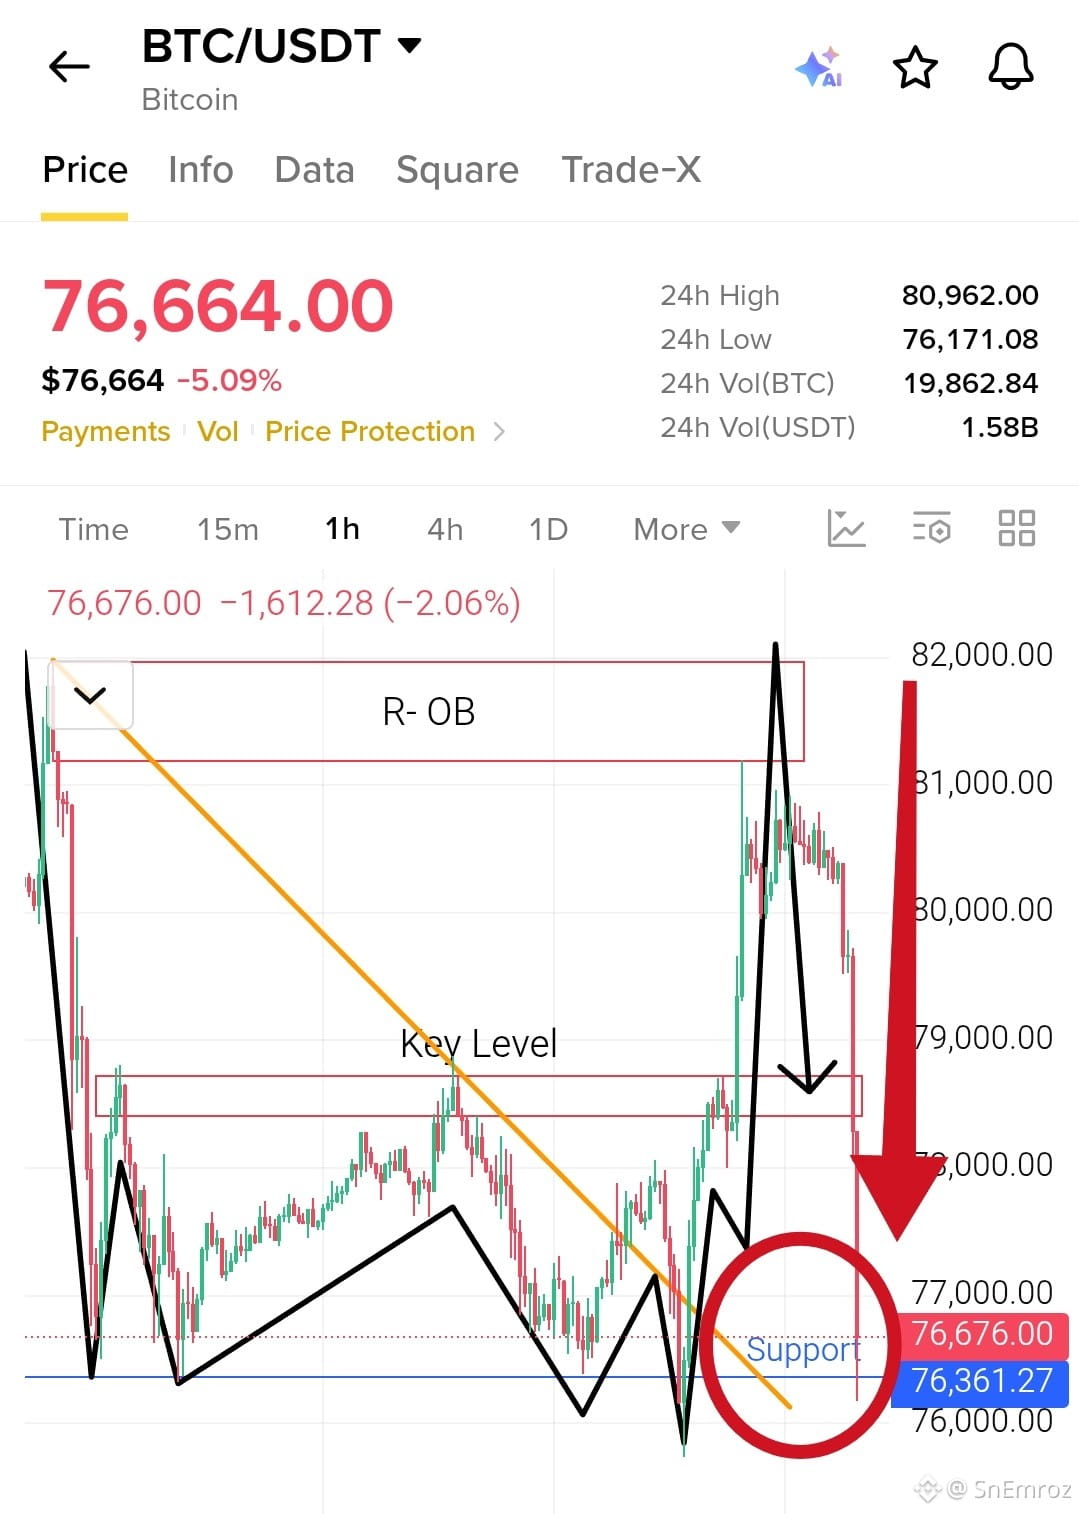
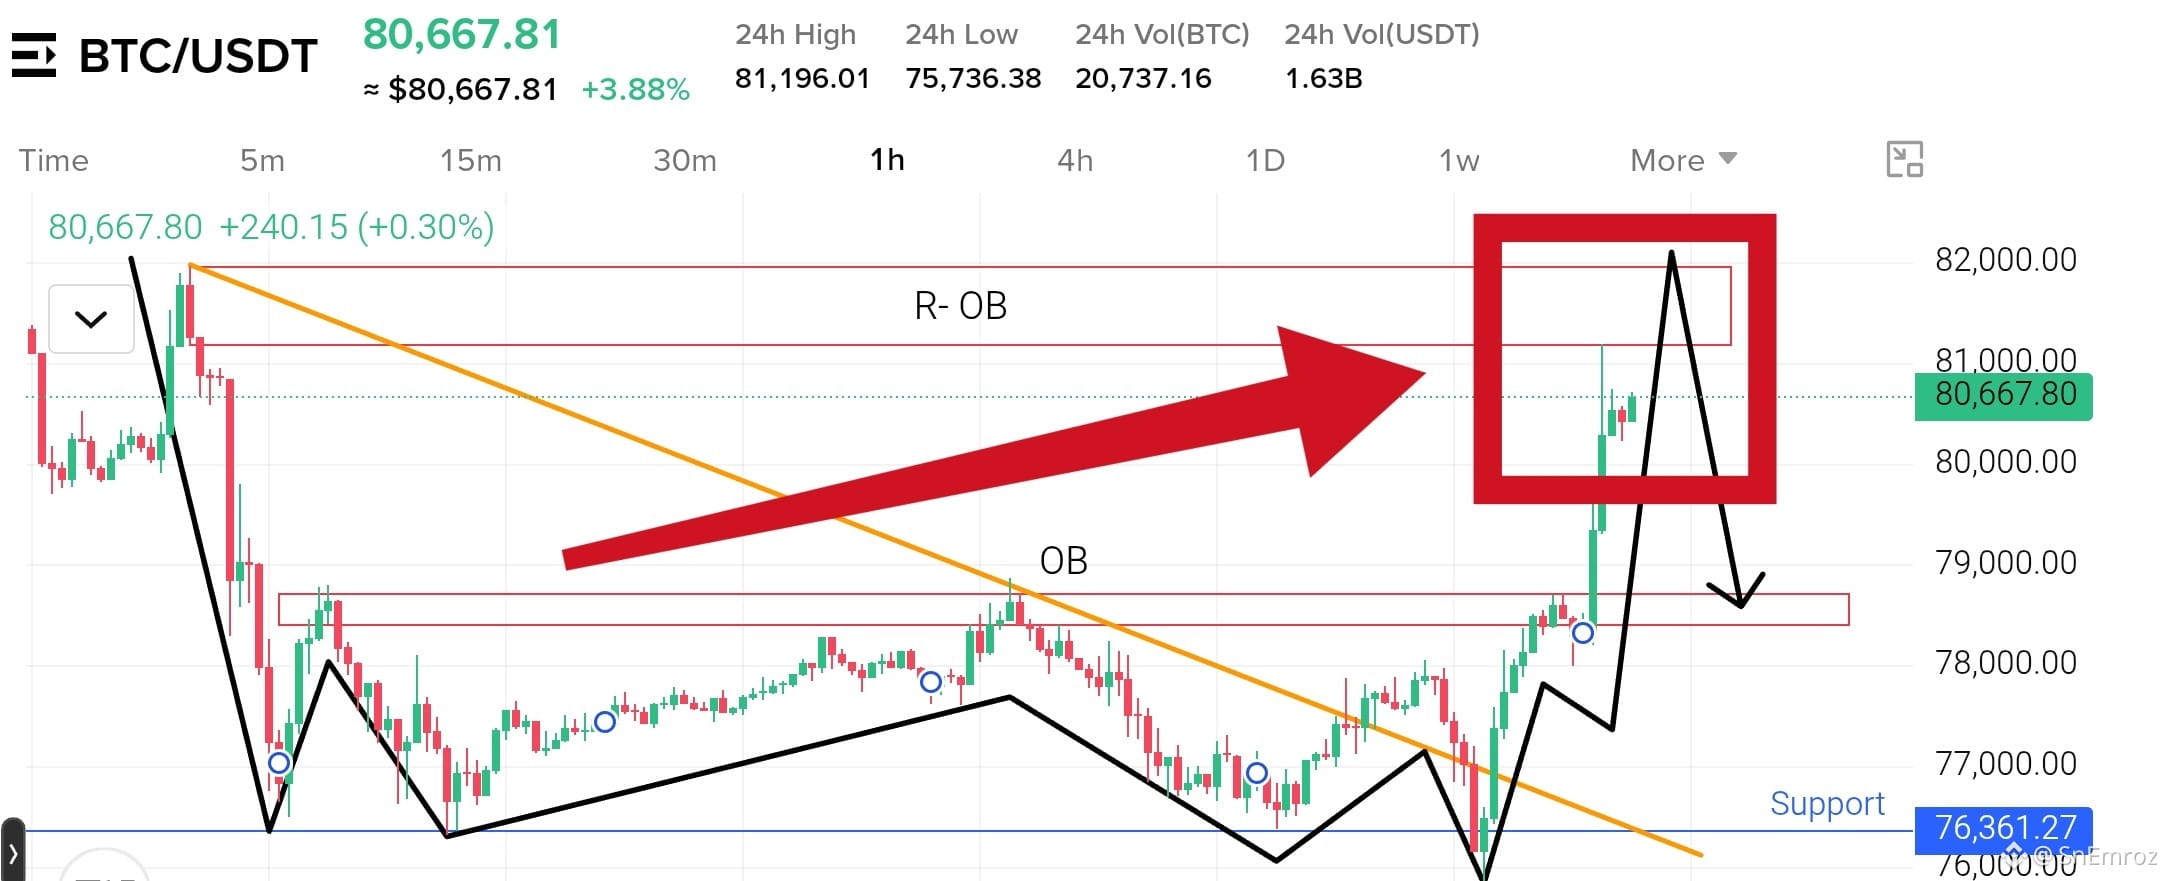
Our last BTC call played out and price is now testing support. Earlier $BTC was at 80667 and up 3.9% after breaking the falling trendline and bouncing from 76361. We said the Double Bottom neckline at 78400 to 78700 had broken and price was running into the R-OB zone at 81150 to 82000. We also said a rejection from R-OB could bring a retest of 78400 to 78700 and that losing it can send price back to 76361. {future}(BTCUSDT) That is exactly what happened. Sellers rejected price at R-OB and the retest zone failed to hold. BTC dropped about 5% from our last update and is now at 76664 and down 5.09% today. The 24h range is 76171 to 80962. Price is sitting right on the 76361 support and the 24h low shows it already dipped just under that level. The Double Bottom idea has failed for now. 78400 to 78700 is no longer support. It is now resistance. If a 1H candle closes below 76361 price can drop toward 75736 where the last sweep happened. If support holds a bounce can retest 78400 to 78700 from below. A strong close above 78700 brings the bullish structure back and 80000 comes into play. For now BTC stays weak below 78400. Support has not broken on a close yet. The next 1H closes around 76361 will decide the move.
Our last BTC call played out and price is now testing support.

Earlier $BTC was at 80667 and up 3.9% after breaking the falling trendline and bouncing from 76361. We said the Double Bottom neckline at 78400 to 78700 had broken and price was running into the R-OB zone at 81150 to 82000. We also said a rejection from R-OB could bring a retest of 78400 to 78700 and that losing it can send price back to 76361.


That is exactly what happened. Sellers rejected price at R-OB and the retest zone failed to hold. BTC dropped about 5% from our last update and is now at 76664 and down 5.09% today.

The 24h range is 76171 to 80962. Price is sitting right on the 76361 support and the 24h low shows it already dipped just under that level.

The Double Bottom idea has failed for now. 78400 to 78700 is no longer support. It is now resistance.

If a 1H candle closes below 76361 price can drop toward 75736 where the last sweep happened.

If support holds a bounce can retest 78400 to 78700 from below. A strong close above 78700 brings the bullish structure back and 80000 comes into play.

For now BTC stays weak below 78400. Support has not broken on a close yet. The next 1H closes around 76361 will decide the move.
SnEmroz
·
--
බෙයාරිෂ්
$BTC is now at 80,667 and up 3.9% today.

Price broke the falling trendline and bounced hard from the 76361 support. The last dip swept below that support to 75736 and buyers took it back fast.

The chart shows a Double Bottom. The neckline sits at the OB zone near 78400 to 78700 and price already broke above it.

Momentum is bullish with strong green candles. But price is now running into the R-OB zone at 81150 to 82000 where sellers acted before.


A rejection from the R-OB already happen and price try back to retest the OB at 78400 to 78700. That is about 3% below price.

If price loses 78400 it can fall back to 76361.
·
--
බෙයාරිෂ්
SnEmroz
·
--
බෙයාරිෂ්
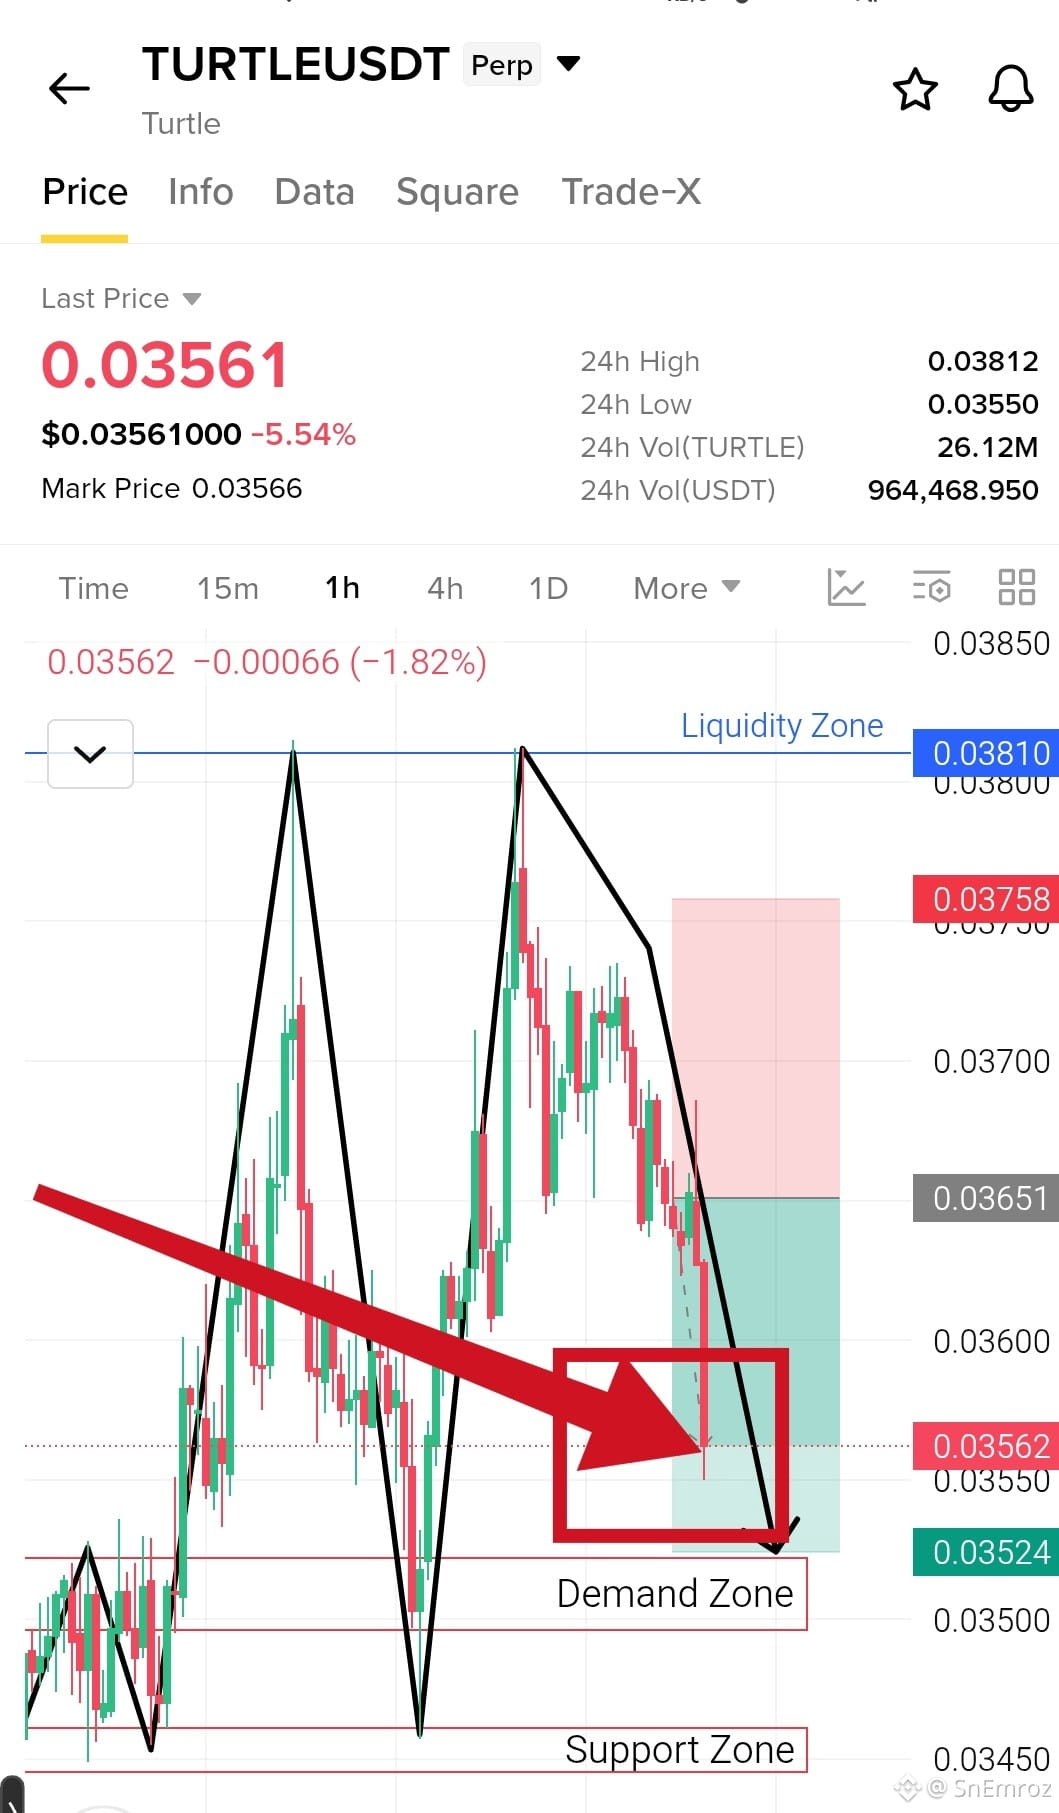
$TURTLE Short Setup 1h Chart🔴

🔶 Double Top M pattern

Price made two tops at the 0.0381 liquidity zone and both got rejected with long upper wicks. The second push grabbed the stops above the first top and then sellers took control. Price is now sliding in lower highs and has left the zone. If it stays under 0.0375, a drop toward the demand zone near 0.0352 is likely. The neckline sits near 0.0345 to 0.0350, so a close under the demand zone would confirm the full pattern.

🔴Short Entry 0.03651


✅ Take Profits

TP1 0.03600
TP2 0.03550
TP3 0.03524

❌ Stop Loss 0.03758

#turtle
·
--
බෙයාරිෂ්
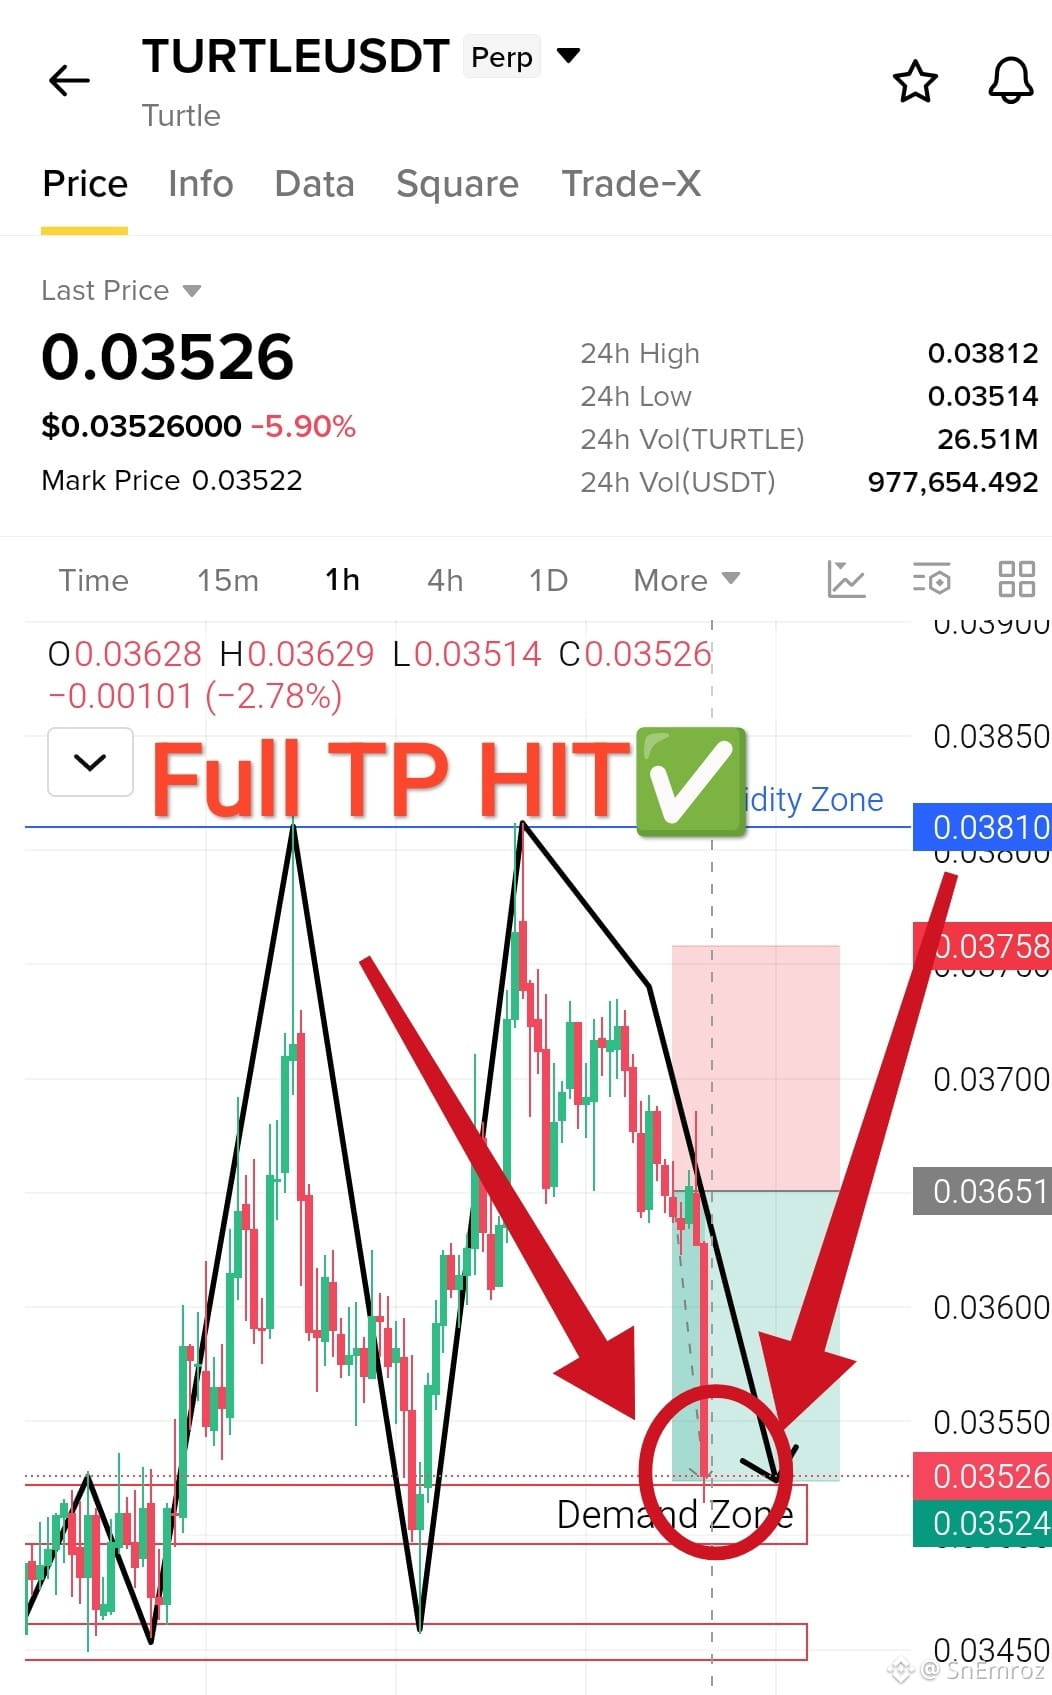
$TURTLE Congratulations to everyone who followed this setup. Our bearish scenario played out as expected. The first two targets have been hit and price is now close to the third. Price was rejected twice at the $0.0381 liquidity zone and sellers took control after that. The drop moved through $0.0360 and $0.0355 and price now sits at $0.03528. $TURTLE {future}(TURTLEUSDT) near our final target at $0.03524. That is about a 2.5% move from our entry at $0.03651. Stay patient, protect your profit and stay alert for the next one. #TURTLE
$TURTLE Congratulations to everyone who followed this setup.

Our bearish scenario played out as expected. The first two targets have been hit and price is now close to the third.

Price was rejected twice at the $0.0381 liquidity zone and sellers took control after that. The drop moved through $0.0360 and $0.0355 and price now sits at $0.03528.

$TURTLE
near our final target at $0.03524.

That is about a 2.5% move from our entry at $0.03651.

Stay patient, protect your profit and stay alert for the next one.

#TURTLE
SnEmroz
·
--
බෙයාරිෂ්
$TURTLE Short Setup 1h Chart🔴

🔶 Double Top M pattern

Price made two tops at the 0.0381 liquidity zone and both got rejected with long upper wicks. The second push grabbed the stops above the first top and then sellers took control. Price is now sliding in lower highs and has left the zone. If it stays under 0.0375, a drop toward the demand zone near 0.0352 is likely. The neckline sits near 0.0345 to 0.0350, so a close under the demand zone would confirm the full pattern.

🔴Short Entry 0.03651


✅ Take Profits

TP1 0.03600
TP2 0.03550
TP3 0.03524

❌ Stop Loss 0.03758

#turtle
·
--
බෙයාරිෂ්
$TURTLE Short Setup 1h Chart🔴 🔶 Double Top M pattern Price made two tops at the 0.0381 liquidity zone and both got rejected with long upper wicks. The second push grabbed the stops above the first top and then sellers took control. Price is now sliding in lower highs and has left the zone. If it stays under 0.0375, a drop toward the demand zone near 0.0352 is likely. The neckline sits near 0.0345 to 0.0350, so a close under the demand zone would confirm the full pattern. 🔴Short Entry 0.03651 {future}(TURTLEUSDT) ✅ Take Profits TP1 0.03600 TP2 0.03550 TP3 0.03524 ❌ Stop Loss 0.03758 #turtle
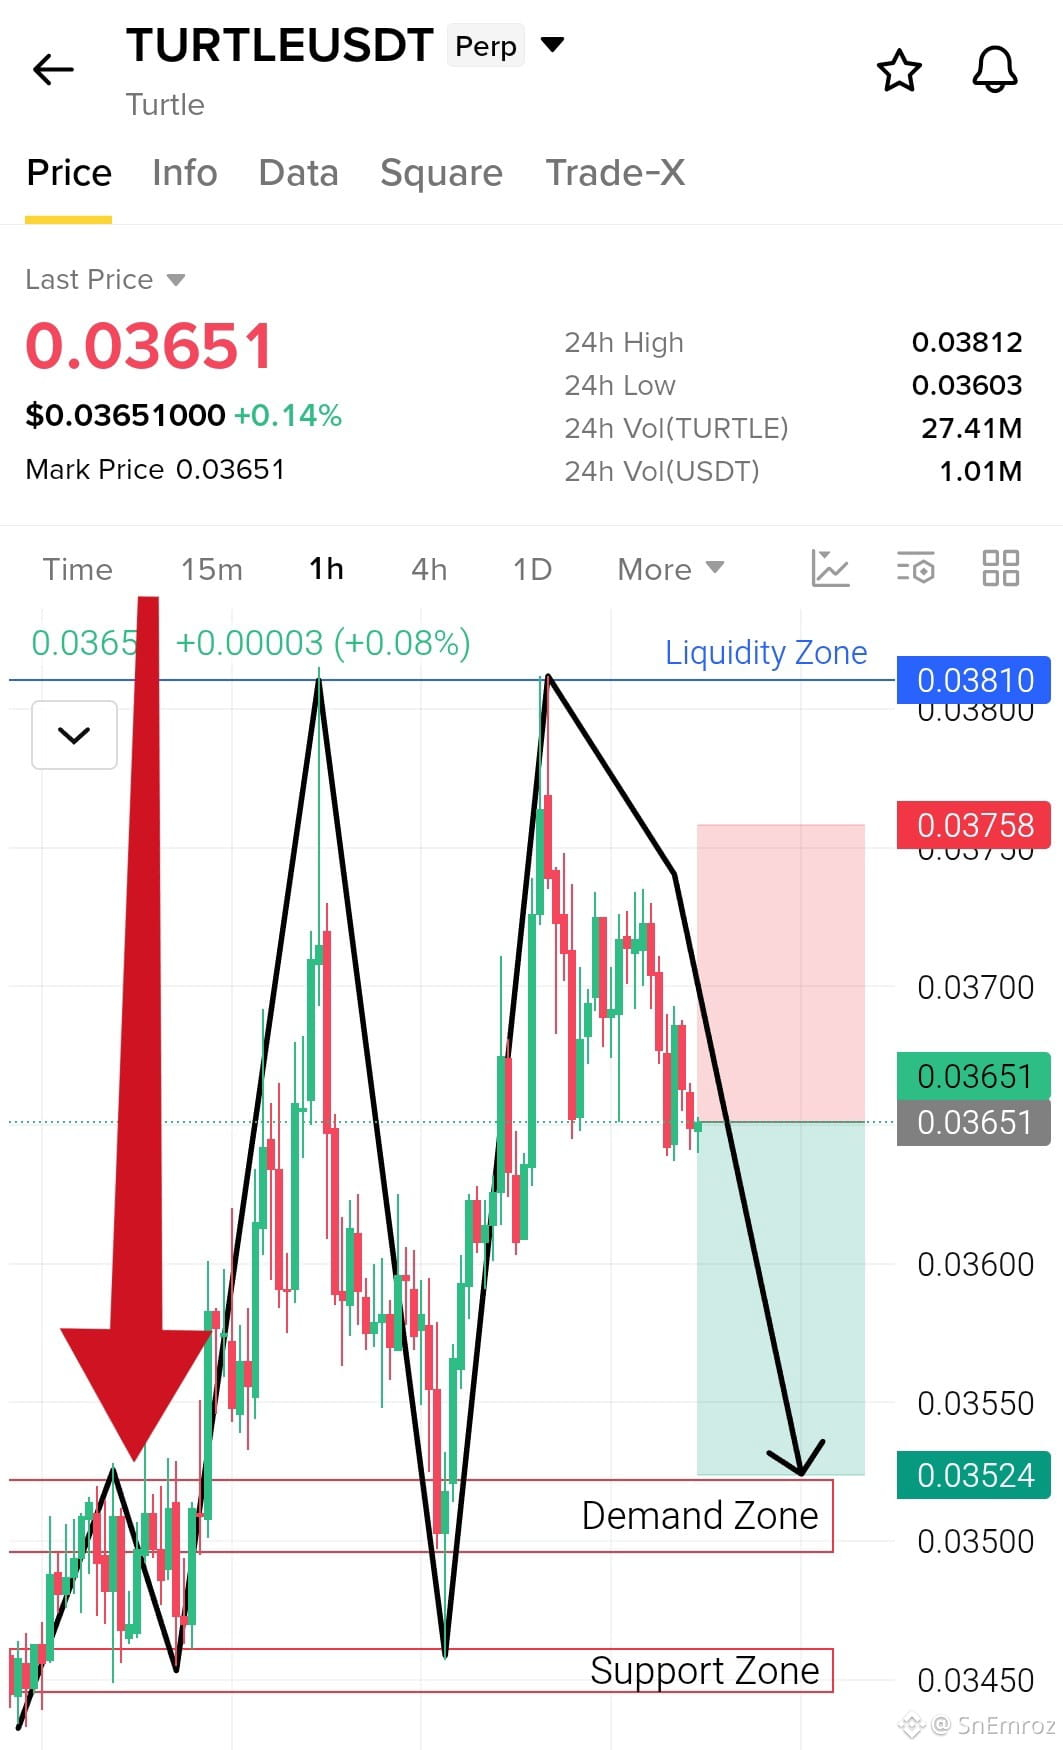
$TURTLE Short Setup 1h Chart🔴

🔶 Double Top M pattern

Price made two tops at the 0.0381 liquidity zone and both got rejected with long upper wicks. The second push grabbed the stops above the first top and then sellers took control. Price is now sliding in lower highs and has left the zone. If it stays under 0.0375, a drop toward the demand zone near 0.0352 is likely. The neckline sits near 0.0345 to 0.0350, so a close under the demand zone would confirm the full pattern.

🔴Short Entry 0.03651


✅ Take Profits

TP1 0.03600
TP2 0.03550
TP3 0.03524

❌ Stop Loss 0.03758

#turtle
·
--
බෙයාරිෂ්
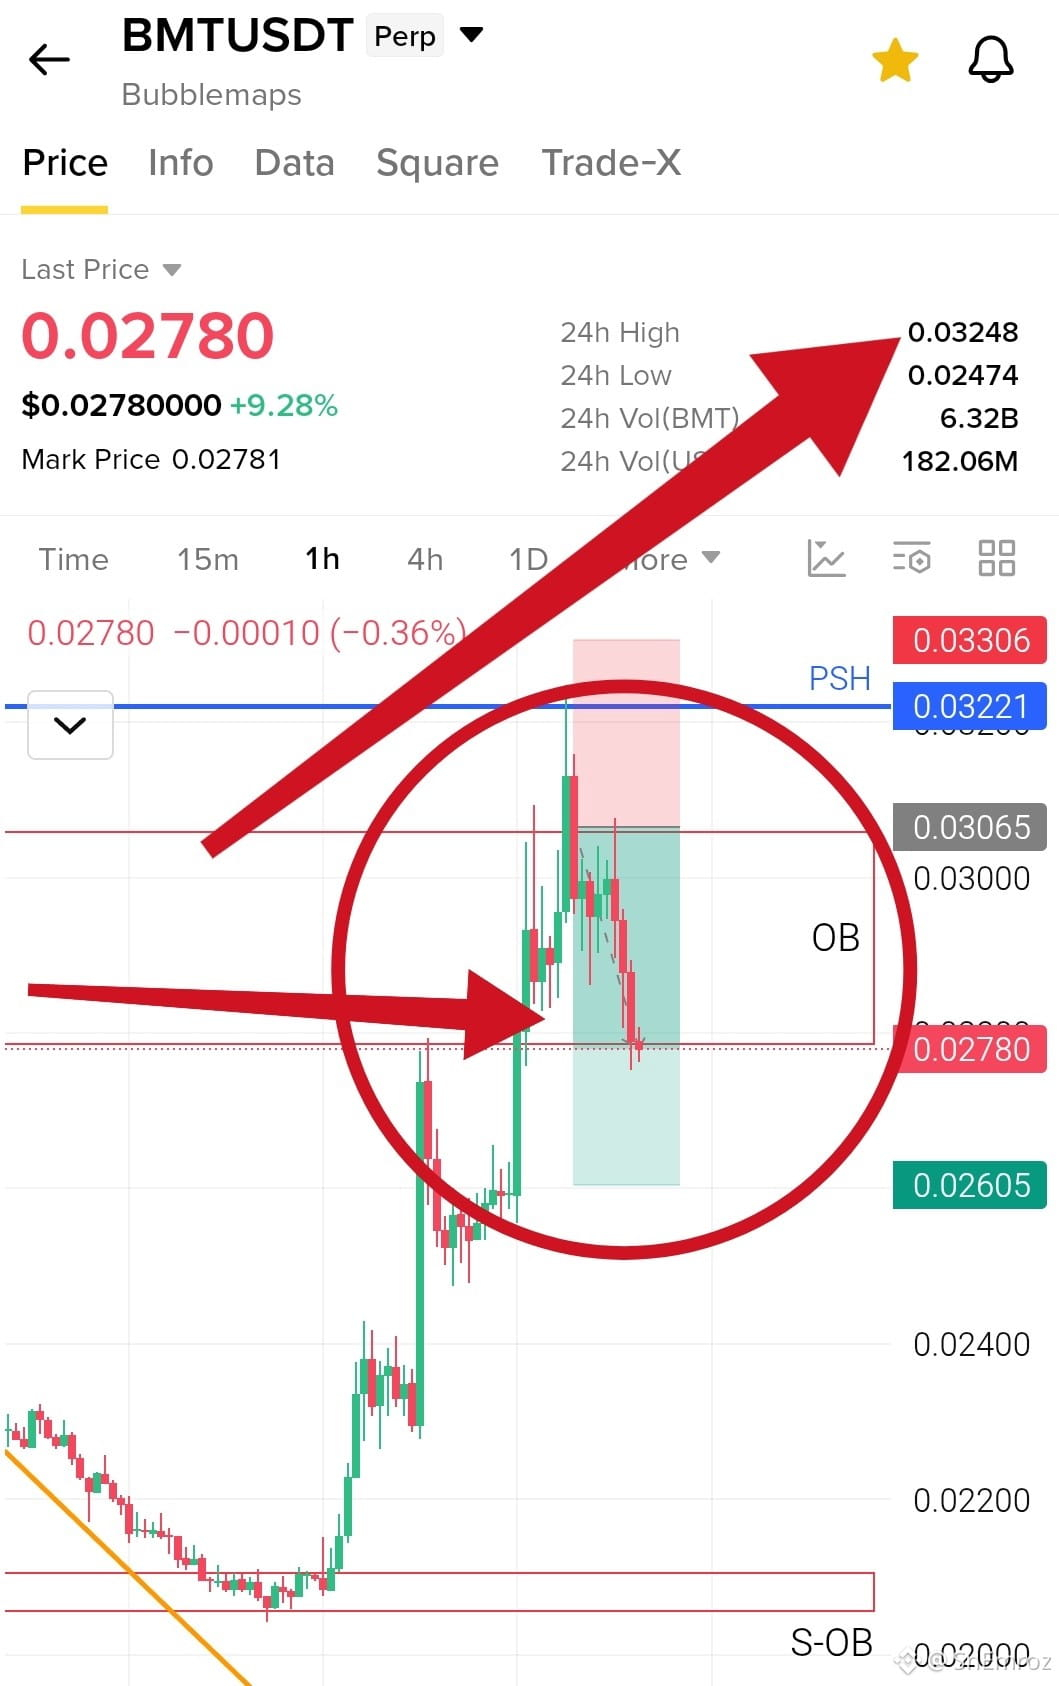
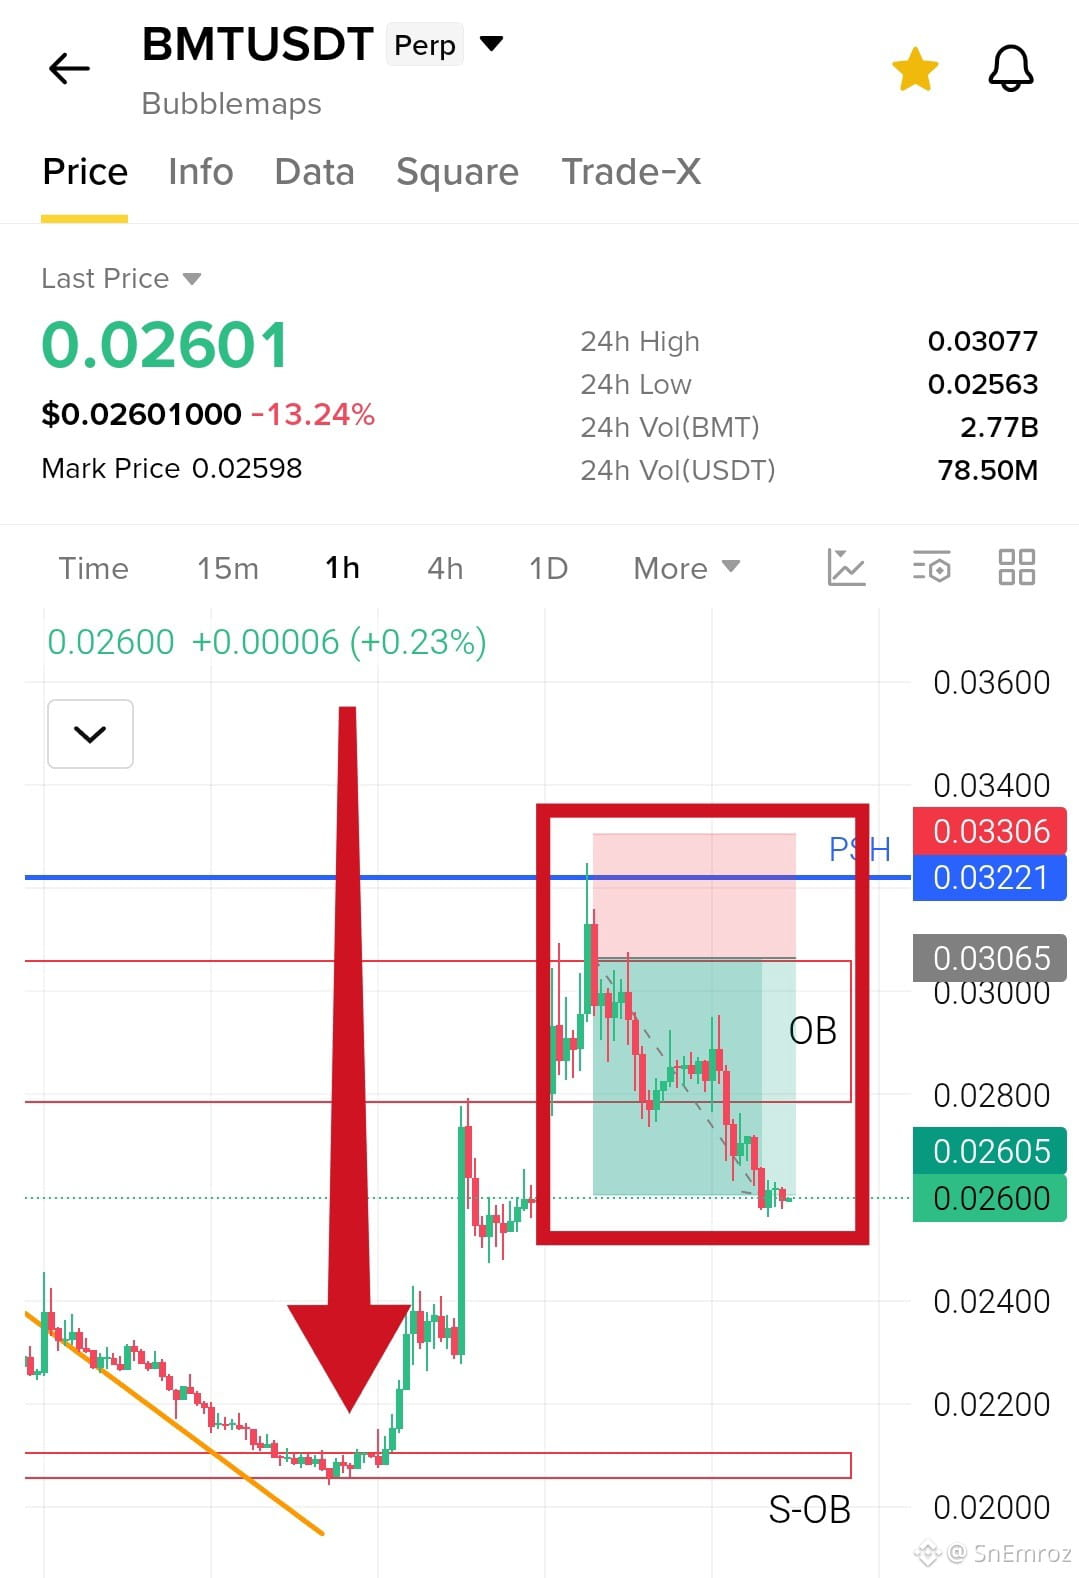
$BMT {future}(BMTUSDT) Challenge trade completed. All three targets have been hit. When BMT was pumping around 30%, most traders were looking for more upside. We went the other way with a short setup at $0.0302 because price had touched the PSH near $0.0322 and made a big rejection inside a liquidity zone. Sellers took control after that. Price moved through $0.0290 and $0.0275 and then reached our final target at $0.02605. That is about a 13.7% move from our entry. Patience and a clear plan did the job. Stay careful, protect your profit and stay alert for the next setup.
$BMT

Challenge trade completed. All three targets have been hit.

When BMT was pumping around 30%, most traders were looking for more upside. We went the other way with a short setup at $0.0302 because price had touched the PSH near $0.0322 and made a big rejection inside a liquidity zone.

Sellers took control after that. Price moved through $0.0290 and $0.0275 and then reached our final target at $0.02605.

That is about a 13.7% move from our entry.

Patience and a clear plan did the job. Stay careful, protect your profit and stay alert for the next setup.
·
--
උසබ තත්ත්වය
·
--
බෙයාරිෂ්
$BTC is now at 80,667 and up 3.9% today. Price broke the falling trendline and bounced hard from the 76361 support. The last dip swept below that support to 75736 and buyers took it back fast. The chart shows a Double Bottom. The neckline sits at the OB zone near 78400 to 78700 and price already broke above it. Momentum is bullish with strong green candles. But price is now running into the R-OB zone at 81150 to 82000 where sellers acted before. {future}(BTCUSDT) A rejection from the R-OB already happen and price try back to retest the OB at 78400 to 78700. That is about 3% below price. If price loses 78400 it can fall back to 76361.
$BTC is now at 80,667 and up 3.9% today.

Price broke the falling trendline and bounced hard from the 76361 support. The last dip swept below that support to 75736 and buyers took it back fast.

The chart shows a Double Bottom. The neckline sits at the OB zone near 78400 to 78700 and price already broke above it.

Momentum is bullish with strong green candles. But price is now running into the R-OB zone at 81150 to 82000 where sellers acted before.


A rejection from the R-OB already happen and price try back to retest the OB at 78400 to 78700. That is about 3% below price.

If price loses 78400 it can fall back to 76361.
·
--
බෙයාරිෂ්
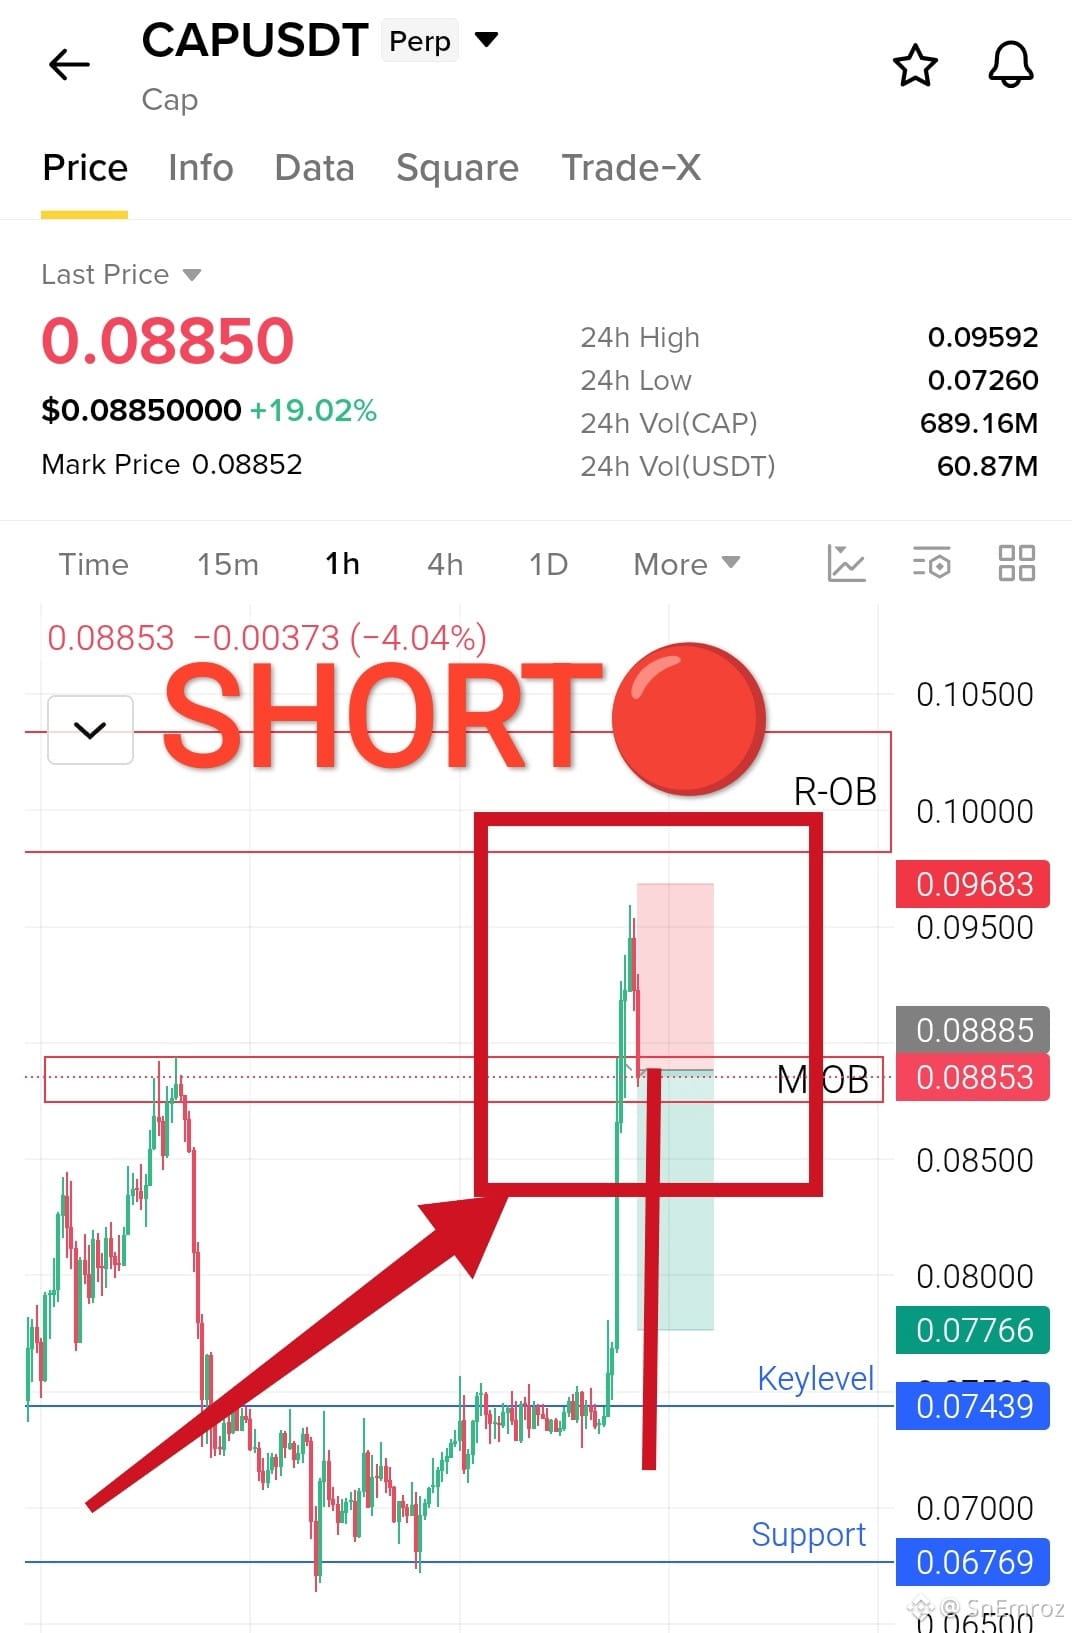
$CAP Short Setup 🔴 🔶 Rejection from the M-OB CAP made a sharp move upward and is now testing the M-OB resistance zone around $0.0870–$0.0885. Sellers may step in from this area. If price gets rejected and bearish momentum returns, the downside targets are $0.07766, $0.07439, and $0.06769. A move above the stop-loss level would invalidate this setup. 🔴 Short Entry $0.08885 {future}(CAPUSDT) ✅ Take Profits TP1: $0.08541 TP2: $0.08133 TP3: $0.07766 ❌ Stop Loss $0.09683 #CAP
$CAP Short Setup 🔴

🔶 Rejection from the M-OB

CAP made a sharp move upward and is now testing the M-OB resistance zone around $0.0870–$0.0885. Sellers may step in from this area. If price gets rejected and bearish momentum returns, the downside targets are $0.07766, $0.07439, and $0.06769. A move above the stop-loss level would invalidate this setup.

🔴 Short Entry $0.08885


✅ Take Profits

TP1: $0.08541
TP2: $0.08133
TP3: $0.07766

❌ Stop Loss $0.09683

#CAP
·
--
උසබ තත්ත්වය
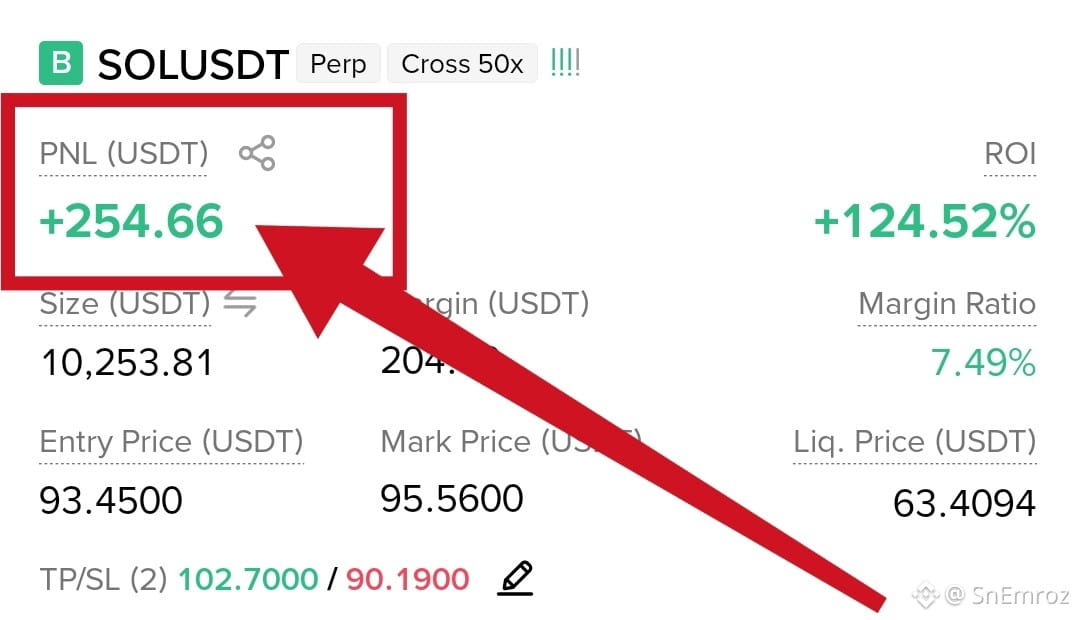
Thank you $SOL for sweet profit... {future}(SOLUSDT)
Thank you $SOL for sweet profit...
SnEmroz
·
--
උසබ තත්ත්වය
$SOL Long Setup 4h Chart🟢

🔶 Support sweep bounce

Price fell from the 124 high along a falling trendline and broke below the 95 to 96.5 support. It swept down to the 90.8 low and buyers took it back fast with a strong green candle. Price now sits just under that zone, so 95 to 96.5 is the first wall. A 4h close above it can open the way to the falling trendline near 99.5 and then 102.7. If price loses 90.18 the setup is gone.

🟢Long Entry 93.51


✅ Take Profits

TP1 96.50
TP2 99.50
TP3 102.70

❌ Stop Loss 90.18

#sol
·
--
උසබ තත්ත්වය
$NEWT Update 🟢 Price climbed close to our 2nd take profit at $0.04420 nearly hitting the target. It is now testing the new support order block around $0.04280. {future}(NEWTUSDT) Hopefully this support zone holds and gives buyers the momentum to push price toward our final take profit target. Let's watch the reaction here. Full TP is still in sight. 🔥 #NEWT
$NEWT Update 🟢

Price climbed close to our 2nd take profit at $0.04420 nearly hitting the target. It is now testing the new support order block around $0.04280.


Hopefully this support zone holds and gives buyers the momentum to push price toward our final take profit target.

Let's watch the reaction here. Full TP is still in sight. 🔥

#NEWT
SnEmroz
·
--
උසබ තත්ත්වය
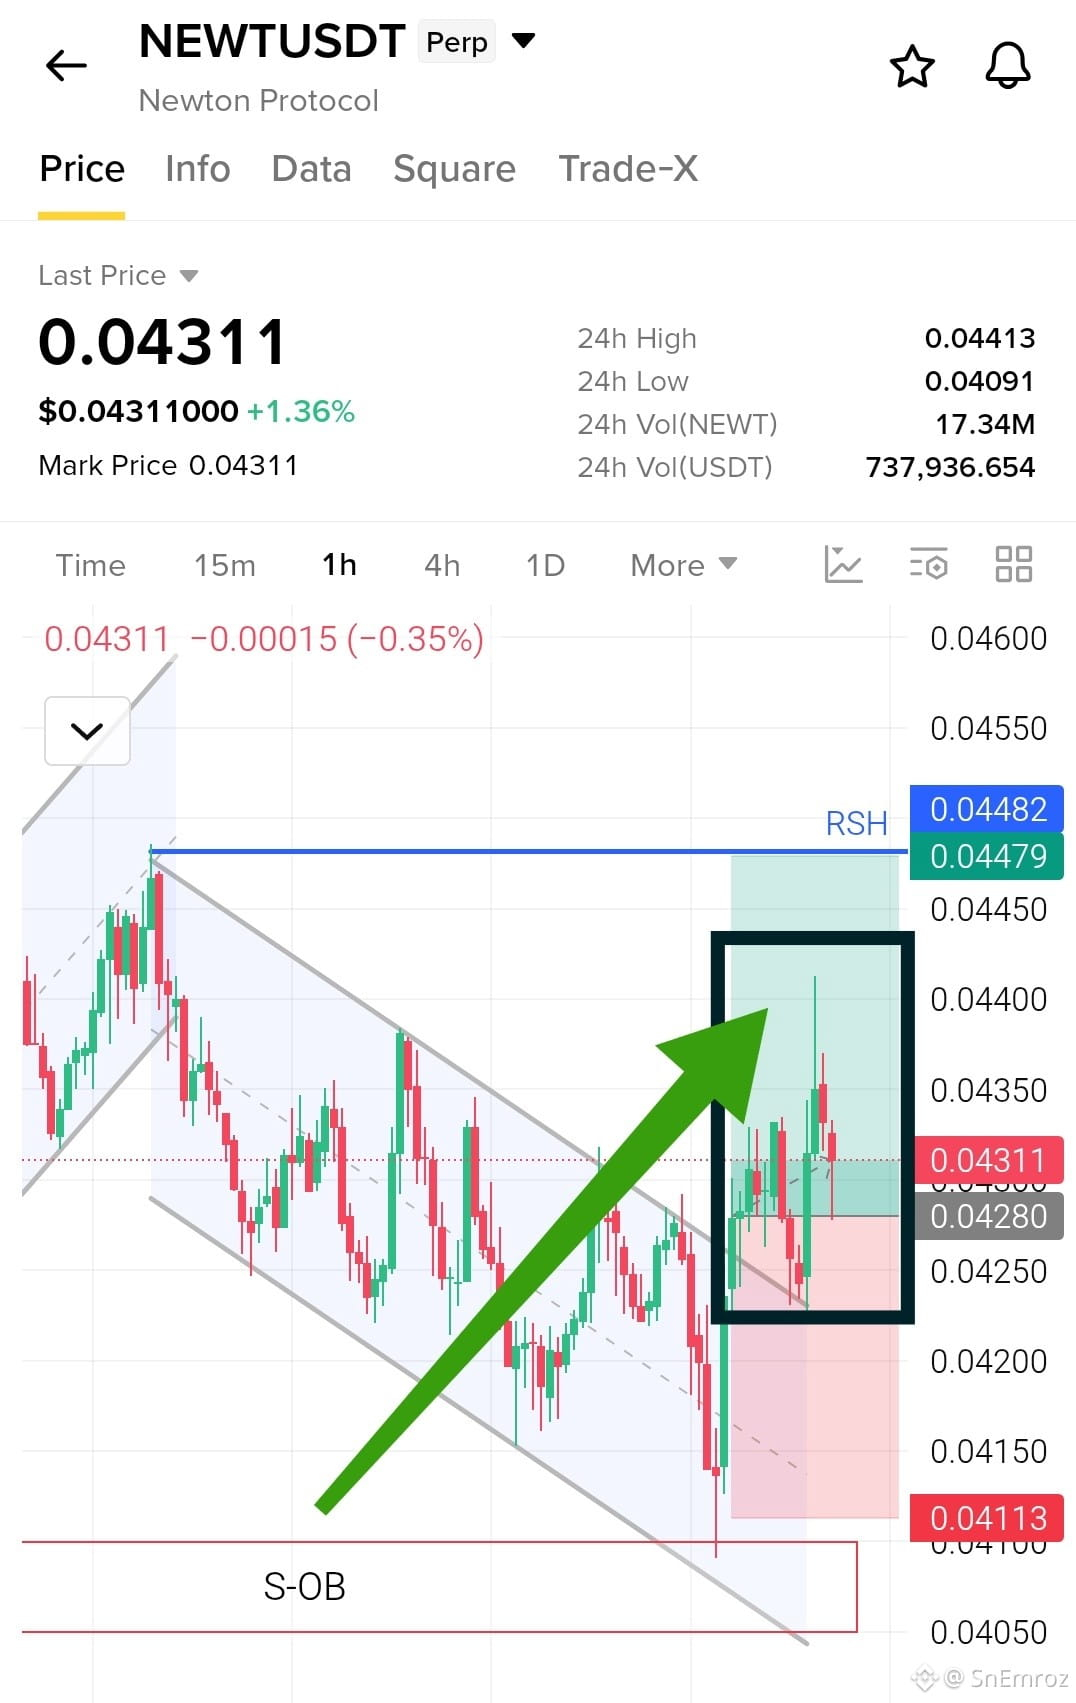
$NEWT Long Setup 1h Chart🟢

🔶 Bull Flag pattern

Price ran up in a rising channel and then slid in a falling channel, which forms the flag. It swept down to the 0.0409 low and buyers took it back fast with a long wick. Price has now pushed above the top of the flag with a green candle. If it holds above 0.0425 the way opens to 0.0448, where the flag started. If price loses 0.04113 the setup is gone.

🟢Long Entry 0.04278


✅ Take Profits

TP1 0.04350
TP2 0.04420
TP3 0.04479

❌ Stop Loss 0.04113

#newt
ලිපිය
Liquidity Zone and Liquidity Pool ExplainedPrie does not move randomly. It moves toward places where many orders are waiting. Those places are called liquidity. When you learn to see them you stop getting trapped by fake breakouts and you start to understand why price suddenly spikes and comes back. What is liquidity? Liquidity means orders waiting in the market. Every stop loss, every pending buy or sell order and every breakout order is liquidity. Big traders need a lot of orders on the other side to fill their large positions. So price often travels to the place where those orders are sitting. What is a liquidity zone? A liquidity zone is an area on the chart where many orders sit. It is usually near an obvious level that most traders can see. Previous highs and lowsSupport and resistanceRound numbers like 100 or 0.5000TrendlinesRange high and range low Many traders place their stop loss just above resistance or just below support. So those areas become packed with orders. What is a liquidity pool? A liquidity pool is a thick cluster of orders sitting in one tight spot. Think of it as a pool of stop losses waiting to be touched. There are two types. Buy side liquidity sits above highs. It holds the stop losses of short traders and the buy orders of breakout traders. Sell side liquidity sits below lows. It holds the stop losses of long traders and the sell orders of breakdown traders. Equal highs and equal lows are the strongest pools because everybody sees them and everybody puts the stop in the same place. Simple difference. A zone is the wide area. A pool is the thick cluster of orders inside that area. Why price goes to liquidity? A large player cannot buy a big size at any price without pushing the market up. They need sellers to take the other side. When a stop loss is hit it becomes a market order. So when price runs into a pool the stops trigger and give large players the orders they need. After that price often reverses. It does not happen every time but it happens often enough to matter. What is a liquidity sweep? A liquidity sweep is when price spikes through a level, grabs the stops and then closes back inside. On the chart you see a long wick. Bullish sweep. Price drops below support, leaves a long lower wick and closes back above it.Bearish sweep. Price pushes above resistance, leaves a long upper wick and closes back below it. Sweep or real breakout? This is the hardest part. Here is a simple way to tell them apart. Sweep. A wick goes through the level but the candle closes back inside. Price returns fast and the move has no follow through.Real breakout. A candle closes beyond the level. Price holds there on the retest and volume stays strong. When you are not sure wait for the candle close. A close tells you more than a wick. How to trade it step by step? Mark the obvious highs and lows on a higher timeframe like the 1h or 4h chart.Wait for price to reach the level. Do not enter before it gets there.Look for a wick through the level and a close back inside.Enter after the confirmation candle and not during the spike.Put your stop loss just beyond the wick.Take profit at the next pool on the other side Our mistakes! Entering before the sweep happensCalling every wick a sweepTrading against a strong trendUsing big size with a wide stopIgnoring the higher timeframe Liquidity is a way to read the chart. It is not a promise. Sometimes price sweeps a level and keeps going and the level breaks for real. Always use a stop loss and keep your size small especially on coins with low volume. Before every trade ask one simple thing. Where are the stops sitting and who needs them. When you can answer that you stop chasing candles and start trading with a plan. Your Loving Mentor ❤️ @SnEmroz

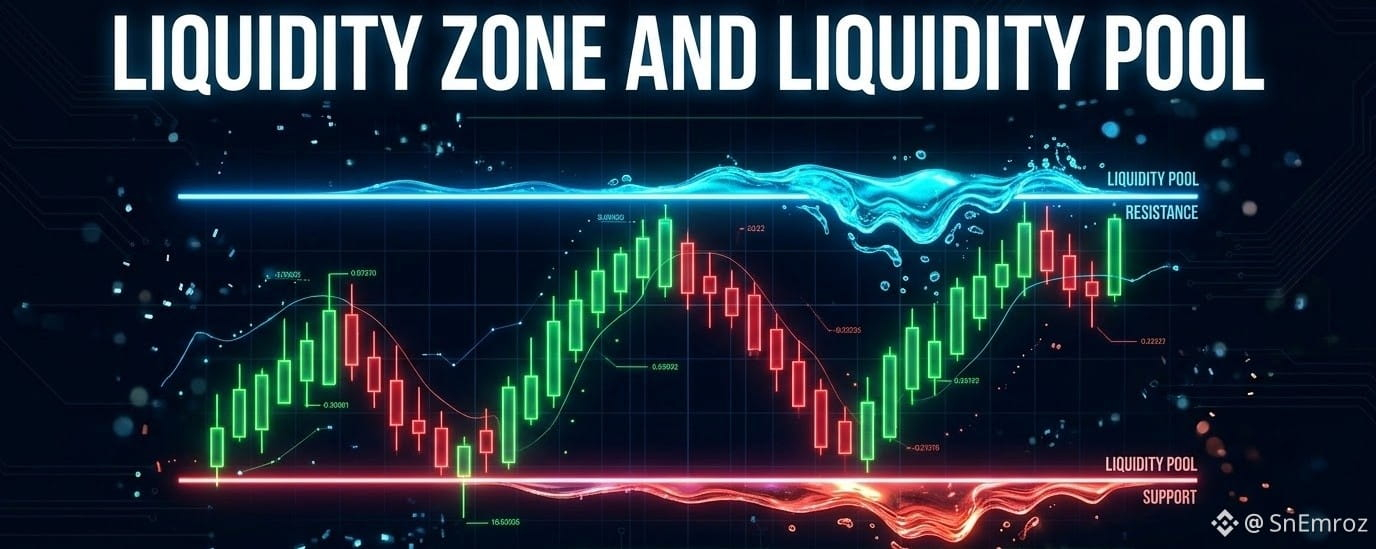
Liquidity Zone and Liquidity Pool Explained

Prie does not move randomly. It moves toward places where many orders are waiting. Those places are called liquidity. When you learn to see them you stop getting trapped by fake breakouts and you start to understand why price suddenly spikes and comes back.
What is liquidity?
Liquidity means orders waiting in the market. Every stop loss, every pending buy or sell order and every breakout order is liquidity. Big traders need a lot of orders on the other side to fill their large positions. So price often travels to the place where those orders are sitting.
What is a liquidity zone?
A liquidity zone is an area on the chart where many orders sit. It is usually near an obvious level that most traders can see.
Previous highs and lowsSupport and resistanceRound numbers like 100 or 0.5000TrendlinesRange high and range low
Many traders place their stop loss just above resistance or just below support. So those areas become packed with orders.
What is a liquidity pool?
A liquidity pool is a thick cluster of orders sitting in one tight spot. Think of it as a pool of stop losses waiting to be touched. There are two types.
Buy side liquidity sits above highs. It holds the stop losses of short traders and the buy orders of breakout traders.
Sell side liquidity sits below lows. It holds the stop losses of long traders and the sell orders of breakdown traders.
Equal highs and equal lows are the strongest pools because everybody sees them and everybody puts the stop in the same place.
Simple difference. A zone is the wide area. A pool is the thick cluster of orders inside that area.
Why price goes to liquidity?
A large player cannot buy a big size at any price without pushing the market up.
They need sellers to take the other side. When a stop loss is hit it becomes a market order. So when price runs into a pool the stops trigger and give large players the orders they need. After that price often reverses. It does not happen every time but it happens often enough to matter.
What is a liquidity sweep?
A liquidity sweep is when price spikes through a level, grabs the stops and then closes back inside. On the chart you see a long wick.
Bullish sweep. Price drops below support, leaves a long lower wick and closes back above it.Bearish sweep. Price pushes above resistance, leaves a long upper wick and closes back below it.
Sweep or real breakout?
This is the hardest part. Here is a simple way to tell them apart.
Sweep. A wick goes through the level but the candle closes back inside. Price returns fast and the move has no follow through.Real breakout. A candle closes beyond the level. Price holds there on the retest and volume stays strong.
When you are not sure wait for the candle close. A close tells you more than a wick.
How to trade it step by step?
Mark the obvious highs and lows on a higher timeframe like the 1h or 4h chart.Wait for price to reach the level. Do not enter before it gets there.Look for a wick through the level and a close back inside.Enter after the confirmation candle and not during the spike.Put your stop loss just beyond the wick.Take profit at the next pool on the other side
Our mistakes!
Entering before the sweep happensCalling every wick a sweepTrading against a strong trendUsing big size with a wide stopIgnoring the higher timeframe
Liquidity is a way to read the chart. It is not a promise. Sometimes price sweeps a level and keeps going and the level breaks for real. Always use a stop loss and keep your size small especially on coins with low volume.
Before every trade ask one simple thing. Where are the stops sitting and who needs them. When you can answer that you stop chasing candles and start trading with a plan.
Your Loving Mentor ❤️
@SnEmroz
·
--
බෙයාරිෂ්
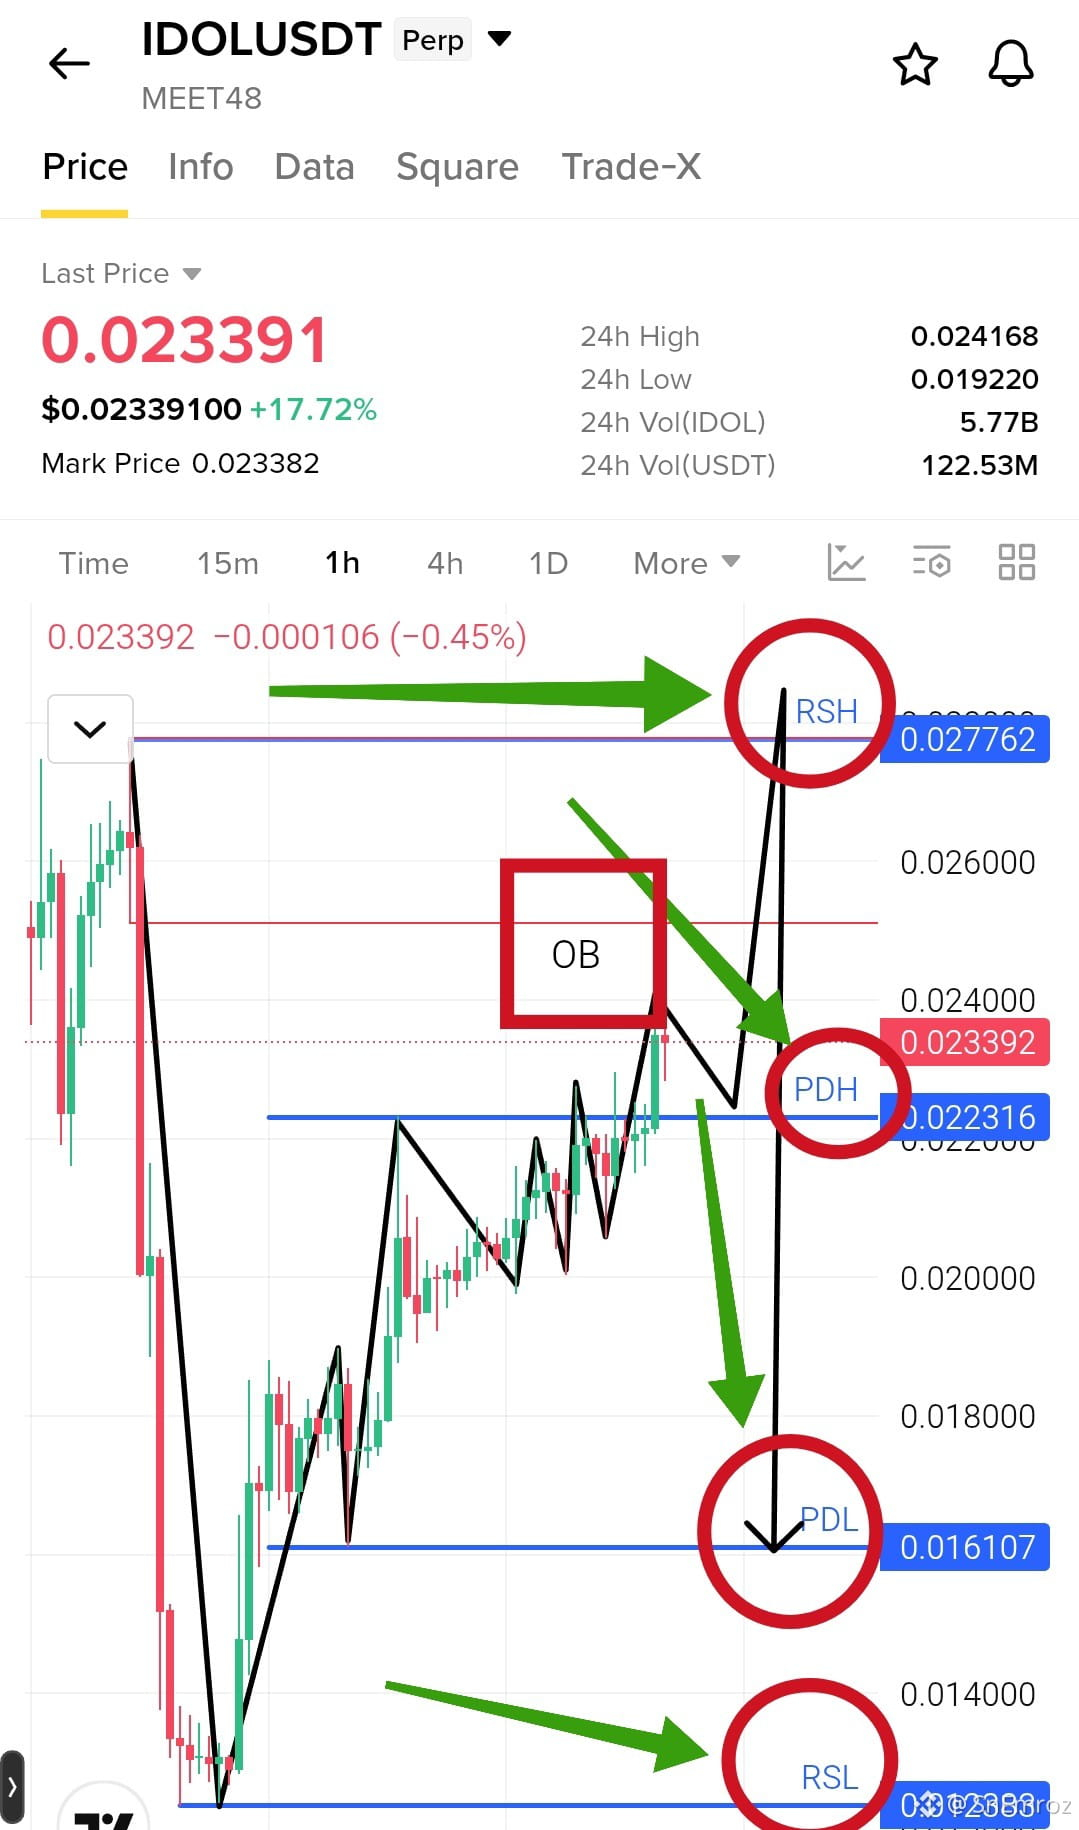
$IDOL Watch These Liquidity Levels. IDOL is trading around $0.02339, just above the PDH level at $0.022316. The first move could be a retest of PDH before buyers push price toward the order block around $0.0245 to $0.0255. If momentum continues, price could sweep the recent swing high at $0.027762 and collect liquidity above it. But the bigger move to watch is a possible rejection after that liquidity sweep. A bearish reversal could send price toward PDL at $0.016107, with RSL at $0.012383 as a deeper downside target. {future}(IDOLUSDT) The key is how price reacts around RSH and the order block. A strong breakout and hold above RSH would invalidate this bearish reversal scenario. Will IDOL sweep the highs before making its next move lower? I need your opinion... #IDOL
$IDOL Watch These Liquidity Levels.

IDOL is trading around $0.02339, just above the PDH level at $0.022316.

The first move could be a retest of PDH before buyers push price toward the order block around $0.0245 to $0.0255.

If momentum continues, price could sweep the recent swing high at $0.027762 and collect liquidity above it.

But the bigger move to watch is a possible rejection after that liquidity sweep. A bearish reversal could send price toward PDL at $0.016107, with RSL at $0.012383 as a deeper downside target.


The key is how price reacts around RSH and the order block. A strong breakout and hold above RSH would invalidate this bearish reversal scenario.

Will IDOL sweep the highs before making its next move lower?

I need your opinion...

#IDOL
·
--
බෙයාරිෂ්
While $BMT was flying, everyone thought it would go even higher. Price was up around 30% and many traders kept buying more and more. But we shared a short setup. Why? Because price had already touched the PSH, the previous swing high near $0.0322, and made a big rejection there. {future}(BMTUSDT) That area was also marked as a liquidity zone. Price grabbed the liquidity above the high, and big players likely used it to enter short and push retail traders out of the market. Now price is at $0.0278, about 8% below our entry at $0.0302, and our second target has been hit. Take love, stay careful and stay alert for the next setup. #BMT
While $BMT was flying, everyone thought it would go even higher. Price was up around 30% and many traders kept buying more and more.

But we shared a short setup. Why? Because price had already touched the PSH, the previous swing high near $0.0322, and made a big rejection there.


That area was also marked as a liquidity zone. Price grabbed the liquidity above the high, and big players likely used it to enter short and push retail traders out of the market.

Now price is at $0.0278, about 8% below our entry at $0.0302, and our second target has been hit.

Take love, stay careful and stay alert for the next setup.

#BMT
SnEmroz
·
--
බෙයාරිෂ්
$BMT Short Setup 4h Chart🔴

🔶 Order Block rejection at PSH

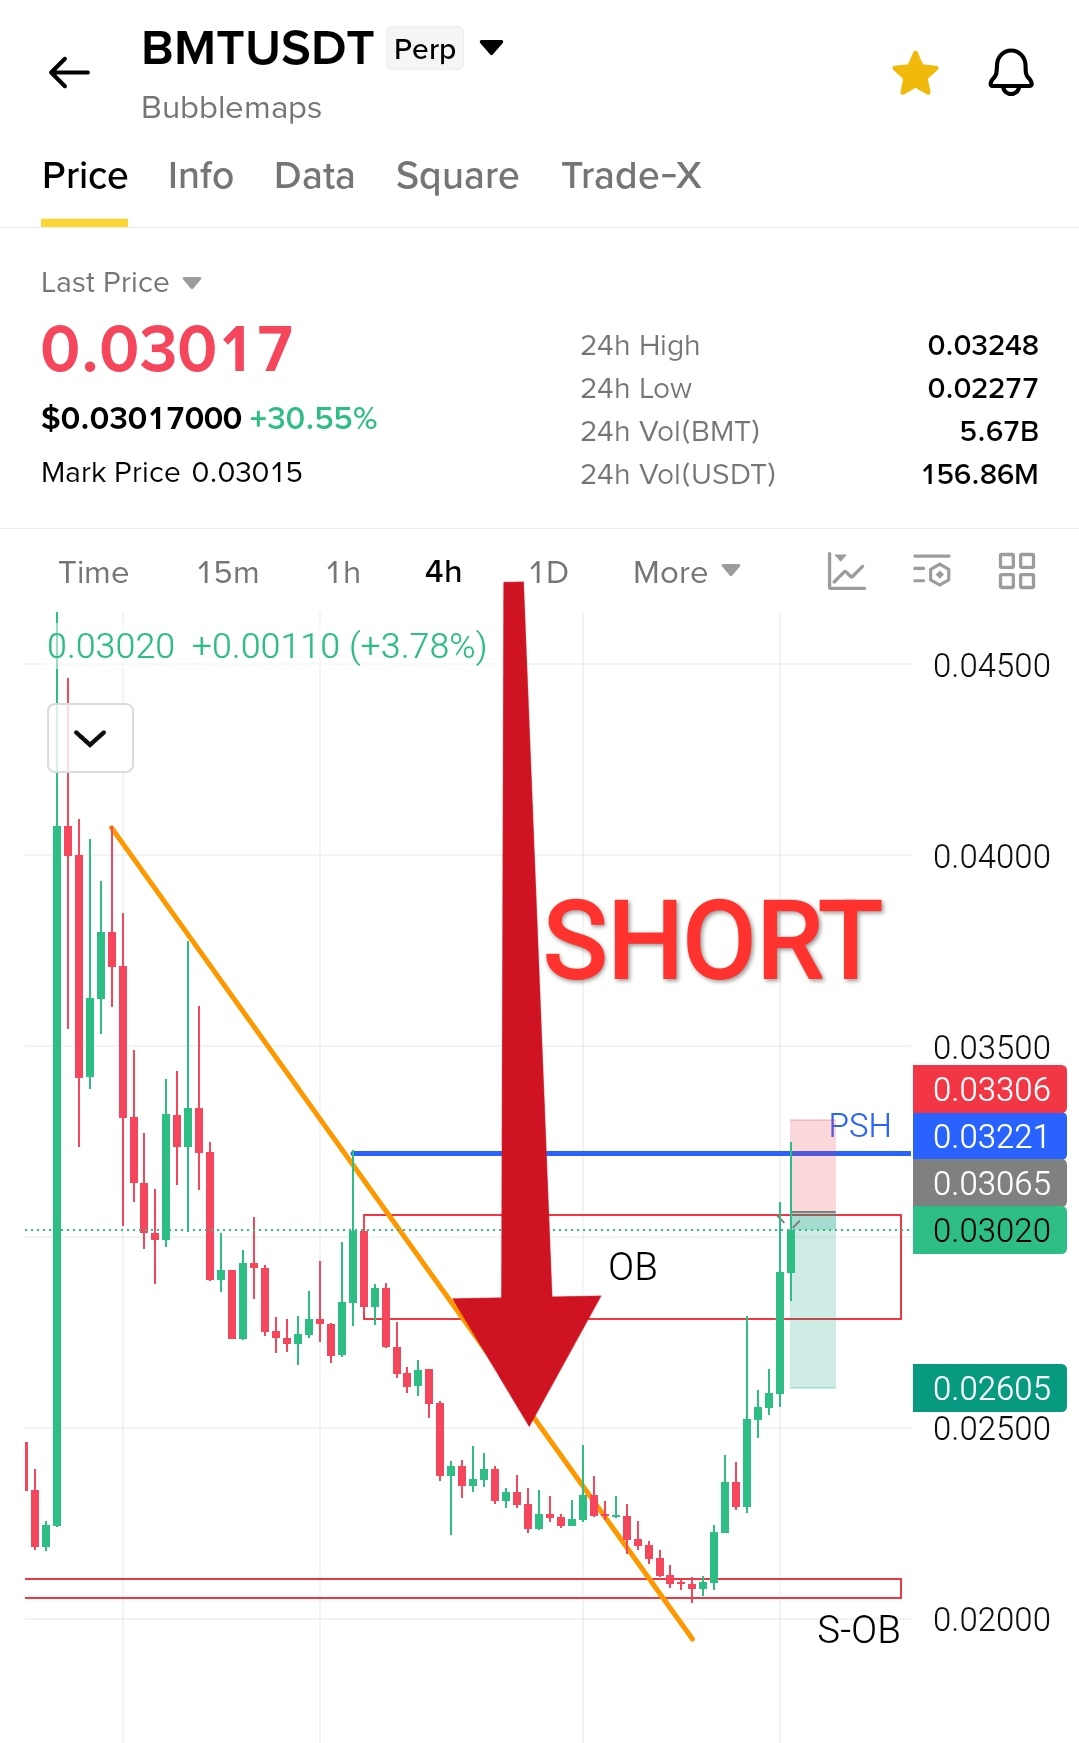
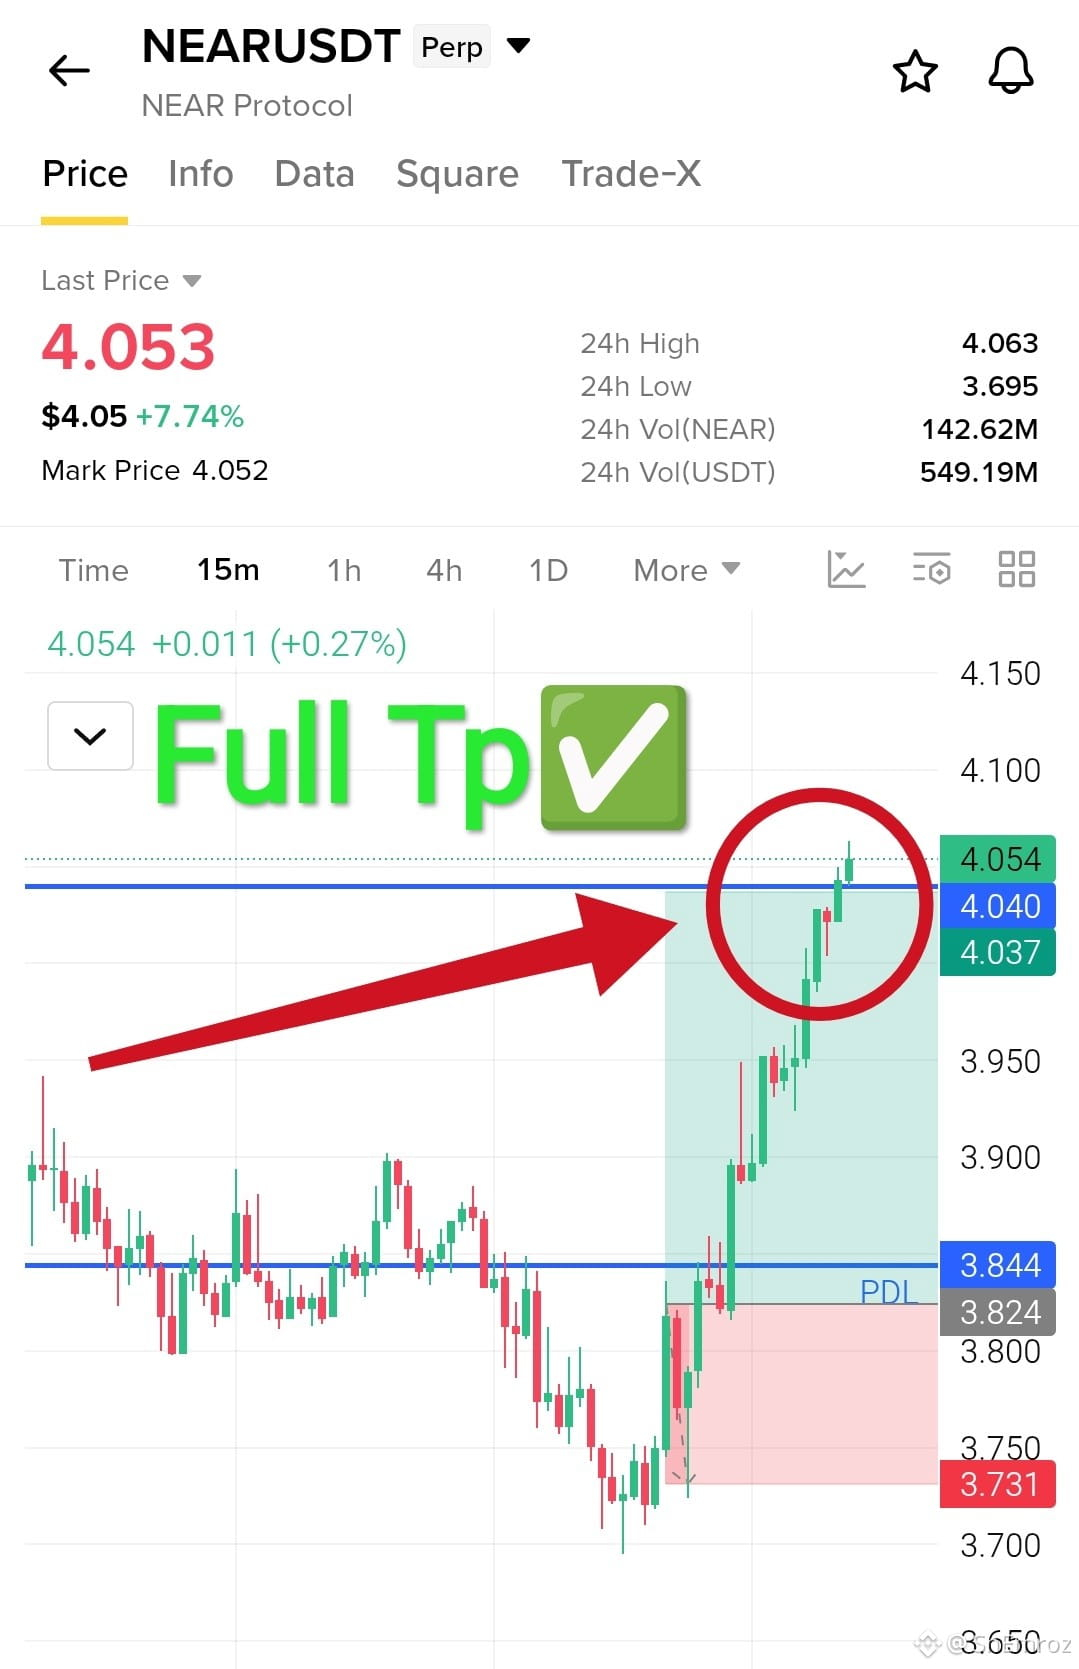
Price broke the falling trendline and bounced hard from the S-OB support near 0.0205, up about 45%. It is now pushing into the OB zone where sellers acted before. The latest wick swept above the PSH at 0.0322 and got rejected, which looks like a liquidity grab. The move is stretched after a 30% pump today. If price stays under 0.0322, a drop toward 0.0290 and then 0.0275 is likely. A 4h close above 0.0331 breaks the setup.

🔴Short Entry 0.03020


✅ Take Profits

TP1 0.02900
TP2 0.02750
TP3 0.02605

❌ Stop Loss 0.03306

#bmt
🔴🔴🔴🔴 Anyone here to Challenge? 🔴🔴🔴🔴
SnEmroz
·
--
බෙයාරිෂ්
$BMT Short Setup 4h Chart🔴

🔶 Order Block rejection at PSH

Price broke the falling trendline and bounced hard from the S-OB support near 0.0205, up about 45%. It is now pushing into the OB zone where sellers acted before. The latest wick swept above the PSH at 0.0322 and got rejected, which looks like a liquidity grab. The move is stretched after a 30% pump today. If price stays under 0.0322, a drop toward 0.0290 and then 0.0275 is likely. A 4h close above 0.0331 breaks the setup.

🔴Short Entry 0.03020


✅ Take Profits

TP1 0.02900
TP2 0.02750
TP3 0.02605

❌ Stop Loss 0.03306

#bmt
·
--
උසබ තත්ත්වය
SnEmroz
·
--
උසබ තත්ත්වය
$NEAR Long Setup 🟢

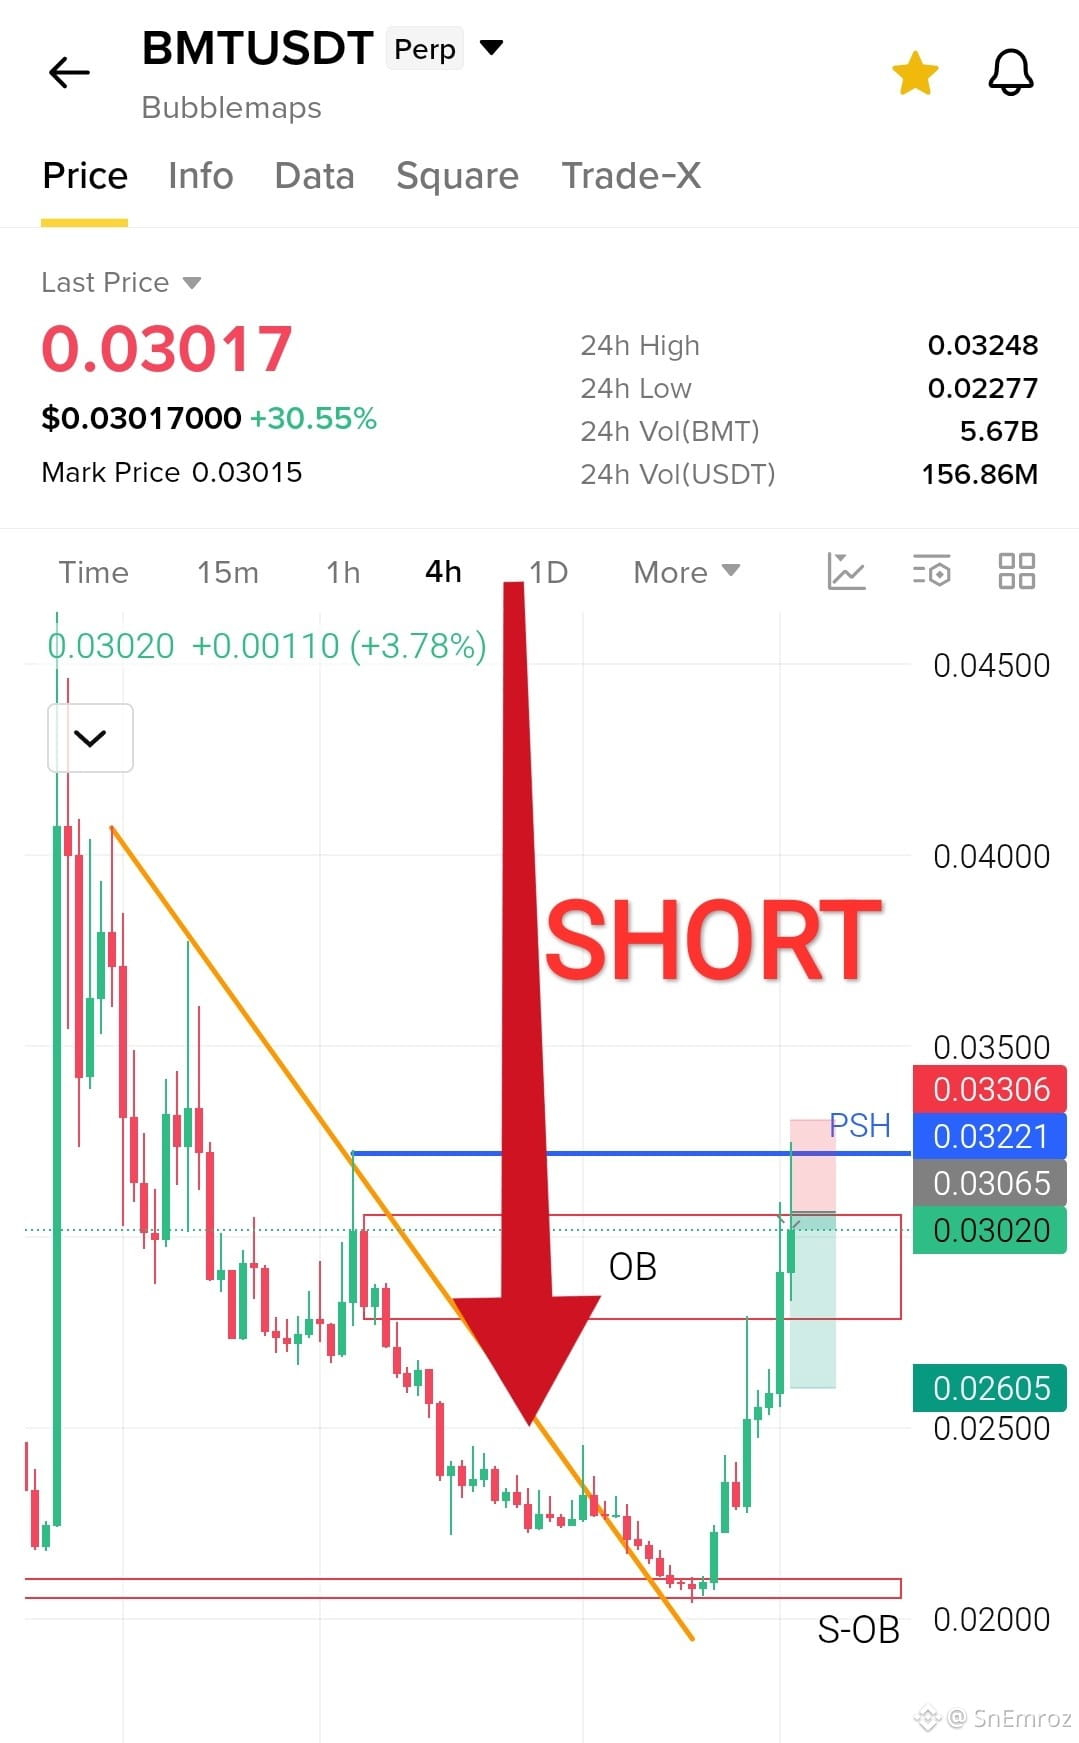
🔶 PDL Support Reclaim

Price swept below the previous day low and recovered around the $3.827–$3.844 support zone. Buyers are attempting to defend this area after the sharp decline. If support holds and bullish momentum builds, a recovery toward $4.040 is possible.

🟢 Long Entry 3.827


✅ Take Profits

TP1 3.900
TP2 3.970
TP3 4.040

❌ Stop Loss 3.734

#NEAR
·
--
බෙයාරිෂ්
$BMT Short Setup 4h Chart🔴 🔶 Order Block rejection at PSH Price broke the falling trendline and bounced hard from the S-OB support near 0.0205, up about 45%. It is now pushing into the OB zone where sellers acted before. The latest wick swept above the PSH at 0.0322 and got rejected, which looks like a liquidity grab. The move is stretched after a 30% pump today. If price stays under 0.0322, a drop toward 0.0290 and then 0.0275 is likely. A 4h close above 0.0331 breaks the setup. 🔴Short Entry 0.03020 {future}(BMTUSDT) ✅ Take Profits TP1 0.02900 TP2 0.02750 TP3 0.02605 ❌ Stop Loss 0.03306 #bmt
$BMT Short Setup 4h Chart🔴

🔶 Order Block rejection at PSH

Price broke the falling trendline and bounced hard from the S-OB support near 0.0205, up about 45%. It is now pushing into the OB zone where sellers acted before. The latest wick swept above the PSH at 0.0322 and got rejected, which looks like a liquidity grab. The move is stretched after a 30% pump today. If price stays under 0.0322, a drop toward 0.0290 and then 0.0275 is likely. A 4h close above 0.0331 breaks the setup.

🔴Short Entry 0.03020


✅ Take Profits

TP1 0.02900
TP2 0.02750
TP3 0.02605

❌ Stop Loss 0.03306

#bmt
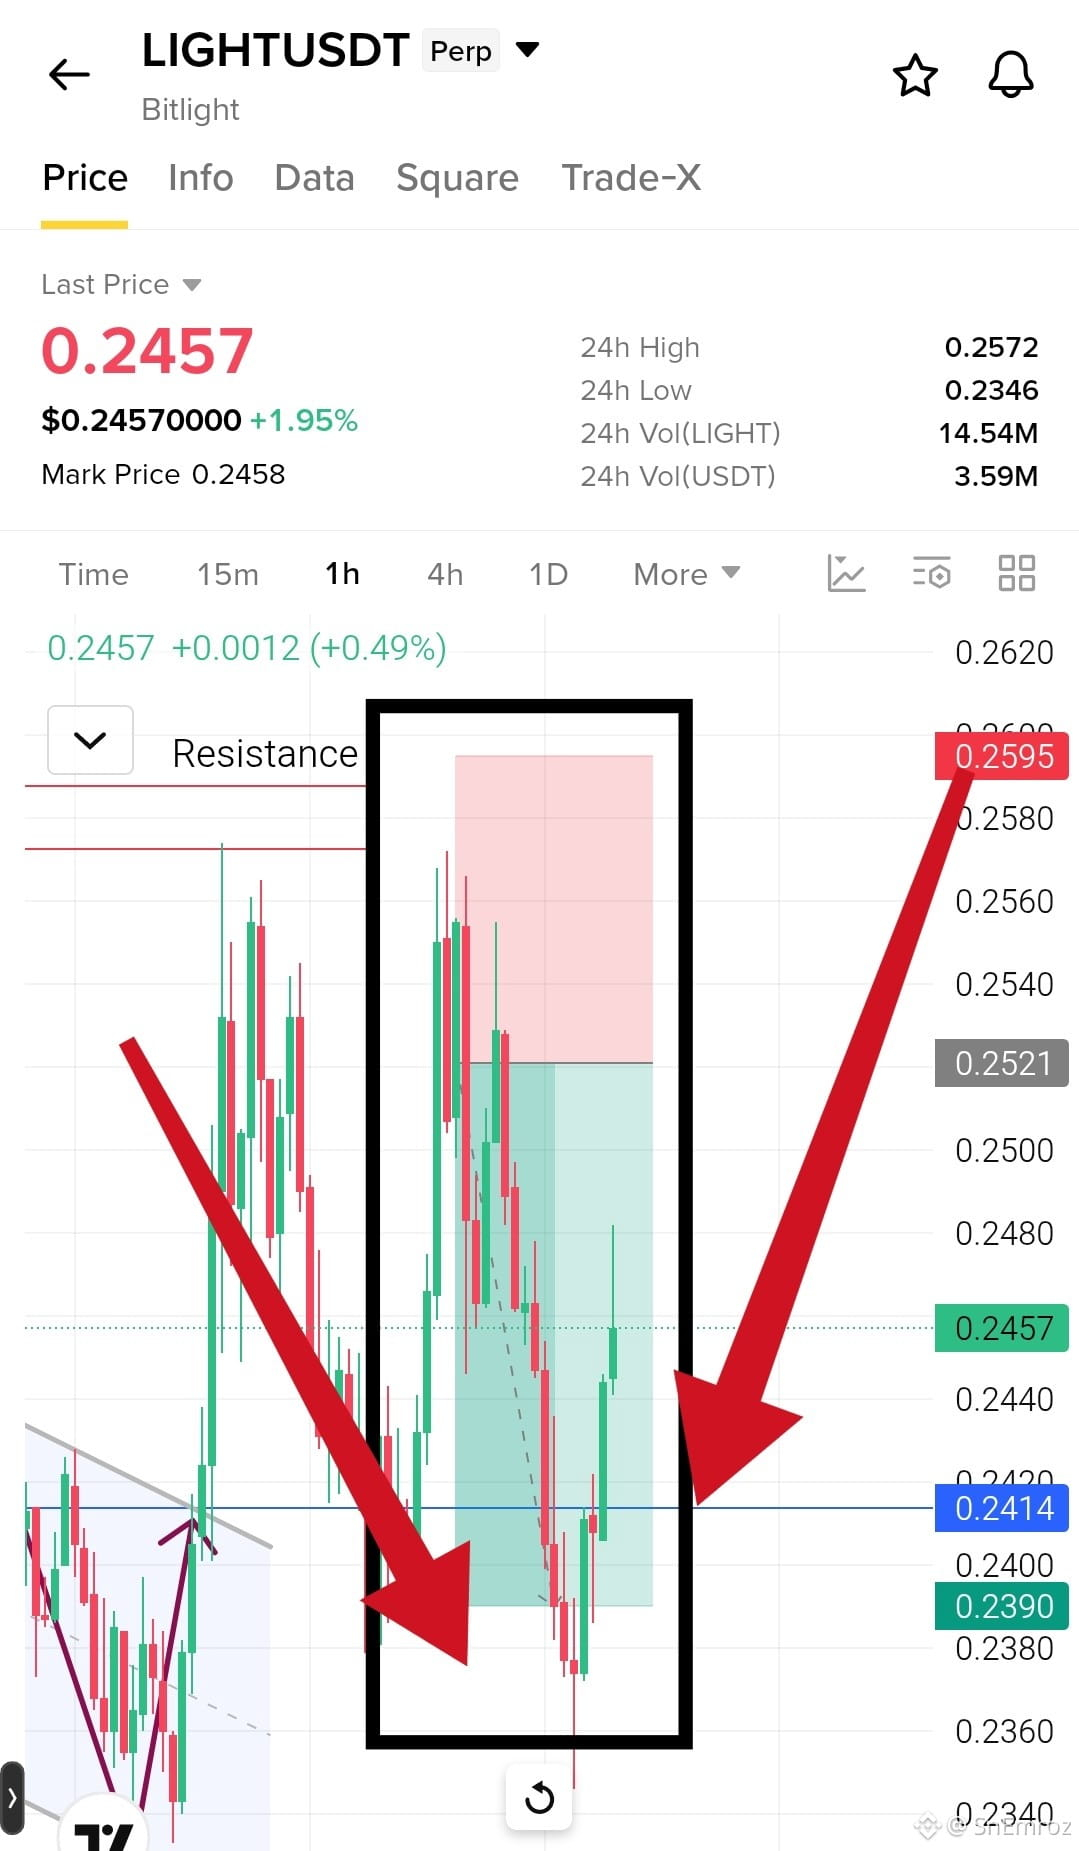
$LIGHT Full TP Hitted ✅ Our bearish scenario played out as expected. All three targets have been hit. LIGHT was rejected at the resistance zone near $0.2574 and sellers pushed the price down through $0.2470 and $0.2414, then to $0.2390. The breakdown confirmed the weakness we were watching in the previous setup. {future}(LIGHTUSDT) That is about a 5% move from our entry at $0.2517. The trade is now complete. Stay patient and wait for the next clean setup.
$LIGHT Full TP Hitted ✅

Our bearish scenario played out as expected. All three targets have been hit.

LIGHT was rejected at the resistance zone near $0.2574 and sellers pushed the price down through $0.2470 and $0.2414, then to $0.2390. The breakdown confirmed the weakness we were watching in the previous setup.


That is about a 5% move from our entry at $0.2517.

The trade is now complete. Stay patient and wait for the next clean setup.
SnEmroz
·
--
බෙයාරිෂ්
$LIGHT Short Setup 1h Chart🔴

🔶 Double Top M pattern

Price made two tops near 0.2574 at the resistance zone and both got rejected. The last push up to the same area left a red candle and sellers took control again. The bounce today is weak and price is up only 2% under resistance. If price stays under 0.2570 a drop toward the 0.2414 support line is likely. A close under 0.2414 confirms the pattern and opens the way to 0.2390.

🔴Short Entry 0.2517


✅ Take Profits

TP1 0.2470
TP2 0.2414
TP3 0.2390

❌ Stop Loss 0.2595

#light
තවත් අන්තර්ගතයන් ගවේෂණය කිරීමට ඇතුල් වන්න
Binance චතුරශ්‍රය හි ගෝලීය ක්‍රිප්ටෝ පරිශීලකයින් හා එක්වන්න
⚡️ ක්‍රිප්ටෝ පිළිබඳ නවතම සහ ප්‍රයෝජනවත් තොරතුරු ලබා ගන්න.
💬 ලොව විශාලතම ක්‍රිප්ටෝ හුවමාරුව මගින් විශ්වාස කෙරේ.
👍 සත්‍යායනය කරන ලද නිර්මාණකරුවන්ගෙන් සැබෑ විදසුන් සොයා ගන්න.
විද්‍යුත් තැපෑල / දුරකථන අංකය
අඩවි සිතියම
කුකී මනාපයන්
වේදිකා කොන්දේසි සහ නියමයන්