$NVDAB : Why Massive Volume Sometimes Produces Almost Zero Price Progress
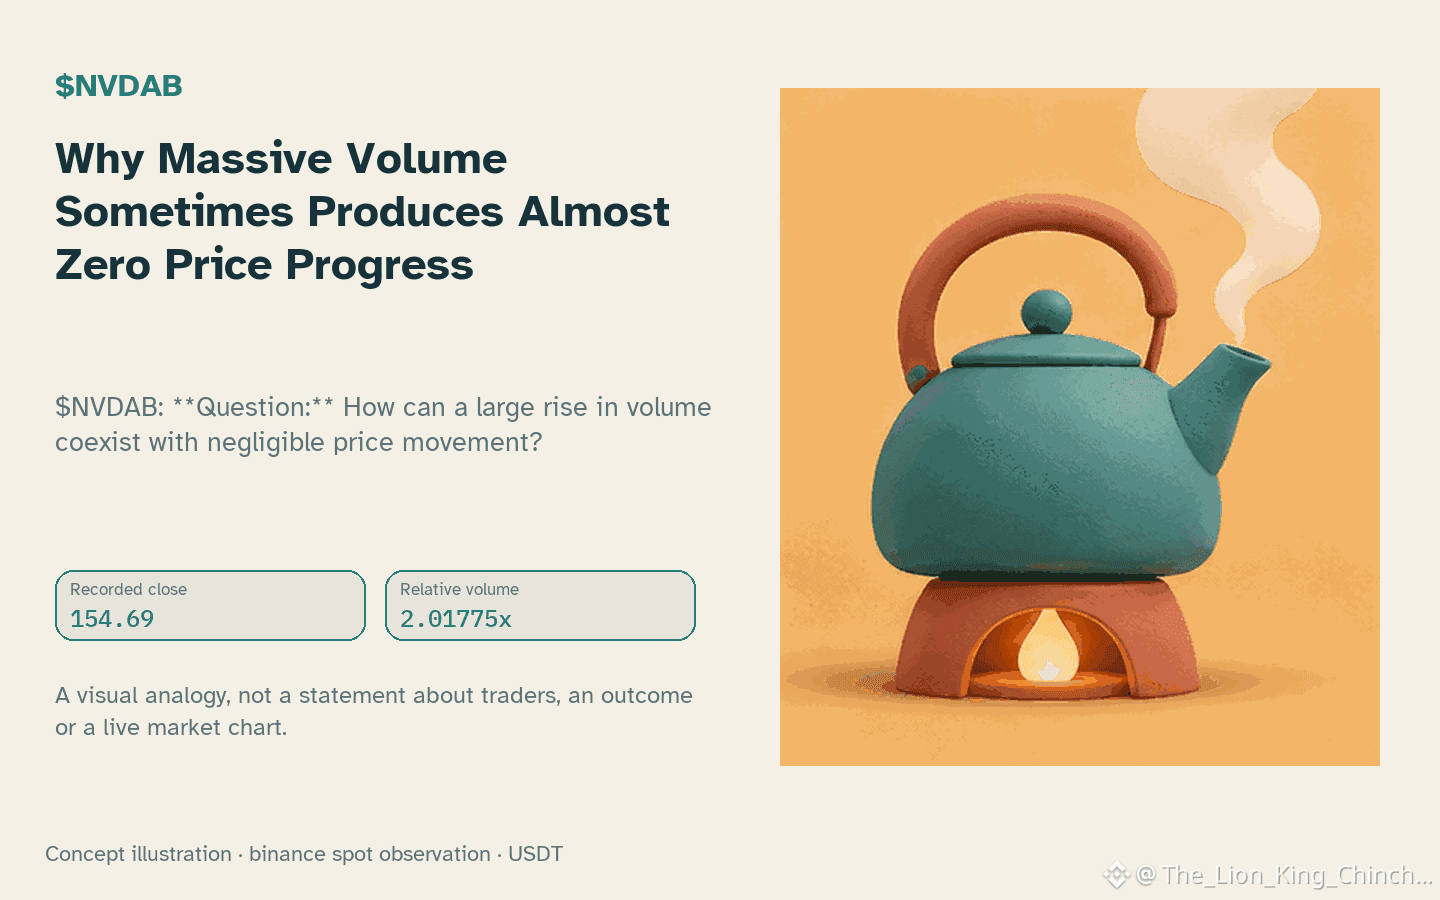
$NVDAB : **Question:** How can a large rise in volume coexist with negligible price movement?
The observation shows $NVDAB moving up hourly inside its recorded range while volume is 2.02x baseline. A common myth assumes higher volume forces a breakout. That view misses the mechanism of *absorption*.
When many market participants sell at the same price, the order book’s depth at that level can absorb the extra volume. Buyers do not move the price enough to break resistance because each new order is matched by a counter‑order at the same level. The net result is a flat or slightly higher price but a high volume figure.
This hypothesis fits the data: the price is still below resistance, the relative volume is elevated, and the RSI is 67.6 indicating neither strong bullish nor bearish momentum. If a future candle shows a price move beyond resistance with a similar volume spike, the absorption explanation would weaken.
**Reassessment cue:** Monitor whether the next hourly candle closes above resistance while volume stays above baseline. If not, the absorption narrative remains plausible.
Probabilistic market research, not a recommendation or guaranteed return.
The comparison to keep in mind: $MMT has hourly direction up and volume not above its baseline; $SOXLB has hourly direction up and volume not above its baseline. This alone does not establish correlation.
#NVDAB #MMT
$NVDAB : **Question:** How can a large rise in volume coexist with negligible price movement?
The observation shows $NVDAB moving up hourly inside its recorded range while volume is 2.02x baseline. A common myth assumes higher volume forces a breakout. That view misses the mechanism of *absorption*.
When many market participants sell at the same price, the order book’s depth at that level can absorb the extra volume. Buyers do not move the price enough to break resistance because each new order is matched by a counter‑order at the same level. The net result is a flat or slightly higher price but a high volume figure.
This hypothesis fits the data: the price is still below resistance, the relative volume is elevated, and the RSI is 67.6 indicating neither strong bullish nor bearish momentum. If a future candle shows a price move beyond resistance with a similar volume spike, the absorption explanation would weaken.
**Reassessment cue:** Monitor whether the next hourly candle closes above resistance while volume stays above baseline. If not, the absorption narrative remains plausible.
Probabilistic market research, not a recommendation or guaranteed return.
The comparison to keep in mind: $MMT has hourly direction up and volume not above its baseline; $SOXLB has hourly direction up and volume not above its baseline. This alone does not establish correlation.
#NVDAB #MMT