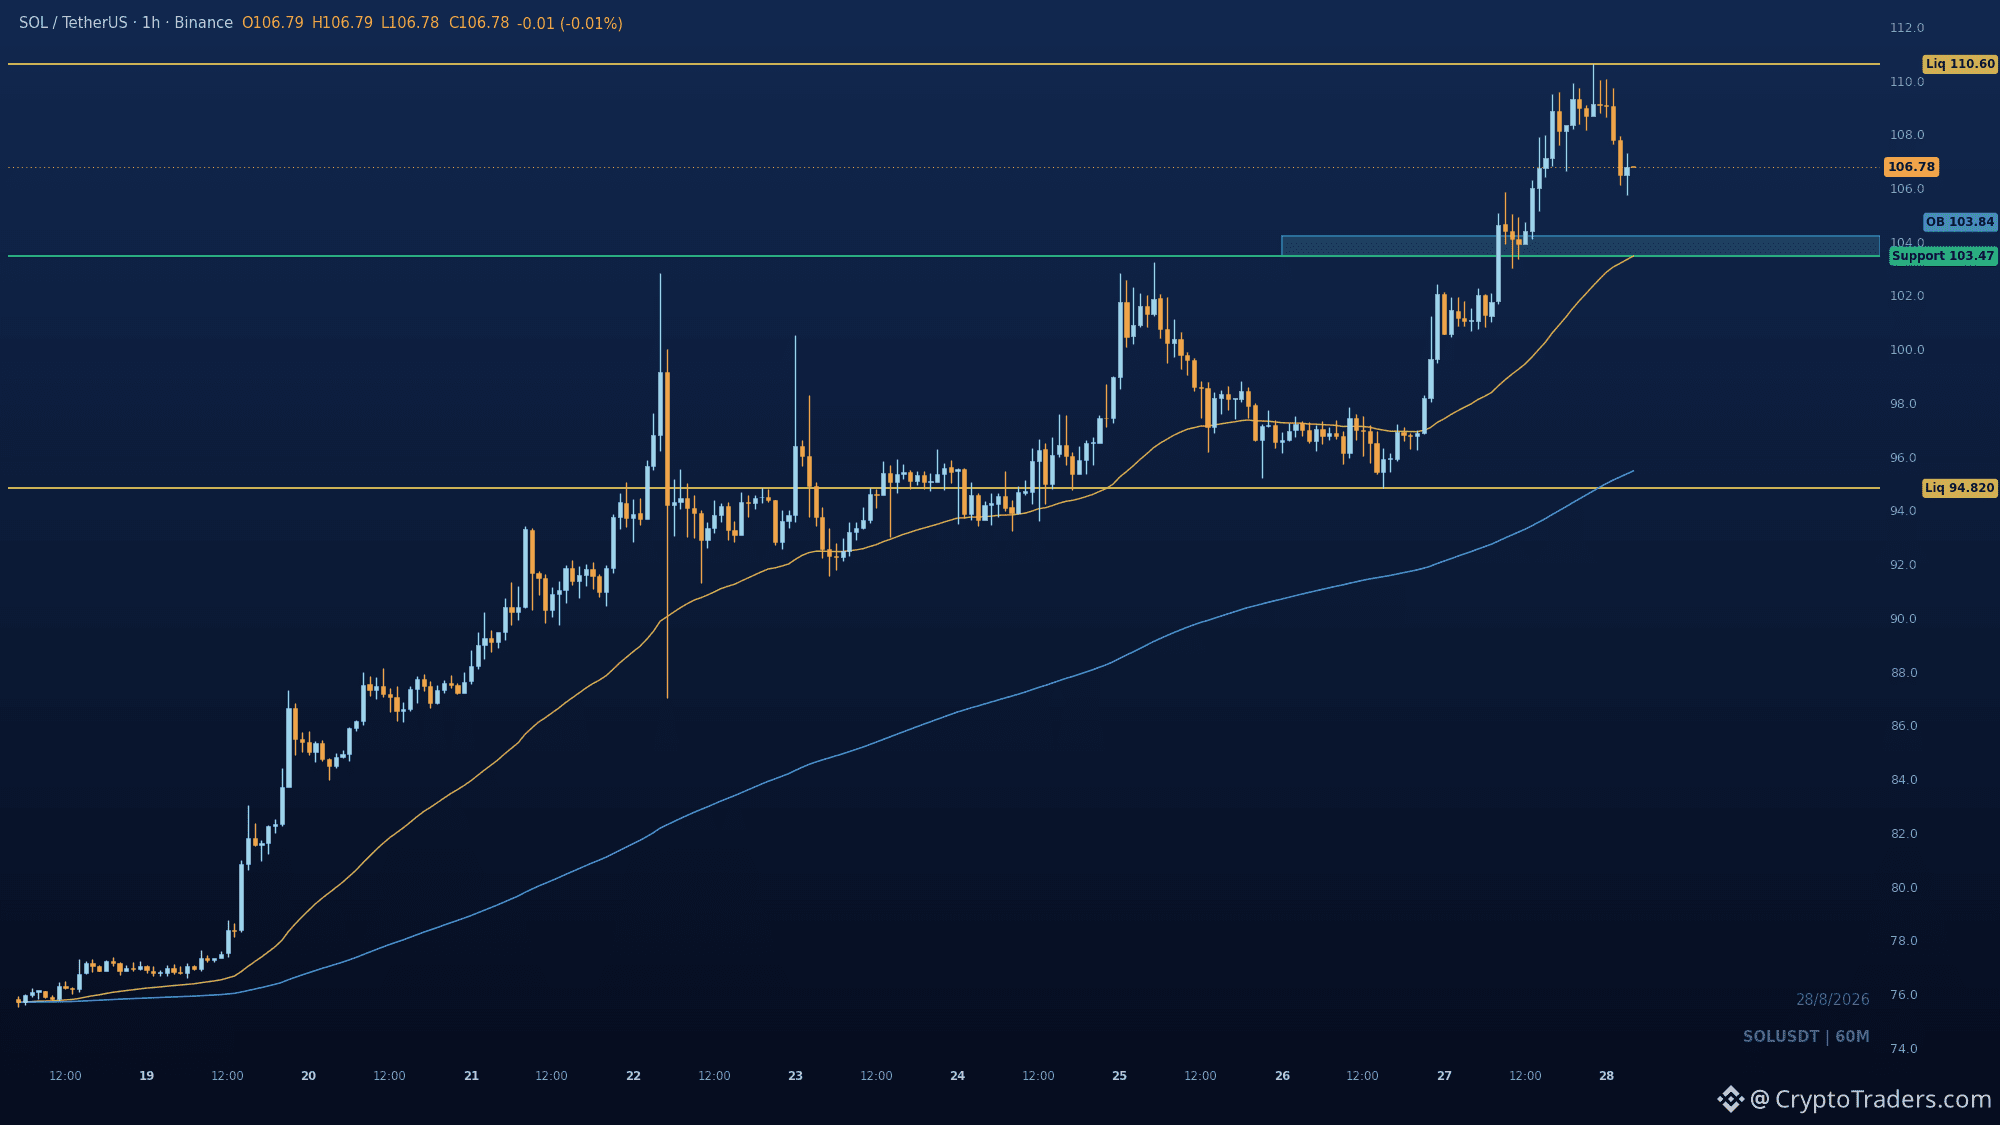
Solana is the clear outperformer today, with $SOL up 5.7% in 24 hours and roughly 50% on the month, its strongest August since 2024. The move accelerated after reports that Charles Schwab, the 13 trillion dollar brokerage, will add Solana trading to its crypto platform in the coming months. That news landed alongside a vote on cutting Solana's issuance and burning more SOL, which traders read as a potential supply squeeze. ETF flows also contributed: on-chain trackers noted that 67% of the 98 million in net inflows arrived after a 25.6% surge in SOL, suggesting institutional bids are supporting the rally. The hourly chart tells a clean story. The bullish structure is intact, with a fresh break of structure into 110.6 and price now holding premium after rejecting from the range high. The pullback is likely to find bids at the order block between 104.2 and 103.47, which sits right on the 50EMA dynamic support. As long as that zone holds, the path of least resistance is another raid of the buy-side liquidity at 110.6. A daily close above that level would confirm continuation. Invalidation sits at 103.47; a break below would flip the structure bearish and open the door to the sell-side liquidity near 94.82. A few things to watch: whether the 104.2 to 103.47 demand zone holds on the first test, if buyers can defend the 50EMA, and whether ETF inflows stay positive. A break and close above 110.6 would signal the next leg up; a loss of 103.47 would invalidate the bullish setup. Can Solana hold that breakout zone and finally clear the 110.6 liquidity, or is this another fakeout from the range? These charts are part of the daily desk brief in the group, and my bio has the details. #Altcoin Season# #Macro Insights#

පෝස්ටුව