
#tradertools
tradertools
102 views
6 සාකච්ඡා කරමින්
උණුසුම්
නවතම

·
--
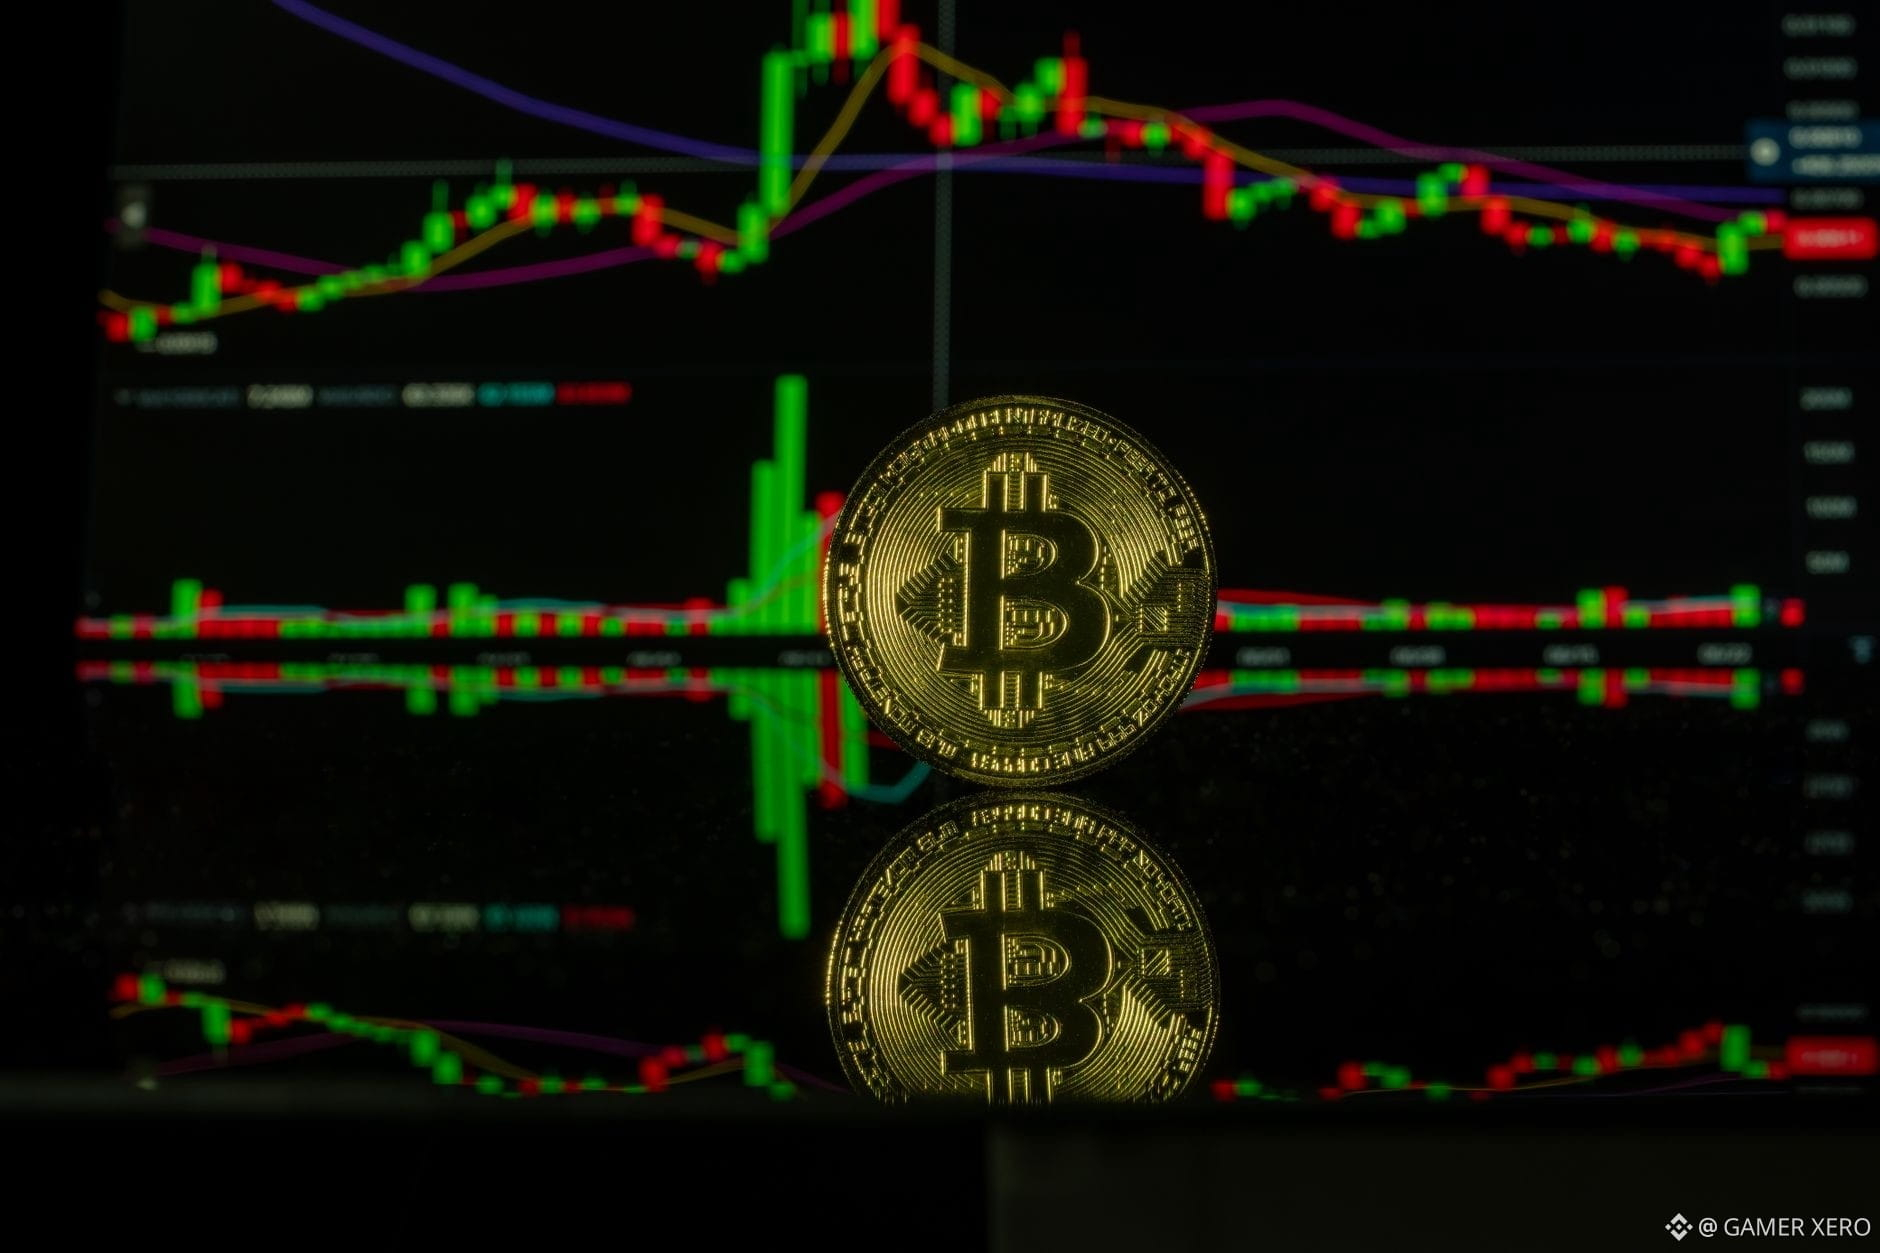
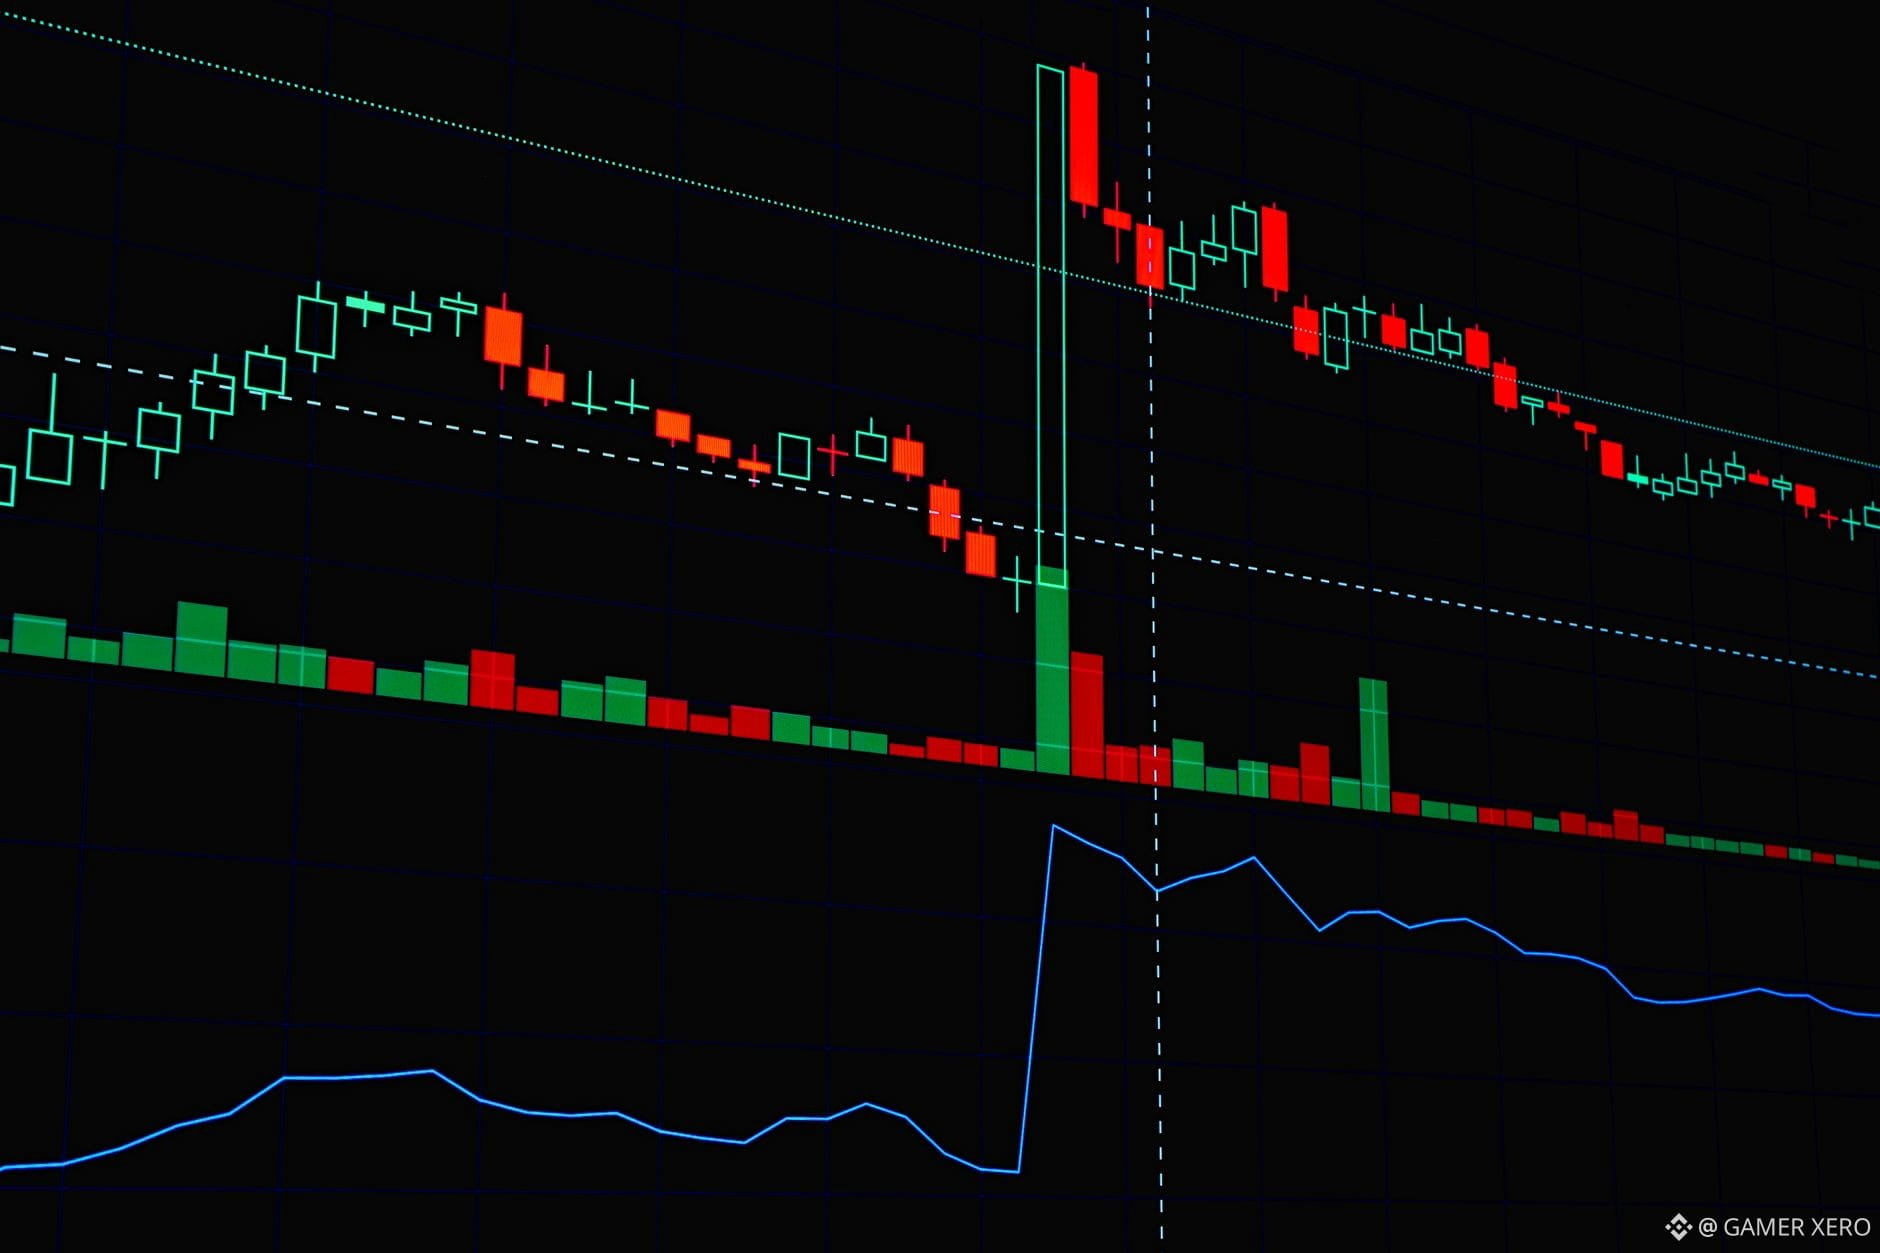
Binance හි $64,204 දී $BTC at සලකන විටත්, පැය 24ක් පරාසය $63,806‑$64,929 ලෙස පෙන්වෙද්දීත්, ඒක මිල දිශාව පමණක් ගැන නොවෙයි. ස්ථානීය යුගලයේ (spot pair) order-book depth බලන්න: වත්මන් මිලට ටිකක් පහළින් ඇති limit buy නියෝගවල මුළු ප්රමාණය, ටිකක් tick කිහිපයක් ඉහළින් ඇති sell wall එකට සාපේක්ෂව. buy පැත්ත තබාගෙන ඉන්නවා නම්—උදාහරණයක් ලෙස $64,150‑$64,200 අතර 150 BTCක් සහ නිකටම ඇති sell wall එක $64,300 හි 80 BTCක්—එවිට වෙළඳපොළ buying pressure පැත්තට නැඹුරු වී තිබෙන බවයි. මෙම අසමතුලිතතාවය බොහෝවිට මිල වත්මන් මට්ටමට ආසන්නව තදින් රැඳී සිටීමට හේතු වෙයි; එමඟින් අඩු පැත්ත (downside) සීමා වන අතර ඉහළ පැත්ත (upside) සඳහා මධ්යම මට්ටමක සීමාවක් තබයි.
එමම මූලධර්මය $ETH at $1,887 සඳහාත් අදාළයි. depth එකේ $1,880‑$1,885 අතර 200 ETH කණ්ඩායමක් තිබෙන අතර, $1,900 වටා 90 ETH කැබැල්ලක් ලෙස sell පැත්ත තරමක් සිහින්. විකුණන්නන් අවශෝෂණය කරගන්න සූදානම් liquidity වැඩි නිසා, මිල බොහෝවිට තදින් පරාසයක රැඳී සිටීමට නැඹුරු වනවා—ඒකම මෑතකාලීන 1.12 % ක පහත වැටීමත් නමුත් ස්ථාවර පරාසයක් තිබෙන බවට ගැලපේ.
පැයකට වරක් මෙම depth snapshot ටික නිරීක්ෂණය කිරීමෙන් imbalance එක හැරෙන වේලාව—එන breakout එකක් හෝ pullback එකක් සමීපව එන බවට මුල් සංඥාවක්—හඳුනාගන්න ඔබට උදව් විය හැක. ඔබ ඔබේ position size වෙනස් කිරීමට පෙර order‑book depth කොපමණ වාරයක් පරීක්ෂා කරනවාද?
#CryptoEducation #OrderBook #TraderTools #GAMERXERO
Binance හි $64,204 දී $BTC at සලකන විටත්, පැය 24ක් පරාසය $63,806‑$64,929 ලෙස පෙන්වෙද්දීත්, ඒක මිල දිශාව පමණක් ගැන නොවෙයි. ස්ථානීය යුගලයේ (spot pair) order-book depth බලන්න: වත්මන් මිලට ටිකක් පහළින් ඇති limit buy නියෝගවල මුළු ප්රමාණය, ටිකක් tick කිහිපයක් ඉහළින් ඇති sell wall එකට සාපේක්ෂව. buy පැත්ත තබාගෙන ඉන්නවා නම්—උදාහරණයක් ලෙස $64,150‑$64,200 අතර 150 BTCක් සහ නිකටම ඇති sell wall එක $64,300 හි 80 BTCක්—එවිට වෙළඳපොළ buying pressure පැත්තට නැඹුරු වී තිබෙන බවයි. මෙම අසමතුලිතතාවය බොහෝවිට මිල වත්මන් මට්ටමට ආසන්නව තදින් රැඳී සිටීමට හේතු වෙයි; එමඟින් අඩු පැත්ත (downside) සීමා වන අතර ඉහළ පැත්ත (upside) සඳහා මධ්යම මට්ටමක සීමාවක් තබයි.
එමම මූලධර්මය $ETH at $1,887 සඳහාත් අදාළයි. depth එකේ $1,880‑$1,885 අතර 200 ETH කණ්ඩායමක් තිබෙන අතර, $1,900 වටා 90 ETH කැබැල්ලක් ලෙස sell පැත්ත තරමක් සිහින්. විකුණන්නන් අවශෝෂණය කරගන්න සූදානම් liquidity වැඩි නිසා, මිල බොහෝවිට තදින් පරාසයක රැඳී සිටීමට නැඹුරු වනවා—ඒකම මෑතකාලීන 1.12 % ක පහත වැටීමත් නමුත් ස්ථාවර පරාසයක් තිබෙන බවට ගැලපේ.
පැයකට වරක් මෙම depth snapshot ටික නිරීක්ෂණය කිරීමෙන් imbalance එක හැරෙන වේලාව—එන breakout එකක් හෝ pullback එකක් සමීපව එන බවට මුල් සංඥාවක්—හඳුනාගන්න ඔබට උදව් විය හැක. ඔබ ඔබේ position size වෙනස් කිරීමට පෙර order‑book depth කොපමණ වාරයක් පරීක්ෂා කරනවාද?
#CryptoEducation #OrderBook #TraderTools #GAMERXERO
එමම මූලධර්මය $ETH at $1,887 සඳහාත් අදාළයි. depth එකේ $1,880‑$1,885 අතර 200 ETH කණ්ඩායමක් තිබෙන අතර, $1,900 වටා 90 ETH කැබැල්ලක් ලෙස sell පැත්ත තරමක් සිහින්. විකුණන්නන් අවශෝෂණය කරගන්න සූදානම් liquidity වැඩි නිසා, මිල බොහෝවිට තදින් පරාසයක රැඳී සිටීමට නැඹුරු වනවා—ඒකම මෑතකාලීන 1.12 % ක පහත වැටීමත් නමුත් ස්ථාවර පරාසයක් තිබෙන බවට ගැලපේ.
පැයකට වරක් මෙම depth snapshot ටික නිරීක්ෂණය කිරීමෙන් imbalance එක හැරෙන වේලාව—එන breakout එකක් හෝ pullback එකක් සමීපව එන බවට මුල් සංඥාවක්—හඳුනාගන්න ඔබට උදව් විය හැක. ඔබ ඔබේ position size වෙනස් කිරීමට පෙර order‑book depth කොපමණ වාරයක් පරීක්ෂා කරනවාද?
#CryptoEducation #OrderBook #TraderTools #GAMERXERO
12
·
--
පරිවර්තනය බලන්න
Watching the on‑chain “active addresses” metric can give you a quick sense of real‑world participation without staring at price charts. An active address is any wallet that sends or receives a transaction in a 24‑hour window, so spikes often line up with events that move people, not just price.
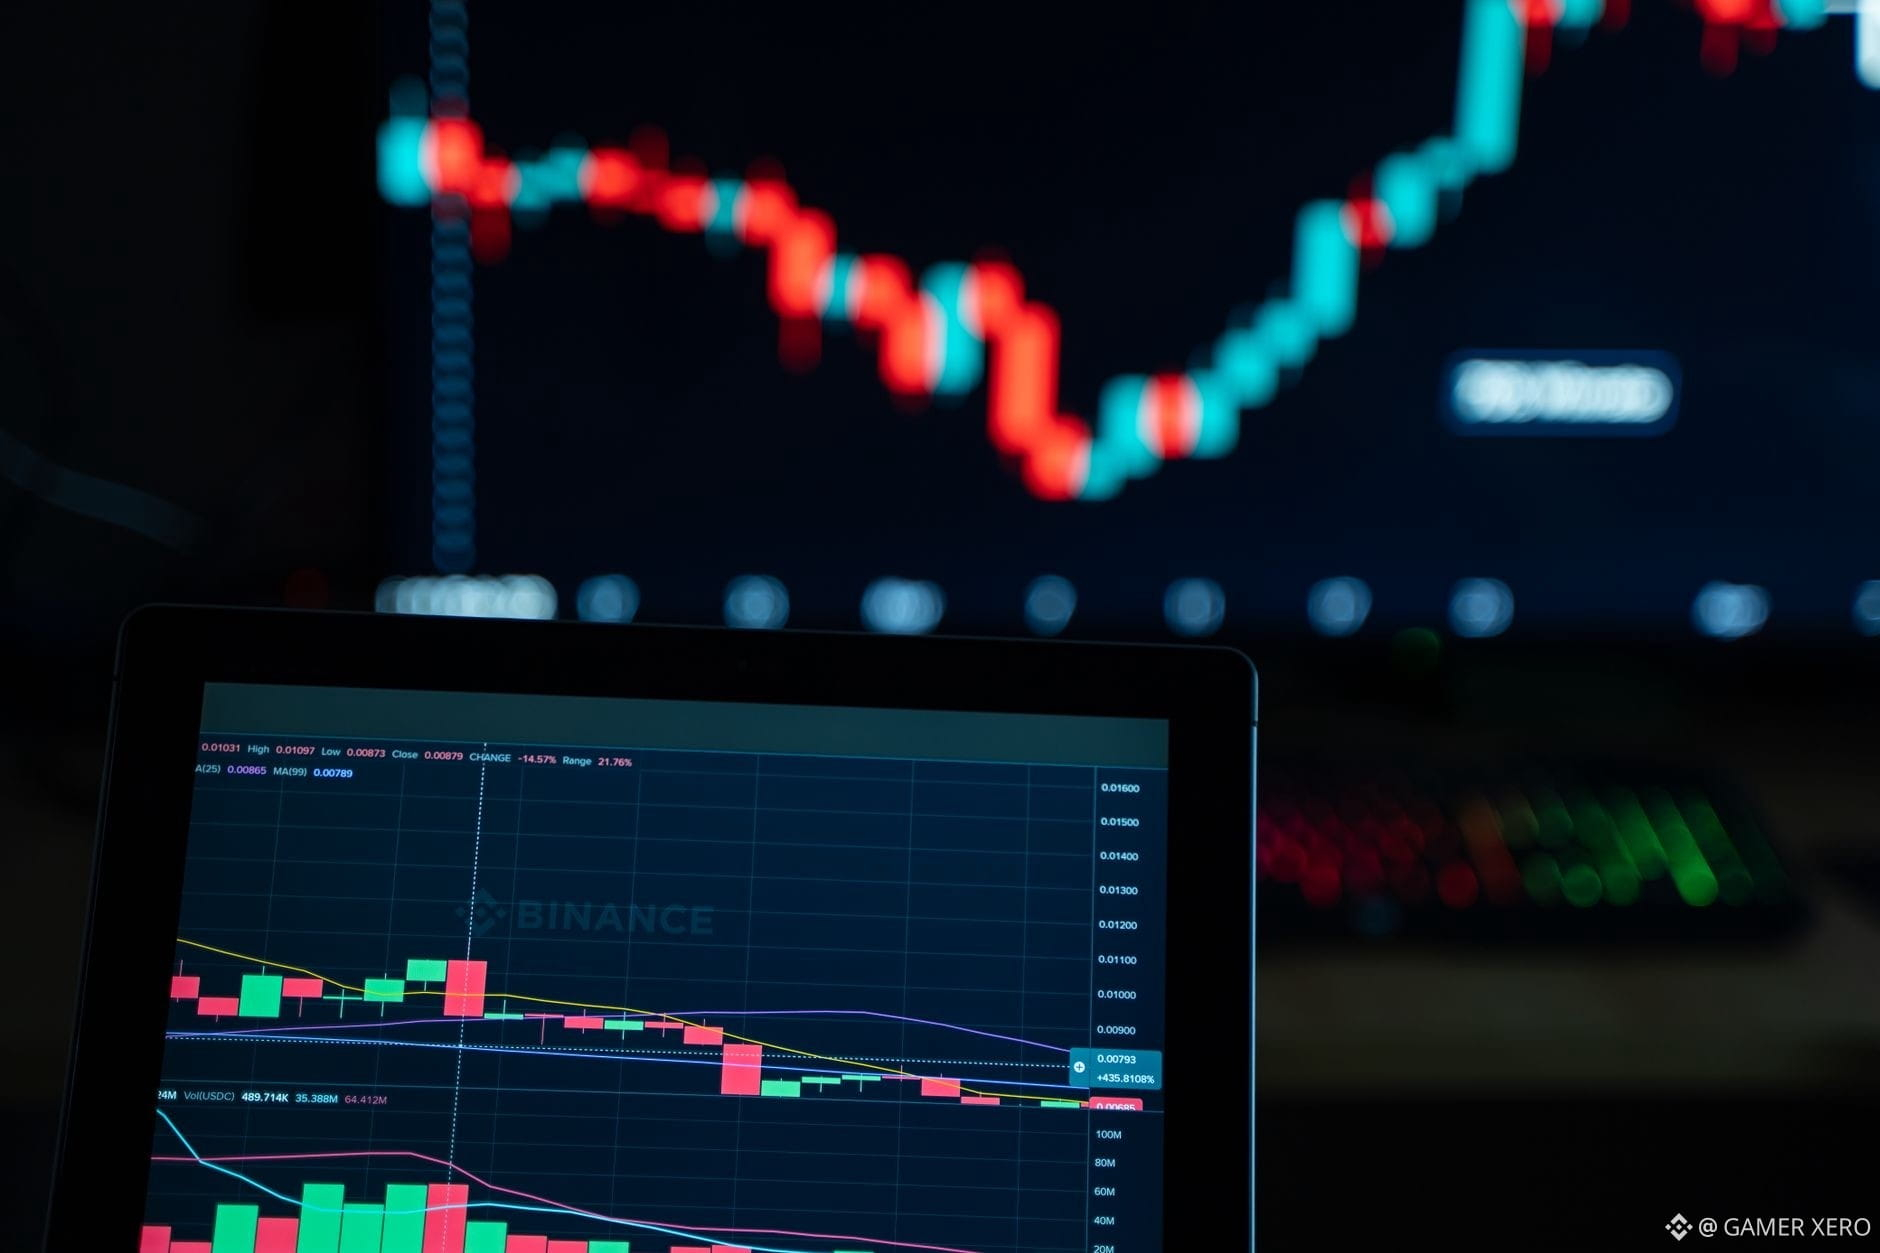
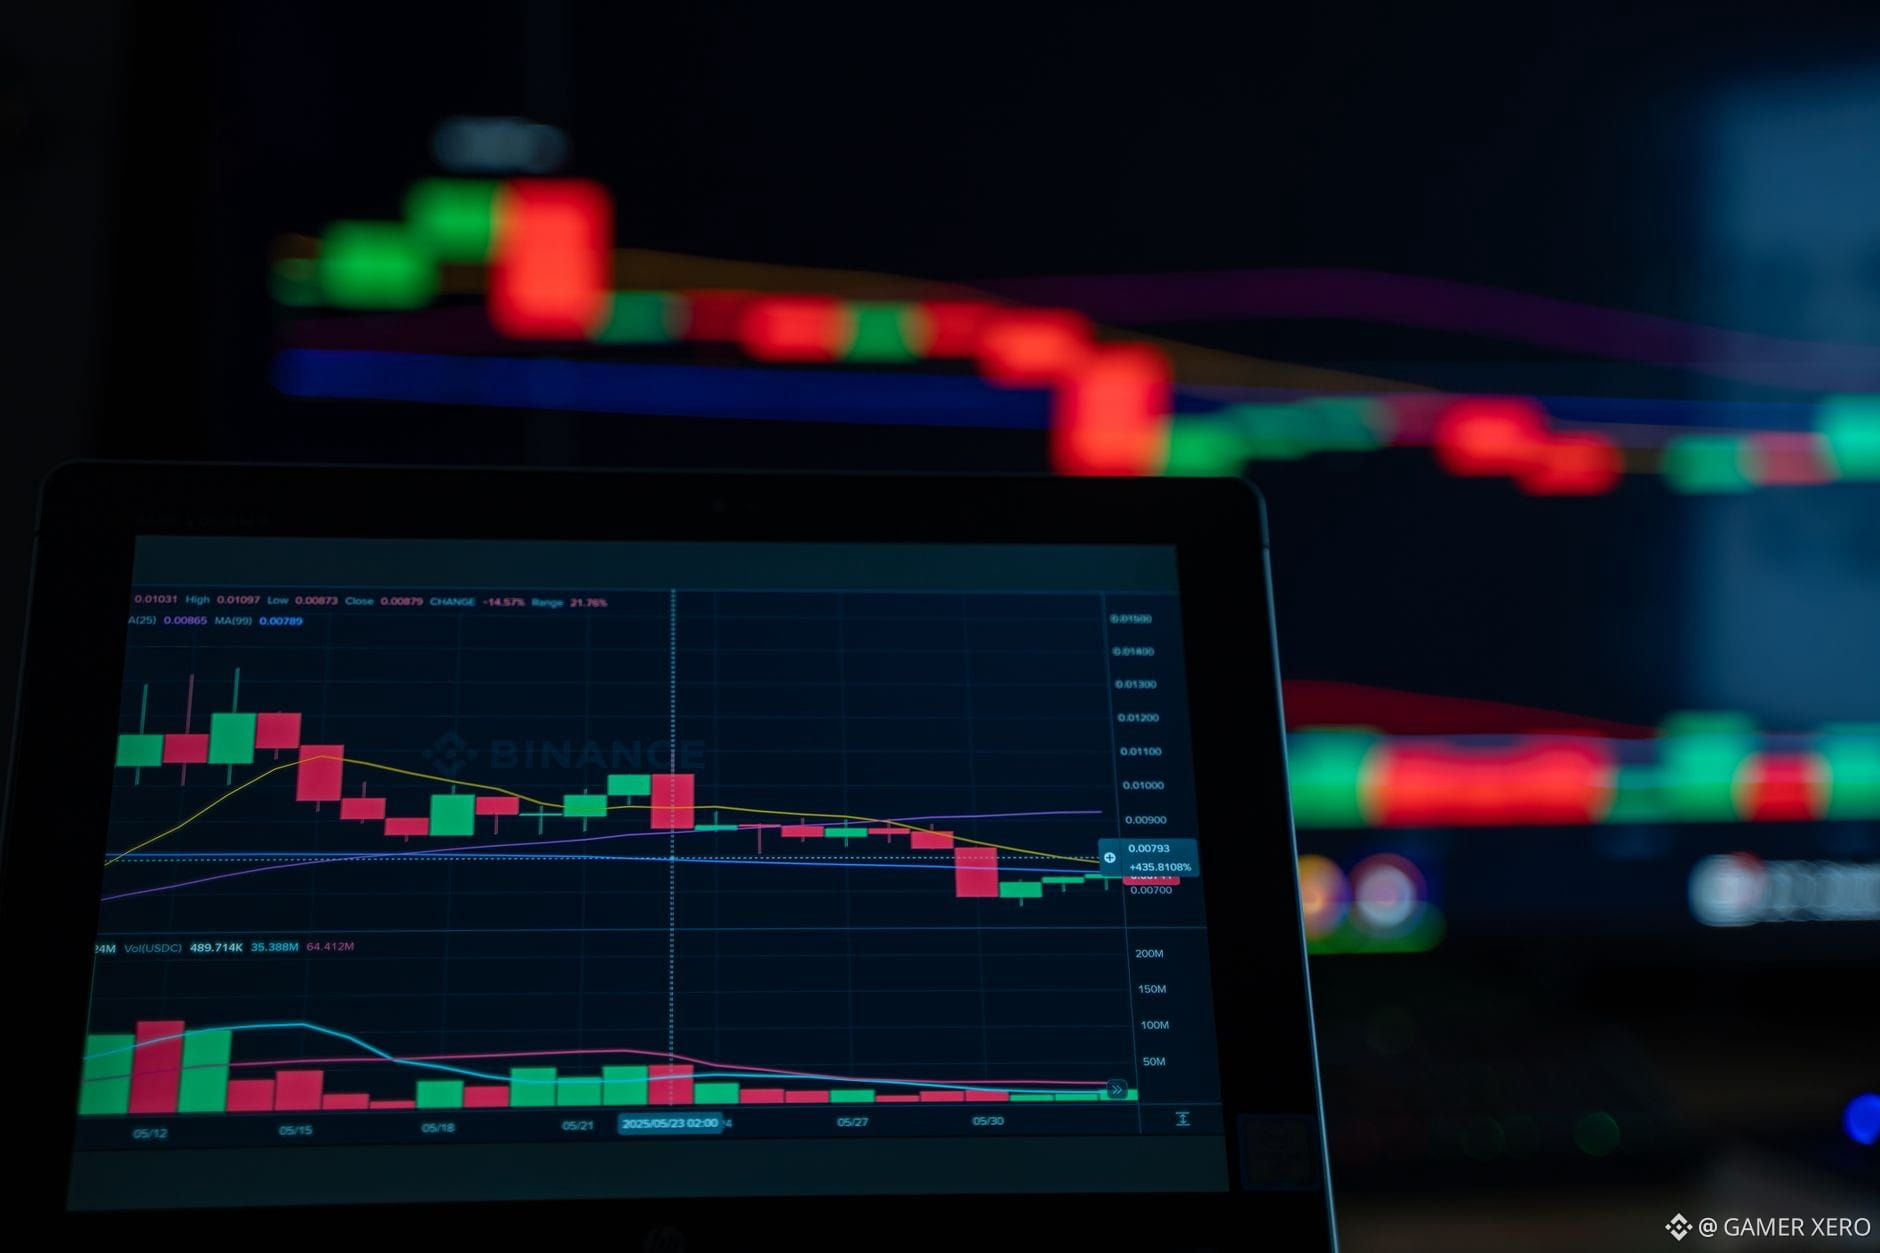
Take $BTC this morning: the network reported a modest rise in active addresses, echoing the 0.23 % price uptick around $64,032. While the move is small, the address count jumped by roughly 3 % versus the previous day, hinting that more users are transacting—perhaps reacting to news or adjusting positions.
Contrast that with $ETH, where the price held steady at $1,869.54, yet active addresses dipped slightly. A lower on‑chain participation rate can signal reduced demand for gas‑driven activity, even if the token price appears flat.
What on‑chain metric do you find most reliable for confirming a price move’s strength?
#CryptoMetrics #OnChainData #TraderTools #GAMERXERO
Watching the on‑chain “active addresses” metric can give you a quick sense of real‑world participation without staring at price charts. An active address is any wallet that sends or receives a transaction in a 24‑hour window, so spikes often line up with events that move people, not just price.
Take $BTC this morning: the network reported a modest rise in active addresses, echoing the 0.23 % price uptick around $64,032. While the move is small, the address count jumped by roughly 3 % versus the previous day, hinting that more users are transacting—perhaps reacting to news or adjusting positions.
Contrast that with $ETH , where the price held steady at $1,869.54, yet active addresses dipped slightly. A lower on‑chain participation rate can signal reduced demand for gas‑driven activity, even if the token price appears flat.
What on‑chain metric do you find most reliable for confirming a price move’s strength?
#CryptoMetrics #OnChainData #TraderTools #GAMERXERO
Take $BTC this morning: the network reported a modest rise in active addresses, echoing the 0.23 % price uptick around $64,032. While the move is small, the address count jumped by roughly 3 % versus the previous day, hinting that more users are transacting—perhaps reacting to news or adjusting positions.
Contrast that with $ETH , where the price held steady at $1,869.54, yet active addresses dipped slightly. A lower on‑chain participation rate can signal reduced demand for gas‑driven activity, even if the token price appears flat.
What on‑chain metric do you find most reliable for confirming a price move’s strength?
#CryptoMetrics #OnChainData #TraderTools #GAMERXERO
17
තවත් අන්තර්ගතයන් ගවේෂණය කිරීමට ඇතුල් වන්න
Binance චතුරශ්රය හි ගෝලීය ක්රිප්ටෝ පරිශීලකයින් හා එක්වන්න
⚡️ ක්රිප්ටෝ පිළිබඳ නවතම සහ ප්රයෝජනවත් තොරතුරු ලබා ගන්න.
💬 ලොව විශාලතම ක්රිප්ටෝ හුවමාරුව මගින් විශ්වාස කෙරේ.
👍 සත්යායනය කරන ලද නිර්මාණකරුවන්ගෙන් සැබෑ විදසුන් සොයා ගන්න.
විද්යුත් තැපෑල / දුරකථන අංකය
නැගී එන මාතෘකා
1
#BOJRaisesRatesTo31YearHigh
61,958 views
1,057 සාකච්ඡා කරමින්
2
#BuffettStepsDownAsBerkshireChairman
26,552 views
483 සාකච්ඡා කරමින්
3
#XRPExchangeReservesHitSevenYearLow
32,532 views
456 සාකච්ඡා කරමින්
4
#HKCompletesFirstHKDStablecoinUseCase
66,564 views
991 සාකච්ඡා කරමින්
5
#VietnamPlansFirstCryptoLicensesIn2026
44,314 views
679 සාකච්ඡා කරමින්
6
#BTCBreaks80K
346,745 views
4,405 සාකච්ඡා කරමින්
7
#比特币突破8万
155,017 views
495 සාකච්ඡා කරමින්
8
#BitcoinMarketCapTopsTesla
68,505 views
978 සාකච්ඡා කරමින්
9
#SOLJumpsAbout10%
77,477 views
981 සාකච්ඡා කරමින්
10
#EthereumReclaims$2600
7,111 views
110 සාකච්ඡා කරමින්