

#sp500
sp500
702,540 නැරඹීම්
2,329 සාකච්ඡා කරමින්
උණුසුම්
නවතම

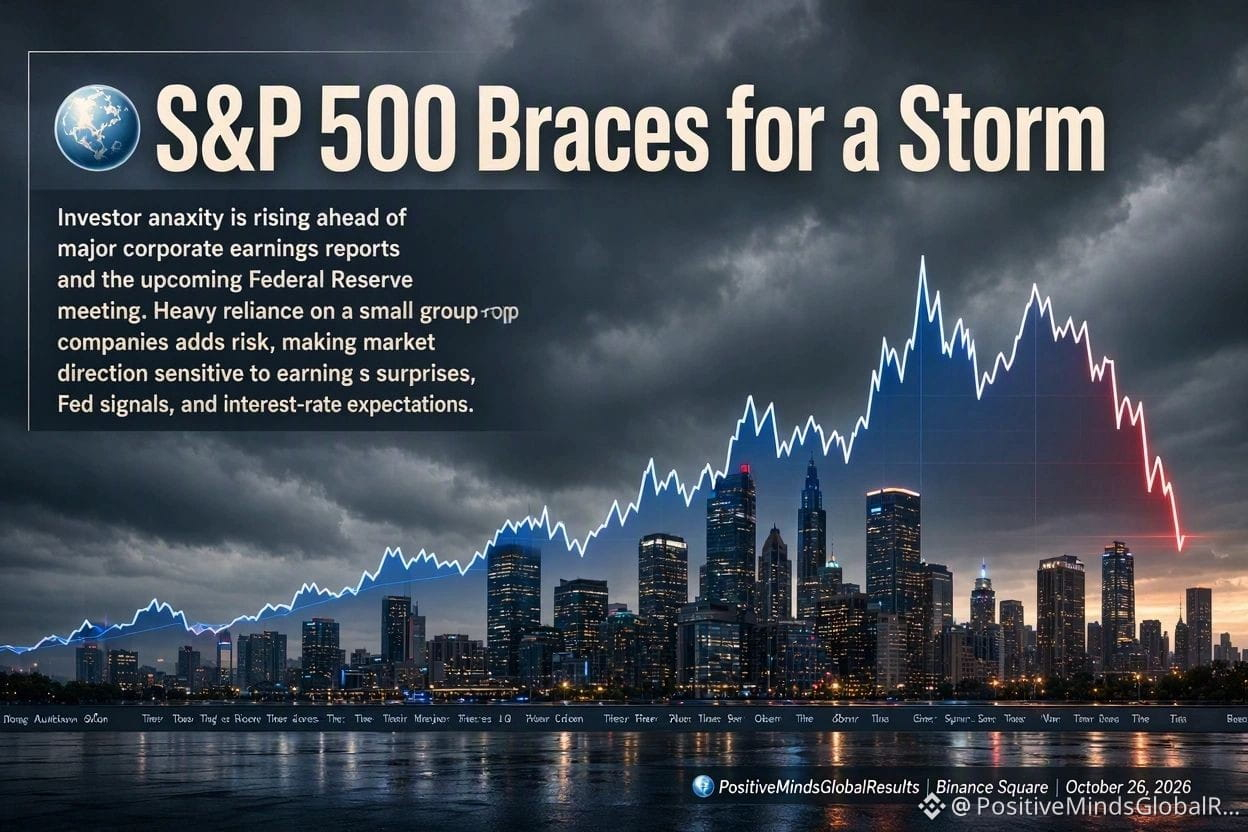
#binancepick 🌍 S&P 500 Braces for a Storm
Investor anxiety is rising ahead of major corporate earnings reports and the upcoming Federal Reserve meeting. Heavy reliance on a small group of mega-cap companies adds risk, making market direction sensitive to earnings surprises, Fed signals, and interest-rate expectations.
#SP500 #StockMarket #WallStreet #MarketVolatility #EarningsSeason #FederalReserve #FedMeeting #MegaCapStocks #GlobalMarkets #InvestorSentiment #EconomicOutlook #FinancialMarkets #PositiveMindsGlobalResults #BinanceSquare
🌍 PositiveMindsGlobalResults | Binance Square | October 26, 2026
{spot}(BNBUSDT)
#binancepick 🌍 S&P 500 Braces for a Storm
Investor anxiety is rising ahead of major corporate earnings reports and the upcoming Federal Reserve meeting. Heavy reliance on a small group of mega-cap companies adds risk, making market direction sensitive to earnings surprises, Fed signals, and interest-rate expectations.
#SP500 #StockMarket #WallStreet #MarketVolatility #EarningsSeason #FederalReserve #FedMeeting #MegaCapStocks #GlobalMarkets #InvestorSentiment #EconomicOutlook #FinancialMarkets #PositiveMindsGlobalResults #BinanceSquare
🌍 PositiveMindsGlobalResults | Binance Square | October 26, 2026
Investor anxiety is rising ahead of major corporate earnings reports and the upcoming Federal Reserve meeting. Heavy reliance on a small group of mega-cap companies adds risk, making market direction sensitive to earnings surprises, Fed signals, and interest-rate expectations.
#SP500 #StockMarket #WallStreet #MarketVolatility #EarningsSeason #FederalReserve #FedMeeting #MegaCapStocks #GlobalMarkets #InvestorSentiment #EconomicOutlook #FinancialMarkets #PositiveMindsGlobalResults #BinanceSquare
🌍 PositiveMindsGlobalResults | Binance Square | October 26, 2026
27

·
--
බෙයාරිෂ්
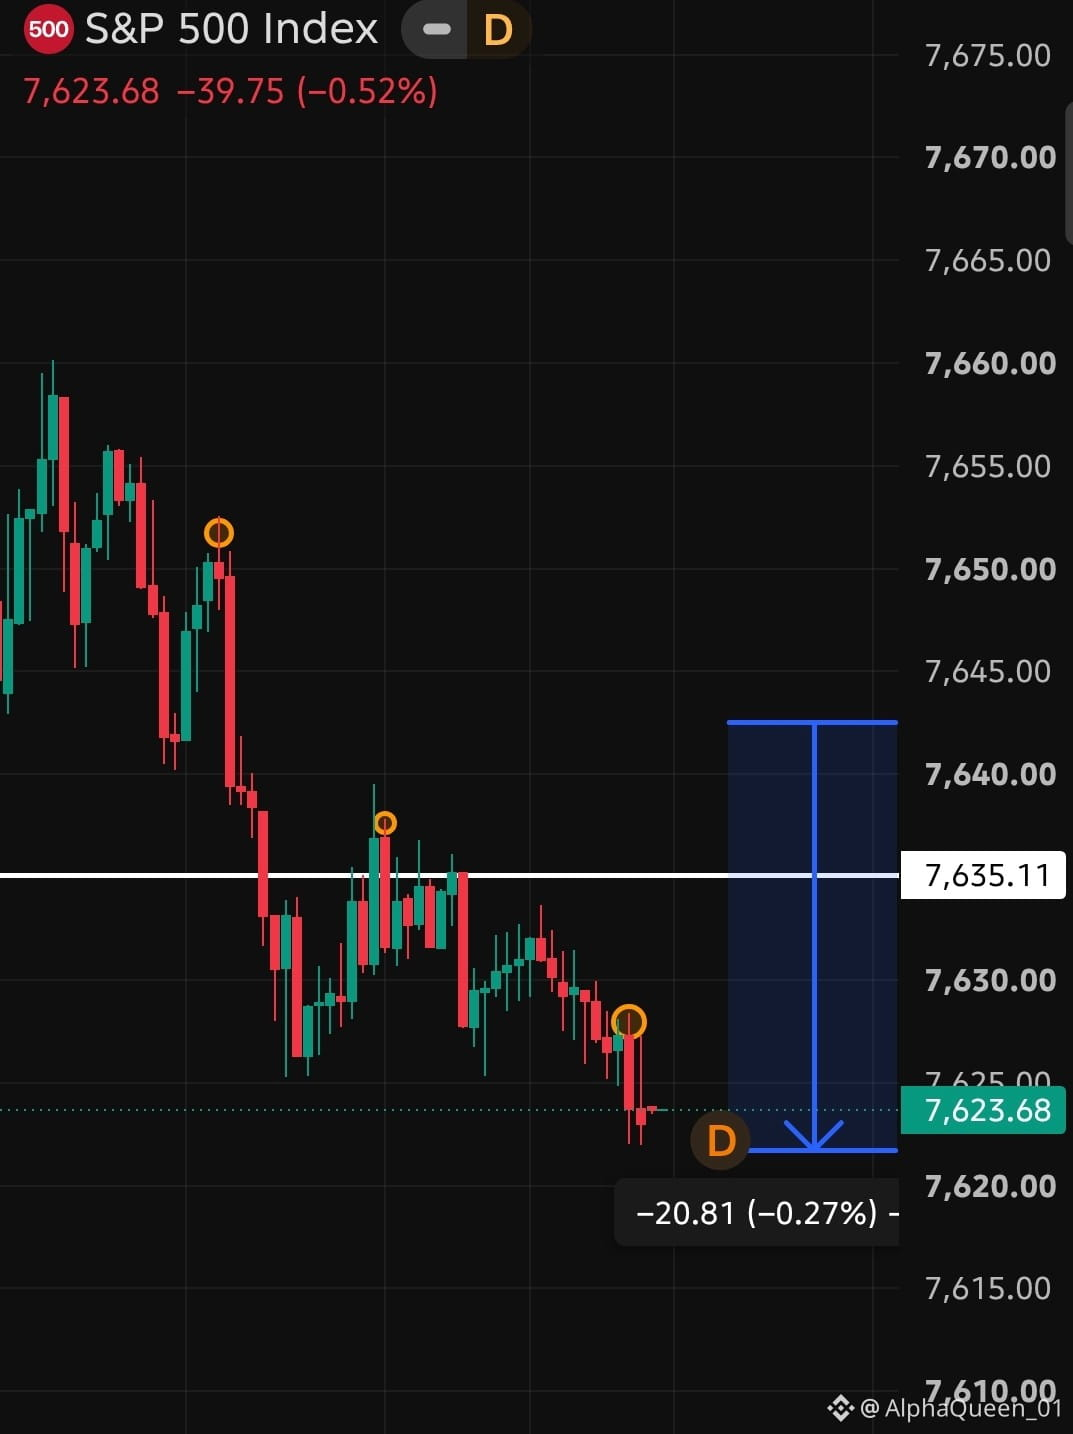
Bulls tried 3 times. Market slapped them 3 times! 👋📉
S&P 500: 7,623.68 (-0.52%)
Look at this chart carefully:
1st Try: Price went up, rejected from 7,652 ❌
2nd Try: Tried again, rejected from 7,639 ❌
3rd Try: Last hope, rejected from 7,627 ❌
And that white line 7,635.11?
That was the bulls' last wall. It broke too.
Now the market is saying:
"The party has just started"
Only 2 options left:
A) 7,620 holds and market flies back up
B) 7,620 breaks and we see 7,600
Which team are you on? 👇
Comment: A or B
#SP500 #Trading #PriceAction #StockMarket #Bearish
Bulls tried 3 times. Market slapped them 3 times! 👋📉
S&P 500: 7,623.68 (-0.52%)
Look at this chart carefully:
1st Try: Price went up, rejected from 7,652 ❌
2nd Try: Tried again, rejected from 7,639 ❌
3rd Try: Last hope, rejected from 7,627 ❌
And that white line 7,635.11?
That was the bulls' last wall. It broke too.
Now the market is saying:
"The party has just started"
Only 2 options left:
A) 7,620 holds and market flies back up
B) 7,620 breaks and we see 7,600
Which team are you on? 👇
Comment: A or B
#SP500 #Trading #PriceAction #StockMarket #Bearish
S&P 500: 7,623.68 (-0.52%)
Look at this chart carefully:
1st Try: Price went up, rejected from 7,652 ❌
2nd Try: Tried again, rejected from 7,639 ❌
3rd Try: Last hope, rejected from 7,627 ❌
And that white line 7,635.11?
That was the bulls' last wall. It broke too.
Now the market is saying:
"The party has just started"
Only 2 options left:
A) 7,620 holds and market flies back up
B) 7,620 breaks and we see 7,600
Which team are you on? 👇
Comment: A or B
#SP500 #Trading #PriceAction #StockMarket #Bearish
HOLD bnb culture:
Option 2
2
2
143

⏫️🇺🇸 مفاجأة في وول ستريت!
تفوقت الأسهم الأمريكية خارج قطاع الذكاء الاصطناعي على مؤشر ستاندرد آند بورز 500 منذ بداية العام.
😮 حسب إغلاق الخميس:
📈 المؤشر بدون أسهم الـ AI: +12.4%
📊 مؤشر S&P 500 الرئيسي: +12%
هل انتهت هيمنة أسهم الذكاء الاصطناعي مؤقتاً وبدأت السيولة تدور لقطاعات أخرى؟
راقب الأسهم التقليدية.
$SPCXB
#SP500
#USStocks #AIStocks #WallStreet $SPX
⏫️🇺🇸 مفاجأة في وول ستريت!
تفوقت الأسهم الأمريكية خارج قطاع الذكاء الاصطناعي على مؤشر ستاندرد آند بورز 500 منذ بداية العام.
😮 حسب إغلاق الخميس:
📈 المؤشر بدون أسهم الـ AI: +12.4%
📊 مؤشر S&P 500 الرئيسي: +12%
هل انتهت هيمنة أسهم الذكاء الاصطناعي مؤقتاً وبدأت السيولة تدور لقطاعات أخرى؟
راقب الأسهم التقليدية.
$SPCXB
#SP500
#USStocks #AIStocks #WallStreet $SPX
تفوقت الأسهم الأمريكية خارج قطاع الذكاء الاصطناعي على مؤشر ستاندرد آند بورز 500 منذ بداية العام.
😮 حسب إغلاق الخميس:
📈 المؤشر بدون أسهم الـ AI: +12.4%
📊 مؤشر S&P 500 الرئيسي: +12%
هل انتهت هيمنة أسهم الذكاء الاصطناعي مؤقتاً وبدأت السيولة تدور لقطاعات أخرى؟
راقب الأسهم التقليدية.
$SPCXB
#SP500
#USStocks #AIStocks #WallStreet $SPX
22
සත්යායනය කළ

ලිපිය
The S&P 500 Is on a Dangerous Path: 5 Warning Signs Investors Should Not Ignore#SP500 🌍 #PositiveMindsGlobalResults | Binance Square | October 20, 2026
The S&P 500 is one of the world's most closely watched stock market benchmarks, but a rising index does not necessarily mean the market is healthy. When valuations become stretched, market gains depend heavily on a small group of large companies, and economic uncertainty increases, the risk of a sharp correction can grow.
For investors, the key question is whether the rally is supported by sustainable earnings, healthy market breadth, and economic fundamentals, or becoming increasingly vulnerable to a sudden reversal.
1. A Narrow Market Rally
Reuters reported on October 12 that more than 40% of S&P 500 companies were down for the year, despite the index gaining around 14%. A few AI and semiconductor leaders have been doing much of the heavy lifting.
2. Inflation and Rising Bond Yields
Persistent inflation can keep borrowing costs elevated, pressure company valuations, and reduce demand for riskier assets. Higher Treasury yields are a significant challenge for growth stocks.
3. The AI Investment Question
AI remains a powerful growth opportunity, but investors increasingly need evidence that massive spending on chips, computing infrastructure, and data centers will generate sufficient profits. Disappointing guidance could trigger sharp repricing.
4. Weakness Beneath the Index
The S&P 500 can remain strong even while many individual shares decline. If selling spreads from technology leaders to banks, industrials, and consumer stocks, the correction could become broader.
5. Geopolitical and Energy Shocks
Higher oil prices can revive inflation, weaken consumer purchasing power, and complicate central bank decisions. This combination could put further pressure on equities if earnings disappoint.
What Could Happen Next?
These are possible scenarios, not guaranteed predictions or live price targets.
Bullish Recovery: The rally resumes if earnings remain strong, yields ease, and more stocks participate.
Base Case: Volatile consolidation continues amid mixed earnings, persistent inflation, and sector rotation.
Bearish Correction: The market declines further if AI earnings disappoint, yields rise, and selling spreads across sectors.
Severe Downside: A deeper sell-off could emerge if economic conditions deteriorate, credit stress increases, and forced selling accelerates.
A healthy correction is different from a breakdown in the underlying earnings and economic outlook. A market decline alone does not prove that a bear market has begun.
My Market Assessment
As of October 20, 2026, the warning signs deserve attention. The S&P 500 rebounded 0.41% on October 19 to 7,690.73 following the previous week's sell-off, but most non-technology stocks continued to struggle. The rebound is encouraging, yet it does not establish that market weakness has ended.
My Conclusion
The S&P 500 is facing a narrower path. Strong corporate earnings could support further gains, but concentrated market leadership, persistent inflation, higher yields, and uncertainty about AI returns leave the market vulnerable to another correction.
Investors should monitor earnings guidance, market breadth, Treasury yields, and inflation together rather than relying on the index's headline performance alone.
Educational market commentary only. This is not financial advice. Forecasts are uncertain. Always conduct your own research and assess your risk tolerance before making investment decisions.
#SP500 #StockMarket #USStocks #MarketOutlook #MarketCorrection #WallStreet #Inflation #FederalReserve #AITechStocks #GlobalEconomy #PositiveMindsGlobalResults #BinanceSquare
{spot}(BNBUSDT)
{spot}(BTCUSDT)
The S&P 500 Is on a Dangerous Path: 5 Warning Signs Investors Should Not Ignore
#SP500 🌍 #PositiveMindsGlobalResults | Binance Square | October 20, 2026
The S&P 500 is one of the world's most closely watched stock market benchmarks, but a rising index does not necessarily mean the market is healthy. When valuations become stretched, market gains depend heavily on a small group of large companies, and economic uncertainty increases, the risk of a sharp correction can grow.
For investors, the key question is whether the rally is supported by sustainable earnings, healthy market breadth, and economic fundamentals, or becoming increasingly vulnerable to a sudden reversal.
1. A Narrow Market Rally
Reuters reported on October 12 that more than 40% of S&P 500 companies were down for the year, despite the index gaining around 14%. A few AI and semiconductor leaders have been doing much of the heavy lifting.
2. Inflation and Rising Bond Yields
Persistent inflation can keep borrowing costs elevated, pressure company valuations, and reduce demand for riskier assets. Higher Treasury yields are a significant challenge for growth stocks.
3. The AI Investment Question
AI remains a powerful growth opportunity, but investors increasingly need evidence that massive spending on chips, computing infrastructure, and data centers will generate sufficient profits. Disappointing guidance could trigger sharp repricing.
4. Weakness Beneath the Index
The S&P 500 can remain strong even while many individual shares decline. If selling spreads from technology leaders to banks, industrials, and consumer stocks, the correction could become broader.
5. Geopolitical and Energy Shocks
Higher oil prices can revive inflation, weaken consumer purchasing power, and complicate central bank decisions. This combination could put further pressure on equities if earnings disappoint.
What Could Happen Next?
These are possible scenarios, not guaranteed predictions or live price targets.
Bullish Recovery: The rally resumes if earnings remain strong, yields ease, and more stocks participate.
Base Case: Volatile consolidation continues amid mixed earnings, persistent inflation, and sector rotation.
Bearish Correction: The market declines further if AI earnings disappoint, yields rise, and selling spreads across sectors.
Severe Downside: A deeper sell-off could emerge if economic conditions deteriorate, credit stress increases, and forced selling accelerates.
A healthy correction is different from a breakdown in the underlying earnings and economic outlook. A market decline alone does not prove that a bear market has begun.
My Market Assessment
As of October 20, 2026, the warning signs deserve attention. The S&P 500 rebounded 0.41% on October 19 to 7,690.73 following the previous week's sell-off, but most non-technology stocks continued to struggle. The rebound is encouraging, yet it does not establish that market weakness has ended.
My Conclusion
The S&P 500 is facing a narrower path. Strong corporate earnings could support further gains, but concentrated market leadership, persistent inflation, higher yields, and uncertainty about AI returns leave the market vulnerable to another correction.
Investors should monitor earnings guidance, market breadth, Treasury yields, and inflation together rather than relying on the index's headline performance alone.
Educational market commentary only. This is not financial advice. Forecasts are uncertain. Always conduct your own research and assess your risk tolerance before making investment decisions.
#SP500 #StockMarket #USStocks #MarketOutlook #MarketCorrection #WallStreet #Inflation #FederalReserve #AITechStocks #GlobalEconomy #PositiveMindsGlobalResults #BinanceSquare
The S&P 500 is one of the world's most closely watched stock market benchmarks, but a rising index does not necessarily mean the market is healthy. When valuations become stretched, market gains depend heavily on a small group of large companies, and economic uncertainty increases, the risk of a sharp correction can grow.
For investors, the key question is whether the rally is supported by sustainable earnings, healthy market breadth, and economic fundamentals, or becoming increasingly vulnerable to a sudden reversal.
1. A Narrow Market Rally
Reuters reported on October 12 that more than 40% of S&P 500 companies were down for the year, despite the index gaining around 14%. A few AI and semiconductor leaders have been doing much of the heavy lifting.
2. Inflation and Rising Bond Yields
Persistent inflation can keep borrowing costs elevated, pressure company valuations, and reduce demand for riskier assets. Higher Treasury yields are a significant challenge for growth stocks.
3. The AI Investment Question
AI remains a powerful growth opportunity, but investors increasingly need evidence that massive spending on chips, computing infrastructure, and data centers will generate sufficient profits. Disappointing guidance could trigger sharp repricing.
4. Weakness Beneath the Index
The S&P 500 can remain strong even while many individual shares decline. If selling spreads from technology leaders to banks, industrials, and consumer stocks, the correction could become broader.
5. Geopolitical and Energy Shocks
Higher oil prices can revive inflation, weaken consumer purchasing power, and complicate central bank decisions. This combination could put further pressure on equities if earnings disappoint.
What Could Happen Next?
These are possible scenarios, not guaranteed predictions or live price targets.
Bullish Recovery: The rally resumes if earnings remain strong, yields ease, and more stocks participate.
Base Case: Volatile consolidation continues amid mixed earnings, persistent inflation, and sector rotation.
Bearish Correction: The market declines further if AI earnings disappoint, yields rise, and selling spreads across sectors.
Severe Downside: A deeper sell-off could emerge if economic conditions deteriorate, credit stress increases, and forced selling accelerates.
A healthy correction is different from a breakdown in the underlying earnings and economic outlook. A market decline alone does not prove that a bear market has begun.
My Market Assessment
As of October 20, 2026, the warning signs deserve attention. The S&P 500 rebounded 0.41% on October 19 to 7,690.73 following the previous week's sell-off, but most non-technology stocks continued to struggle. The rebound is encouraging, yet it does not establish that market weakness has ended.
My Conclusion
The S&P 500 is facing a narrower path. Strong corporate earnings could support further gains, but concentrated market leadership, persistent inflation, higher yields, and uncertainty about AI returns leave the market vulnerable to another correction.
Investors should monitor earnings guidance, market breadth, Treasury yields, and inflation together rather than relying on the index's headline performance alone.
Educational market commentary only. This is not financial advice. Forecasts are uncertain. Always conduct your own research and assess your risk tolerance before making investment decisions.
#SP500 #StockMarket #USStocks #MarketOutlook #MarketCorrection #WallStreet #Inflation #FederalReserve #AITechStocks #GlobalEconomy #PositiveMindsGlobalResults #BinanceSquare
176


·
--
උසබ තත්ත්වය
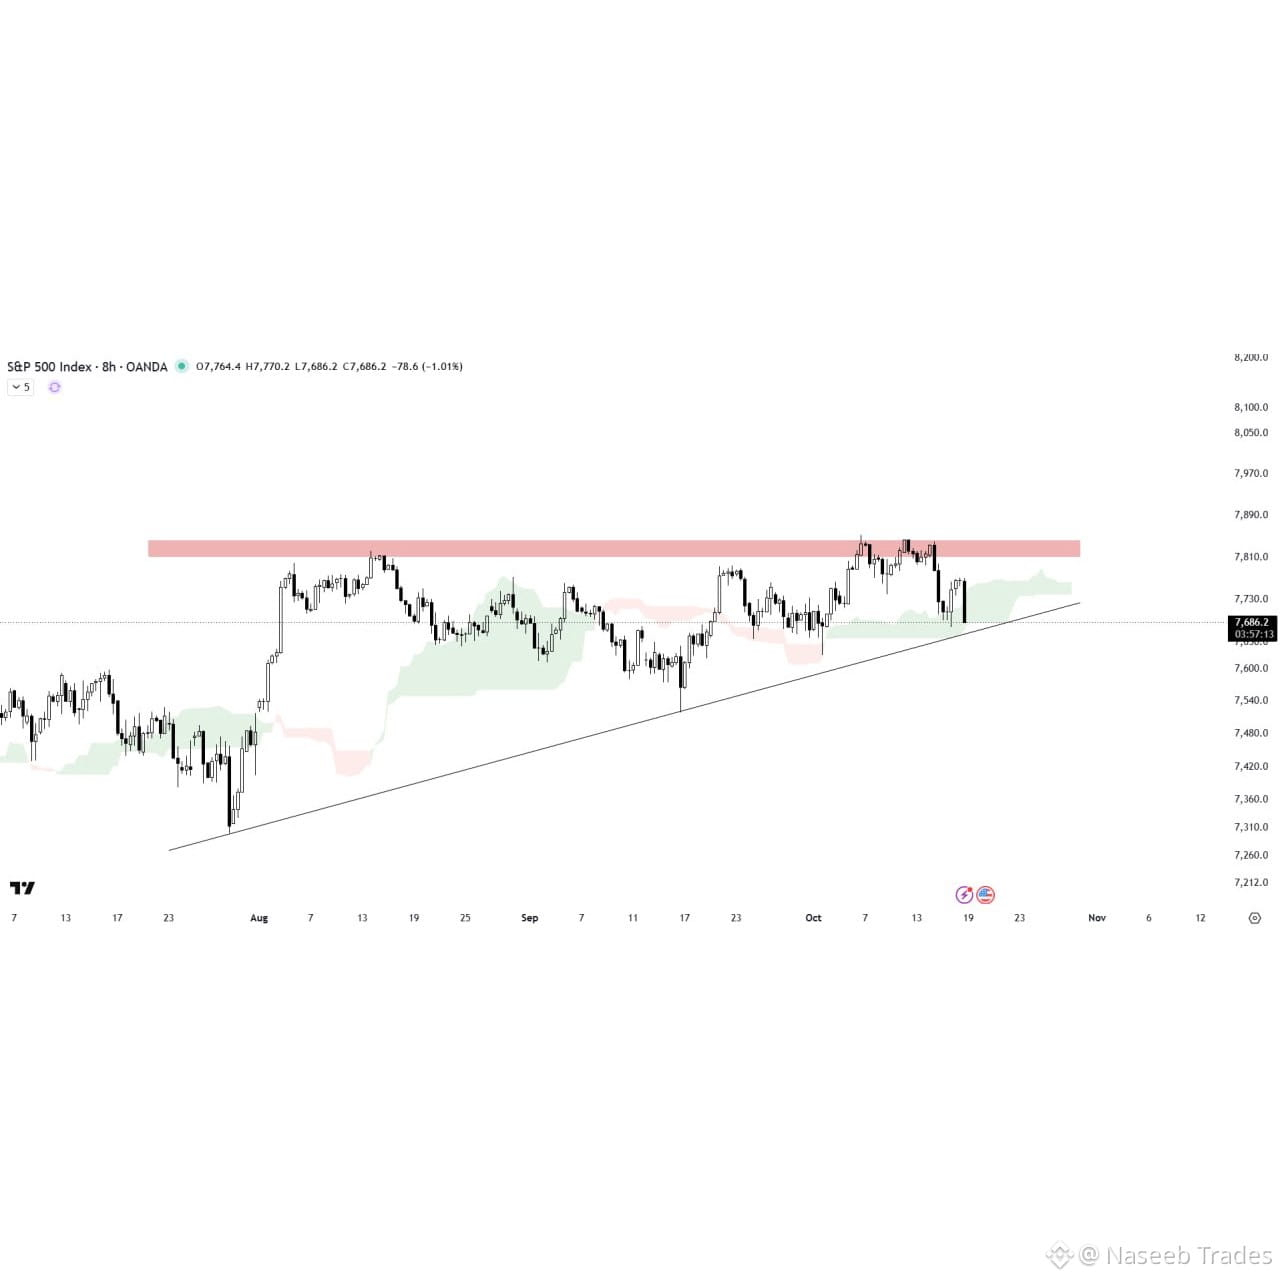
📊 S&P 500 ANALYSIS | KEY SUPPORT UNDER PRESSURE 📉
The S&P 500 is facing rejection at the horizontal supply zone of its ascending triangle, while buyers continue to defend the pattern’s rising support trendline.
☁️ Ichimoku Cloud Support
The Ichimoku cloud is acting as a key support area, potentially providing a base for a rebound near the triangle’s lower boundary.
🎯 Key Scenarios to Watch:
🟢 Bullish: A confirmed bounce from support could push the index back toward horizontal resistance.
🔴 Bearish: A breakdown below the trendline and cloud support could increase selling pressure.
₿ Why Crypto Traders Should Care
The S&P 500’s next move could influence broader market risk sentiment and potentially affect Bitcoin and altcoin price action.
⚠️ Watch for confirmation before taking a position. Neither a rebound nor a breakdown is guaranteed.
What’s your outlook for the S&P 500 — BULLISH 📈 or BEARISH 📉?
#SP500 #stockmarket #Crypto #bitcoin #BinanceSquare
📊 S&P 500 ANALYSIS | KEY SUPPORT UNDER PRESSURE 📉
The S&P 500 is facing rejection at the horizontal supply zone of its ascending triangle, while buyers continue to defend the pattern’s rising support trendline.
☁️ Ichimoku Cloud Support
The Ichimoku cloud is acting as a key support area, potentially providing a base for a rebound near the triangle’s lower boundary.
🎯 Key Scenarios to Watch:
🟢 Bullish: A confirmed bounce from support could push the index back toward horizontal resistance.
🔴 Bearish: A breakdown below the trendline and cloud support could increase selling pressure.
₿ Why Crypto Traders Should Care
The S&P 500’s next move could influence broader market risk sentiment and potentially affect Bitcoin and altcoin price action.
⚠️ Watch for confirmation before taking a position. Neither a rebound nor a breakdown is guaranteed.
What’s your outlook for the S&P 500 — BULLISH 📈 or BEARISH 📉?
#SP500 #stockmarket #Crypto #bitcoin #BinanceSquare
The S&P 500 is facing rejection at the horizontal supply zone of its ascending triangle, while buyers continue to defend the pattern’s rising support trendline.
☁️ Ichimoku Cloud Support
The Ichimoku cloud is acting as a key support area, potentially providing a base for a rebound near the triangle’s lower boundary.
🎯 Key Scenarios to Watch:
🟢 Bullish: A confirmed bounce from support could push the index back toward horizontal resistance.
🔴 Bearish: A breakdown below the trendline and cloud support could increase selling pressure.
₿ Why Crypto Traders Should Care
The S&P 500’s next move could influence broader market risk sentiment and potentially affect Bitcoin and altcoin price action.
⚠️ Watch for confirmation before taking a position. Neither a rebound nor a breakdown is guaranteed.
What’s your outlook for the S&P 500 — BULLISH 📈 or BEARISH 📉?
#SP500 #stockmarket #Crypto #bitcoin #BinanceSquare
91

·
--
$BTC & #SP500
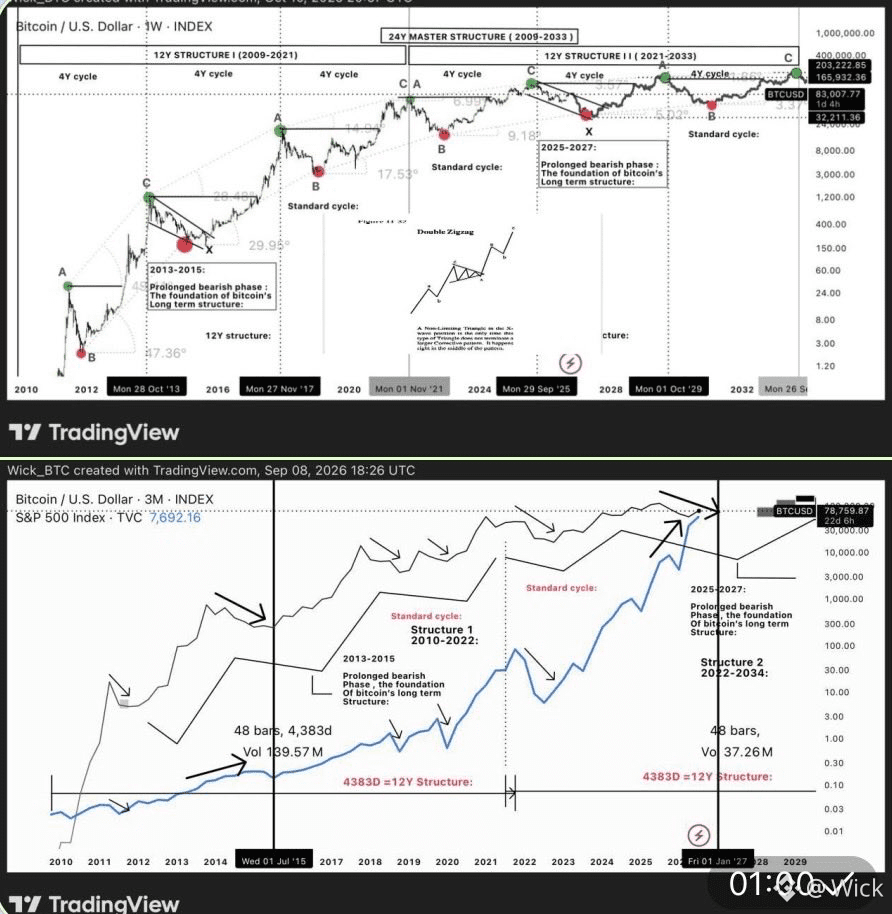
Additional context to my quoted post:
I’ve now added the Bitcoin chart to provide a broader perspective on the current market cycle and highlight the striking similarities with the prolonged 2013–2015 bear cycle.
One of the most important similarities is the growing divergence between Bitcoin and the S&P 500.
During the 2013–2015 bear market, Bitcoin became increasingly disconnected from the S&P 500’s trajectory. While stocks continued trending higher, Bitcoin entered a prolonged structural decline and followed its own bearish cycle.
Interestingly, this type of divergence was less pronounced during other major Bitcoin cycles, when BTC and the S&P 500 generally followed more closely aligned market rhythms, with major corrections occurring around similar periods.
But this time, we appear to be seeing a pattern much closer to 2013–2015.
Once again, the S&P 500 continues pushing higher while Bitcoin appears to be moving through a prolonged bearish phase, increasingly diverging from the stock market’s bullish trajectory.
This is one of the reasons I believe the current cycle is following the 2013–2015 cycle in terms of timing and duration, rather than the shorter 2022 cycle.
Back then, the S&P 500 continued rising throughout much of Bitcoin’s bear market before eventually entering its own bearish phase. Ultimately, both markets experienced a major correction.
Could we be approaching a similar turning point in 2025–2027?
If this historical pattern plays out again, the S&P 500 could enter its own bearish phase just as Bitcoin moves into the next stage of its broader correction.
This is precisely the scenario I’ve been discussing for the past 3–4 months. With both charts now side by side, the historical similarities become even more compelling.
$BTC & #SP500
Additional context to my quoted post:
I’ve now added the Bitcoin chart to provide a broader perspective on the current market cycle and highlight the striking similarities with the prolonged 2013–2015 bear cycle.
One of the most important similarities is the growing divergence between Bitcoin and the S&P 500.
During the 2013–2015 bear market, Bitcoin became increasingly disconnected from the S&P 500’s trajectory. While stocks continued trending higher, Bitcoin entered a prolonged structural decline and followed its own bearish cycle.
Interestingly, this type of divergence was less pronounced during other major Bitcoin cycles, when BTC and the S&P 500 generally followed more closely aligned market rhythms, with major corrections occurring around similar periods.
But this time, we appear to be seeing a pattern much closer to 2013–2015.
Once again, the S&P 500 continues pushing higher while Bitcoin appears to be moving through a prolonged bearish phase, increasingly diverging from the stock market’s bullish trajectory.
This is one of the reasons I believe the current cycle is following the 2013–2015 cycle in terms of timing and duration, rather than the shorter 2022 cycle.
Back then, the S&P 500 continued rising throughout much of Bitcoin’s bear market before eventually entering its own bearish phase. Ultimately, both markets experienced a major correction.
Could we be approaching a similar turning point in 2025–2027?
If this historical pattern plays out again, the S&P 500 could enter its own bearish phase just as Bitcoin moves into the next stage of its broader correction.
This is precisely the scenario I’ve been discussing for the past 3–4 months. With both charts now side by side, the historical similarities become even more compelling.
Additional context to my quoted post:
I’ve now added the Bitcoin chart to provide a broader perspective on the current market cycle and highlight the striking similarities with the prolonged 2013–2015 bear cycle.
One of the most important similarities is the growing divergence between Bitcoin and the S&P 500.
During the 2013–2015 bear market, Bitcoin became increasingly disconnected from the S&P 500’s trajectory. While stocks continued trending higher, Bitcoin entered a prolonged structural decline and followed its own bearish cycle.
Interestingly, this type of divergence was less pronounced during other major Bitcoin cycles, when BTC and the S&P 500 generally followed more closely aligned market rhythms, with major corrections occurring around similar periods.
But this time, we appear to be seeing a pattern much closer to 2013–2015.
Once again, the S&P 500 continues pushing higher while Bitcoin appears to be moving through a prolonged bearish phase, increasingly diverging from the stock market’s bullish trajectory.
This is one of the reasons I believe the current cycle is following the 2013–2015 cycle in terms of timing and duration, rather than the shorter 2022 cycle.
Back then, the S&P 500 continued rising throughout much of Bitcoin’s bear market before eventually entering its own bearish phase. Ultimately, both markets experienced a major correction.
Could we be approaching a similar turning point in 2025–2027?
If this historical pattern plays out again, the S&P 500 could enter its own bearish phase just as Bitcoin moves into the next stage of its broader correction.
This is precisely the scenario I’ve been discussing for the past 3–4 months. With both charts now side by side, the historical similarities become even more compelling.
135

·
--
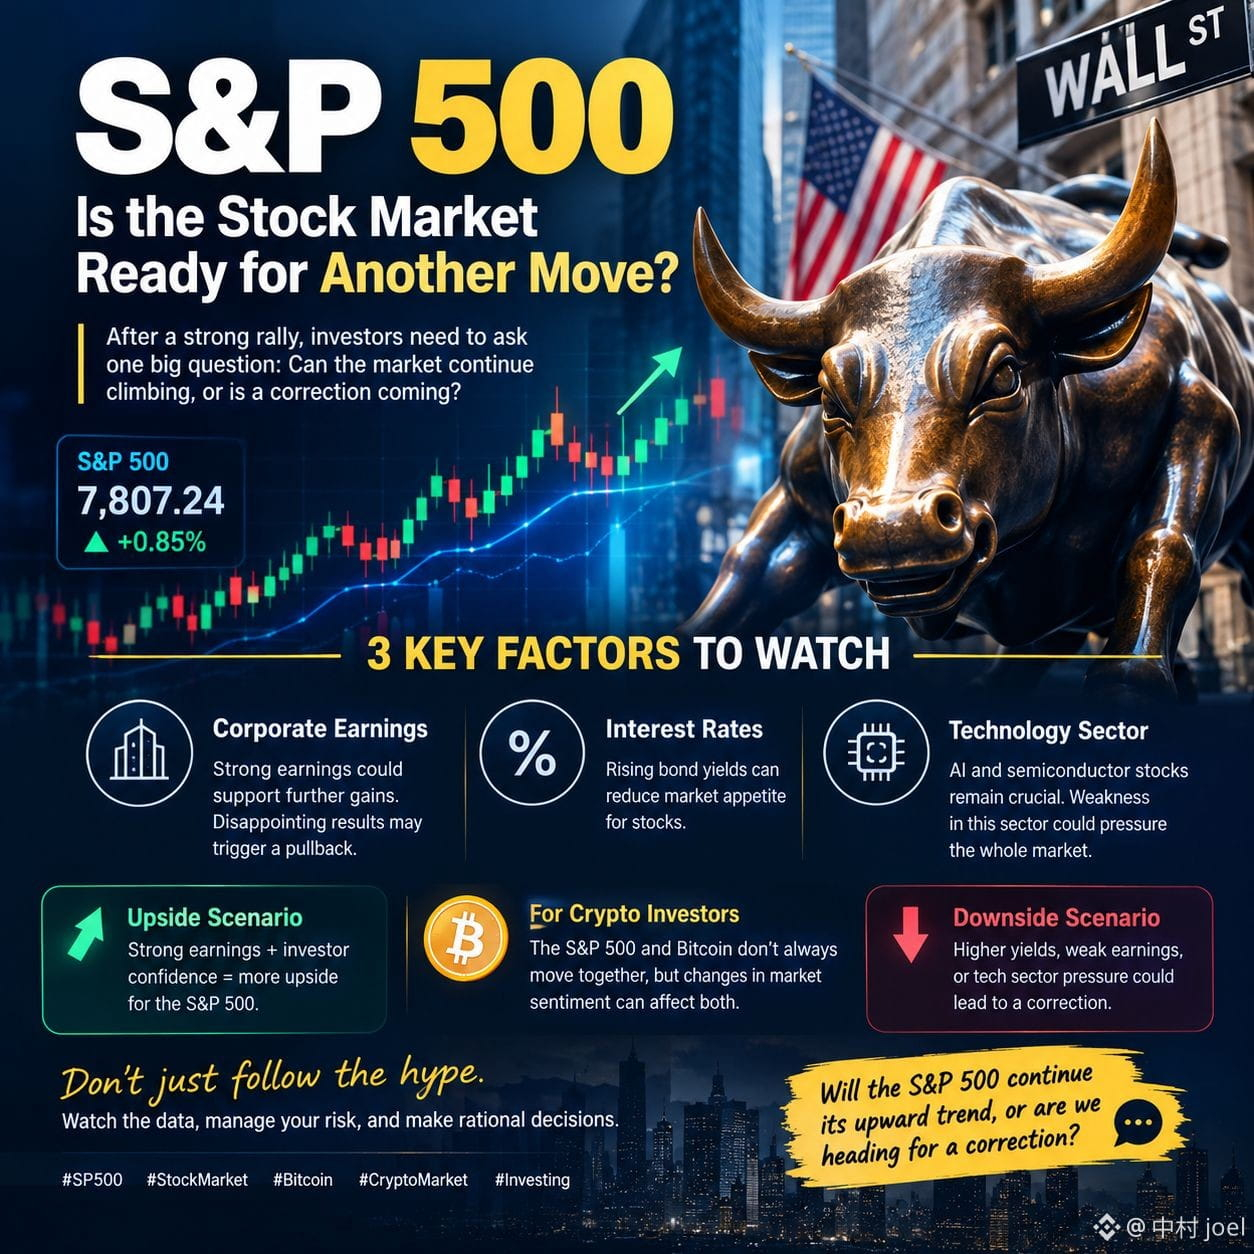
📊 S&P 500: Is the Stock Market Ready for Another Move?
The S&P 500 remains one of the most important indicators of the US stock market. But after a strong rally, investors need to ask one big question: Can the market continue climbing, or is a correction coming?
Three key factors deserve attention right now: corporate earnings, interest rates, and the technology sector, especially AI and semiconductor stocks.
📈 If companies report strong earnings and investor confidence remains high, the S&P 500 could find support for further gains.
📉 However, rising bond yields, disappointing earnings, or weakness in technology stocks could trigger selling pressure.
For crypto investors, the S&P 500 is also worth watching. Bitcoin and US stocks sometimes move in the same direction when market sentiment changes, although their relationship is not always consistent.
My view? Don't assume the market will keep rising just because it has performed well. Watch the data, manage risk, and avoid making emotional decisions.
What do you think? Will the S&P 500 continue its upward trend, or are we heading for a correction? 👇
$SPYB $SPCXB $TSLAB
#SP500
#StockMarket
#SPYB
📊 S&P 500: Is the Stock Market Ready for Another Move?
The S&P 500 remains one of the most important indicators of the US stock market. But after a strong rally, investors need to ask one big question: Can the market continue climbing, or is a correction coming?
Three key factors deserve attention right now: corporate earnings, interest rates, and the technology sector, especially AI and semiconductor stocks.
📈 If companies report strong earnings and investor confidence remains high, the S&P 500 could find support for further gains.
📉 However, rising bond yields, disappointing earnings, or weakness in technology stocks could trigger selling pressure.
For crypto investors, the S&P 500 is also worth watching. Bitcoin and US stocks sometimes move in the same direction when market sentiment changes, although their relationship is not always consistent.
My view? Don't assume the market will keep rising just because it has performed well. Watch the data, manage risk, and avoid making emotional decisions.
What do you think? Will the S&P 500 continue its upward trend, or are we heading for a correction? 👇
$SPYB $SPCXB $TSLAB
#SP500
#StockMarket
#SPYB
The S&P 500 remains one of the most important indicators of the US stock market. But after a strong rally, investors need to ask one big question: Can the market continue climbing, or is a correction coming?
Three key factors deserve attention right now: corporate earnings, interest rates, and the technology sector, especially AI and semiconductor stocks.
📈 If companies report strong earnings and investor confidence remains high, the S&P 500 could find support for further gains.
📉 However, rising bond yields, disappointing earnings, or weakness in technology stocks could trigger selling pressure.
For crypto investors, the S&P 500 is also worth watching. Bitcoin and US stocks sometimes move in the same direction when market sentiment changes, although their relationship is not always consistent.
My view? Don't assume the market will keep rising just because it has performed well. Watch the data, manage risk, and avoid making emotional decisions.
What do you think? Will the S&P 500 continue its upward trend, or are we heading for a correction? 👇
$SPYB $SPCXB $TSLAB
#SP500
#StockMarket
#SPYB
1.2k
3
46
1.2k

·
--
$SPY $BTC
🚨 ¿Depende la economía global de un mercado bursátil cada vez más concentrado?
* Concentración y riesgo macro 📊: El debate sobre si el mercado de valores refleja la economía real se intensifica, especialmente ante el enfriamiento del impulso en el sector de la inteligencia artificial 📉.
* Sensibilidad de los activos de riesgo 📈: Una desaceleración en las grandes acciones tecnológicas podría aumentar la volatilidad global, impulsando la búsqueda de diversificación en activos alternativos 🟩.
* Correlación con las criptomonedas 🟥: Si la liquidez macroeconómica se reduce por tensiones en la renta variable, los mercados digitales podrían experimentar fluctuaciones en el corto plazo antes de consolidar una tendencia clara.
📊 ENCUESTA RÁPIDA:
¿Qué sucederá con el mercado si el sector tecnológico estadounidense entra en fase de corrección?
A) El capital rotará hacia activos refugio y bonos
B) Bitcoin captará liquidez como alternativa descentralizada
C) Habrá una corrección generalizada en todos los mercados de riesgo
👇 ¡Vota en los comentarios con tu letra!
#Noticias #Economia #Mercados #SP500 #Crypto
$SPY $BTC
🚨 ¿Depende la economía global de un mercado bursátil cada vez más concentrado?
* Concentración y riesgo macro 📊: El debate sobre si el mercado de valores refleja la economía real se intensifica, especialmente ante el enfriamiento del impulso en el sector de la inteligencia artificial 📉.
* Sensibilidad de los activos de riesgo 📈: Una desaceleración en las grandes acciones tecnológicas podría aumentar la volatilidad global, impulsando la búsqueda de diversificación en activos alternativos 🟩.
* Correlación con las criptomonedas 🟥: Si la liquidez macroeconómica se reduce por tensiones en la renta variable, los mercados digitales podrían experimentar fluctuaciones en el corto plazo antes de consolidar una tendencia clara.
📊 ENCUESTA RÁPIDA:
¿Qué sucederá con el mercado si el sector tecnológico estadounidense entra en fase de corrección?
A) El capital rotará hacia activos refugio y bonos
B) Bitcoin captará liquidez como alternativa descentralizada
C) Habrá una corrección generalizada en todos los mercados de riesgo
👇 ¡Vota en los comentarios con tu letra!
#Noticias #Economia #Mercados #SP500 #Crypto
🚨 ¿Depende la economía global de un mercado bursátil cada vez más concentrado?
* Concentración y riesgo macro 📊: El debate sobre si el mercado de valores refleja la economía real se intensifica, especialmente ante el enfriamiento del impulso en el sector de la inteligencia artificial 📉.
* Sensibilidad de los activos de riesgo 📈: Una desaceleración en las grandes acciones tecnológicas podría aumentar la volatilidad global, impulsando la búsqueda de diversificación en activos alternativos 🟩.
* Correlación con las criptomonedas 🟥: Si la liquidez macroeconómica se reduce por tensiones en la renta variable, los mercados digitales podrían experimentar fluctuaciones en el corto plazo antes de consolidar una tendencia clara.
📊 ENCUESTA RÁPIDA:
¿Qué sucederá con el mercado si el sector tecnológico estadounidense entra en fase de corrección?
A) El capital rotará hacia activos refugio y bonos
B) Bitcoin captará liquidez como alternativa descentralizada
C) Habrá una corrección generalizada en todos los mercados de riesgo
👇 ¡Vota en los comentarios con tu letra!
#Noticias #Economia #Mercados #SP500 #Crypto
38

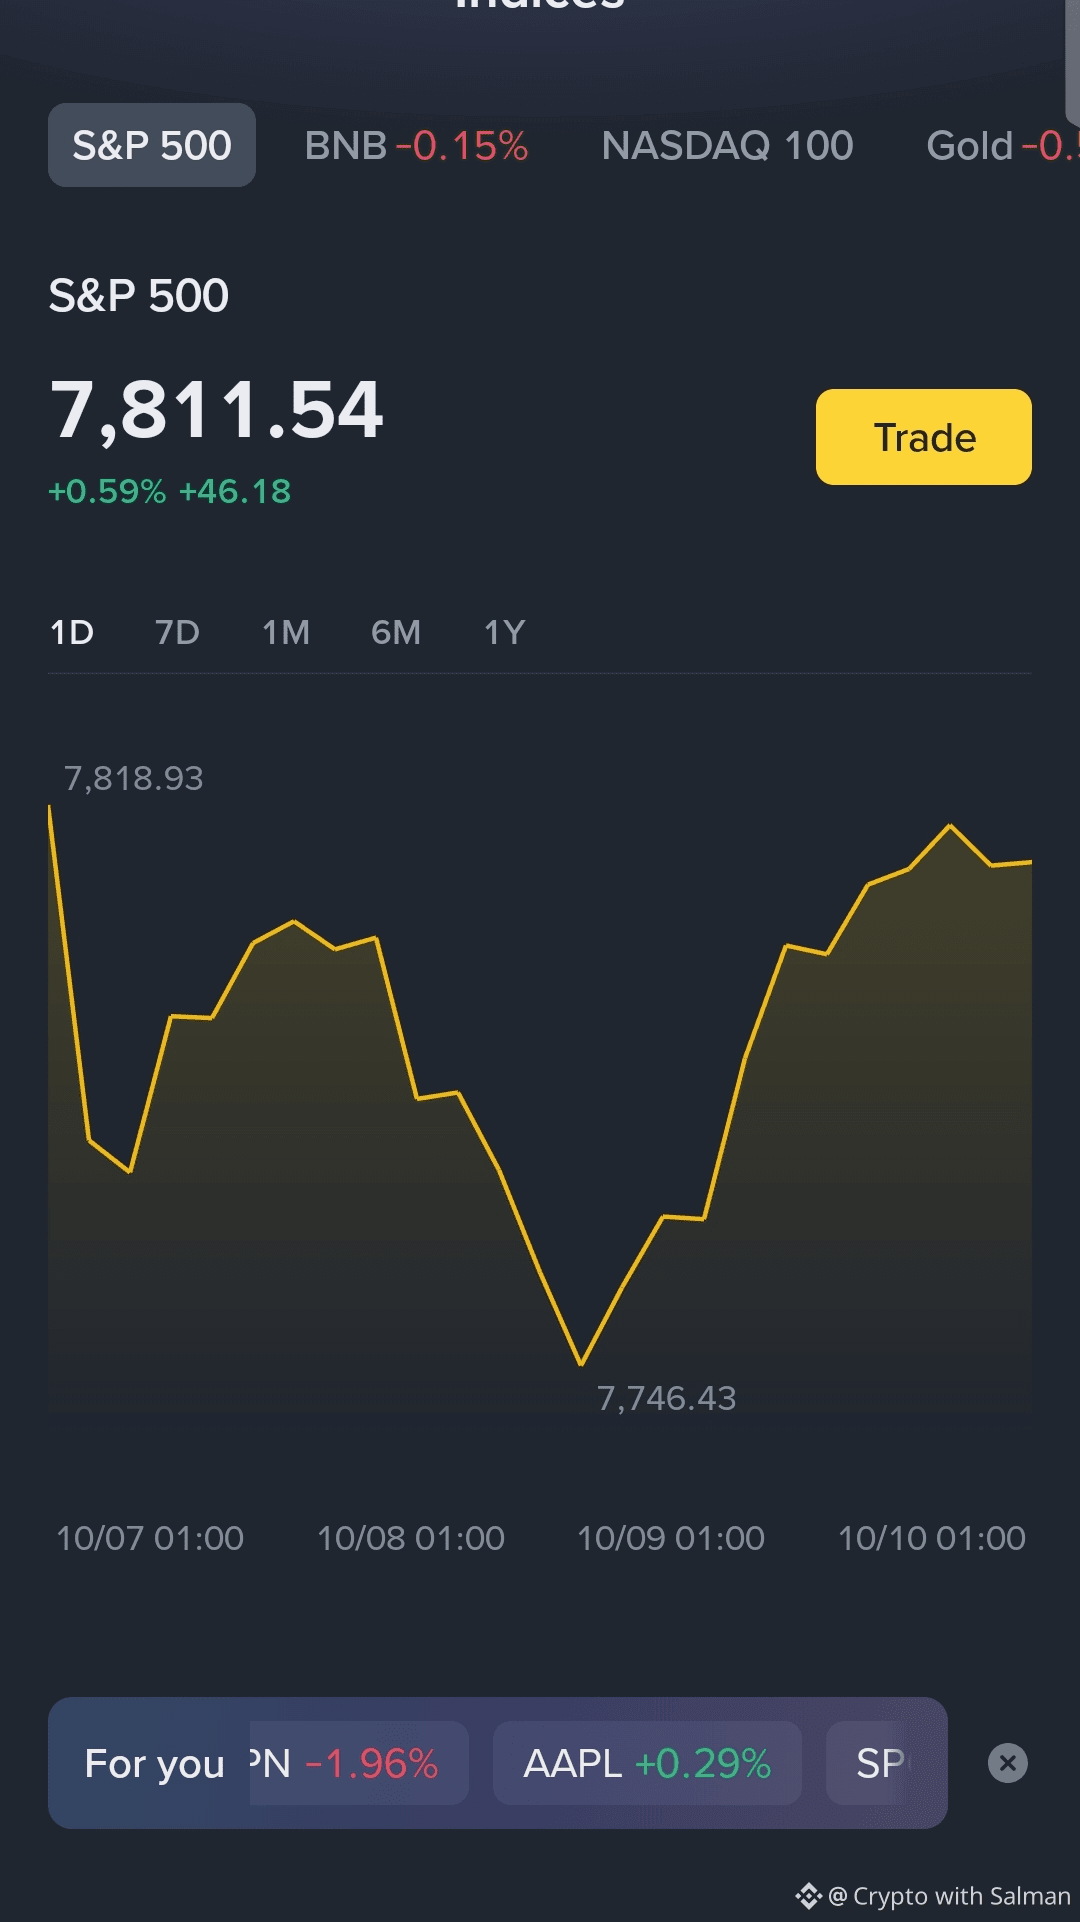
📈 S&P 500 Shows Positive Momentum! 🚀 The S&P 500 is trading at 7,811.54, up 0.59% (+46.18 points). After dipping to 7,746.43, the index recovered strongly, showing renewed buying interest. 👀 Can the S&P 500 continue its upward trend and reach new highs, or is a pullback coming? 🤔 What’s your prediction? Share your thoughts below! 💬 #SP500 #stockmarket #Investing #BİNANCESQUARE
📈 S&P 500 Shows Positive Momentum! 🚀 The S&P 500 is trading at 7,811.54, up 0.59% (+46.18 points). After dipping to 7,746.43, the index recovered strongly, showing renewed buying interest. 👀 Can the S&P 500 continue its upward trend and reach new highs, or is a pullback coming? 🤔 What’s your prediction? Share your thoughts below! 💬 #SP500 #stockmarket #Investing #BİNANCESQUARE
1
94


📊S&P 500 Market Update | October 8, 2026⚠️ Markets Under Pressure — Is More Volatility Ahead?
The S&P 500 closed at 7,765.36, down 36.41 points (-0.47%) on October 8. This marked the index’s second consecutive daily decline after recently reaching a record high. Technology stocks faced notable pressure, while the Dow Jones managed a small gain. <Cite refs={["turn949695news20","turn949695news21"]}/>
🔍 What Is Driving the Market?
📉 1. Weak Job Growth
The US economy added just 29,000 jobs in September, while unemployment stood at 4.2%. Slower hiring has raised questions about the strength of the labor market. <Cite refs={["turn949695search0"]}/>
🔥 2. Persistent Inflation Pressure
The ISM Services Prices Index reached 74.0, above the 73.3 forecast. This suggests that price pressures in the services sector remain a concern. <Cite refs={["turn491227search1"]}/>
📈 3. Rising Treasury Yields
The October 7 US 10-year note auction yield came in at 5.30%, compared with 4.834% at the previous auction. Higher yields can put pressure on stock valuations, although market reactions depend on several factors. <Cite refs={["turn491227search0"]}/>
🎯 Key Technical Levels to Watch
🔹 Recent Resistance: 7,844.52
🔹 Recent Support Zone: 7,731–7,765
🔹 Previous Close on October 7: 7,801.77
🔹 October 8 Closing Level: 7,765.36
These reference levels are based on reported S&P 500 price data. They are not guaranteed support or resistance levels. <Cite refs={["turn949695search1","turn949695search2"]}/>
📊 Market Outlook: Cautious
If selling pressure continues, traders may watch whether the index can hold above its recent intraday low. A recovery toward the previous close could signal improving short-term momentum, but confirmation from price action is important.
💬 Your Turn!
Do you think the S&P 500 can recover, or will market uncertainty lead to another decline?
Share your view below. Let's discuss the market together! 👇
#SP500 #stockmarket #market Analysis #TechnicalAnalysis #trading
📊S&P 500 Market Update | October 8, 2026
⚠️ Markets Under Pressure — Is More Volatility Ahead?
The S&P 500 closed at 7,765.36, down 36.41 points (-0.47%) on October 8. This marked the index’s second consecutive daily decline after recently reaching a record high. Technology stocks faced notable pressure, while the Dow Jones managed a small gain. <Cite refs={["turn949695news20","turn949695news21"]}/>
🔍 What Is Driving the Market?
📉 1. Weak Job Growth
The US economy added just 29,000 jobs in September, while unemployment stood at 4.2%. Slower hiring has raised questions about the strength of the labor market. <Cite refs={["turn949695search0"]}/>
🔥 2. Persistent Inflation Pressure
The ISM Services Prices Index reached 74.0, above the 73.3 forecast. This suggests that price pressures in the services sector remain a concern. <Cite refs={["turn491227search1"]}/>
📈 3. Rising Treasury Yields
The October 7 US 10-year note auction yield came in at 5.30%, compared with 4.834% at the previous auction. Higher yields can put pressure on stock valuations, although market reactions depend on several factors. <Cite refs={["turn491227search0"]}/>
🎯 Key Technical Levels to Watch
🔹 Recent Resistance: 7,844.52
🔹 Recent Support Zone: 7,731–7,765
🔹 Previous Close on October 7: 7,801.77
🔹 October 8 Closing Level: 7,765.36
These reference levels are based on reported S&P 500 price data. They are not guaranteed support or resistance levels. <Cite refs={["turn949695search1","turn949695search2"]}/>
📊 Market Outlook: Cautious
If selling pressure continues, traders may watch whether the index can hold above its recent intraday low. A recovery toward the previous close could signal improving short-term momentum, but confirmation from price action is important.
💬 Your Turn!
Do you think the S&P 500 can recover, or will market uncertainty lead to another decline?
Share your view below. Let's discuss the market together! 👇
#SP500 #stockmarket #market Analysis #TechnicalAnalysis #trading
The S&P 500 closed at 7,765.36, down 36.41 points (-0.47%) on October 8. This marked the index’s second consecutive daily decline after recently reaching a record high. Technology stocks faced notable pressure, while the Dow Jones managed a small gain. <Cite refs={["turn949695news20","turn949695news21"]}/>
🔍 What Is Driving the Market?
📉 1. Weak Job Growth
The US economy added just 29,000 jobs in September, while unemployment stood at 4.2%. Slower hiring has raised questions about the strength of the labor market. <Cite refs={["turn949695search0"]}/>
🔥 2. Persistent Inflation Pressure
The ISM Services Prices Index reached 74.0, above the 73.3 forecast. This suggests that price pressures in the services sector remain a concern. <Cite refs={["turn491227search1"]}/>
📈 3. Rising Treasury Yields
The October 7 US 10-year note auction yield came in at 5.30%, compared with 4.834% at the previous auction. Higher yields can put pressure on stock valuations, although market reactions depend on several factors. <Cite refs={["turn491227search0"]}/>
🎯 Key Technical Levels to Watch
🔹 Recent Resistance: 7,844.52
🔹 Recent Support Zone: 7,731–7,765
🔹 Previous Close on October 7: 7,801.77
🔹 October 8 Closing Level: 7,765.36
These reference levels are based on reported S&P 500 price data. They are not guaranteed support or resistance levels. <Cite refs={["turn949695search1","turn949695search2"]}/>
📊 Market Outlook: Cautious
If selling pressure continues, traders may watch whether the index can hold above its recent intraday low. A recovery toward the previous close could signal improving short-term momentum, but confirmation from price action is important.
💬 Your Turn!
Do you think the S&P 500 can recover, or will market uncertainty lead to another decline?
Share your view below. Let's discuss the market together! 👇
#SP500 #stockmarket #market Analysis #TechnicalAnalysis #trading
1
123

·
--
#WallStreet
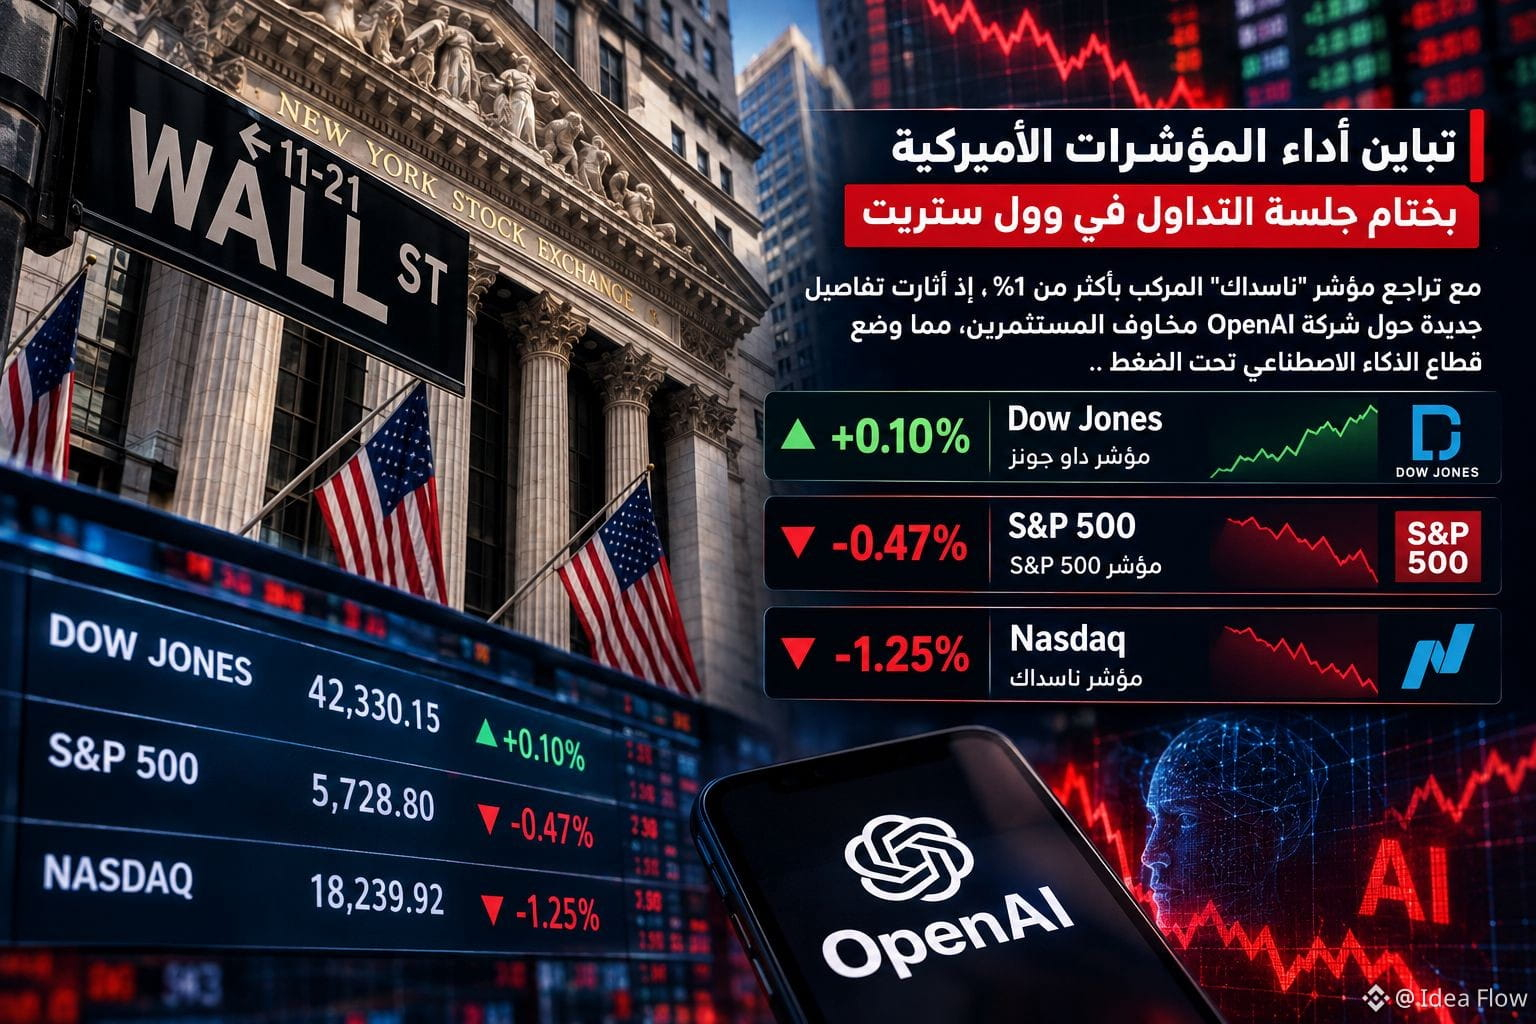
🟥 تباين أداء المؤشرات الأميركية بختام جلسة التداول في #وول_ستريت مع تراجع مؤشر "ناسداك" المركب بأكثر من 1%، إذ أثارت تفاصيل جديدة حول شركة OpenAI مخاوف المستثمرين، مما وضع قطاع الذكاء الاصطناعي تحت الضغط .. 🇺🇸
📌 مؤشر Dow_Jones يرتفع بنحو 0.10%
📌 مؤشر S&P 500 يغلق على تراجع بنسبة 0.47%
📌 مؤشر Nasdaq ينخفض بنحو 1.25%
$NVDAB
{spot}(NVDABUSDT)
$SPX
{alpha}(10xe0f63a424a4439cbe457d80e4f4b51ad25b2c56c)
$AAPLB
{spot}(AAPLBUSDT)
#Nasdaq100 #SP500 #DowJones
#WallStreet
🟥 تباين أداء المؤشرات الأميركية بختام جلسة التداول في #وول_ستريت مع تراجع مؤشر "ناسداك" المركب بأكثر من 1%، إذ أثارت تفاصيل جديدة حول شركة OpenAI مخاوف المستثمرين، مما وضع قطاع الذكاء الاصطناعي تحت الضغط .. 🇺🇸
📌 مؤشر Dow_Jones يرتفع بنحو 0.10%
📌 مؤشر S&P 500 يغلق على تراجع بنسبة 0.47%
📌 مؤشر Nasdaq ينخفض بنحو 1.25%
$NVDAB
$SPX
$AAPLB
#Nasdaq100 #SP500 #DowJones
🟥 تباين أداء المؤشرات الأميركية بختام جلسة التداول في #وول_ستريت مع تراجع مؤشر "ناسداك" المركب بأكثر من 1%، إذ أثارت تفاصيل جديدة حول شركة OpenAI مخاوف المستثمرين، مما وضع قطاع الذكاء الاصطناعي تحت الضغط .. 🇺🇸
📌 مؤشر Dow_Jones يرتفع بنحو 0.10%
📌 مؤشر S&P 500 يغلق على تراجع بنسبة 0.47%
📌 مؤشر Nasdaq ينخفض بنحو 1.25%
$NVDAB
$SPX
$AAPLB
#Nasdaq100 #SP500 #DowJones
58

·
--
බෙයාරිෂ්
S&P 500 Pulls Back From ATH — Is 7,677 the Next Target?
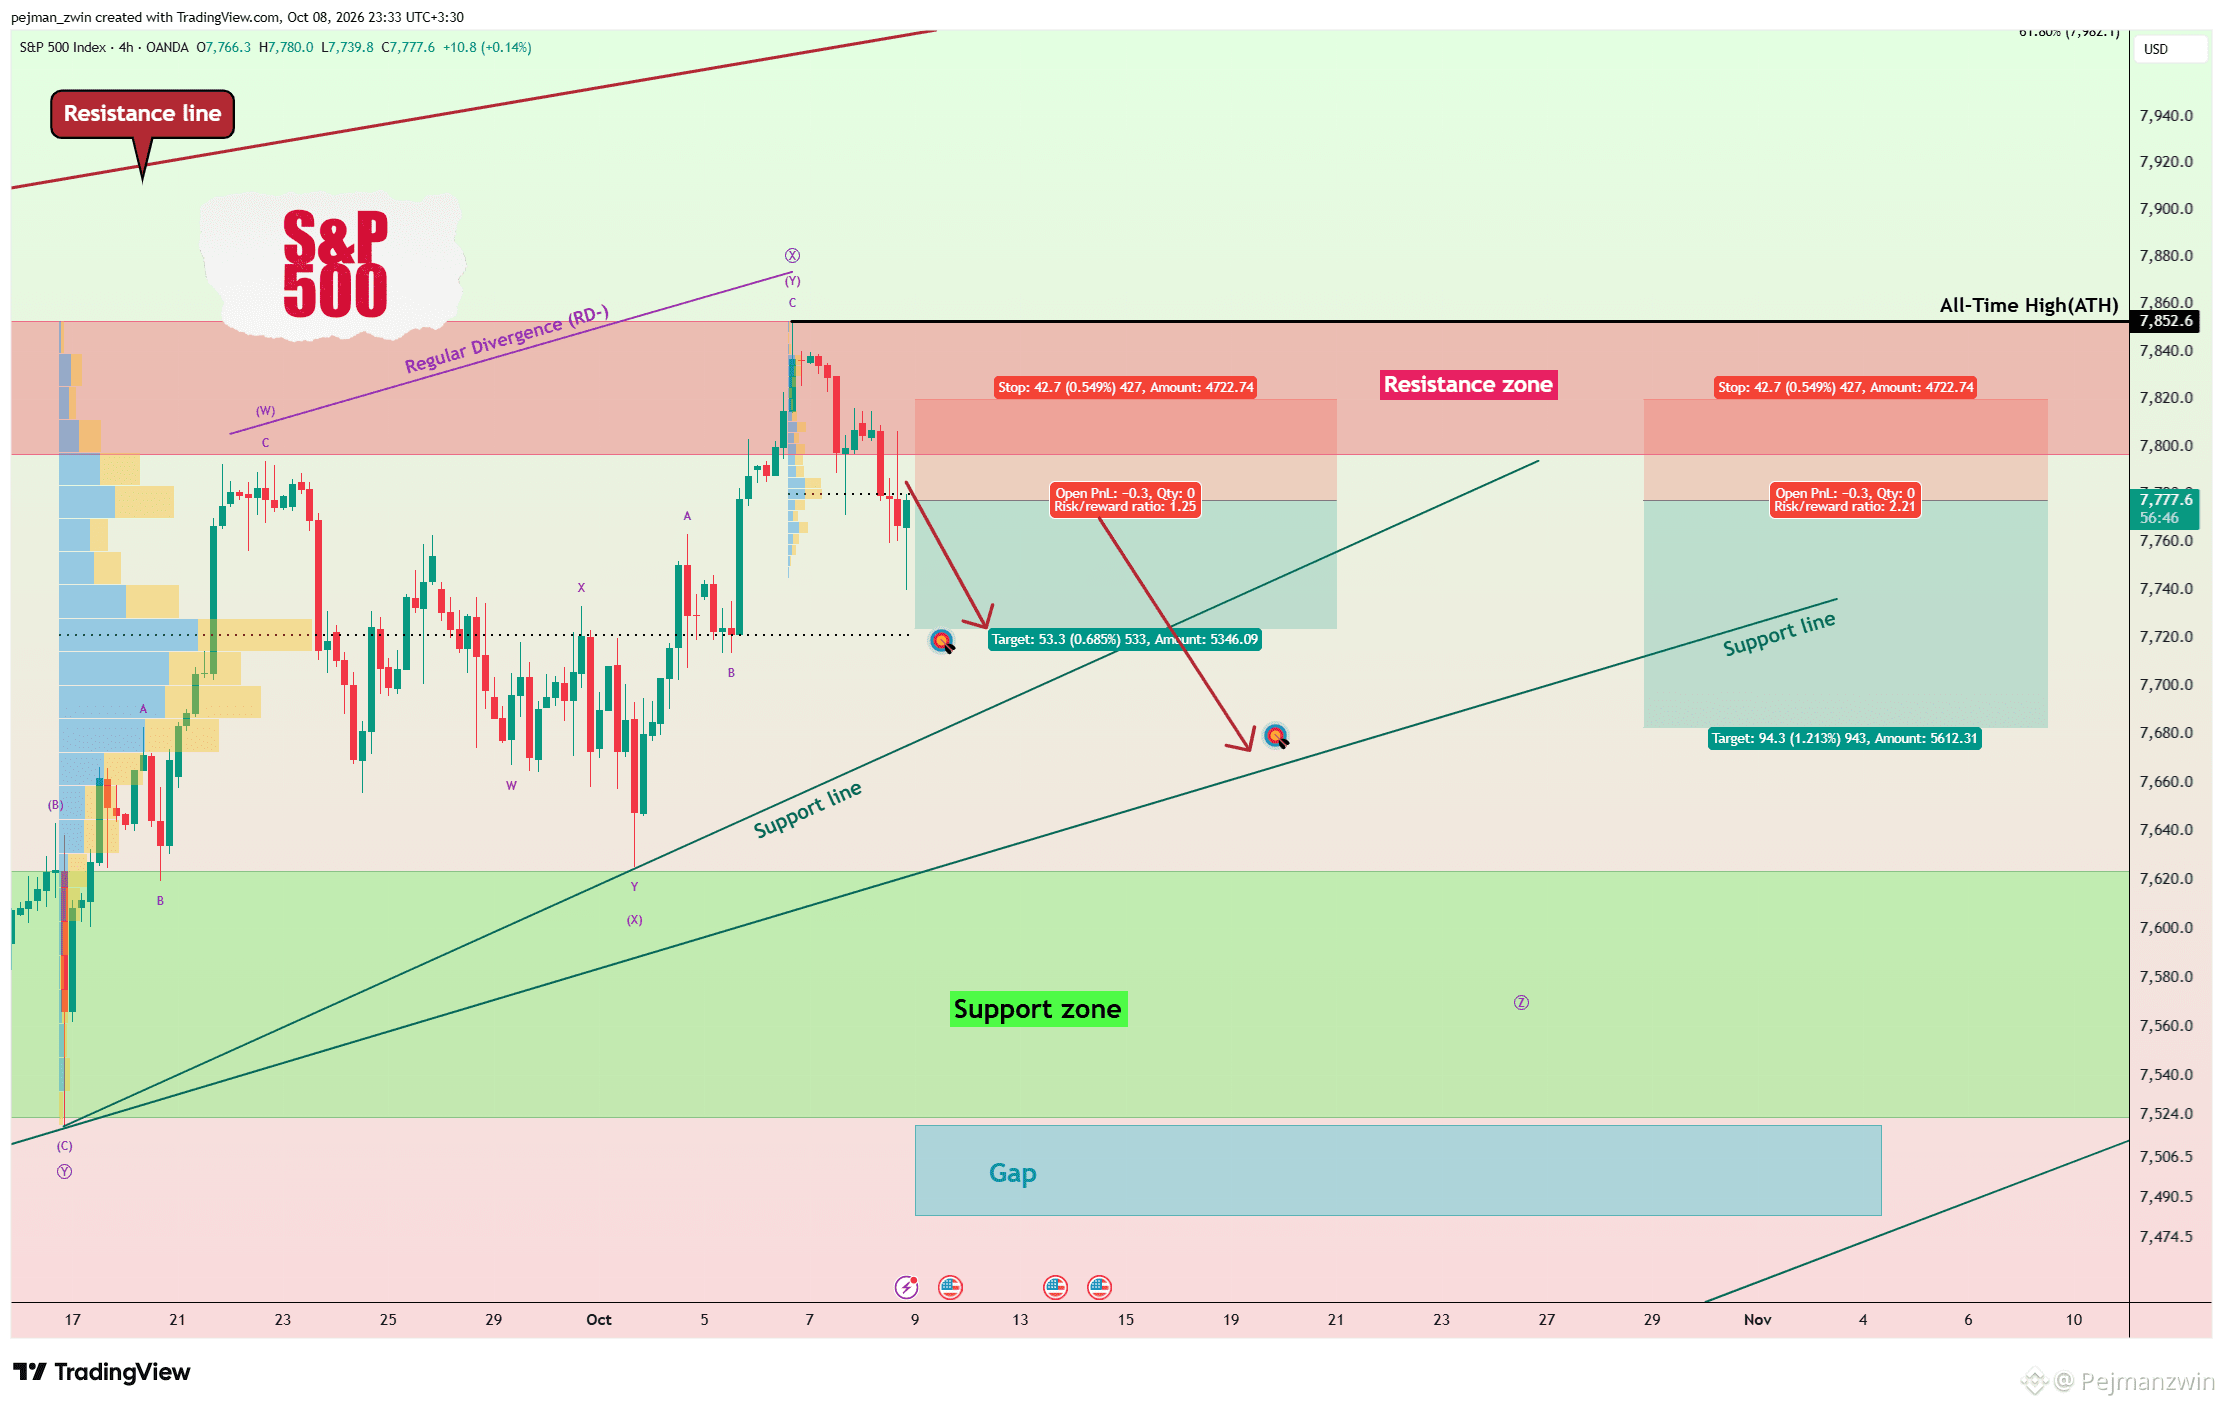
The S&P 500 has started to decline over the past two days after reaching new All-Time Highs (ATH) and is now trading near an important Resistance Zone.
After the recent rally, short-term momentum is beginning to show signs of weakness.
From an Elliott Wave perspective, the S&P 500 appears to be developing a Triple Three Correction (W-X-Y-X-Z), with Wave X seemingly completed.
A Negative Regular Divergence (RD-) is also visible between two Consecutive Peaks, providing another warning that bullish momentum may be weakening.
I expect the index to continue lower toward 7,724.
The key level is 7,720.
If the S&P 500 confirms a breakdown below this level, the correction could extend toward the next major trading level around 7,677.
Trade Setup
First TP: 7,724
Second TP: 7,683
Stop Loss: 7,820
Key Levels: 7,780 | 7,720 | 7,677
A sharp decline in U.S. equities could also create additional pressure on Bitcoin and the broader crypto market, particularly if a broader Risk-Off move develops.
Geopolitical tensions in the Middle East also remain an important source of uncertainty, meaning headlines could quickly increase volatility across equity markets.
Which level will the S&P 500 reach first?
🔴 7,683
🟢 7,820
#SP500
S&P 500 Pulls Back From ATH — Is 7,677 the Next Target?
The S&P 500 has started to decline over the past two days after reaching new All-Time Highs (ATH) and is now trading near an important Resistance Zone.
After the recent rally, short-term momentum is beginning to show signs of weakness.
From an Elliott Wave perspective, the S&P 500 appears to be developing a Triple Three Correction (W-X-Y-X-Z), with Wave X seemingly completed.
A Negative Regular Divergence (RD-) is also visible between two Consecutive Peaks, providing another warning that bullish momentum may be weakening.
I expect the index to continue lower toward 7,724.
The key level is 7,720.
If the S&P 500 confirms a breakdown below this level, the correction could extend toward the next major trading level around 7,677.
Trade Setup
First TP: 7,724
Second TP: 7,683
Stop Loss: 7,820
Key Levels: 7,780 | 7,720 | 7,677
A sharp decline in U.S. equities could also create additional pressure on Bitcoin and the broader crypto market, particularly if a broader Risk-Off move develops.
Geopolitical tensions in the Middle East also remain an important source of uncertainty, meaning headlines could quickly increase volatility across equity markets.
Which level will the S&P 500 reach first?
🔴 7,683
🟢 7,820
#SP500
The S&P 500 has started to decline over the past two days after reaching new All-Time Highs (ATH) and is now trading near an important Resistance Zone.
After the recent rally, short-term momentum is beginning to show signs of weakness.
From an Elliott Wave perspective, the S&P 500 appears to be developing a Triple Three Correction (W-X-Y-X-Z), with Wave X seemingly completed.
A Negative Regular Divergence (RD-) is also visible between two Consecutive Peaks, providing another warning that bullish momentum may be weakening.
I expect the index to continue lower toward 7,724.
The key level is 7,720.
If the S&P 500 confirms a breakdown below this level, the correction could extend toward the next major trading level around 7,677.
Trade Setup
First TP: 7,724
Second TP: 7,683
Stop Loss: 7,820
Key Levels: 7,780 | 7,720 | 7,677
A sharp decline in U.S. equities could also create additional pressure on Bitcoin and the broader crypto market, particularly if a broader Risk-Off move develops.
Geopolitical tensions in the Middle East also remain an important source of uncertainty, meaning headlines could quickly increase volatility across equity markets.
Which level will the S&P 500 reach first?
🔴 7,683
🟢 7,820
#SP500
1
78

·
--
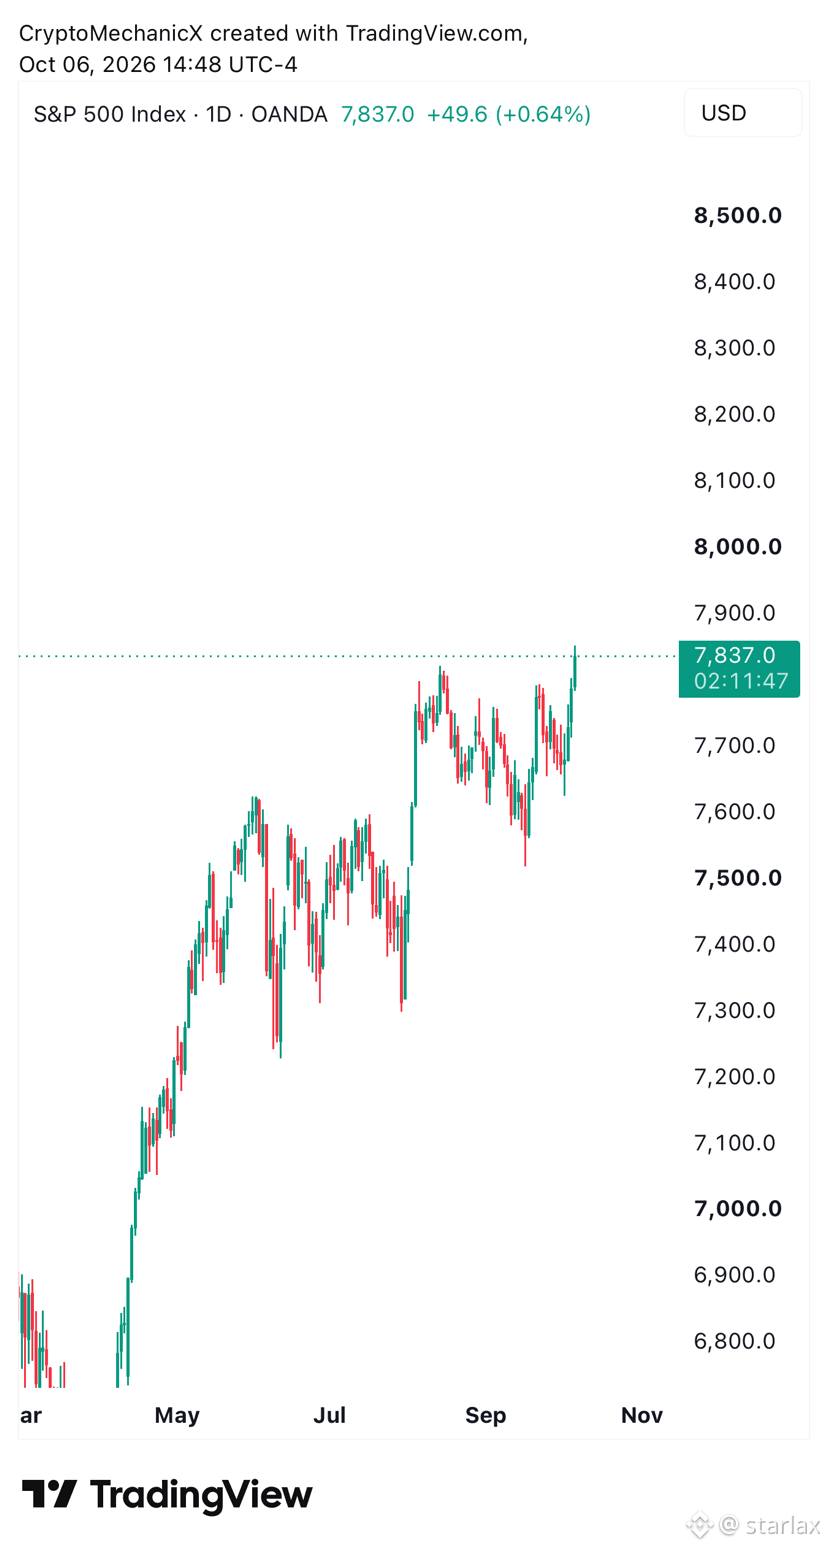
$SPX hits a new all-time high… and then there’s this 👀📉
Record highs don’t always mean everything underneath is strong—watch the next move closely.
Reuters
#SPX #SP500 #Trading #priceaction #forextrading
{future}(SPXUSDT)
$SPX hits a new all-time high… and then there’s this 👀📉
Record highs don’t always mean everything underneath is strong—watch the next move closely.
Reuters
#SPX #SP500 #Trading #priceaction #forextrading
Record highs don’t always mean everything underneath is strong—watch the next move closely.
Reuters
#SPX #SP500 #Trading #priceaction #forextrading
138


·
--
සත්යායනය කළ
美股又疯了!标普500、纳指双双历史新高
油价破100美元、美债收益率飙升,美股却还在创新高!
10月6日美股收盘:
👉 标普500:7,818.93点,+0.58%
👉 纳指:27,599.79点,+0.45%
👉 两大指数同时刷新历史收盘纪录
👉 标普500今年以来已经上涨约 14.2%,纳指上涨约 18.7%。
更有意思的是,推动这轮行情的核心依然是:
AI + 科技巨头 + 企业盈利预期。
市场预计标普500成分股三季度盈利同比增长约 30.6%,科技板块盈利预期更是增长约 66.5%。
但另一边也出现了明显分化:
小盘股还没回到历史高点,等权重标普500距离纪录也还有5%以上。
所以现在的美股,更像是一场AI驱动的结构性牛市。
问题来了:
当标普500、纳指不断创新高,BTC能不能重新跟上这波风险资产行情?
#SP500 #NASDAQ #BTC #标普500与纳指创历史新高
美股又疯了!标普500、纳指双双历史新高
油价破100美元、美债收益率飙升,美股却还在创新高!
10月6日美股收盘:
👉 标普500:7,818.93点,+0.58%
👉 纳指:27,599.79点,+0.45%
👉 两大指数同时刷新历史收盘纪录
👉 标普500今年以来已经上涨约 14.2%,纳指上涨约 18.7%。
更有意思的是,推动这轮行情的核心依然是:
AI + 科技巨头 + 企业盈利预期。
市场预计标普500成分股三季度盈利同比增长约 30.6%,科技板块盈利预期更是增长约 66.5%。
但另一边也出现了明显分化:
小盘股还没回到历史高点,等权重标普500距离纪录也还有5%以上。
所以现在的美股,更像是一场AI驱动的结构性牛市。
问题来了:
当标普500、纳指不断创新高,BTC能不能重新跟上这波风险资产行情?
#SP500 #NASDAQ #BTC #标普500与纳指创历史新高
油价破100美元、美债收益率飙升,美股却还在创新高!
10月6日美股收盘:
👉 标普500:7,818.93点,+0.58%
👉 纳指:27,599.79点,+0.45%
👉 两大指数同时刷新历史收盘纪录
👉 标普500今年以来已经上涨约 14.2%,纳指上涨约 18.7%。
更有意思的是,推动这轮行情的核心依然是:
AI + 科技巨头 + 企业盈利预期。
市场预计标普500成分股三季度盈利同比增长约 30.6%,科技板块盈利预期更是增长约 66.5%。
但另一边也出现了明显分化:
小盘股还没回到历史高点,等权重标普500距离纪录也还有5%以上。
所以现在的美股,更像是一场AI驱动的结构性牛市。
问题来了:
当标普500、纳指不断创新高,BTC能不能重新跟上这波风险资产行情?
#SP500 #NASDAQ #BTC #标普500与纳指创历史新高
1.5k

·
--
🚨 U.S. Stock Market: Record Highs but Risks Remain! 📊
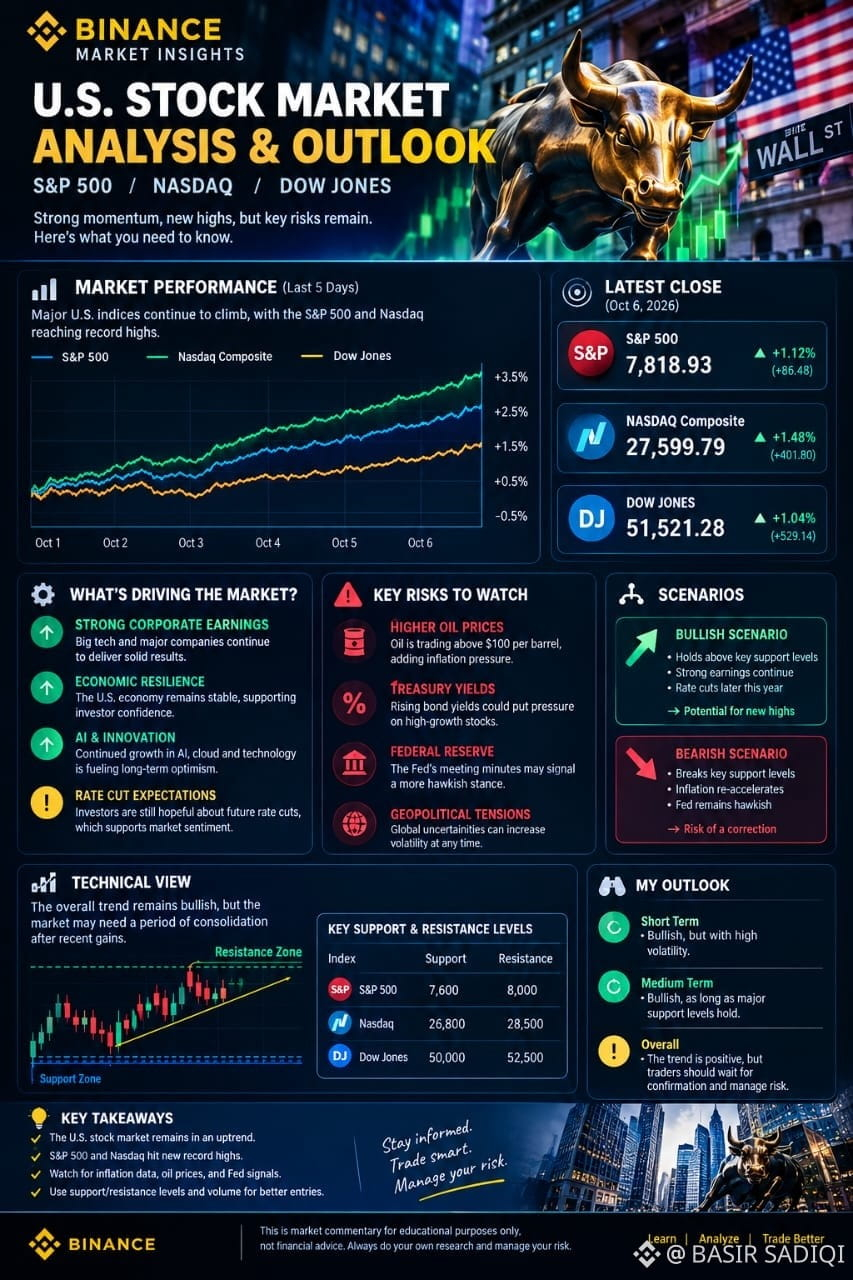
The U.S. stock market remains in a strong bullish trend, with the S&P 500 and Nasdaq recently reaching record closing highs.
🔎 What is driving the market?
🟢 Strong corporate earnings
🟢 AI & technology growth
🟢 Interest-rate expectations
📈 Technical Outlook
S&P 500: Support 7,600 | Resistance 8,000
Nasdaq: Support 26,800 | Resistance 28,500
Dow Jones: Support 50,000 | Resistance 52,500
⚠️ Key Risks
🔴 Higher oil prices and inflation
🔴 Rising Treasury yields
🔴 Geopolitical uncertainty
🎯 My Overall View
Short term: 🟢 Bullish but volatile
Medium term: 🟢 Moderately bullish
Risk level: 🟡 Elevated
What's your outlook for this week? Bullish or Bearish? Let me know! 👇
Follow me for more daily market insights! 🔔
⚠️ Educational purposes only. Not financial advice.
#StockMarket #Crypto #SP500
🚨 U.S. Stock Market: Record Highs but Risks Remain! 📊
The U.S. stock market remains in a strong bullish trend, with the S&P 500 and Nasdaq recently reaching record closing highs.
🔎 What is driving the market?
🟢 Strong corporate earnings
🟢 AI & technology growth
🟢 Interest-rate expectations
📈 Technical Outlook
S&P 500: Support 7,600 | Resistance 8,000
Nasdaq: Support 26,800 | Resistance 28,500
Dow Jones: Support 50,000 | Resistance 52,500
⚠️ Key Risks
🔴 Higher oil prices and inflation
🔴 Rising Treasury yields
🔴 Geopolitical uncertainty
🎯 My Overall View
Short term: 🟢 Bullish but volatile
Medium term: 🟢 Moderately bullish
Risk level: 🟡 Elevated
What's your outlook for this week? Bullish or Bearish? Let me know! 👇
Follow me for more daily market insights! 🔔
⚠️ Educational purposes only. Not financial advice.
#StockMarket #Crypto #SP500
The U.S. stock market remains in a strong bullish trend, with the S&P 500 and Nasdaq recently reaching record closing highs.
🔎 What is driving the market?
🟢 Strong corporate earnings
🟢 AI & technology growth
🟢 Interest-rate expectations
📈 Technical Outlook
S&P 500: Support 7,600 | Resistance 8,000
Nasdaq: Support 26,800 | Resistance 28,500
Dow Jones: Support 50,000 | Resistance 52,500
⚠️ Key Risks
🔴 Higher oil prices and inflation
🔴 Rising Treasury yields
🔴 Geopolitical uncertainty
🎯 My Overall View
Short term: 🟢 Bullish but volatile
Medium term: 🟢 Moderately bullish
Risk level: 🟡 Elevated
What's your outlook for this week? Bullish or Bearish? Let me know! 👇
Follow me for more daily market insights! 🔔
⚠️ Educational purposes only. Not financial advice.
#StockMarket #Crypto #SP500
3
1
6
89

·
--
උසබ තත්ත්වය
#sp500andnasdaqhitrecordhighs
🚨 WALL STREET JUST HIT NEW RECORDS! 📈🔥
The S&P 500 and Nasdaq have both reached fresh all-time highs, showing powerful momentum across U.S. equities.
That strength matters for crypto too. 👀
When stocks are pushing into record territory, it can signal strong risk appetite and liquidity across financial markets.
🔹 S&P 500 → fresh record high
🔹 Nasdaq → fresh record high
🔹 Risk sentiment remains strong
🔹 Bitcoin could benefit if this momentum spreads into crypto
🔥 Stocks are breaking records while crypto traders watch for the next move.
Could this risk-on momentum become the fuel Bitcoin needs for its next major breakout?
#SP500 #NASDAQ #bitcoin
#sp500andnasdaqhitrecordhighs
🚨 WALL STREET JUST HIT NEW RECORDS! 📈🔥
The S&P 500 and Nasdaq have both reached fresh all-time highs, showing powerful momentum across U.S. equities.
That strength matters for crypto too. 👀
When stocks are pushing into record territory, it can signal strong risk appetite and liquidity across financial markets.
🔹 S&P 500 → fresh record high
🔹 Nasdaq → fresh record high
🔹 Risk sentiment remains strong
🔹 Bitcoin could benefit if this momentum spreads into crypto
🔥 Stocks are breaking records while crypto traders watch for the next move.
Could this risk-on momentum become the fuel Bitcoin needs for its next major breakout?
#SP500 #NASDAQ #bitcoin
🚨 WALL STREET JUST HIT NEW RECORDS! 📈🔥
The S&P 500 and Nasdaq have both reached fresh all-time highs, showing powerful momentum across U.S. equities.
That strength matters for crypto too. 👀
When stocks are pushing into record territory, it can signal strong risk appetite and liquidity across financial markets.
🔹 S&P 500 → fresh record high
🔹 Nasdaq → fresh record high
🔹 Risk sentiment remains strong
🔹 Bitcoin could benefit if this momentum spreads into crypto
🔥 Stocks are breaking records while crypto traders watch for the next move.
Could this risk-on momentum become the fuel Bitcoin needs for its next major breakout?
#SP500 #NASDAQ #bitcoin
35
·
--
$SPY $BTC
🚨 Wall Street marca nuevos máximos históricos: ¿Es sostenible el rally de la IA?
* **Tecnología e Inteligencia Artificial como motores:** El optimismo continuo en torno a la IA sigue canalizando flujos masivos de capital hacia las grandes tecnológicas, impulsando los índices de EE. UU. a niveles récord 📈.
* **Alivio macroeconómico:** El retroceso en los rendimientos de los bonos soberanos y la estabilización de los precios del petróleo disminuyen la presión inflacionaria, favoreciendo un entorno de mayor liquidez global 🟩.
* **Impacto en los activos de riesgo:** Un escenario de apetito por el riesgo en las acciones tradicionales suele correlacionarse de manera positiva con el mercado de criptoactivos, al mejorar el sentimiento general de los inversores 📊.
📊 ENCUESTA RÁPIDA:
¿Hacia dónde crees que se dirigirá el mercado en el último trimestre del año?
A) Continuará el rally alcista hacia nuevos récords
B) Veremos una corrección saludable a corto plazo
C) El mercado se moverá de forma lateral
👇 ¡Vota en los comentarios con tu letra!
#Macroeconomia #Trading #Acciones #SP500 #Cripto
$SPY $BTC
🚨 Wall Street marca nuevos máximos históricos: ¿Es sostenible el rally de la IA?
* **Tecnología e Inteligencia Artificial como motores:** El optimismo continuo en torno a la IA sigue canalizando flujos masivos de capital hacia las grandes tecnológicas, impulsando los índices de EE. UU. a niveles récord 📈.
* **Alivio macroeconómico:** El retroceso en los rendimientos de los bonos soberanos y la estabilización de los precios del petróleo disminuyen la presión inflacionaria, favoreciendo un entorno de mayor liquidez global 🟩.
* **Impacto en los activos de riesgo:** Un escenario de apetito por el riesgo en las acciones tradicionales suele correlacionarse de manera positiva con el mercado de criptoactivos, al mejorar el sentimiento general de los inversores 📊.
📊 ENCUESTA RÁPIDA:
¿Hacia dónde crees que se dirigirá el mercado en el último trimestre del año?
A) Continuará el rally alcista hacia nuevos récords
B) Veremos una corrección saludable a corto plazo
C) El mercado se moverá de forma lateral
👇 ¡Vota en los comentarios con tu letra!
#Macroeconomia #Trading #Acciones #SP500 #Cripto
🚨 Wall Street marca nuevos máximos históricos: ¿Es sostenible el rally de la IA?
* **Tecnología e Inteligencia Artificial como motores:** El optimismo continuo en torno a la IA sigue canalizando flujos masivos de capital hacia las grandes tecnológicas, impulsando los índices de EE. UU. a niveles récord 📈.
* **Alivio macroeconómico:** El retroceso en los rendimientos de los bonos soberanos y la estabilización de los precios del petróleo disminuyen la presión inflacionaria, favoreciendo un entorno de mayor liquidez global 🟩.
* **Impacto en los activos de riesgo:** Un escenario de apetito por el riesgo en las acciones tradicionales suele correlacionarse de manera positiva con el mercado de criptoactivos, al mejorar el sentimiento general de los inversores 📊.
📊 ENCUESTA RÁPIDA:
¿Hacia dónde crees que se dirigirá el mercado en el último trimestre del año?
A) Continuará el rally alcista hacia nuevos récords
B) Veremos una corrección saludable a corto plazo
C) El mercado se moverá de forma lateral
👇 ¡Vota en los comentarios con tu letra!
#Macroeconomia #Trading #Acciones #SP500 #Cripto
22

🚨 S&P 500 HITS A NEW ALL-TIME HIGH! 📈🔥
The S&P 500 has pushed above 7,835, taking the total market value of its companies above $71 TRILLION for the first time! 💰
The rally is being driven by:
🤖 Strong AI & Tech stocks
📊 Positive earnings expectations
🛢️ Lower oil prices
📉 Lower Treasury yields
💪 Strong investor sentiment
When traditional markets show this kind of strength, risk assets like crypto can also benefit from improving market sentiment. 👀
Watching $BTC $ETH $SOL closely from here. 🚀
Do you think Bitcoin can follow the S&P 500 to new highs? 👇
#SP500 #Bitcoin #BTC #ETH #SOL #crypto #AI #StockMarket #BinanceSquare
🚨 S&P 500 HITS A NEW ALL-TIME HIGH! 📈🔥
The S&P 500 has pushed above 7,835, taking the total market value of its companies above $71 TRILLION for the first time! 💰
The rally is being driven by:
🤖 Strong AI & Tech stocks
📊 Positive earnings expectations
🛢️ Lower oil prices
📉 Lower Treasury yields
💪 Strong investor sentiment
When traditional markets show this kind of strength, risk assets like crypto can also benefit from improving market sentiment. 👀
Watching $BTC $ETH $SOL closely from here. 🚀
Do you think Bitcoin can follow the S&P 500 to new highs? 👇
#SP500 #Bitcoin #BTC #ETH #SOL #crypto #AI #StockMarket #BinanceSquare
The S&P 500 has pushed above 7,835, taking the total market value of its companies above $71 TRILLION for the first time! 💰
The rally is being driven by:
🤖 Strong AI & Tech stocks
📊 Positive earnings expectations
🛢️ Lower oil prices
📉 Lower Treasury yields
💪 Strong investor sentiment
When traditional markets show this kind of strength, risk assets like crypto can also benefit from improving market sentiment. 👀
Watching $BTC $ETH $SOL closely from here. 🚀
Do you think Bitcoin can follow the S&P 500 to new highs? 👇
#SP500 #Bitcoin #BTC #ETH #SOL #crypto #AI #StockMarket #BinanceSquare
3
111
තවත් අන්තර්ගතයන් ගවේෂණය කිරීමට ඇතුල් වන්න
Binance චතුරශ්රය හි ගෝලීය ක්රිප්ටෝ පරිශීලකයින් හා එක්වන්න
⚡️ ක්රිප්ටෝ පිළිබඳ නවතම සහ ප්රයෝජනවත් තොරතුරු ලබා ගන්න.
💬 ලොව විශාලතම ක්රිප්ටෝ හුවමාරුව මගින් විශ්වාස කෙරේ.
👍 සත්යායනය කරන ලද නිර්මාණකරුවන්ගෙන් සැබෑ විදසුන් සොයා ගන්න.
විද්යුත් තැපෑල / දුරකථන අංකය
නැගී එන මාතෘකා
1
#BinancePick
2.9M නැරඹීම්
151,338 සාකච්ඡා කරමින්
2
#EarningsSeason
5.2M නැරඹීම්
25,748 සාකච්ඡා කරමින්
3
#AnthropicTTMRevenueGrewAbout1200%
16,221 නැරඹීම්
315 සාකච්ඡා කරමින්
4
#AnthropicS1ExpectedToday
18,537 නැරඹීම්
286 සාකච්ඡා කරමින්
5
#SouthKoreaReportedlyWeighsFourthCryptoTaxDelay
24,144 නැරඹීම්
409 සාකච්ඡා කරමින්
6
#FranklinTempletonFilesForTwoDividendToBitcoinETFs
31,785 නැරඹීම්
504 සාකච්ඡා කරමින්
7
#StrategyMSTRSurpassesNasdaqInMarketCap
24,548 නැරඹීම්
366 සාකච්ඡා කරමින්
8
#CanadaProposesStablecoinRedemptionWithin3BusinessDays
1,134 නැරඹීම්
34 සාකච්ඡා කරමින්
9
#ElectrumWalletBugLetRogueServersStealFunds
26,549 නැරඹීම්
443 සාකච්ඡා කරමින්
10
#ArgentineCourtDismissesLIBRACaseAgainstMilei
40,447 නැරඹීම්
550 සාකච්ඡා කරමින්