
#markettrends
markettrends
3.1M නැරඹීම්
6,464 සාකච්ඡා කරමින්
උණුසුම්
නවතම


·
--
ලිපිය
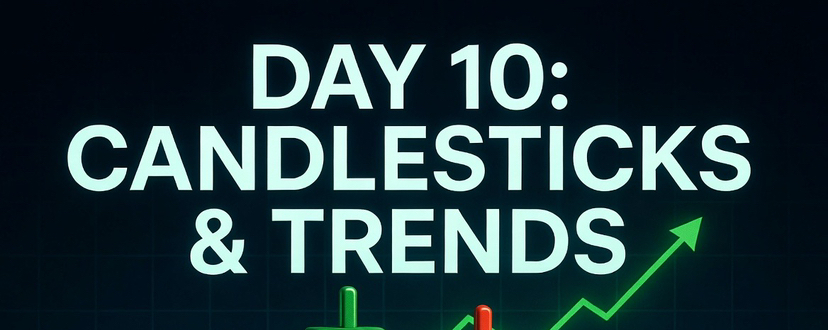
How to Read Candlestick Charts and Identify TrendsWelcome to the tenth day of our educational series, marking a major milestone in your trading journey! Now that you have mastered how to execute and automate your orders, we are officially shifting our focus away from the mechanics of the platform and moving directly into market analysis. Today, we are unlocking the primary language of global market analysts: Japanese Candlestick Charts and Market Trends. Learning to read these visual data points allows you to see exactly who is winning the psychological battle between buyers and sellers in real time.
The Anatomy of a Candlestick
A standard candlestick chart compresses a massive amount of market trading data into simple, highly visual shapes. Each individual candle represents price action over a specific, chosen timeframe—whether it is 15 minutes, 4 hours, or an entire day.
Every single candlestick is composed of two primary elements: the Real Body and the Wicks (also known as shadows).
The Real Body: The thick, colored center of the candle represents the exact distance between the Open Price (where the timeframe started) and the Close Price (where the timeframe ended).
Green (Bullish) Candle: Occurs when the closing price is higher than the opening price, indicating strong buying pressure.
Red (Bearish) Candle: Occurs when the closing price is lower than the opening price, indicating aggressive selling pressure.
The Wicks (Shadows): The thin lines extending from the top and bottom of the real body display the absolute High and Low prices touched during that specific timeframe, showing how far the market stretched before snapping back toward the body.
The Three Directions of Market Trends
Prices do not move in straight lines; they move in waves or zig-zag patterns. By connecting these waves over a larger timeframe, you can identify the macro direction of the asset, commonly referred to as the trend. The market moves in one of three distinct directions:
Uptrend (Bull Market): Characterized by a consecutive series of Higher Highs (HH) and Higher Lows (HL). This indicates that buyers are constantly willing to buy the asset at a premium, pushing the floor price higher with each wave.
Downtrend (Bear Market): Characterized by a consecutive series of Lower Highs (LH) and Lower Lows (LL). This shows that sellers are dominating the market, dumping assets aggressively and driving the floor price down.
Sideways Trend (Consolidation): Occurs when the price bounces back and forth within a flat horizontal range, unable to break above an upper ceiling or fall below a lower floor. This indicates a state of equilibrium and indecision between buyers and sellers.
Creator's Advice: Trade with the Trend, Not Against It
The most valuable rule for any technical analyst is a classic industry maxim: "The trend is your friend." Trying to guess the exact bottom of a brutal downtrend or shorting the absolute peak of a parabolic uptrend is a quick way to deplete your capital. Your probability of execution success increases dramatically when you align your trades with the dominant market direction. Look at the macro charts first to establish the overall trend before zooming in to execute your strategy.
Tomorrow, we will build upon this visual foundation by diving into the world of Support and Resistance, teaching you how to identify key psychological levels where prices are highly likely to bounce or break out. For today, your practical homework is to open any digital asset chart in Pro mode, change the timeframe to the 1-Day (1D) setting, and trace whether the asset has been making higher highs or lower lows over the last few weeks.
#CryptoAnalysis #CandlestickCharts #MarketTrends #TechnicalAnalysis
How to Read Candlestick Charts and Identify Trends
Welcome to the tenth day of our educational series, marking a major milestone in your trading journey! Now that you have mastered how to execute and automate your orders, we are officially shifting our focus away from the mechanics of the platform and moving directly into market analysis. Today, we are unlocking the primary language of global market analysts: Japanese Candlestick Charts and Market Trends. Learning to read these visual data points allows you to see exactly who is winning the psychological battle between buyers and sellers in real time.
The Anatomy of a Candlestick
A standard candlestick chart compresses a massive amount of market trading data into simple, highly visual shapes. Each individual candle represents price action over a specific, chosen timeframe—whether it is 15 minutes, 4 hours, or an entire day.
Every single candlestick is composed of two primary elements: the Real Body and the Wicks (also known as shadows).
The Real Body: The thick, colored center of the candle represents the exact distance between the Open Price (where the timeframe started) and the Close Price (where the timeframe ended).
Green (Bullish) Candle: Occurs when the closing price is higher than the opening price, indicating strong buying pressure.
Red (Bearish) Candle: Occurs when the closing price is lower than the opening price, indicating aggressive selling pressure.
The Wicks (Shadows): The thin lines extending from the top and bottom of the real body display the absolute High and Low prices touched during that specific timeframe, showing how far the market stretched before snapping back toward the body.
The Three Directions of Market Trends
Prices do not move in straight lines; they move in waves or zig-zag patterns. By connecting these waves over a larger timeframe, you can identify the macro direction of the asset, commonly referred to as the trend. The market moves in one of three distinct directions:
Uptrend (Bull Market): Characterized by a consecutive series of Higher Highs (HH) and Higher Lows (HL). This indicates that buyers are constantly willing to buy the asset at a premium, pushing the floor price higher with each wave.
Downtrend (Bear Market): Characterized by a consecutive series of Lower Highs (LH) and Lower Lows (LL). This shows that sellers are dominating the market, dumping assets aggressively and driving the floor price down.
Sideways Trend (Consolidation): Occurs when the price bounces back and forth within a flat horizontal range, unable to break above an upper ceiling or fall below a lower floor. This indicates a state of equilibrium and indecision between buyers and sellers.
Creator's Advice: Trade with the Trend, Not Against It
The most valuable rule for any technical analyst is a classic industry maxim: "The trend is your friend." Trying to guess the exact bottom of a brutal downtrend or shorting the absolute peak of a parabolic uptrend is a quick way to deplete your capital. Your probability of execution success increases dramatically when you align your trades with the dominant market direction. Look at the macro charts first to establish the overall trend before zooming in to execute your strategy.
Tomorrow, we will build upon this visual foundation by diving into the world of Support and Resistance, teaching you how to identify key psychological levels where prices are highly likely to bounce or break out. For today, your practical homework is to open any digital asset chart in Pro mode, change the timeframe to the 1-Day (1D) setting, and trace whether the asset has been making higher highs or lower lows over the last few weeks.
#CryptoAnalysis #CandlestickCharts #MarketTrends #TechnicalAnalysis
The Anatomy of a Candlestick
A standard candlestick chart compresses a massive amount of market trading data into simple, highly visual shapes. Each individual candle represents price action over a specific, chosen timeframe—whether it is 15 minutes, 4 hours, or an entire day.
Every single candlestick is composed of two primary elements: the Real Body and the Wicks (also known as shadows).
The Real Body: The thick, colored center of the candle represents the exact distance between the Open Price (where the timeframe started) and the Close Price (where the timeframe ended).
Green (Bullish) Candle: Occurs when the closing price is higher than the opening price, indicating strong buying pressure.
Red (Bearish) Candle: Occurs when the closing price is lower than the opening price, indicating aggressive selling pressure.
The Wicks (Shadows): The thin lines extending from the top and bottom of the real body display the absolute High and Low prices touched during that specific timeframe, showing how far the market stretched before snapping back toward the body.
The Three Directions of Market Trends
Prices do not move in straight lines; they move in waves or zig-zag patterns. By connecting these waves over a larger timeframe, you can identify the macro direction of the asset, commonly referred to as the trend. The market moves in one of three distinct directions:
Uptrend (Bull Market): Characterized by a consecutive series of Higher Highs (HH) and Higher Lows (HL). This indicates that buyers are constantly willing to buy the asset at a premium, pushing the floor price higher with each wave.
Downtrend (Bear Market): Characterized by a consecutive series of Lower Highs (LH) and Lower Lows (LL). This shows that sellers are dominating the market, dumping assets aggressively and driving the floor price down.
Sideways Trend (Consolidation): Occurs when the price bounces back and forth within a flat horizontal range, unable to break above an upper ceiling or fall below a lower floor. This indicates a state of equilibrium and indecision between buyers and sellers.
Creator's Advice: Trade with the Trend, Not Against It
The most valuable rule for any technical analyst is a classic industry maxim: "The trend is your friend." Trying to guess the exact bottom of a brutal downtrend or shorting the absolute peak of a parabolic uptrend is a quick way to deplete your capital. Your probability of execution success increases dramatically when you align your trades with the dominant market direction. Look at the macro charts first to establish the overall trend before zooming in to execute your strategy.
Tomorrow, we will build upon this visual foundation by diving into the world of Support and Resistance, teaching you how to identify key psychological levels where prices are highly likely to bounce or break out. For today, your practical homework is to open any digital asset chart in Pro mode, change the timeframe to the 1-Day (1D) setting, and trace whether the asset has been making higher highs or lower lows over the last few weeks.
#CryptoAnalysis #CandlestickCharts #MarketTrends #TechnicalAnalysis
7
1
10
723

🇺🇸 TRUMP, CRYPTO & BITCOIN: WHAT'S NEXT FOR THE MARKET? ₿
Donald Trump's political decisions and US economic policies continue to influence global financial markets, including cryptocurrency. 🇺🇸
📊 Bitcoin Market Outlook
$BTC remains sensitive to political developments, regulatory uncertainty, and global economic conditions. Recent market volatility shows why traders should watch key support and resistance levels carefully.
🔥 Key Things to Watch:
• US crypto regulations and government policies.
• Trump's influence on crypto market sentiment.
• Bitcoin buying and selling pressure.
• Institutional demand and market liquidity.
💡 My View: Political headlines can create short-term volatility, but Bitcoin's long-term direction depends on broader adoption, liquidity, and market demand.
Are Trump's policies bullish or bearish for Bitcoin? 🤔
👇 Share your thoughts!
#Bitcoin #$BTC #TRUMP #cryptouniverseofficial
{spot}(BTCUSDT)
#Binance #CryptoAnalysis #MarketTrends #Trading
🇺🇸 TRUMP, CRYPTO & BITCOIN: WHAT'S NEXT FOR THE MARKET? ₿
Donald Trump's political decisions and US economic policies continue to influence global financial markets, including cryptocurrency. 🇺🇸
📊 Bitcoin Market Outlook
$BTC remains sensitive to political developments, regulatory uncertainty, and global economic conditions. Recent market volatility shows why traders should watch key support and resistance levels carefully.
🔥 Key Things to Watch:
• US crypto regulations and government policies.
• Trump's influence on crypto market sentiment.
• Bitcoin buying and selling pressure.
• Institutional demand and market liquidity.
💡 My View: Political headlines can create short-term volatility, but Bitcoin's long-term direction depends on broader adoption, liquidity, and market demand.
Are Trump's policies bullish or bearish for Bitcoin? 🤔
👇 Share your thoughts!
#Bitcoin #$BTC #TRUMP #cryptouniverseofficial
#Binance #CryptoAnalysis #MarketTrends #Trading
Donald Trump's political decisions and US economic policies continue to influence global financial markets, including cryptocurrency. 🇺🇸
📊 Bitcoin Market Outlook
$BTC remains sensitive to political developments, regulatory uncertainty, and global economic conditions. Recent market volatility shows why traders should watch key support and resistance levels carefully.
🔥 Key Things to Watch:
• US crypto regulations and government policies.
• Trump's influence on crypto market sentiment.
• Bitcoin buying and selling pressure.
• Institutional demand and market liquidity.
💡 My View: Political headlines can create short-term volatility, but Bitcoin's long-term direction depends on broader adoption, liquidity, and market demand.
Are Trump's policies bullish or bearish for Bitcoin? 🤔
👇 Share your thoughts!
#Bitcoin #$BTC #TRUMP #cryptouniverseofficial
#Binance #CryptoAnalysis #MarketTrends #Trading
212

·
--
比特币ETF资金流出16亿美元,股市却迎来逢低买入热潮!这波资金流向背后藏着什么信号?$BTC #BitcoinETF #市场趋势
Bitcoin ETFs saw $1.6 billion outflows in November while equity markets are experiencing dip buying frenzy. What's behind this capital shift? $BTC #BitcoinETF #MarketTrends
比特币ETF资金流出16亿美元,股市却迎来逢低买入热潮!这波资金流向背后藏着什么信号?$BTC #BitcoinETF #市场趋势
Bitcoin ETFs saw $1.6 billion outflows in November while equity markets are experiencing dip buying frenzy. What's behind this capital shift? $BTC #BitcoinETF #MarketTrends
Bitcoin ETFs saw $1.6 billion outflows in November while equity markets are experiencing dip buying frenzy. What's behind this capital shift? $BTC #BitcoinETF #MarketTrends
60
·
--
A股培育钻石概念股集体大涨,力量钻石飙涨近10%。传统市场的火热表明人们对替代钻石的投资需求正在上升。这可能预示着加密世界中钻石主题NFT和相关代币的潜力正在被市场重新评估。关注市场趋势变化!
A-share cultivated diamond stocks are surging, with Liliang Diamond jumping nearly 10%. This rally in traditional markets shows growing demand for alternative diamond investments. It may signal renewed market interest in diamond-themed NFTs and related tokens in the crypto space. Keep an eye on these trends!
#MarketTrends $DIAM
A股培育钻石概念股集体大涨,力量钻石飙涨近10%。传统市场的火热表明人们对替代钻石的投资需求正在上升。这可能预示着加密世界中钻石主题NFT和相关代币的潜力正在被市场重新评估。关注市场趋势变化!
A-share cultivated diamond stocks are surging, with Liliang Diamond jumping nearly 10%. This rally in traditional markets shows growing demand for alternative diamond investments. It may signal renewed market interest in diamond-themed NFTs and related tokens in the crypto space. Keep an eye on these trends!
#MarketTrends $DIAM
A-share cultivated diamond stocks are surging, with Liliang Diamond jumping nearly 10%. This rally in traditional markets shows growing demand for alternative diamond investments. It may signal renewed market interest in diamond-themed NFTs and related tokens in the crypto space. Keep an eye on these trends!
#MarketTrends $DIAM

$SOL — Solana's recent weekly decline makes its next support test important; strong spot buying and a recovery above resistance could signal that market confidence is returning.
{spot}(SOLUSDT)
$XRP — XRP has faced notable selling pressure during the latest correction; traders should watch whether buyers defend the current support structure or sellers maintain control.
{spot}(XRPUSDT)
$DOGE — Dogecoin remains one of the market's most actively traded meme assets; a rise in volume alongside higher lows could provide an early sign of improving sentiment.
{spot}(DOGEUSDT)
#SOL #XRP #DOGE #CryptoTrading #MarketTrends
$SOL — Solana's recent weekly decline makes its next support test important; strong spot buying and a recovery above resistance could signal that market confidence is returning.
$XRP — XRP has faced notable selling pressure during the latest correction; traders should watch whether buyers defend the current support structure or sellers maintain control.
$DOGE — Dogecoin remains one of the market's most actively traded meme assets; a rise in volume alongside higher lows could provide an early sign of improving sentiment.
#SOL #XRP #DOGE #CryptoTrading #MarketTrends
$XRP — XRP has faced notable selling pressure during the latest correction; traders should watch whether buyers defend the current support structure or sellers maintain control.
$DOGE — Dogecoin remains one of the market's most actively traded meme assets; a rise in volume alongside higher lows could provide an early sign of improving sentiment.
#SOL #XRP #DOGE #CryptoTrading #MarketTrends

4

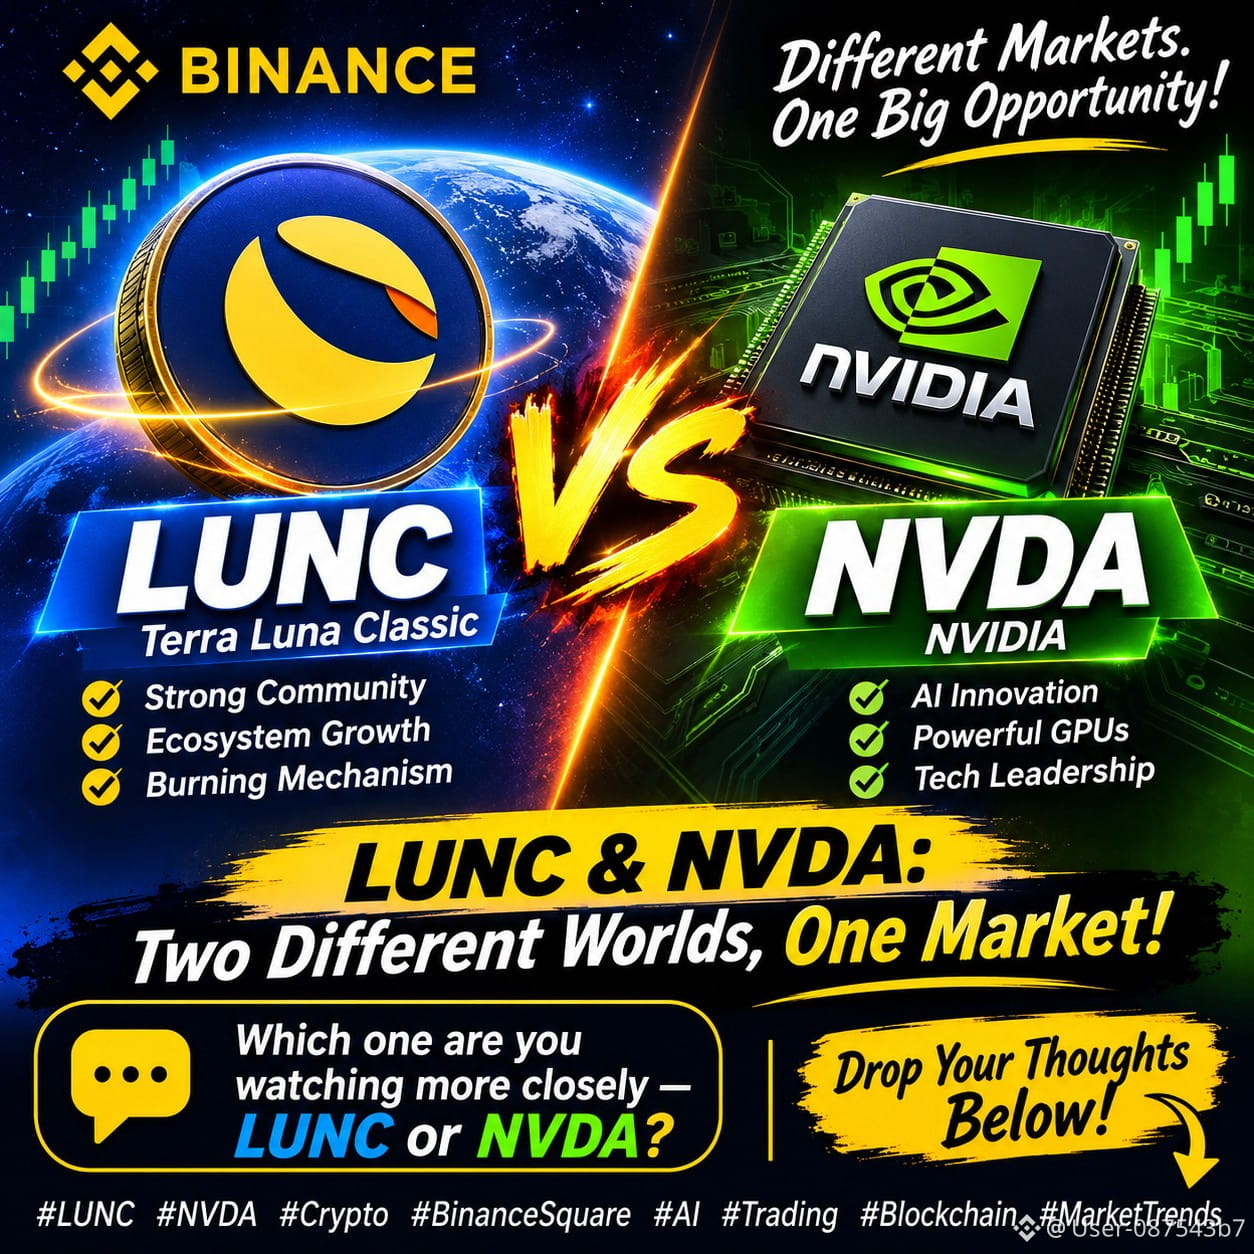
🔥 **LUNC & NVDA: Two Different Worlds, One Market!** 🚀
The crypto and technology markets continue to capture attention, and two names stand out: **Terra Luna Classic (LUNC)** and **NVIDIA (NVDA)**.
🌐 ** $LUNC ** represents the power of community-driven crypto, with its ecosystem, burning mechanism, and dedicated supporters keeping the conversation alive.
💻 ** $NVDA ** remains a major name in AI, GPUs, and high-performance computing, helping shape the future of artificial intelligence.
One is driven by crypto community energy, while the other is fueled by technological innovation.
📊 Different markets. Different opportunities. One thing in common: market sentiment matters!
🔥 Which one are you watching more closely — **LUNC or NVDA?**
Drop your thoughts below and join the discussion! 👇
#LUNC #NVDA #Crypto #BinanceSquare #AI #Trading #Blockchain #MarketTrends
🔥 **LUNC & NVDA: Two Different Worlds, One Market!** 🚀
The crypto and technology markets continue to capture attention, and two names stand out: **Terra Luna Classic (LUNC)** and **NVIDIA (NVDA)**.
🌐 ** $LUNC ** represents the power of community-driven crypto, with its ecosystem, burning mechanism, and dedicated supporters keeping the conversation alive.
💻 ** $NVDA ** remains a major name in AI, GPUs, and high-performance computing, helping shape the future of artificial intelligence.
One is driven by crypto community energy, while the other is fueled by technological innovation.
📊 Different markets. Different opportunities. One thing in common: market sentiment matters!
🔥 Which one are you watching more closely — **LUNC or NVDA?**
Drop your thoughts below and join the discussion! 👇
#LUNC #NVDA #Crypto #BinanceSquare #AI #Trading #Blockchain #MarketTrends
The crypto and technology markets continue to capture attention, and two names stand out: **Terra Luna Classic (LUNC)** and **NVIDIA (NVDA)**.
🌐 ** $LUNC ** represents the power of community-driven crypto, with its ecosystem, burning mechanism, and dedicated supporters keeping the conversation alive.
💻 ** $NVDA ** remains a major name in AI, GPUs, and high-performance computing, helping shape the future of artificial intelligence.
One is driven by crypto community energy, while the other is fueled by technological innovation.
📊 Different markets. Different opportunities. One thing in common: market sentiment matters!
🔥 Which one are you watching more closely — **LUNC or NVDA?**
Drop your thoughts below and join the discussion! 👇
#LUNC #NVDA #Crypto #BinanceSquare #AI #Trading #Blockchain #MarketTrends
4
493

·
--
බෙයාරිෂ්
🔥 THEY ARE LAUGHING AT RETAIL WHILE DRAINING MILLIONS!
While everyone else is blindly guessing, I am watching the big players move. Look at $SNDK
{future}(SNDKUSDT)
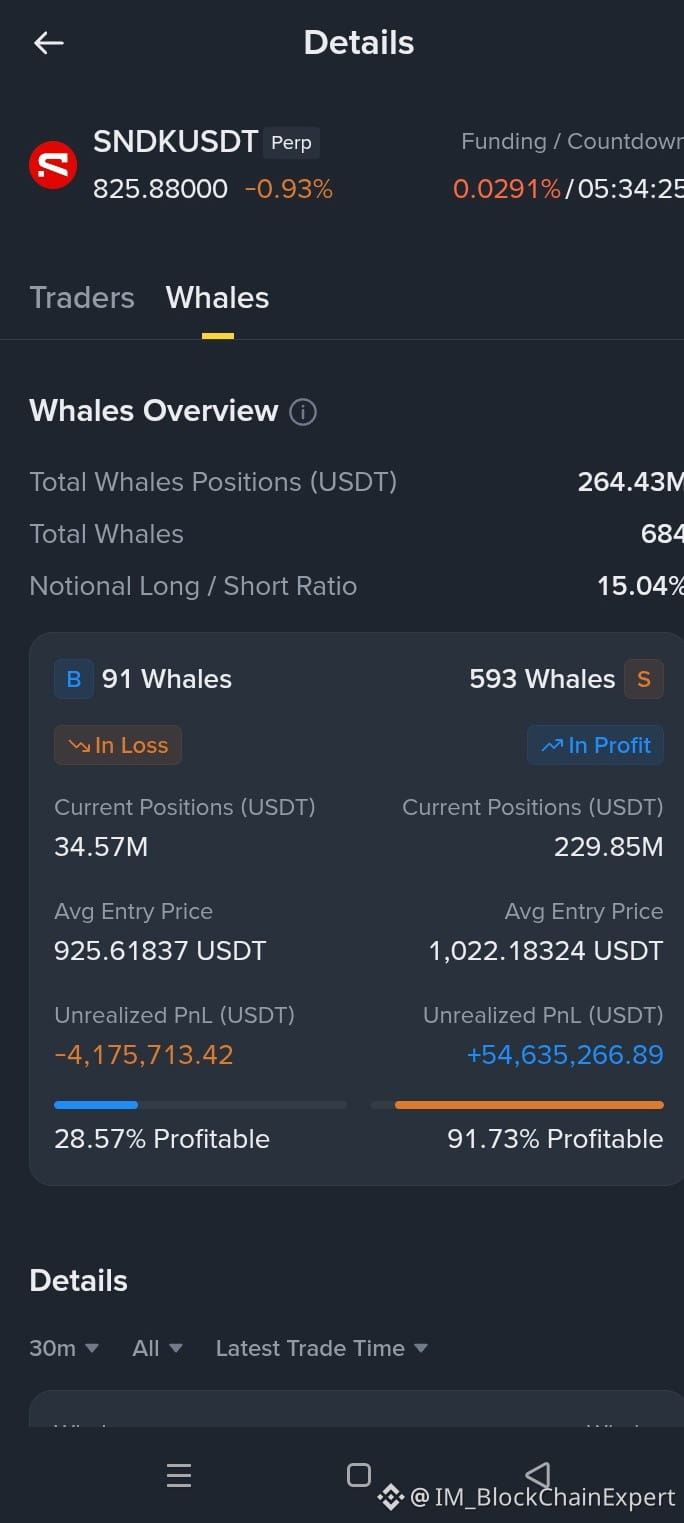
right now—684 whales holding a massive 264.33M positions! But here is the brutal truth that will shock you: 593 shorts are sitting comfortably in a jaw-dropping +$54.63M profit while just 91 longs are bleeding out over -$4.17M in losses! The trap is set, and I am positioning myself carefully before this market decides to violently flush out the remaining liquidity. Are you riding with the smart money or becoming their exit liquidity?
#BinanceSquare #CryptoWhalesHub #TradingPsychology #MarketTrends
🔥 THEY ARE LAUGHING AT RETAIL WHILE DRAINING MILLIONS!
While everyone else is blindly guessing, I am watching the big players move. Look at $SNDK
right now—684 whales holding a massive 264.33M positions! But here is the brutal truth that will shock you: 593 shorts are sitting comfortably in a jaw-dropping +$54.63M profit while just 91 longs are bleeding out over -$4.17M in losses! The trap is set, and I am positioning myself carefully before this market decides to violently flush out the remaining liquidity. Are you riding with the smart money or becoming their exit liquidity?
#BinanceSquare #CryptoWhalesHub #TradingPsychology #MarketTrends
While everyone else is blindly guessing, I am watching the big players move. Look at $SNDK
right now—684 whales holding a massive 264.33M positions! But here is the brutal truth that will shock you: 593 shorts are sitting comfortably in a jaw-dropping +$54.63M profit while just 91 longs are bleeding out over -$4.17M in losses! The trap is set, and I am positioning myself carefully before this market decides to violently flush out the remaining liquidity. Are you riding with the smart money or becoming their exit liquidity?
#BinanceSquare #CryptoWhalesHub #TradingPsychology #MarketTrends
22
Global financial markets are experiencing substantial volatility as digital asset selloffs and technology sector corrections unfold alongside new institutional fund offerings:-
* Crypto Market Liquidations: A sharp crypto selloff triggered $1.03 billion in liquidations.
* Equity Market Rout: A tech-led US equity rout pushed the Nasdaq down 5.52%.
* Institutional Product Launch: Amundi launched Ethereum-based STOXX Europe 600 fund shares.
{spot}(ETHUSDT)
For cryptocurrency traders, institutional investors, and macroeconomic analysts, monitoring large-scale derivative liquidations alongside broader technology sector corrections remains critical for managing risk and portfolio exposure.
$ETH #CoinVahini #CryptoLiquidations #Nasdaq #Ethereum #MarketTrends
Global financial markets are experiencing substantial volatility as digital asset selloffs and technology sector corrections unfold alongside new institutional fund offerings:-
* Crypto Market Liquidations: A sharp crypto selloff triggered $1.03 billion in liquidations.
* Equity Market Rout: A tech-led US equity rout pushed the Nasdaq down 5.52%.
* Institutional Product Launch: Amundi launched Ethereum-based STOXX Europe 600 fund shares.
For cryptocurrency traders, institutional investors, and macroeconomic analysts, monitoring large-scale derivative liquidations alongside broader technology sector corrections remains critical for managing risk and portfolio exposure.
$ETH #CoinVahini #CryptoLiquidations #Nasdaq #Ethereum #MarketTrends
* Crypto Market Liquidations: A sharp crypto selloff triggered $1.03 billion in liquidations.
* Equity Market Rout: A tech-led US equity rout pushed the Nasdaq down 5.52%.
* Institutional Product Launch: Amundi launched Ethereum-based STOXX Europe 600 fund shares.
For cryptocurrency traders, institutional investors, and macroeconomic analysts, monitoring large-scale derivative liquidations alongside broader technology sector corrections remains critical for managing risk and portfolio exposure.
$ETH #CoinVahini #CryptoLiquidations #Nasdaq #Ethereum #MarketTrends
32

·
--
උසබ තත්ත්වය
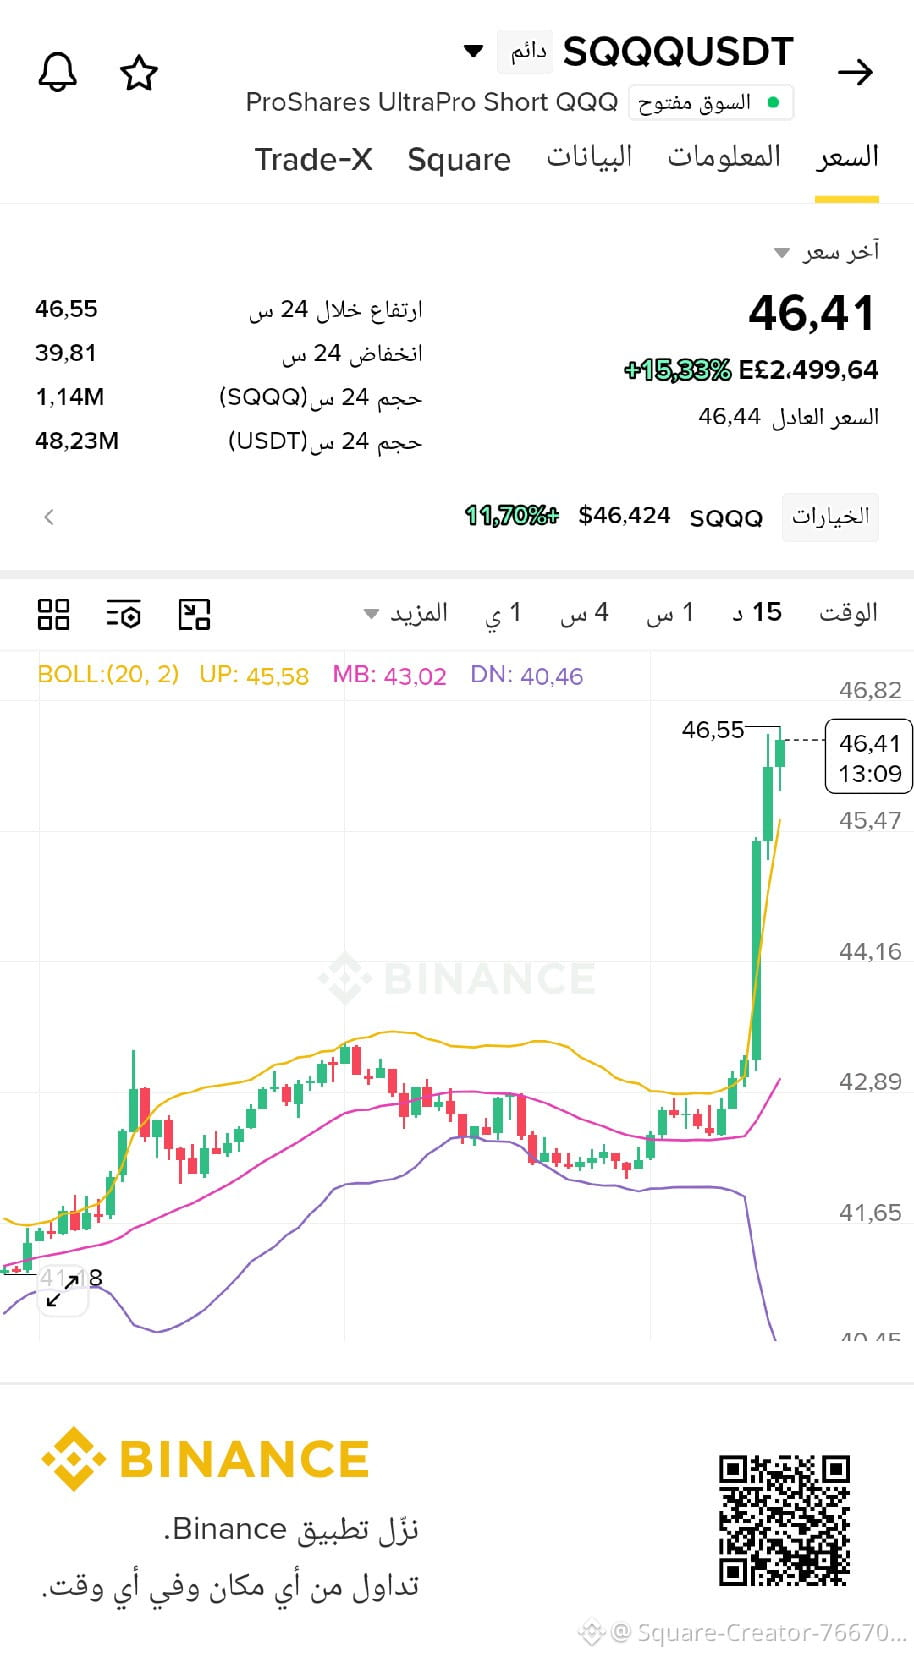
💥 بينما يغرق السوق في الأحمر.. هناك عملة واحدة ترفض الاستسلام وتشتعل صعوداً! 🚀$SQQQ
إذا مللت من رؤية محفظتك تتراجع مع نزول السوق، فلقد حان الوقت لتنظر إلى المكان الذي تتحرك فيه السيولة الحقيقية الآن. عملة $SQQQ تكسر القواعد وتسجل ارتفاعاً صاروخياً مذهلاً يتجاوز +15.33% وسط تداولات مشتعلة على منصة Binance!
📊 لمحة سريعة من قلب الشارت:
السعر الحالي: 46.41
زخم وقوة: شموع خضراء قوية تخترق المقاومات وتخالف اتجاه السوق العام.
حجم تداول: يعكس اهتماماً استثنائياً ودخول سيولة ضخمة.
💡 الفرصة لا تتردد.. هل ستكتفي بالمشاهدة أم ستقتنص اللحظة؟
📲 افتح تطبيق Binance الآن، وتابع تحركات السوق الذكية من أي مكان وفي أي وقت!
#Binance
#SQQQ
#CryptoTrading
#MarketTrends
💥 بينما يغرق السوق في الأحمر.. هناك عملة واحدة ترفض الاستسلام وتشتعل صعوداً! 🚀$SQQQ
إذا مللت من رؤية محفظتك تتراجع مع نزول السوق، فلقد حان الوقت لتنظر إلى المكان الذي تتحرك فيه السيولة الحقيقية الآن. عملة $SQQQ تكسر القواعد وتسجل ارتفاعاً صاروخياً مذهلاً يتجاوز +15.33% وسط تداولات مشتعلة على منصة Binance!
📊 لمحة سريعة من قلب الشارت:
السعر الحالي: 46.41
زخم وقوة: شموع خضراء قوية تخترق المقاومات وتخالف اتجاه السوق العام.
حجم تداول: يعكس اهتماماً استثنائياً ودخول سيولة ضخمة.
💡 الفرصة لا تتردد.. هل ستكتفي بالمشاهدة أم ستقتنص اللحظة؟
📲 افتح تطبيق Binance الآن، وتابع تحركات السوق الذكية من أي مكان وفي أي وقت!
#Binance
#SQQQ
#CryptoTrading
#MarketTrends
إذا مللت من رؤية محفظتك تتراجع مع نزول السوق، فلقد حان الوقت لتنظر إلى المكان الذي تتحرك فيه السيولة الحقيقية الآن. عملة $SQQQ تكسر القواعد وتسجل ارتفاعاً صاروخياً مذهلاً يتجاوز +15.33% وسط تداولات مشتعلة على منصة Binance!
📊 لمحة سريعة من قلب الشارت:
السعر الحالي: 46.41
زخم وقوة: شموع خضراء قوية تخترق المقاومات وتخالف اتجاه السوق العام.
حجم تداول: يعكس اهتماماً استثنائياً ودخول سيولة ضخمة.
💡 الفرصة لا تتردد.. هل ستكتفي بالمشاهدة أم ستقتنص اللحظة؟
📲 افتح تطبيق Binance الآن، وتابع تحركات السوق الذكية من أي مكان وفي أي وقت!
#Binance
#SQQQ
#CryptoTrading
#MarketTrends
1
123

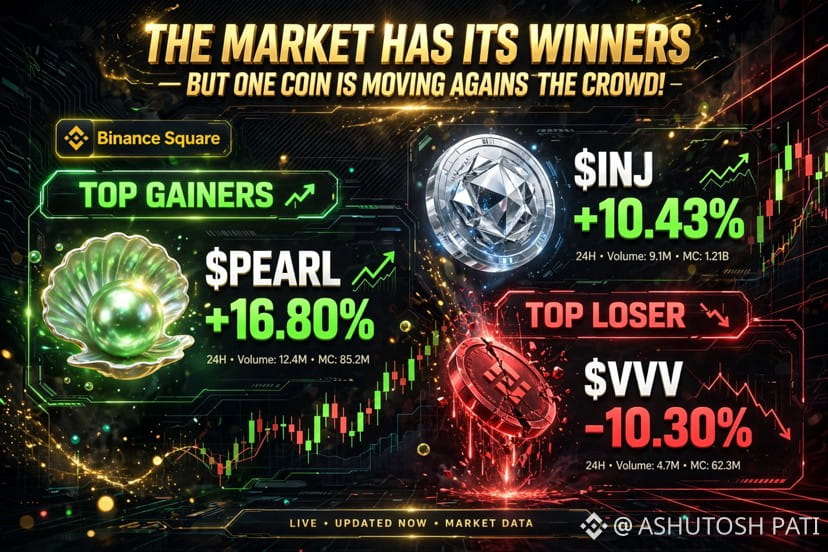
👀 THE MARKET HAS ITS WINNERS — BUT ONE COIN IS MOVING AGAINST THE CROWD!
Today’s crypto leaderboard reveals an interesting split. While some tokens are attracting buying interest, others are facing selling pressure.
📈 TOP 2 GAINERS
🥇 $PEARL — +16.80%
🥈 $INJ — +10.43%
📉 TOP LOSER
🔻 $VVV — -10.30%
🔍 WHAT’S WORTH WATCHING?
• PEARL is leading the gainers with a strong daily move.
• INJ is showing positive momentum.
• VVV is moving in the opposite direction.
MY TAKE:
A strong percentage gain doesn’t automatically mean a good entry. Watch trading volume, market structure and confirmation before taking a position.
💬 If you had to research ONE coin today, which would you choose: PEARL, INJ or VVV? And why?
#CryptoMarket #BinanceSquare #CryptoTrading #MarketTrends
👀 THE MARKET HAS ITS WINNERS — BUT ONE COIN IS MOVING AGAINST THE CROWD!
Today’s crypto leaderboard reveals an interesting split. While some tokens are attracting buying interest, others are facing selling pressure.
📈 TOP 2 GAINERS
🥇 $PEARL — +16.80%
🥈 $INJ — +10.43%
📉 TOP LOSER
🔻 $VVV — -10.30%
🔍 WHAT’S WORTH WATCHING?
• PEARL is leading the gainers with a strong daily move.
• INJ is showing positive momentum.
• VVV is moving in the opposite direction.
MY TAKE:
A strong percentage gain doesn’t automatically mean a good entry. Watch trading volume, market structure and confirmation before taking a position.
💬 If you had to research ONE coin today, which would you choose: PEARL, INJ or VVV? And why?
#CryptoMarket #BinanceSquare #CryptoTrading #MarketTrends
Today’s crypto leaderboard reveals an interesting split. While some tokens are attracting buying interest, others are facing selling pressure.
📈 TOP 2 GAINERS
🥇 $PEARL — +16.80%
🥈 $INJ — +10.43%
📉 TOP LOSER
🔻 $VVV — -10.30%
🔍 WHAT’S WORTH WATCHING?
• PEARL is leading the gainers with a strong daily move.
• INJ is showing positive momentum.
• VVV is moving in the opposite direction.
MY TAKE:
A strong percentage gain doesn’t automatically mean a good entry. Watch trading volume, market structure and confirmation before taking a position.
💬 If you had to research ONE coin today, which would you choose: PEARL, INJ or VVV? And why?
#CryptoMarket #BinanceSquare #CryptoTrading #MarketTrends
suprava 46:
$INJ right 👍
2
3
406
·
--
උසබ තත්ත්වය
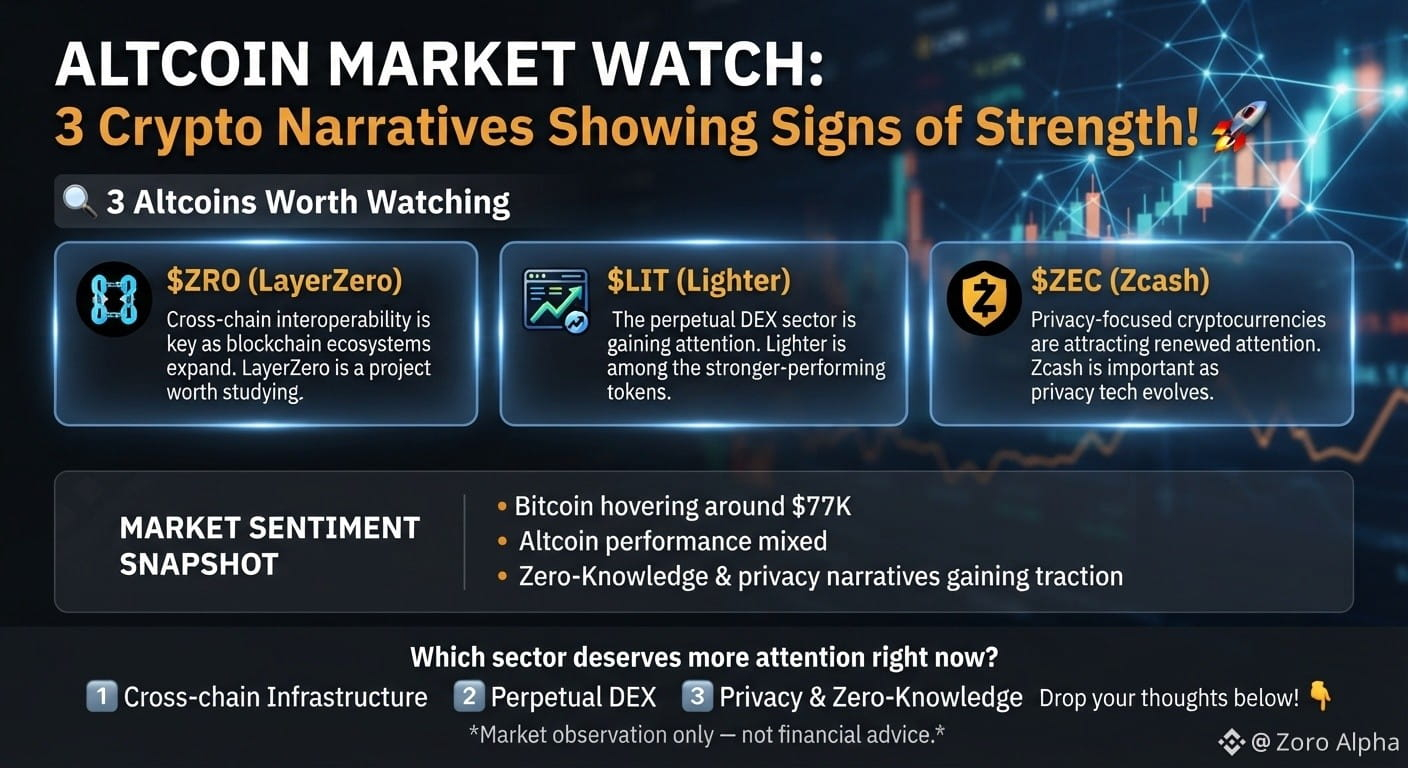
🚀 ALTCOIN MARKET WATCH: 3 Crypto Narratives Showing Signs of Strength!
The crypto market is still navigating uncertainty, but not every sector is moving in the same direction.
Recent market data shows that some smaller crypto narratives are attracting attention despite broader market pressure.
🔍 3 Altcoins Worth Watching
🔹 $ZRO (LayerZero) Cross-chain interoperability is becoming increasingly important as blockchain ecosystems continue to expand. LayerZero is one project worth studying in this sector.
🔹 $LIT (Lighter) The perpetual DEX sector is gaining attention. Lighter recently appeared among the stronger-performing tokens, making its ecosystem an interesting topic to follow.
🔹 $ZEC (Zcash) Privacy-focused cryptocurrencies are attracting renewed market attention. Zcash remains an important project to watch as privacy technology evolves.
📊 WHAT'S HAPPENING IN THE MARKET?
• Bitcoin is hovering around the $77K region. • Altcoin performance remains mixed. • Zero-Knowledge and privacy narratives are gaining attention. • Market sentiment remains cautious.
🔥 THE BIG QUESTION:
Can these emerging narratives maintain their momentum even if Bitcoin continues moving sideways?
Which sector deserves more attention right now?
1️⃣ Cross-chain Infrastructure
2️⃣ Perpetual DEX
3️⃣ Privacy & Zero-Knowledge
Drop your thoughts below! 👇
#CryptoMarket #AltcoinWatch #BlockchainInnovation #BinanceSquare #MarketTrends
{future}(ZROUSDT)
{future}(LITUSDT)
{future}(ZECUSDT)
🚀 ALTCOIN MARKET WATCH: 3 Crypto Narratives Showing Signs of Strength!
The crypto market is still navigating uncertainty, but not every sector is moving in the same direction.
Recent market data shows that some smaller crypto narratives are attracting attention despite broader market pressure.
🔍 3 Altcoins Worth Watching
🔹 $ZRO (LayerZero) Cross-chain interoperability is becoming increasingly important as blockchain ecosystems continue to expand. LayerZero is one project worth studying in this sector.
🔹 $LIT (Lighter) The perpetual DEX sector is gaining attention. Lighter recently appeared among the stronger-performing tokens, making its ecosystem an interesting topic to follow.
🔹 $ZEC (Zcash) Privacy-focused cryptocurrencies are attracting renewed market attention. Zcash remains an important project to watch as privacy technology evolves.
📊 WHAT'S HAPPENING IN THE MARKET?
• Bitcoin is hovering around the $77K region. • Altcoin performance remains mixed. • Zero-Knowledge and privacy narratives are gaining attention. • Market sentiment remains cautious.
🔥 THE BIG QUESTION:
Can these emerging narratives maintain their momentum even if Bitcoin continues moving sideways?
Which sector deserves more attention right now?
1️⃣ Cross-chain Infrastructure
2️⃣ Perpetual DEX
3️⃣ Privacy & Zero-Knowledge
Drop your thoughts below! 👇
#CryptoMarket #AltcoinWatch #BlockchainInnovation #BinanceSquare #MarketTrends
The crypto market is still navigating uncertainty, but not every sector is moving in the same direction.
Recent market data shows that some smaller crypto narratives are attracting attention despite broader market pressure.
🔍 3 Altcoins Worth Watching
🔹 $ZRO (LayerZero) Cross-chain interoperability is becoming increasingly important as blockchain ecosystems continue to expand. LayerZero is one project worth studying in this sector.
🔹 $LIT (Lighter) The perpetual DEX sector is gaining attention. Lighter recently appeared among the stronger-performing tokens, making its ecosystem an interesting topic to follow.
🔹 $ZEC (Zcash) Privacy-focused cryptocurrencies are attracting renewed market attention. Zcash remains an important project to watch as privacy technology evolves.
📊 WHAT'S HAPPENING IN THE MARKET?
• Bitcoin is hovering around the $77K region. • Altcoin performance remains mixed. • Zero-Knowledge and privacy narratives are gaining attention. • Market sentiment remains cautious.
🔥 THE BIG QUESTION:
Can these emerging narratives maintain their momentum even if Bitcoin continues moving sideways?
Which sector deserves more attention right now?
1️⃣ Cross-chain Infrastructure
2️⃣ Perpetual DEX
3️⃣ Privacy & Zero-Knowledge
Drop your thoughts below! 👇
#CryptoMarket #AltcoinWatch #BlockchainInnovation #BinanceSquare #MarketTrends
3
450

·
--
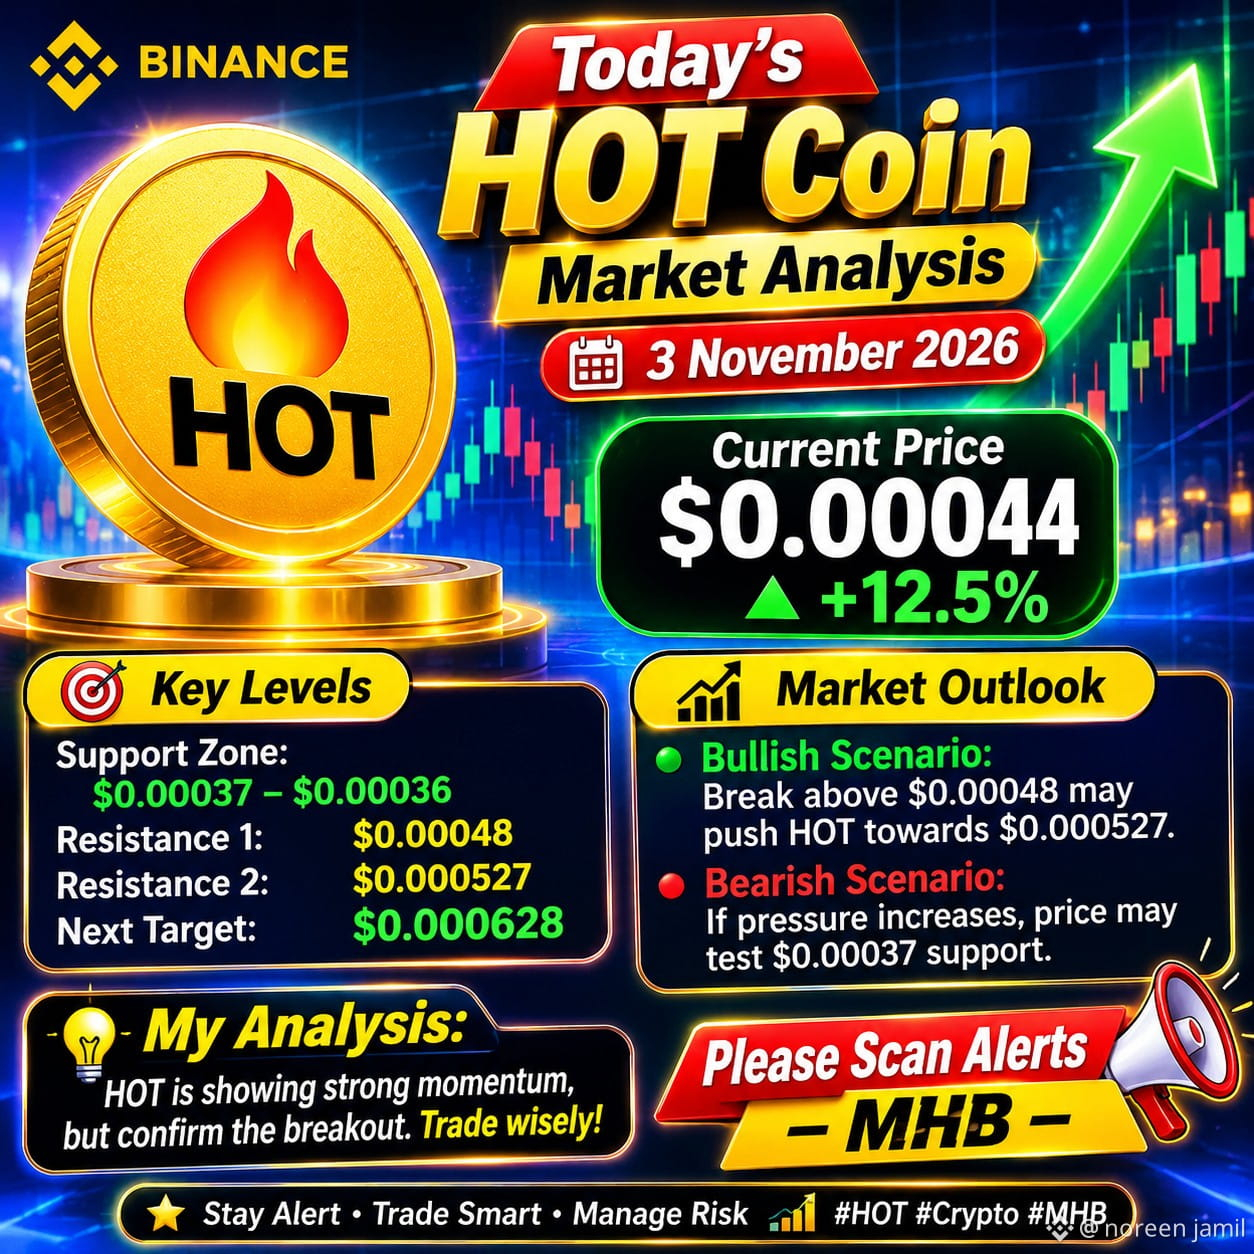
### 🔥 $HOT
{spot}(HOTUSDT)
COIN – Today's Market Analysis
3 November 2026Crypto Market Update
### HOLO (HOT) 🚀
Live market snapshot – USD
### $0.00043–$0.00045
24-Hour Performance: Approximately +10% to +16%, depending on the exchange and data provider. CoinLore +2
Market Overview
HOT is showing strong buying activity today. Trading volume has increased, indicating renewed market interest. However, traders should watch for resistance and possible short-term profit-taking.
Important Technical Levels
* Support zone: $0.00037–$0.00036
* Immediate resistance: $0.00048
* Major resistance: $0.000527
* Next upside target to watch: $0.000628
CoinLore +2
Market Outlook
* Bullish Scenario: A strong breakout above $0.00048 could open the way toward $0.000527.
* Bearish Scenario: If buying pressure weakens, HOT may revisit the $0.00037 support zone.
* Trading Strategy: Watch volume and candle-closing confirmation before making any trading decision.
My Analysis:
HOT is showing promising short-term momentum, but confirmation above resistance is important. Avoid chasing sudden price movements. Always manage risk carefully.
What do you think? Can HOT break above $0.00050 this week? 🚀
#HOT #HOLO #CryptoAnalysis #BinanceSquare #CryptoMarket #Altcoins #TechnicalAnalysis #TradingSignals #CryptoUpdate #MarketTrends
).
### 🔥 $HOT
COIN – Today's Market Analysis
3 November 2026Crypto Market Update
### HOLO (HOT) 🚀
Live market snapshot – USD
### $0.00043–$0.00045
24-Hour Performance: Approximately +10% to +16%, depending on the exchange and data provider. CoinLore +2
Market Overview
HOT is showing strong buying activity today. Trading volume has increased, indicating renewed market interest. However, traders should watch for resistance and possible short-term profit-taking.
Important Technical Levels
* Support zone: $0.00037–$0.00036
* Immediate resistance: $0.00048
* Major resistance: $0.000527
* Next upside target to watch: $0.000628
CoinLore +2
Market Outlook
* Bullish Scenario: A strong breakout above $0.00048 could open the way toward $0.000527.
* Bearish Scenario: If buying pressure weakens, HOT may revisit the $0.00037 support zone.
* Trading Strategy: Watch volume and candle-closing confirmation before making any trading decision.
My Analysis:
HOT is showing promising short-term momentum, but confirmation above resistance is important. Avoid chasing sudden price movements. Always manage risk carefully.
What do you think? Can HOT break above $0.00050 this week? 🚀
#HOT #HOLO #CryptoAnalysis #BinanceSquare #CryptoMarket #Altcoins #TechnicalAnalysis #TradingSignals #CryptoUpdate #MarketTrends
).
COIN – Today's Market Analysis
3 November 2026Crypto Market Update
### HOLO (HOT) 🚀
Live market snapshot – USD
### $0.00043–$0.00045
24-Hour Performance: Approximately +10% to +16%, depending on the exchange and data provider. CoinLore +2
Market Overview
HOT is showing strong buying activity today. Trading volume has increased, indicating renewed market interest. However, traders should watch for resistance and possible short-term profit-taking.
Important Technical Levels
* Support zone: $0.00037–$0.00036
* Immediate resistance: $0.00048
* Major resistance: $0.000527
* Next upside target to watch: $0.000628
CoinLore +2
Market Outlook
* Bullish Scenario: A strong breakout above $0.00048 could open the way toward $0.000527.
* Bearish Scenario: If buying pressure weakens, HOT may revisit the $0.00037 support zone.
* Trading Strategy: Watch volume and candle-closing confirmation before making any trading decision.
My Analysis:
HOT is showing promising short-term momentum, but confirmation above resistance is important. Avoid chasing sudden price movements. Always manage risk carefully.
What do you think? Can HOT break above $0.00050 this week? 🚀
#HOT #HOLO #CryptoAnalysis #BinanceSquare #CryptoMarket #Altcoins #TechnicalAnalysis #TradingSignals #CryptoUpdate #MarketTrends
).
141

good morning🌞 new vibes😎
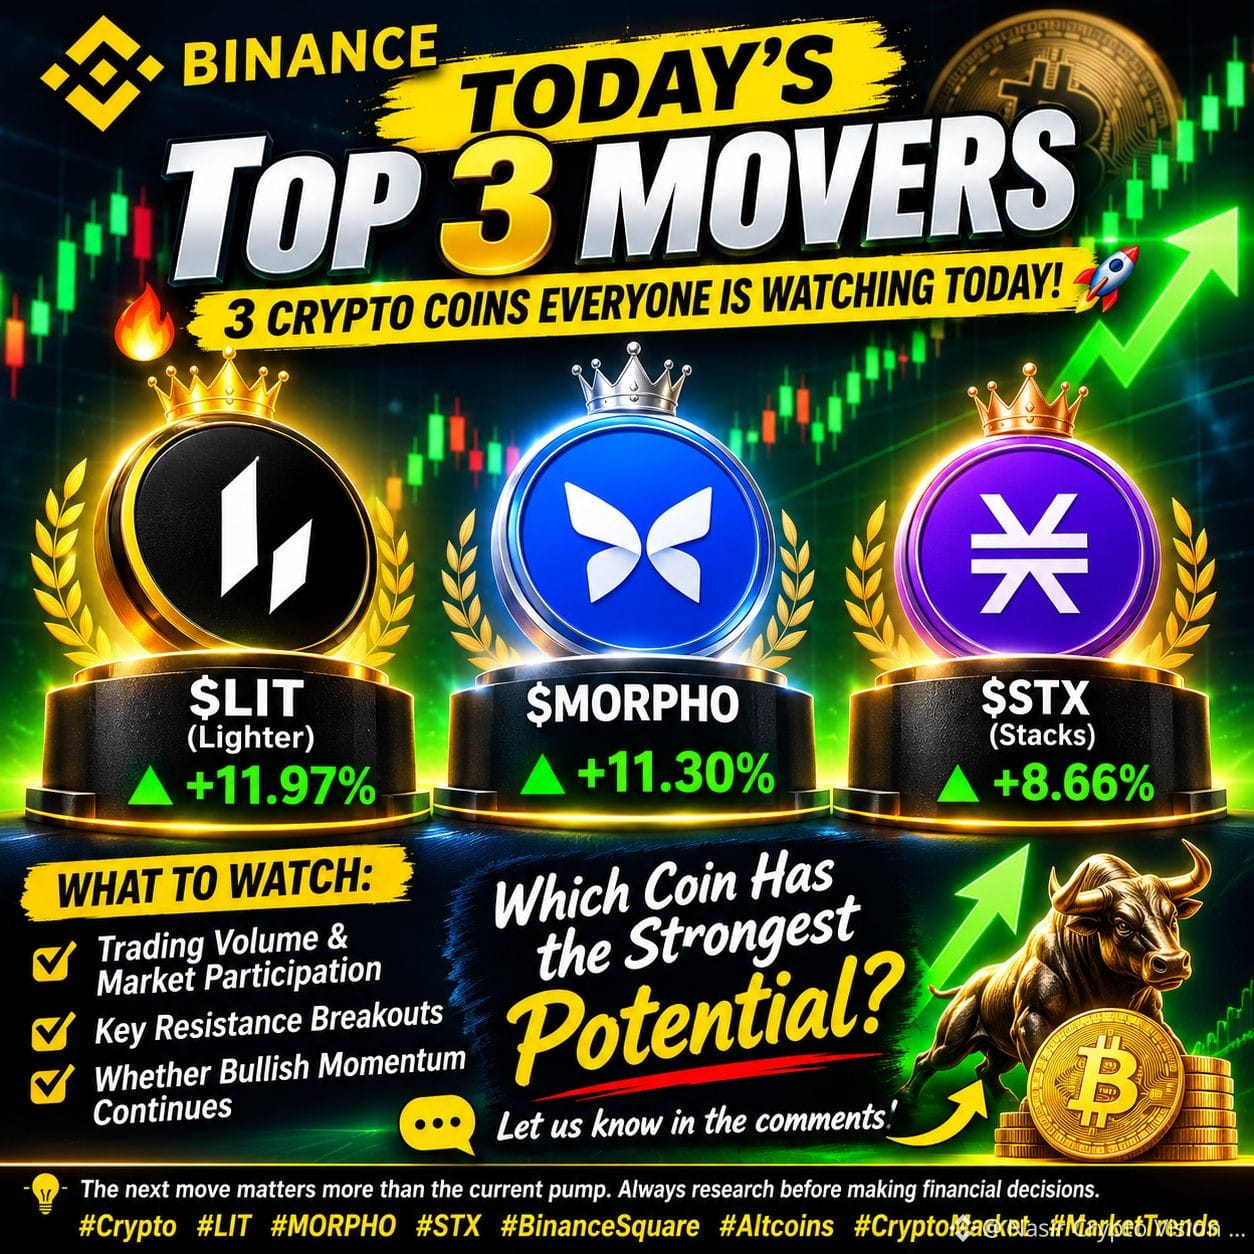
🚀 3 CRYPTO COINS EVERYONE IS WATCHING TODAY!
The crypto market is showing some interesting momentum, and these 3 altcoins are catching attention today. 👀🔥
🥇 $LIT (Lighter) – Strong 24H momentum with approximately +11.97% gains.
🥈 $MORPHO – Showing impressive market strength, up around +11.30%.
🥉 $STX (Stacks) – Gaining attention with approximately +8.66% growth.
📊 What to Watch:
• Trading volume and market participation
• Key resistance breakouts
• Whether bullish momentum continues
💡 The next move matters more than the current pump. Always research before making financial decisions.
🔥 Which coin has the strongest potential in your opinion?
#Crypto #LIT #MORPHO #STX #BinanceSquare #Altcoins #CryptoMarket #MarketTrends
good morning🌞 new vibes😎
🚀 3 CRYPTO COINS EVERYONE IS WATCHING TODAY!
The crypto market is showing some interesting momentum, and these 3 altcoins are catching attention today. 👀🔥
🥇 $LIT (Lighter) – Strong 24H momentum with approximately +11.97% gains.
🥈 $MORPHO – Showing impressive market strength, up around +11.30%.
🥉 $STX (Stacks) – Gaining attention with approximately +8.66% growth.
📊 What to Watch:
• Trading volume and market participation
• Key resistance breakouts
• Whether bullish momentum continues
💡 The next move matters more than the current pump. Always research before making financial decisions.
🔥 Which coin has the strongest potential in your opinion?
#Crypto #LIT #MORPHO #STX #BinanceSquare #Altcoins #CryptoMarket #MarketTrends
🚀 3 CRYPTO COINS EVERYONE IS WATCHING TODAY!
The crypto market is showing some interesting momentum, and these 3 altcoins are catching attention today. 👀🔥
🥇 $LIT (Lighter) – Strong 24H momentum with approximately +11.97% gains.
🥈 $MORPHO – Showing impressive market strength, up around +11.30%.
🥉 $STX (Stacks) – Gaining attention with approximately +8.66% growth.
📊 What to Watch:
• Trading volume and market participation
• Key resistance breakouts
• Whether bullish momentum continues
💡 The next move matters more than the current pump. Always research before making financial decisions.
🔥 Which coin has the strongest potential in your opinion?
#Crypto #LIT #MORPHO #STX #BinanceSquare #Altcoins #CryptoMarket #MarketTrends
229

🚨 Most Traders Ignore This—And That’s Why They Lose! 📊📉
Stop looking at crypto and tech charts in isolation. Big macro events move the entire market! 🌍💥
Every quarter, tech giants like Google, Amazon, Apple, Microsoft, NVIDIA, and Tesla drop their Earnings Reports. These numbers don't just affect stocks—they send massive shockwaves through Nasdaq, Bitcoin, and the entire Crypto Market! ⚡🚀
📌 Where to track Earnings Calendars like a Pro:
1️⃣ Investing.com (investing.com/earnings-calendar)
2️⃣ TradingView (tradingview.com/earnings-calendar)
3️⃣ Nasdaq (nasdaq.com/market-activity/earnings)
🔍 What to check before the market moves:
📅 Earnings Date & Time
💰 EPS & Revenue
🎯 Forecast vs. Actual Results
🔮 Future Guidance (The real price driver!)
🧠 Remember: Smart money doesn't just trade candles; they trade the fundamentals behind them! Stay ahead of the crowd. 📈💼
Hit that Follow button for more pro insights! Let me know your thoughts in the comments below. 👇💬
#BinanceSquare #MarketTrends #EarningsSeason #EducationalContent
🚨 Most Traders Ignore This—And That’s Why They Lose! 📊📉
Stop looking at crypto and tech charts in isolation. Big macro events move the entire market! 🌍💥
Every quarter, tech giants like Google, Amazon, Apple, Microsoft, NVIDIA, and Tesla drop their Earnings Reports. These numbers don't just affect stocks—they send massive shockwaves through Nasdaq, Bitcoin, and the entire Crypto Market! ⚡🚀
📌 Where to track Earnings Calendars like a Pro:
1️⃣ Investing.com (investing.com/earnings-calendar)
2️⃣ TradingView (tradingview.com/earnings-calendar)
3️⃣ Nasdaq (nasdaq.com/market-activity/earnings)
🔍 What to check before the market moves:
📅 Earnings Date & Time
💰 EPS & Revenue
🎯 Forecast vs. Actual Results
🔮 Future Guidance (The real price driver!)
🧠 Remember: Smart money doesn't just trade candles; they trade the fundamentals behind them! Stay ahead of the crowd. 📈💼
Hit that Follow button for more pro insights! Let me know your thoughts in the comments below. 👇💬
#BinanceSquare #MarketTrends #EarningsSeason #EducationalContent
Stop looking at crypto and tech charts in isolation. Big macro events move the entire market! 🌍💥
Every quarter, tech giants like Google, Amazon, Apple, Microsoft, NVIDIA, and Tesla drop their Earnings Reports. These numbers don't just affect stocks—they send massive shockwaves through Nasdaq, Bitcoin, and the entire Crypto Market! ⚡🚀
📌 Where to track Earnings Calendars like a Pro:
1️⃣ Investing.com (investing.com/earnings-calendar)
2️⃣ TradingView (tradingview.com/earnings-calendar)
3️⃣ Nasdaq (nasdaq.com/market-activity/earnings)
🔍 What to check before the market moves:
📅 Earnings Date & Time
💰 EPS & Revenue
🎯 Forecast vs. Actual Results
🔮 Future Guidance (The real price driver!)
🧠 Remember: Smart money doesn't just trade candles; they trade the fundamentals behind them! Stay ahead of the crowd. 📈💼
Hit that Follow button for more pro insights! Let me know your thoughts in the comments below. 👇💬
#BinanceSquare #MarketTrends #EarningsSeason #EducationalContent
1
1.8k
·
--
උසබ තත්ත්වය
🎃 The Halloween Indicator is back in focus.
Historically, November to April has been a stronger period for the S&P 500 than the following six months. Midterm election cycles have also shown interesting historical patterns.
But seasonal trends are not guarantees, and traditional market patterns do not always translate directly to crypto.
Do you think this seasonal pattern could influence the crypto market, or does crypto follow its own cycle?
#MarketTrends #Crypto $BEAMX , $PARTI
🎃 The Halloween Indicator is back in focus.
Historically, November to April has been a stronger period for the S&P 500 than the following six months. Midterm election cycles have also shown interesting historical patterns.
But seasonal trends are not guarantees, and traditional market patterns do not always translate directly to crypto.
Do you think this seasonal pattern could influence the crypto market, or does crypto follow its own cycle?
#MarketTrends #Crypto $BEAMX , $PARTI
Historically, November to April has been a stronger period for the S&P 500 than the following six months. Midterm election cycles have also shown interesting historical patterns.
But seasonal trends are not guarantees, and traditional market patterns do not always translate directly to crypto.
Do you think this seasonal pattern could influence the crypto market, or does crypto follow its own cycle?
#MarketTrends #Crypto $BEAMX , $PARTI
1
201
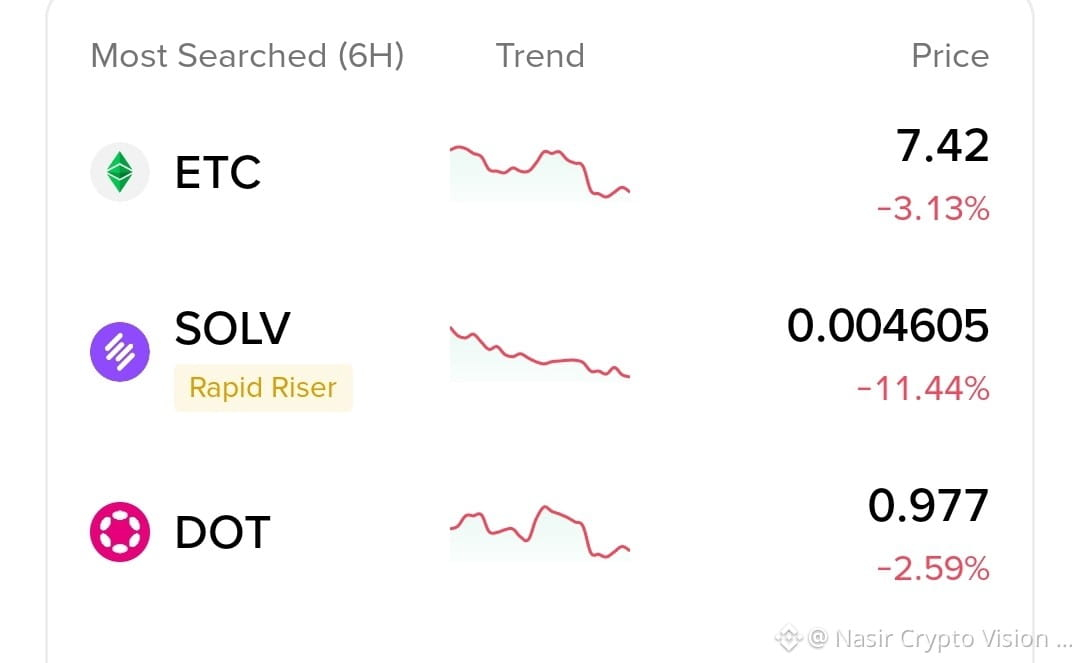
🔥 Binance Square Trend Update: Today's Most Searched Coins (6H)
Here is a quick and verifiable overview of the market's most searched tokens over the last 6 hours:
🔷 $ETC (Ethereum Classic): $7.42 (-3.13%) — Experiencing a slight correction, with key support levels remaining under close watch.
🟣 $SOLV (Solv Protocol): $0.004605 (-11.44%) — High volatility accompanied by a Rapid Riser tag, driving a strong surge in search interest.
🔴 $DOT
{spot}(ETCUSDT)
{spot}(SOLVUSDT)
{spot}(DOTUSDT)
(Polkadot): $0.977 (-2.59%) — A minor pullback as the community analyzes the ecosystem's next potential trend.
💡 Strategic Note: High search volume paired with a correction calls for strict risk management and waiting for clear entry signals.
👇 What are your trading plans for today? Share your thoughts in the comments!
#ETC #SOLV #DOT #BinanceSquare #CryptoTrading #MarketTrends
🔥 Binance Square Trend Update: Today's Most Searched Coins (6H)
Here is a quick and verifiable overview of the market's most searched tokens over the last 6 hours:
🔷 $ETC (Ethereum Classic): $7.42 (-3.13%) — Experiencing a slight correction, with key support levels remaining under close watch.
🟣 $SOLV (Solv Protocol): $0.004605 (-11.44%) — High volatility accompanied by a Rapid Riser tag, driving a strong surge in search interest.
🔴 $DOT
(Polkadot): $0.977 (-2.59%) — A minor pullback as the community analyzes the ecosystem's next potential trend.
💡 Strategic Note: High search volume paired with a correction calls for strict risk management and waiting for clear entry signals.
👇 What are your trading plans for today? Share your thoughts in the comments!
#ETC #SOLV #DOT #BinanceSquare #CryptoTrading #MarketTrends
Here is a quick and verifiable overview of the market's most searched tokens over the last 6 hours:
🔷 $ETC (Ethereum Classic): $7.42 (-3.13%) — Experiencing a slight correction, with key support levels remaining under close watch.
🟣 $SOLV (Solv Protocol): $0.004605 (-11.44%) — High volatility accompanied by a Rapid Riser tag, driving a strong surge in search interest.
🔴 $DOT
(Polkadot): $0.977 (-2.59%) — A minor pullback as the community analyzes the ecosystem's next potential trend.
💡 Strategic Note: High search volume paired with a correction calls for strict risk management and waiting for clear entry signals.
👇 What are your trading plans for today? Share your thoughts in the comments!
#ETC #SOLV #DOT #BinanceSquare #CryptoTrading #MarketTrends
1
371

🚨 Unpopular opinion: The boring phase is where fortunes are made.
Everyone wants the 100x adrenaline rush. Nobody wants the "watching paint dry" accumulation zone.
But here's what I'm seeing right now 👇
🔹 Retail is asleep — timelines are quiet, engagement is down. That's usually when smart money gets comfortable.
🔹 Volatility is coiled — tight ranges don't last. The question isn't if it breaks, it's which way.
🔹 Patience > Prediction — I'd rather miss the first 5% of a move than get chopped up guessing the direction.
My plan? Stay liquid. Stay patient. Let the market show its hand first.
Now I want to hear from YOU 👇
Drop a 🔥 if you're bullish
Drop a 🧊 if you're bearish
Drop a 🤷 if you're just here for the memes
No wrong answers — let's see where the crowd really stands. 👀
$BTC #MarketTrends #BinanceSquare
{future}(BTCUSDT)
{future}(ETHUSDT)
🚨 Unpopular opinion: The boring phase is where fortunes are made.
Everyone wants the 100x adrenaline rush. Nobody wants the "watching paint dry" accumulation zone.
But here's what I'm seeing right now 👇
🔹 Retail is asleep — timelines are quiet, engagement is down. That's usually when smart money gets comfortable.
🔹 Volatility is coiled — tight ranges don't last. The question isn't if it breaks, it's which way.
🔹 Patience > Prediction — I'd rather miss the first 5% of a move than get chopped up guessing the direction.
My plan? Stay liquid. Stay patient. Let the market show its hand first.
Now I want to hear from YOU 👇
Drop a 🔥 if you're bullish
Drop a 🧊 if you're bearish
Drop a 🤷 if you're just here for the memes
No wrong answers — let's see where the crowd really stands. 👀
$BTC #MarketTrends #BinanceSquare
Everyone wants the 100x adrenaline rush. Nobody wants the "watching paint dry" accumulation zone.
But here's what I'm seeing right now 👇
🔹 Retail is asleep — timelines are quiet, engagement is down. That's usually when smart money gets comfortable.
🔹 Volatility is coiled — tight ranges don't last. The question isn't if it breaks, it's which way.
🔹 Patience > Prediction — I'd rather miss the first 5% of a move than get chopped up guessing the direction.
My plan? Stay liquid. Stay patient. Let the market show its hand first.
Now I want to hear from YOU 👇
Drop a 🔥 if you're bullish
Drop a 🧊 if you're bearish
Drop a 🤷 if you're just here for the memes
No wrong answers — let's see where the crowd really stands. 👀
$BTC #MarketTrends #BinanceSquare
2
303

#BTC ETHBNB
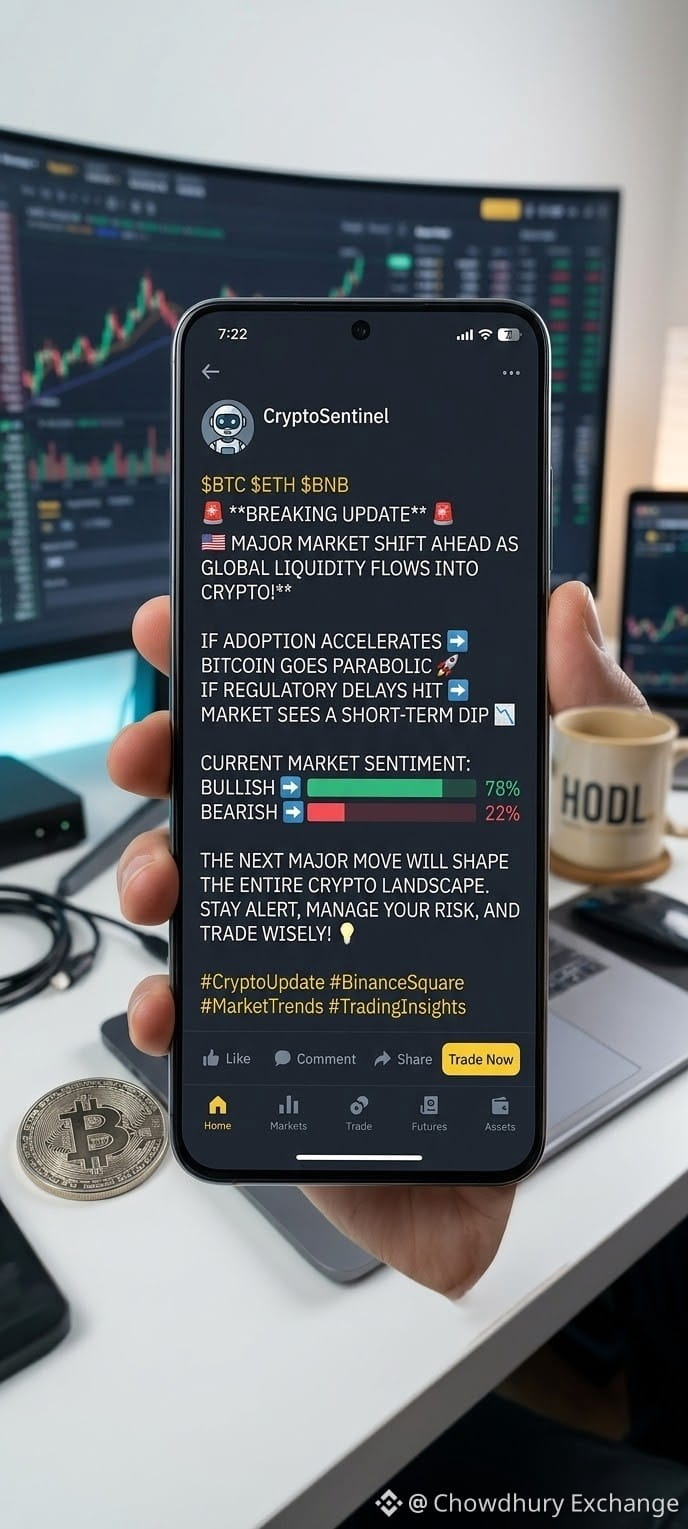
🚨 BREAKING UPDATE 🚨
🇺🇸 MAJOR MARKET SHIFT AHEAD AS GLOBAL LIQUIDITY FLOWS INTO CRYPTO!
IF ADOPTION ACCELERATES ➔ BITCOIN GOES PARABOLIC 🚀
IF REGULATORY DELAYS HIT ➔ MARKET SEES A SHORT-TERM DIP 📉
CURRENT MARKET SENTIMENT:
BULLISH ➔ 78%
BEARISH ➔ 22%
THE NEXT MAJOR MOVE WILL SHAPE THE ENTIRE CRYPTO LANDSCAPE. STAY ALERT, MANAGE YOUR RISK, AND TRADE WISELY! 💡
#CryptoUpdate #BinanceSquare #MarketTrends #TradingInsights
#BTC ETHBNB
🚨 BREAKING UPDATE 🚨
🇺🇸 MAJOR MARKET SHIFT AHEAD AS GLOBAL LIQUIDITY FLOWS INTO CRYPTO!
IF ADOPTION ACCELERATES ➔ BITCOIN GOES PARABOLIC 🚀
IF REGULATORY DELAYS HIT ➔ MARKET SEES A SHORT-TERM DIP 📉
CURRENT MARKET SENTIMENT:
BULLISH ➔ 78%
BEARISH ➔ 22%
THE NEXT MAJOR MOVE WILL SHAPE THE ENTIRE CRYPTO LANDSCAPE. STAY ALERT, MANAGE YOUR RISK, AND TRADE WISELY! 💡
#CryptoUpdate #BinanceSquare #MarketTrends #TradingInsights
🚨 BREAKING UPDATE 🚨
🇺🇸 MAJOR MARKET SHIFT AHEAD AS GLOBAL LIQUIDITY FLOWS INTO CRYPTO!
IF ADOPTION ACCELERATES ➔ BITCOIN GOES PARABOLIC 🚀
IF REGULATORY DELAYS HIT ➔ MARKET SEES A SHORT-TERM DIP 📉
CURRENT MARKET SENTIMENT:
BULLISH ➔ 78%
BEARISH ➔ 22%
THE NEXT MAJOR MOVE WILL SHAPE THE ENTIRE CRYPTO LANDSCAPE. STAY ALERT, MANAGE YOUR RISK, AND TRADE WISELY! 💡
#CryptoUpdate #BinanceSquare #MarketTrends #TradingInsights
1
27

·
--
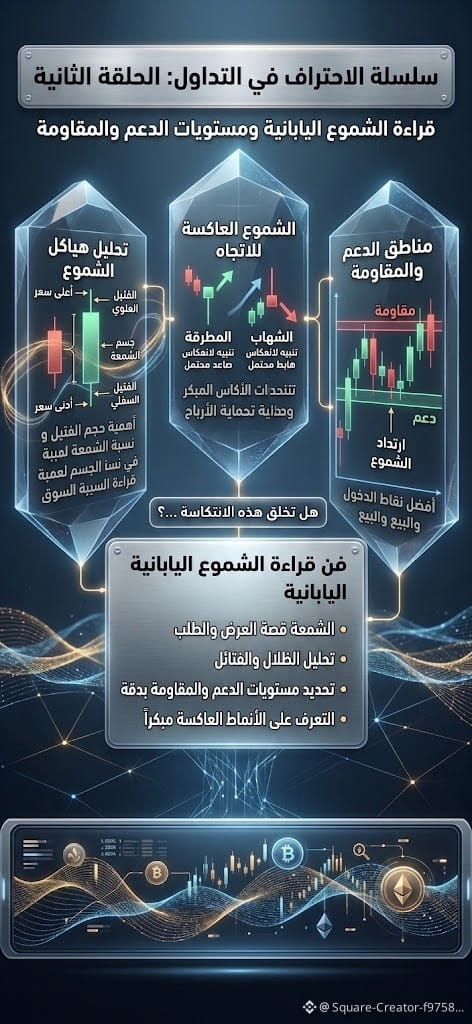
سلسلة الاحتراف في التداول: فن قراءة الشموع اليابانية (الحلقة الثانية)
فهم الشموع اليابانية هو مفتاحك السحري لقراءة نوايا السوق ومعركة العرض والطلب بين المشترين والبائعين. الشمعة ليست مجرد لون أخضر أو أحمر، بل هي قصة تفصيلية لما حدث في السوق خلال إطارك الزمني. تعلم قراءة الظلال والفتائل بذكاء؛ فالبطء في اتخاذ القرار قد يكلفك الكثير، بينما تحديد مناطق الدعم والمقاومة بناءً على ارتدادات الشموع يمنحك أفضل نقاط الدخول والخروج بدقة متناهية.
الشموع العاكسة للاتجاه مثل "المطرقة" أو "الشهاب" تحذّرك مبكراً من انعكاس المحفظة السعرية، مما يتيح لك حماية أرباحك قبل فوات الأوان. لا تهمل تحليل الشارتات على فترات متعددة لتكوين رؤية شاملة وصحيحة.
تابع السلسلة واستعد للحلقة القادمة لنكشف أسرار مؤشرات الزخم والسيولة!
🚀 شاركنا في التعليقات: ما هو أكثر نموذج شمعة يابانية تعتمد عليه في تداولاتك اليومية؟ ولا تنسَ متابعة الحساب ليصلك كل جديد! 💬📈
#CryptoDawar #MarketTrends
#SmartTrading #cryptouniverseofficial
سلسلة الاحتراف في التداول: فن قراءة الشموع اليابانية (الحلقة الثانية)
فهم الشموع اليابانية هو مفتاحك السحري لقراءة نوايا السوق ومعركة العرض والطلب بين المشترين والبائعين. الشمعة ليست مجرد لون أخضر أو أحمر، بل هي قصة تفصيلية لما حدث في السوق خلال إطارك الزمني. تعلم قراءة الظلال والفتائل بذكاء؛ فالبطء في اتخاذ القرار قد يكلفك الكثير، بينما تحديد مناطق الدعم والمقاومة بناءً على ارتدادات الشموع يمنحك أفضل نقاط الدخول والخروج بدقة متناهية.
الشموع العاكسة للاتجاه مثل "المطرقة" أو "الشهاب" تحذّرك مبكراً من انعكاس المحفظة السعرية، مما يتيح لك حماية أرباحك قبل فوات الأوان. لا تهمل تحليل الشارتات على فترات متعددة لتكوين رؤية شاملة وصحيحة.
تابع السلسلة واستعد للحلقة القادمة لنكشف أسرار مؤشرات الزخم والسيولة!
🚀 شاركنا في التعليقات: ما هو أكثر نموذج شمعة يابانية تعتمد عليه في تداولاتك اليومية؟ ولا تنسَ متابعة الحساب ليصلك كل جديد! 💬📈
#CryptoDawar #MarketTrends
#SmartTrading #cryptouniverseofficial
فهم الشموع اليابانية هو مفتاحك السحري لقراءة نوايا السوق ومعركة العرض والطلب بين المشترين والبائعين. الشمعة ليست مجرد لون أخضر أو أحمر، بل هي قصة تفصيلية لما حدث في السوق خلال إطارك الزمني. تعلم قراءة الظلال والفتائل بذكاء؛ فالبطء في اتخاذ القرار قد يكلفك الكثير، بينما تحديد مناطق الدعم والمقاومة بناءً على ارتدادات الشموع يمنحك أفضل نقاط الدخول والخروج بدقة متناهية.
الشموع العاكسة للاتجاه مثل "المطرقة" أو "الشهاب" تحذّرك مبكراً من انعكاس المحفظة السعرية، مما يتيح لك حماية أرباحك قبل فوات الأوان. لا تهمل تحليل الشارتات على فترات متعددة لتكوين رؤية شاملة وصحيحة.
تابع السلسلة واستعد للحلقة القادمة لنكشف أسرار مؤشرات الزخم والسيولة!
🚀 شاركنا في التعليقات: ما هو أكثر نموذج شمعة يابانية تعتمد عليه في تداولاتك اليومية؟ ولا تنسَ متابعة الحساب ليصلك كل جديد! 💬📈
#CryptoDawar #MarketTrends
#SmartTrading #cryptouniverseofficial
1
104

·
--
ලිපිය
Galaxy Research Says Bitcoin Bear Market Ended in June 📉Hey everyone, let's talk about Bitcoin and why a new research report claims the bear market is officially behind us.
If your portfolio has been feeling the chill, here is some warmth for your feed. According to a fresh report from Galaxy Research, the Bitcoin bear market actually wrapped up way back in June.
Now, how did they reach this cozy conclusion? The analysts pointed out that the asset has successfully reclaimed its 50-week moving average, which is a pretty neat technical milestone.
On top of that, good news keeps piling up as heavy selling pressure finally starts to fade away. It seems the market conditions are shifting gears, and the overall narrative around currency debasement is getting stronger by the day.
Because of these shifting trends, the researchers argue that the current setup makes f
Why it matters 💡
It is always fascinating to see how the big analytical minds interpret market cycles. Keep an eye on those moving averages and watch how the broader economic picture unfolds from here.
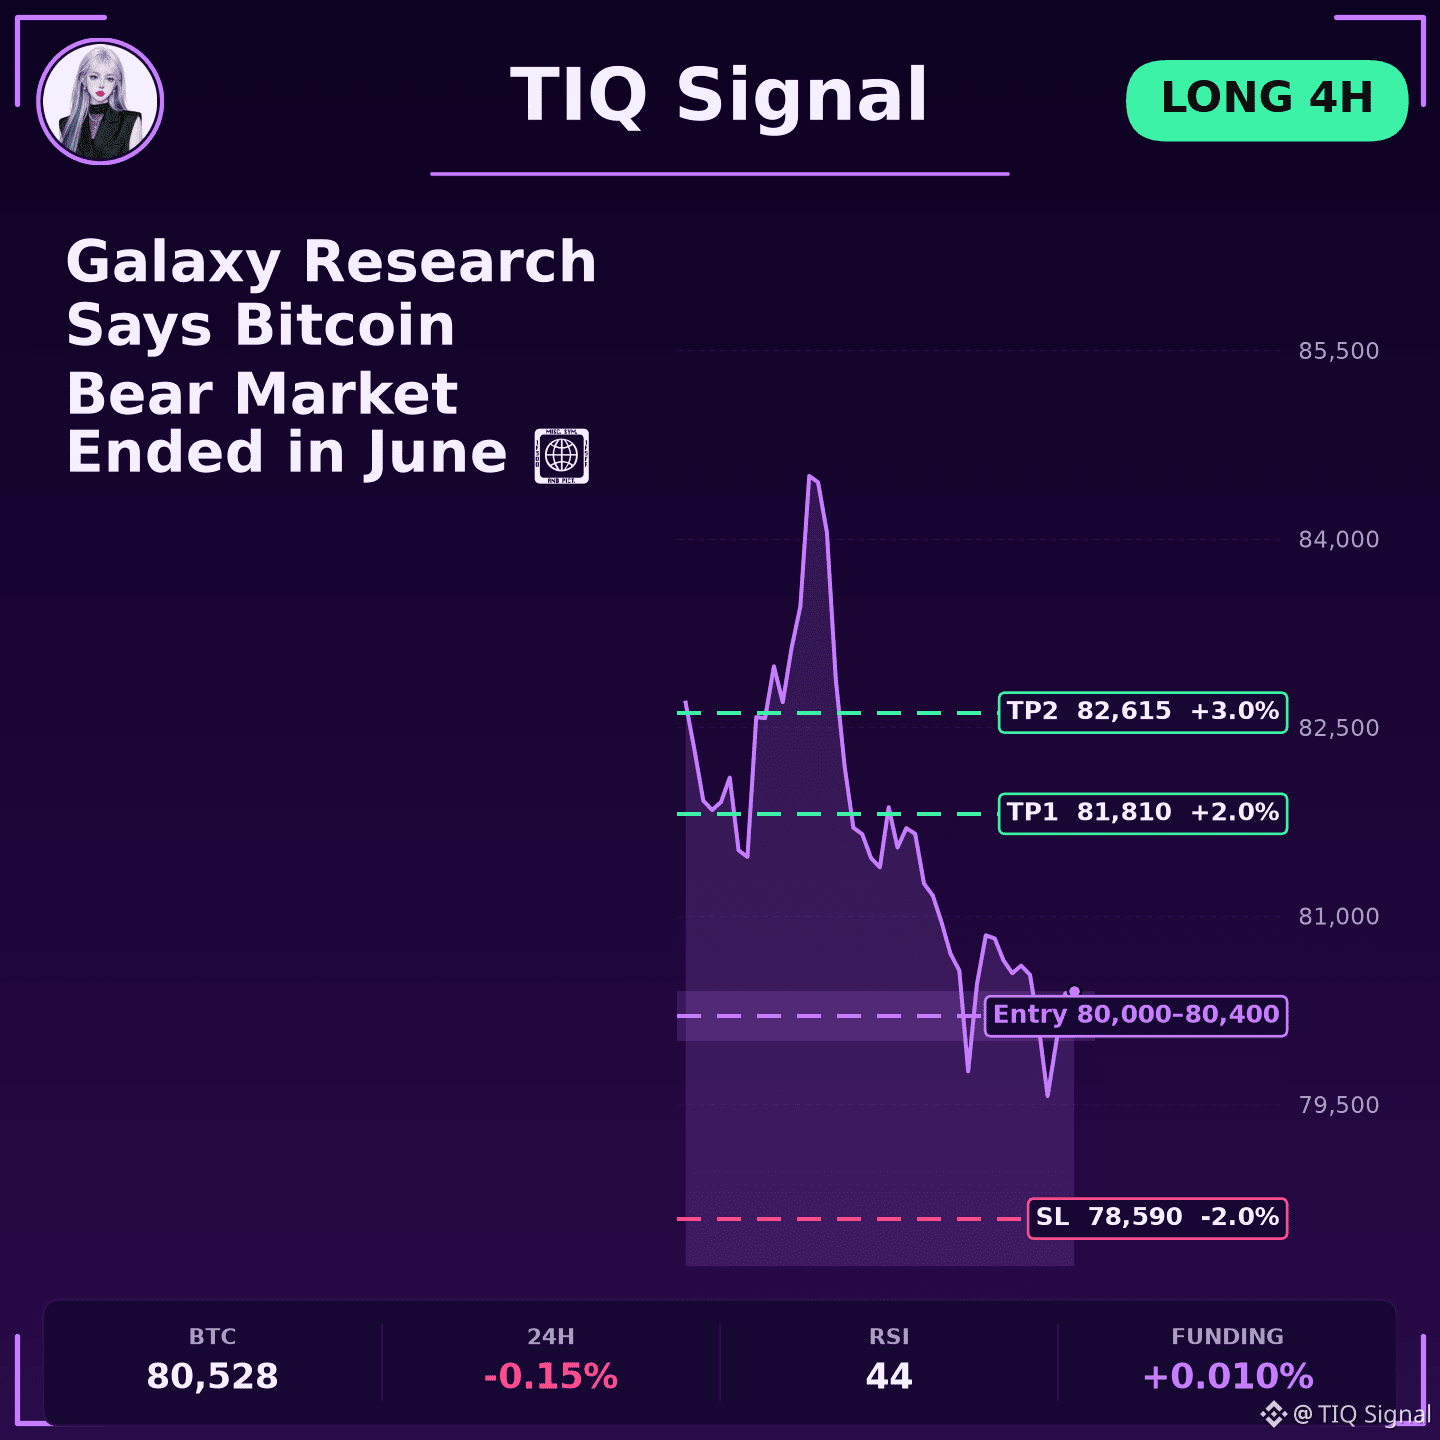
4H signal view on $BTC 📊
Long 🟢
Entry 80,000 - 80,400
TP 81,810 - 82,615 - 83,421
SL 78,590
RSI 44 still has room to move. MACD momentum is leaning up. This one goes against the EMA200 trend.
$BTC $XAU $ETH #BTC #Bitcoin #CryptoNews #MarketTrends
ℹ️ News roundup from public sources, not financial advice.
Galaxy Research Says Bitcoin Bear Market Ended in June 📉
Hey everyone, let's talk about Bitcoin and why a new research report claims the bear market is officially behind us.
If your portfolio has been feeling the chill, here is some warmth for your feed. According to a fresh report from Galaxy Research, the Bitcoin bear market actually wrapped up way back in June.
Now, how did they reach this cozy conclusion? The analysts pointed out that the asset has successfully reclaimed its 50-week moving average, which is a pretty neat technical milestone.
On top of that, good news keeps piling up as heavy selling pressure finally starts to fade away. It seems the market conditions are shifting gears, and the overall narrative around currency debasement is getting stronger by the day.
Because of these shifting trends, the researchers argue that the current setup makes f
Why it matters 💡
It is always fascinating to see how the big analytical minds interpret market cycles. Keep an eye on those moving averages and watch how the broader economic picture unfolds from here.
4H signal view on $BTC 📊
Long 🟢
Entry 80,000 - 80,400
TP 81,810 - 82,615 - 83,421
SL 78,590
RSI 44 still has room to move. MACD momentum is leaning up. This one goes against the EMA200 trend.
$BTC $XAU $ETH #BTC #Bitcoin #CryptoNews #MarketTrends
ℹ️ News roundup from public sources, not financial advice.
If your portfolio has been feeling the chill, here is some warmth for your feed. According to a fresh report from Galaxy Research, the Bitcoin bear market actually wrapped up way back in June.
Now, how did they reach this cozy conclusion? The analysts pointed out that the asset has successfully reclaimed its 50-week moving average, which is a pretty neat technical milestone.
On top of that, good news keeps piling up as heavy selling pressure finally starts to fade away. It seems the market conditions are shifting gears, and the overall narrative around currency debasement is getting stronger by the day.
Because of these shifting trends, the researchers argue that the current setup makes f
Why it matters 💡
It is always fascinating to see how the big analytical minds interpret market cycles. Keep an eye on those moving averages and watch how the broader economic picture unfolds from here.
4H signal view on $BTC 📊
Long 🟢
Entry 80,000 - 80,400
TP 81,810 - 82,615 - 83,421
SL 78,590
RSI 44 still has room to move. MACD momentum is leaning up. This one goes against the EMA200 trend.
$BTC $XAU $ETH #BTC #Bitcoin #CryptoNews #MarketTrends
ℹ️ News roundup from public sources, not financial advice.
5
තවත් අන්තර්ගතයන් ගවේෂණය කිරීමට ඇතුල් වන්න
Binance චතුරශ්රය හි ගෝලීය ක්රිප්ටෝ පරිශීලකයින් හා එක්වන්න
⚡️ ක්රිප්ටෝ පිළිබඳ නවතම සහ ප්රයෝජනවත් තොරතුරු ලබා ගන්න.
💬 ලොව විශාලතම ක්රිප්ටෝ හුවමාරුව මගින් විශ්වාස කෙරේ.
👍 සත්යායනය කරන ලද නිර්මාණකරුවන්ගෙන් සැබෑ විදසුන් සොයා ගන්න.
විද්යුත් තැපෑල / දුරකථන අංකය
නැගී එන මාතෘකා
1
#HotCPIDecemberHikePriced
325,844 නැරඹීම්
3,252 සාකච්ඡා කරමින්
2
#ZcashFallsBelow$1000ForFirstTimeSinceSeptember
9,595 නැරඹීම්
62 සාකච්ඡා කරමින්
3
#StrategyFaces$2.8BSelloffRiskFromMSCIRemoval
20,584 නැරඹීම්
141 සාකච්ඡා කරමින්
4
#AnthropicRejectsIPODelayValuationinQuestion
362,552 නැරඹීම්
3,209 සාකච්ඡා කරමින්
5
#BitcoinETFsLose$1.6BInNovember
8,426 නැරඹීම්
45 සාකච්ඡා කරමින්
6
#AnthropicDisclosesOver$10BNewComputeDeals
1,677 නැරඹීම්
30 සාකච්ඡා කරමින්
7
#CoreWeaveJumps10%On168%RevenueGrowth
21,737 නැරඹීම්
463 සාකච්ඡා කරමින්
8
#CanNvidiaEarningsEaseMarketConcerns?
108,303 නැරඹීම්
1,390 සාකච්ඡා කරමින්
9
#BarclaysRaisesBlackRockBitcoinETFStake48%
18,846 නැරඹීම්
336 සාකච්ඡා කරමින්
10
#BitmineReports$6.3BFiscal2026Loss
7,526 නැරඹීම්
23 සාකච්ඡා කරමින්