

#bitcoinslipsbelow$80kagain
bitcoinslipsbelow$80kagain
උණුසුම්
නවතම

·
--
බෙයාරිෂ්
BTC Is Bleeding While the Whale W Move Out — Stacked Against a Corporate Bid
Seven days of downside, and it wasn't retail that drove.
The: BTC closed ~79,796 on Oct27, down ~2.6% over 7 days and ~5.2% over 30 days. Daily RSI(12) sits at 39.8. The week's range: high ~84,377 (Oct 22), low ~79,220 (Oct 24). No capitulation candle. No reclaim of 84K. Just grind.
The supply side is doing the talking. Dormant wallets moved 2,571 BTC (~$206.5M) toward institutional exchanges. That is supply arriving at the venue, not leaving it. Treasury appetite also cooled — Strategy redirected $204.9M into share buybacks instead of BTC.
The bid underneath is corporate, not speculative. Strive acquired 6,182 BTC (~$511.4M); public firms added 6,200+ BTC combined. That is a real floor argument near $79.7K — but it is a floor, not a breakout catalyst.
Momentum is not on the bulls' side. MACD histogram at −23.99, price under the 99 EMA. Upside is capped below ~$80.5K until that structure fl.
Positioning is mildly bullish, not euphoric. Square community poll: 2,116 bullish vs 1,714 bearish of 3,830 votes A limited sample — worth knowing, not worth trading on alone.
My read: this is distribution into a corporate bid. The floor is real; the momentum is not there. Watching whether the 79.2K–79.7K zone absorbs the exchange inflow is the whole story this week.
{spot}(BTCUSDT)
#BitcoinSlipsBelow$80KAgain
BTC Is Bleeding While the Whale W Move Out — Stacked Against a Corporate Bid
Seven days of downside, and it wasn't retail that drove.
The: BTC closed ~79,796 on Oct27, down ~2.6% over 7 days and ~5.2% over 30 days. Daily RSI(12) sits at 39.8. The week's range: high ~84,377 (Oct 22), low ~79,220 (Oct 24). No capitulation candle. No reclaim of 84K. Just grind.
The supply side is doing the talking. Dormant wallets moved 2,571 BTC (~$206.5M) toward institutional exchanges. That is supply arriving at the venue, not leaving it. Treasury appetite also cooled — Strategy redirected $204.9M into share buybacks instead of BTC.
The bid underneath is corporate, not speculative. Strive acquired 6,182 BTC (~$511.4M); public firms added 6,200+ BTC combined. That is a real floor argument near $79.7K — but it is a floor, not a breakout catalyst.
Momentum is not on the bulls' side. MACD histogram at −23.99, price under the 99 EMA. Upside is capped below ~$80.5K until that structure fl.
Positioning is mildly bullish, not euphoric. Square community poll: 2,116 bullish vs 1,714 bearish of 3,830 votes A limited sample — worth knowing, not worth trading on alone.
My read: this is distribution into a corporate bid. The floor is real; the momentum is not there. Watching whether the 79.2K–79.7K zone absorbs the exchange inflow is the whole story this week.
#BitcoinSlipsBelow$80KAgain
1
590

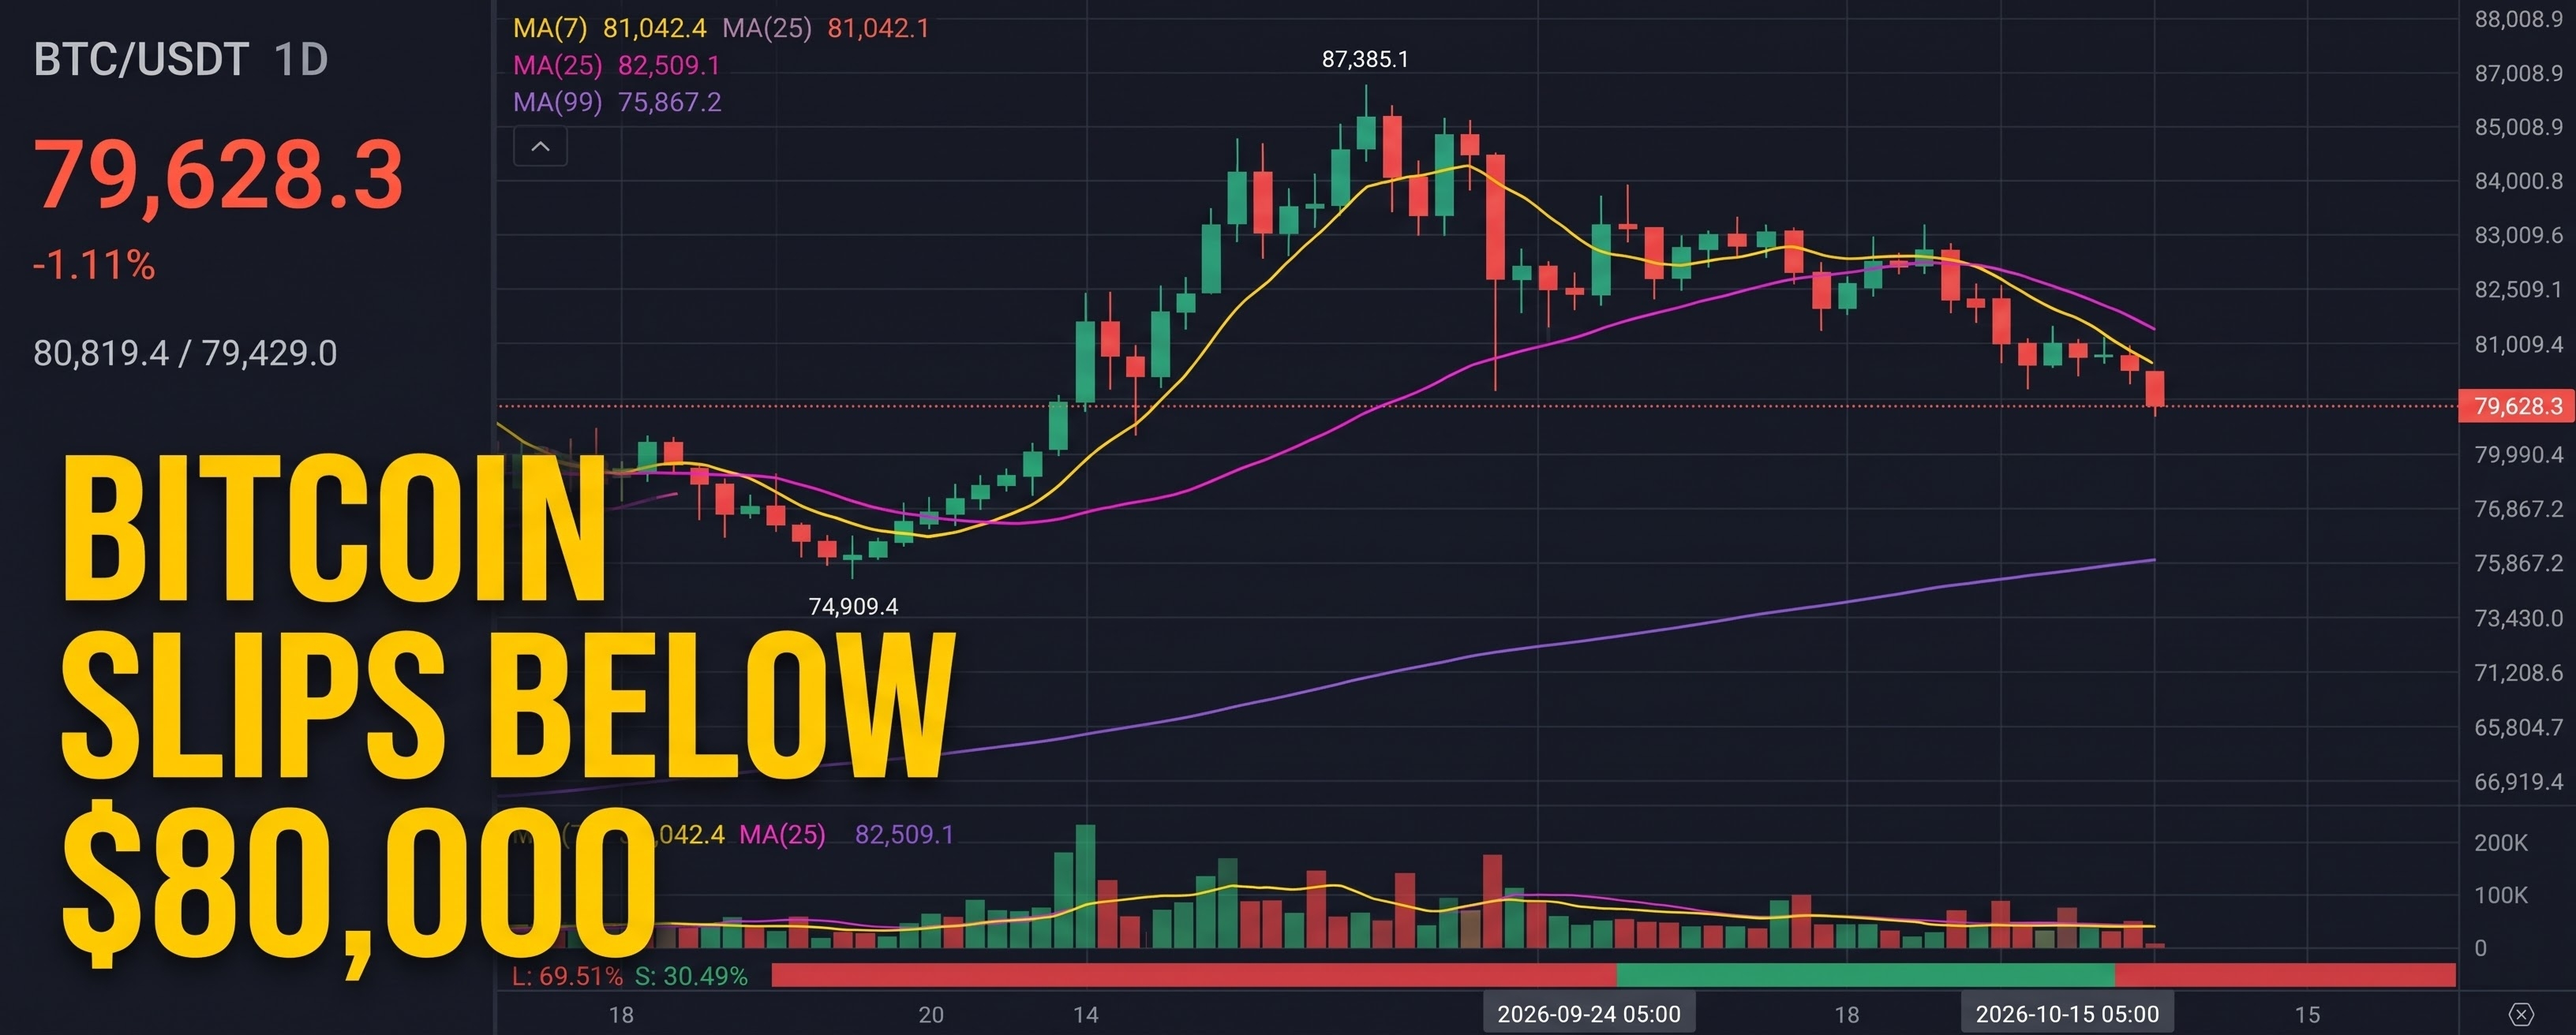
ලිපිය
🚨 THE CORRECTION EQUATION: $BTC LOSES $80K 🚨#bitcoinslipsbelow$80kagain
The bulls have officially lost the psychological line in the sand! Let’s break down the latest Bitcoin breakdown using pure math 🧮👇
(Moving Average Loss) + (Risk-Off Selling) = Key Support Test 📉
Here is the exact technical formula driving the market today:
The Price Input:
(The Breakdown) = Bitcoin has officially slipped below the critical $80,000 level, currently trading at $79,628 on the Binance Perpetual chart.
The Chart Reality:
(Technical Damage) ➔ Based on the chart data, BTC has decisively lost its short-term momentum indicators, falling below both the MA(7) at $81,042 and the MA(25) at $82,509.
The Breakdown:
With the 24-hour low tagging $79,429, the bears are firmly in control of the immediate trend. The price is now trapped in a downward trajectory, making the longer-term MA(99) sitting all the way down at $75,867 the next major structural defense line for the bulls. If buyers cannot rapidly reclaim the $81K zone, a deeper flush becomes highly probable.
Are you buying this dip or waiting for lower levels? Let's debate! 👇💬
$BTC $AIN $HUMA
{future}(HUMAUSDT)
{future}(BTCUSDT)
{future}(AINUSDT)
#BTC #cryptotrading #Binance #TechnicalAnalysis
🚨 THE CORRECTION EQUATION: $BTC LOSES $80K 🚨
#bitcoinslipsbelow$80kagain
The bulls have officially lost the psychological line in the sand! Let’s break down the latest Bitcoin breakdown using pure math 🧮👇
(Moving Average Loss) + (Risk-Off Selling) = Key Support Test 📉
Here is the exact technical formula driving the market today:
The Price Input:
(The Breakdown) = Bitcoin has officially slipped below the critical $80,000 level, currently trading at $79,628 on the Binance Perpetual chart.
The Chart Reality:
(Technical Damage) ➔ Based on the chart data, BTC has decisively lost its short-term momentum indicators, falling below both the MA(7) at $81,042 and the MA(25) at $82,509.
The Breakdown:
With the 24-hour low tagging $79,429, the bears are firmly in control of the immediate trend. The price is now trapped in a downward trajectory, making the longer-term MA(99) sitting all the way down at $75,867 the next major structural defense line for the bulls. If buyers cannot rapidly reclaim the $81K zone, a deeper flush becomes highly probable.
Are you buying this dip or waiting for lower levels? Let's debate! 👇💬
$BTC $AIN $HUMA
#BTC #cryptotrading #Binance #TechnicalAnalysis
1
4.9k


·
--
Bitcoin Slips Below $80K Again: Is $79K the Level That Decides the Next Move?#BitcoinSlipsBelow$80KAgain
$BTC
{spot}(BTCUSDT)
Bitcoin slipped below $80K again, dipping to around $79.3K on Monday, its lowest level in over a month. Three things are weighing on the price: roughly $770M left US spot Bitcoin ETFs on Thursday and Friday, leveraged longs were flushed over the weekend, and traders are cutting risk ahead of Wednesday's Fed decision. Strategy also paused its buying after five straight weeks of additions.
My take: this looks more like cautious positioning than panic. The $80K level has been tested several times, and $79K is the key support I'm watching on the daily close. A sustained break below it could open the door to $75K, while reclaiming $82K would ease the selling pressure. Until the Fed decision is out, I expect choppy, range-bound price action, and I'd rather wait for confirmation than chase a move in either direction.
What's your view: bounce from $79K or a deeper drop? Tell me below 👇
Follow me for more trading content and market updates.
#BTC #CryptoMarkets #BinanceSquare
Bitcoin Slips Below $80K Again: Is $79K the Level That Decides the Next Move?
#BitcoinSlipsBelow$80KAgain
$BTC
Bitcoin slipped below $80K again, dipping to around $79.3K on Monday, its lowest level in over a month. Three things are weighing on the price: roughly $770M left US spot Bitcoin ETFs on Thursday and Friday, leveraged longs were flushed over the weekend, and traders are cutting risk ahead of Wednesday's Fed decision. Strategy also paused its buying after five straight weeks of additions.
My take: this looks more like cautious positioning than panic. The $80K level has been tested several times, and $79K is the key support I'm watching on the daily close. A sustained break below it could open the door to $75K, while reclaiming $82K would ease the selling pressure. Until the Fed decision is out, I expect choppy, range-bound price action, and I'd rather wait for confirmation than chase a move in either direction.
What's your view: bounce from $79K or a deeper drop? Tell me below 👇
Follow me for more trading content and market updates.
#BTC #CryptoMarkets #BinanceSquare
1
5.2k

·
--
උසබ තත්ත්වය
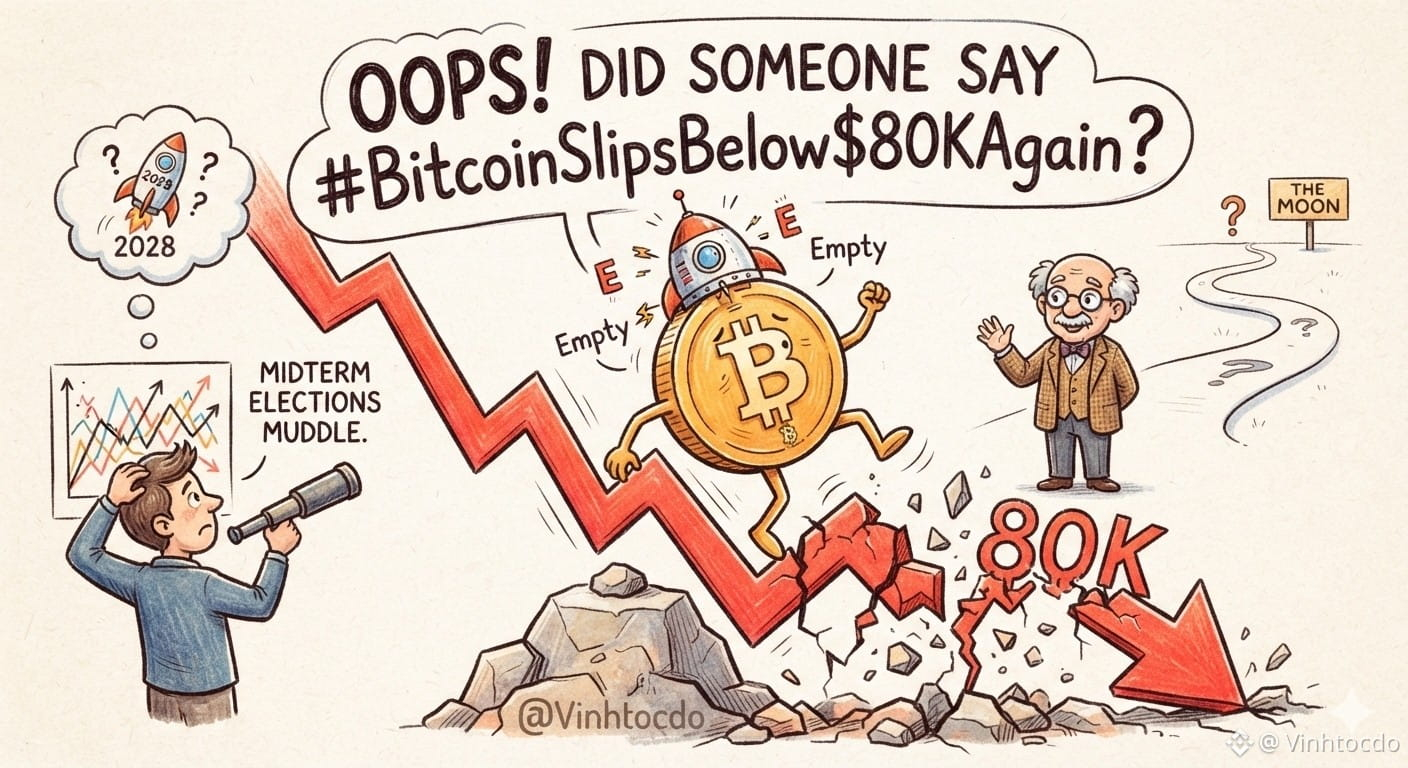
Bitcoin vừa làm một cú "quay xe" nhẹ về đầu 79k, khiến dân tình nháo nhào hô hào #BitcoinSlipsBelow$80KAgain ! Phân tích chi tiết cho thấy: 24h qua cụ tăng có 0.42%, lẹt đẹt như thể hết xăng. Thêm quả bầu cử giữa nhiệm kỳ Mỹ khiến nến chạy giật cục, rồi mô phỏng 10.000 kịch bản của Willy Woo bảo 2033 lên 1 triệu đô làm anh em "bán tín bán nghi".
Trader phải làm gì lúc này?
1️⃣ Đừng hoảng loạn: Glassnode bảo áp lực bán giảm rồi, vị thế này ngon hơn tháng trước.
2️⃣ Tắt app đi ngủ, chờ cụ tích lũy hoặc "về bờ".
3️⃣ Thắt dây an toàn, chuẩn bị cho đỉnh 2028!
Đây không phải lời khuyên tài chính! Đăng ký Binance ngay để bắt đáy: [binance.com](https://www.binance.com/register?ref=VINHTOCDO) (Mã giới thiệu: VINHTOCDO).
Click giao dịch bên dưới để ủng hộ tôi:
$BTC
{spot}(BTCUSDT)
$ETH
{spot}(ETHUSDT)
$BNB
{spot}(BNBUSDT)
#VINHTOCDO #CryptoTrading #BitcoinUpdate #CryptoNews #BullRun #Altcoins
Bitcoin vừa làm một cú "quay xe" nhẹ về đầu 79k, khiến dân tình nháo nhào hô hào #BitcoinSlipsBelow$80KAgain ! Phân tích chi tiết cho thấy: 24h qua cụ tăng có 0.42%, lẹt đẹt như thể hết xăng. Thêm quả bầu cử giữa nhiệm kỳ Mỹ khiến nến chạy giật cục, rồi mô phỏng 10.000 kịch bản của Willy Woo bảo 2033 lên 1 triệu đô làm anh em "bán tín bán nghi".
Trader phải làm gì lúc này?
1️⃣ Đừng hoảng loạn: Glassnode bảo áp lực bán giảm rồi, vị thế này ngon hơn tháng trước.
2️⃣ Tắt app đi ngủ, chờ cụ tích lũy hoặc "về bờ".
3️⃣ Thắt dây an toàn, chuẩn bị cho đỉnh 2028!
Đây không phải lời khuyên tài chính! Đăng ký Binance ngay để bắt đáy: binance.com (Mã giới thiệu: VINHTOCDO).
Click giao dịch bên dưới để ủng hộ tôi:
$BTC
$ETH
$BNB
#VINHTOCDO #CryptoTrading #BitcoinUpdate #CryptoNews #BullRun #Altcoins
4
233

·
--
උසබ තත්ත්වය
#BitcoinSlipsBelow$80KAgain Bitcoin has slipped below the $80,000 threshold again, signaling a notable shift in short-term market momentum. This recent price pullback highlights the ongoing battle between buyers and sellers at these elevated price levels. For traders, breaching this key psychological barrier reflects underlying liquidity dynamics and shifting risk appetite across the broader digital asset ecosystem.
The drop below $80k matters because it tests critical technical support zones. When a major round number fails to hold, it often triggers automated stop-losses, accelerating downward price pressure. However, it also presents a potential accumulation opportunity for long-term investors who view these dips as strategic entry points. Overall market sentiment is currently transitioning from exuberance to caution, with traders closely monitoring order books for signs of a definitive bottom.
Looking ahead, market participants should watch trading volume and spot ETF flows to gauge the true strength of this correction. If Bitcoin can reclaim $80,000 with strong volume, the broader bullish structure remains intact. Conversely, a sustained break could open the path toward the $75,000 support region. Navigating this current market volatility requires strict risk management and patience.
#Bitcoin #CryptoMarket #BTC #Trading
$HUMA $BANK $BTC
{future}(BTCUSDT)
{future}(BANKUSDT)
{future}(HUMAUSDT)
#BitcoinSlipsBelow$80KAgain Bitcoin has slipped below the $80,000 threshold again, signaling a notable shift in short-term market momentum. This recent price pullback highlights the ongoing battle between buyers and sellers at these elevated price levels. For traders, breaching this key psychological barrier reflects underlying liquidity dynamics and shifting risk appetite across the broader digital asset ecosystem.
The drop below $80k matters because it tests critical technical support zones. When a major round number fails to hold, it often triggers automated stop-losses, accelerating downward price pressure. However, it also presents a potential accumulation opportunity for long-term investors who view these dips as strategic entry points. Overall market sentiment is currently transitioning from exuberance to caution, with traders closely monitoring order books for signs of a definitive bottom.
Looking ahead, market participants should watch trading volume and spot ETF flows to gauge the true strength of this correction. If Bitcoin can reclaim $80,000 with strong volume, the broader bullish structure remains intact. Conversely, a sustained break could open the path toward the $75,000 support region. Navigating this current market volatility requires strict risk management and patience.
#Bitcoin #CryptoMarket #BTC #Trading
$HUMA $BANK $BTC

324

#BitcoinSlipsBelow$80KAgain
A batalha entre compradores e vendedores continua intensa.
O Bitcoin voltou a perder o suporte dos 80.000 dólares.
Para uns, a quebra deste nível é um sinal de alerta que aciona ordens automáticas de stop-loss. Para os investidores de longo prazo, representa uma janela de acumulação estratégica em zonas de suporte fundamentais.
A grande questão é separar o ruído da tendência. O mercado mudou de humor: da euforia para a cautela. Fique atento aos dados reais:
1. Volume de negociação.
2. Entradas e saídas nos ETFs à vista.
Recuperar os 80.000 dólares com força valida a estrutura altista mais ampla. Caso contrário, o próximo grande suporte técnico é na zona dos 75.000 dólares.
Neste cenário, a gestão de risco rigorosa e a paciência são os seus maiores ativos.
$HUMA $BANK $BTC
#Bitcoin #BTC #Trading
{spot}(HUMAUSDT)
{spot}(BANKUSDT)
{spot}(BTCUSDT)
#BitcoinSlipsBelow$80KAgain
A batalha entre compradores e vendedores continua intensa.
O Bitcoin voltou a perder o suporte dos 80.000 dólares.
Para uns, a quebra deste nível é um sinal de alerta que aciona ordens automáticas de stop-loss. Para os investidores de longo prazo, representa uma janela de acumulação estratégica em zonas de suporte fundamentais.
A grande questão é separar o ruído da tendência. O mercado mudou de humor: da euforia para a cautela. Fique atento aos dados reais:
1. Volume de negociação.
2. Entradas e saídas nos ETFs à vista.
Recuperar os 80.000 dólares com força valida a estrutura altista mais ampla. Caso contrário, o próximo grande suporte técnico é na zona dos 75.000 dólares.
Neste cenário, a gestão de risco rigorosa e a paciência são os seus maiores ativos.
$HUMA $BANK $BTC
#Bitcoin #BTC #Trading

40

·
--

ලිපිය
BitcoinSlipsBelow$80KAgain: Market Reality, Liquidation Waves, and What Lies Ahead#BitcoinSlipsBelow$80KAgain
The cryptocurrency market has once again found itself gripped by intense volatility. Bitcoin (BTC) has faced heavy downward pressure, slipping beneath the crucial psychological and structural milestone of $80,000.
For months, $80K served as a closely watched psychological floor—and notably, it aligns close to the average cost basis for several corporate treasuries holding Bitcoin on their balance sheets. With prices dipping underneath this threshold, market participants are left scrambling to assess whether this is a temporary shakeout or the beginning of a deeper correction.
📉 The Reality Check: What Triggered the Drop?
Recent market downturns were not driven by a single catalyst, but rather a combination of macroeconomic headwinds, geopolitical tensions, and structural leverage unwinding:
Massive Long Liquidations: According to data from CoinGlass, the sudden slide triggered massive waves of liquidations. Over $800 million in leveraged positions were wiped out in a single 24-hour period, with overly optimistic long traders absorbing the vast majority of the losses as prices broke key supports.Macro & Geopolitical Pressures: Escalating geopolitical tensions in the Middle East and rising crude oil prices have severely dampened global risk appetite. With energy costs climbing, inflation fears have resurfaced, causing institutional investors to pull back from risk-on assets like crypto ahead of upcoming central bank decisions.Corporate Treasuries Underwater: Glassnode estimates indicate that Bitcoin slipping below $80,000 places the average corporate treasury position at an unrealized loss, adding psychological weight to the current market sentiment.📊 Bitcoin ($BTC ) Trade Plan{spot}(BTCUSDT)Note: The market is experiencing heightened volatility due to macroeconomic triggers and geopolitical tension. Focus on spot trading or use strict risk management for leveraged positions.
🟢 Scenario 1: Bullish Reclaim (Long Setup)
Trigger: BTC reclaims and closes a 4-hour candle above the $81,500 – $82,000 resistance zone.Entry Zone: $81,200 – $82,000Target 1: $84,500Target 2: $87,000Target 3: $92,000 – $94,000Stop Loss: $79,500 (Strict SL)
🔴 Scenario 2: Bearish Breakdown (Short Setup)
Trigger: Price breaks below the key $79,000 support level and closes a 1-hour/4-hour candle beneath it.Entry Zone: $78,800 – $79,200Target 1: $76,500Target 2: $74,200 (Liquidity gap fill)Target 3: $71,000 – $72,500Stop Loss: $80,800
🟡 Scenario 3: Demand Zone Accumulation (Spot Buying)
Strategy: Look for DCA (Dollar-Cost Averaging) spot buying opportunities if price drops into the key demand zone.Buy Zone: $74,000 – $76,500Long-Term Target: $88,000+Invalidation / Cut-Loss: Daily close below $72,000
🔍 Technical Outlook: Support and Resistance Zones
Analysts are closely monitoring key technical levels to gauge the next market direction:
Immediate Resistance: Bitcoin must reclaim and hold $83,000 to invalidate current bearish momentum and signal a return to stability.Downside Support: If selling continues, analysts point to immediate support around $77,876, with a broader, more substantial demand zone sitting between $72,500 and $76,700.
💡 Summary: Navigating the Volatility
Cover images capturing this moment—such as a stressed investor checking charts in a dimly lit diner—reflect the raw emotional reality of crypto trading during sudden flash crashes. However, seasoned market participants view these phases as a test of risk management rather than panic.
As leverage is flushed out of the system, the market ultimately purges excess speculation. Whether Bitcoin builds a base to bounce back or tests lower supports will depend heavily on macro developments and institutional capital flows in the coming days.
#bitcoin #BTC #CryptoMarket #CryptoNews
BitcoinSlipsBelow$80KAgain: Market Reality, Liquidation Waves, and What Lies Ahead
#BitcoinSlipsBelow$80KAgain
The cryptocurrency market has once again found itself gripped by intense volatility. Bitcoin (BTC) has faced heavy downward pressure, slipping beneath the crucial psychological and structural milestone of $80,000.
For months, $80K served as a closely watched psychological floor—and notably, it aligns close to the average cost basis for several corporate treasuries holding Bitcoin on their balance sheets. With prices dipping underneath this threshold, market participants are left scrambling to assess whether this is a temporary shakeout or the beginning of a deeper correction.
📉 The Reality Check: What Triggered the Drop?
Recent market downturns were not driven by a single catalyst, but rather a combination of macroeconomic headwinds, geopolitical tensions, and structural leverage unwinding:
Massive Long Liquidations: According to data from CoinGlass, the sudden slide triggered massive waves of liquidations. Over $800 million in leveraged positions were wiped out in a single 24-hour period, with overly optimistic long traders absorbing the vast majority of the losses as prices broke key supports.Macro & Geopolitical Pressures: Escalating geopolitical tensions in the Middle East and rising crude oil prices have severely dampened global risk appetite. With energy costs climbing, inflation fears have resurfaced, causing institutional investors to pull back from risk-on assets like crypto ahead of upcoming central bank decisions.Corporate Treasuries Underwater: Glassnode estimates indicate that Bitcoin slipping below $80,000 places the average corporate treasury position at an unrealized loss, adding psychological weight to the current market sentiment.📊 Bitcoin ($BTC ) Trade PlanNote: The market is experiencing heightened volatility due to macroeconomic triggers and geopolitical tension. Focus on spot trading or use strict risk management for leveraged positions.
🟢 Scenario 1: Bullish Reclaim (Long Setup)
Trigger: BTC reclaims and closes a 4-hour candle above the $81,500 – $82,000 resistance zone.Entry Zone: $81,200 – $82,000Target 1: $84,500Target 2: $87,000Target 3: $92,000 – $94,000Stop Loss: $79,500 (Strict SL)
🔴 Scenario 2: Bearish Breakdown (Short Setup)
Trigger: Price breaks below the key $79,000 support level and closes a 1-hour/4-hour candle beneath it.Entry Zone: $78,800 – $79,200Target 1: $76,500Target 2: $74,200 (Liquidity gap fill)Target 3: $71,000 – $72,500Stop Loss: $80,800
🟡 Scenario 3: Demand Zone Accumulation (Spot Buying)
Strategy: Look for DCA (Dollar-Cost Averaging) spot buying opportunities if price drops into the key demand zone.Buy Zone: $74,000 – $76,500Long-Term Target: $88,000+Invalidation / Cut-Loss: Daily close below $72,000
🔍 Technical Outlook: Support and Resistance Zones
Analysts are closely monitoring key technical levels to gauge the next market direction:
Immediate Resistance: Bitcoin must reclaim and hold $83,000 to invalidate current bearish momentum and signal a return to stability.Downside Support: If selling continues, analysts point to immediate support around $77,876, with a broader, more substantial demand zone sitting between $72,500 and $76,700.
💡 Summary: Navigating the Volatility
Cover images capturing this moment—such as a stressed investor checking charts in a dimly lit diner—reflect the raw emotional reality of crypto trading during sudden flash crashes. However, seasoned market participants view these phases as a test of risk management rather than panic.
As leverage is flushed out of the system, the market ultimately purges excess speculation. Whether Bitcoin builds a base to bounce back or tests lower supports will depend heavily on macro developments and institutional capital flows in the coming days.
#bitcoin #BTC #CryptoMarket #CryptoNews
27

·
--
#BitcoinSlipsBelow$80KAgain
Bitcoin fiyatı yeniden 80.000$ seviyesinin altına geriledi
📉 Sert Düşüş: Kripto para piyasalarında satış baskısı arttı.₿ Bitcoin (BTC): Önemli bir psikolojik destek seviyesi olan 80.000$ sınırını koruyamadı.🔻 Geri Çekilme: Ayıların baskısıyla fiyatlar kırmızı bölgeye doğru kaydı.💸 Yatırımcı Tedirgin: Piyasada kısa vadeli kar realizasyonları ve panik satışları gözleniyor.
$BTC $BR $ZEC
{future}(ZECUSDT)
{alpha}(560xff7d6a96ae471bbcd7713af9cb1feeb16cf56b41)
{future}(BTCUSDT)
#BitcoinSlipsBelow$80KAgain
Bitcoin fiyatı yeniden 80.000$ seviyesinin altına geriledi
📉 Sert Düşüş: Kripto para piyasalarında satış baskısı arttı.₿ Bitcoin (BTC): Önemli bir psikolojik destek seviyesi olan 80.000$ sınırını koruyamadı.🔻 Geri Çekilme: Ayıların baskısıyla fiyatlar kırmızı bölgeye doğru kaydı.💸 Yatırımcı Tedirgin: Piyasada kısa vadeli kar realizasyonları ve panik satışları gözleniyor.
$BTC $BR $ZEC

137
·
--
#BitcoinSlipsBelow$80KAgain
Bitcoin ($BTC) briefly slipped below the psychological $80,000 baseline to test lower demand zones around $79,840. Increased cross-asset risk-off sentiment—driven by upcoming macro catalysts, corporate earnings volatility, and institutional portfolio rebalancing—triggered brief liquidation flushes across perpetual swap order books. However, high-frequency spot buying quickly emerged at lower support boundaries, driving a rapid price stabilization back into key horizontal trading ranges.
Market Analysis & Structural Liquidity
The brief dip below $80,000 cleared over-leveraged long positions, resetting funding rates across major exchanges.
Quantitative institutional desks on Binance Square are monitoring high-timeframe demand zones. While macro uncertainty keeps market participants cautious, sustained spot ETF demand and strong structural support along the $80,000 floor continue to prevent deeper structural breakdowns.
Core Structural Demand Zone ($BTC): $79,800–$80,200 serves as the primary institutional defense line defending high-timeframe market structure.
Highlighted Tradeable Asset (Digital Reserve Benchmark)
$BTC (Bitcoin): Dominant store-of-value asset; primary proxy for global macro liquidity and cross-market risk sentiment.
Current Spot Price: ~$82,680
Target 1 (Immediate Resistance): $84,200 – Primary horizontal overhead supply barrier.
Target 2 (Mid-Term Expansion): $87,500 – Structural momentum expansion boundary.
Key Support / Invalidation: $80,200 – Critical lower timeframe demand floor.
Will Bitcoin defend the $80,000 support floor for a push toward $85,000, or will macro volatility cause a deeper retest? Share your strategy below! 👇
Disclaimer: This post is for informational and educational purposes only and does not constitute financial advice. Digital assets carry high market risk; always conduct your own research (DYOR) before trading.
{spot}(BTCUSDT)
#bitcoin #BTC #cryptotrading #MarketAnalysis
#BitcoinSlipsBelow$80KAgain
Bitcoin ($BTC ) briefly slipped below the psychological $80,000 baseline to test lower demand zones around $79,840. Increased cross-asset risk-off sentiment—driven by upcoming macro catalysts, corporate earnings volatility, and institutional portfolio rebalancing—triggered brief liquidation flushes across perpetual swap order books. However, high-frequency spot buying quickly emerged at lower support boundaries, driving a rapid price stabilization back into key horizontal trading ranges.
Market Analysis & Structural Liquidity
The brief dip below $80,000 cleared over-leveraged long positions, resetting funding rates across major exchanges.
Quantitative institutional desks on Binance Square are monitoring high-timeframe demand zones. While macro uncertainty keeps market participants cautious, sustained spot ETF demand and strong structural support along the $80,000 floor continue to prevent deeper structural breakdowns.
Core Structural Demand Zone ($BTC ): $79,800–$80,200 serves as the primary institutional defense line defending high-timeframe market structure.
Highlighted Tradeable Asset (Digital Reserve Benchmark)
$BTC (Bitcoin): Dominant store-of-value asset; primary proxy for global macro liquidity and cross-market risk sentiment.
Current Spot Price: ~$82,680
Target 1 (Immediate Resistance): $84,200 – Primary horizontal overhead supply barrier.
Target 2 (Mid-Term Expansion): $87,500 – Structural momentum expansion boundary.
Key Support / Invalidation: $80,200 – Critical lower timeframe demand floor.
Will Bitcoin defend the $80,000 support floor for a push toward $85,000, or will macro volatility cause a deeper retest? Share your strategy below! 👇
Disclaimer: This post is for informational and educational purposes only and does not constitute financial advice. Digital assets carry high market risk; always conduct your own research (DYOR) before trading.
#bitcoin #BTC #cryptotrading #MarketAnalysis
108

·
--
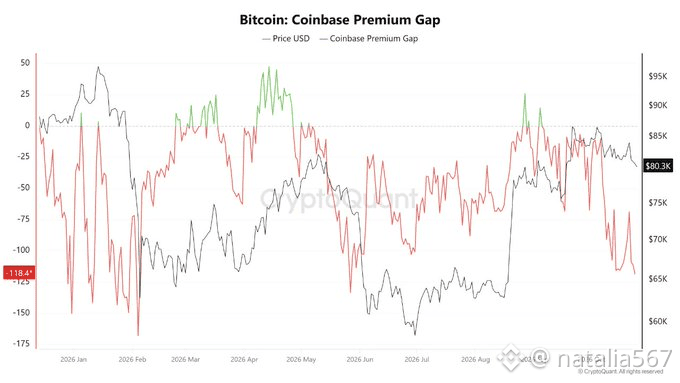
$BTC rebound looks strong, but the spot demand isn’t confirming it yet.
The Coinbase Premium Gap just hit a 5-month low at -$118, showing weak U.S. buying pressure.
Meanwhile, $80M+ in bids are stacked around $78K–$79K.
The real test is $85K.
Over $10B in upside liquidity sits above it vs just $3B below $80K. A clean break above $85K could trigger a massive short squeeze.
Until spot demand returns, this still looks more like a macro-driven relief rally than a confirmed breakout.
Bull trap or setup for the next liquidity sweep?
#BitcoinSlipsBelow$80KAgain #EthereumDropsBelow$2300
Leo - F0:
How are you natalia 👋
8
4
55

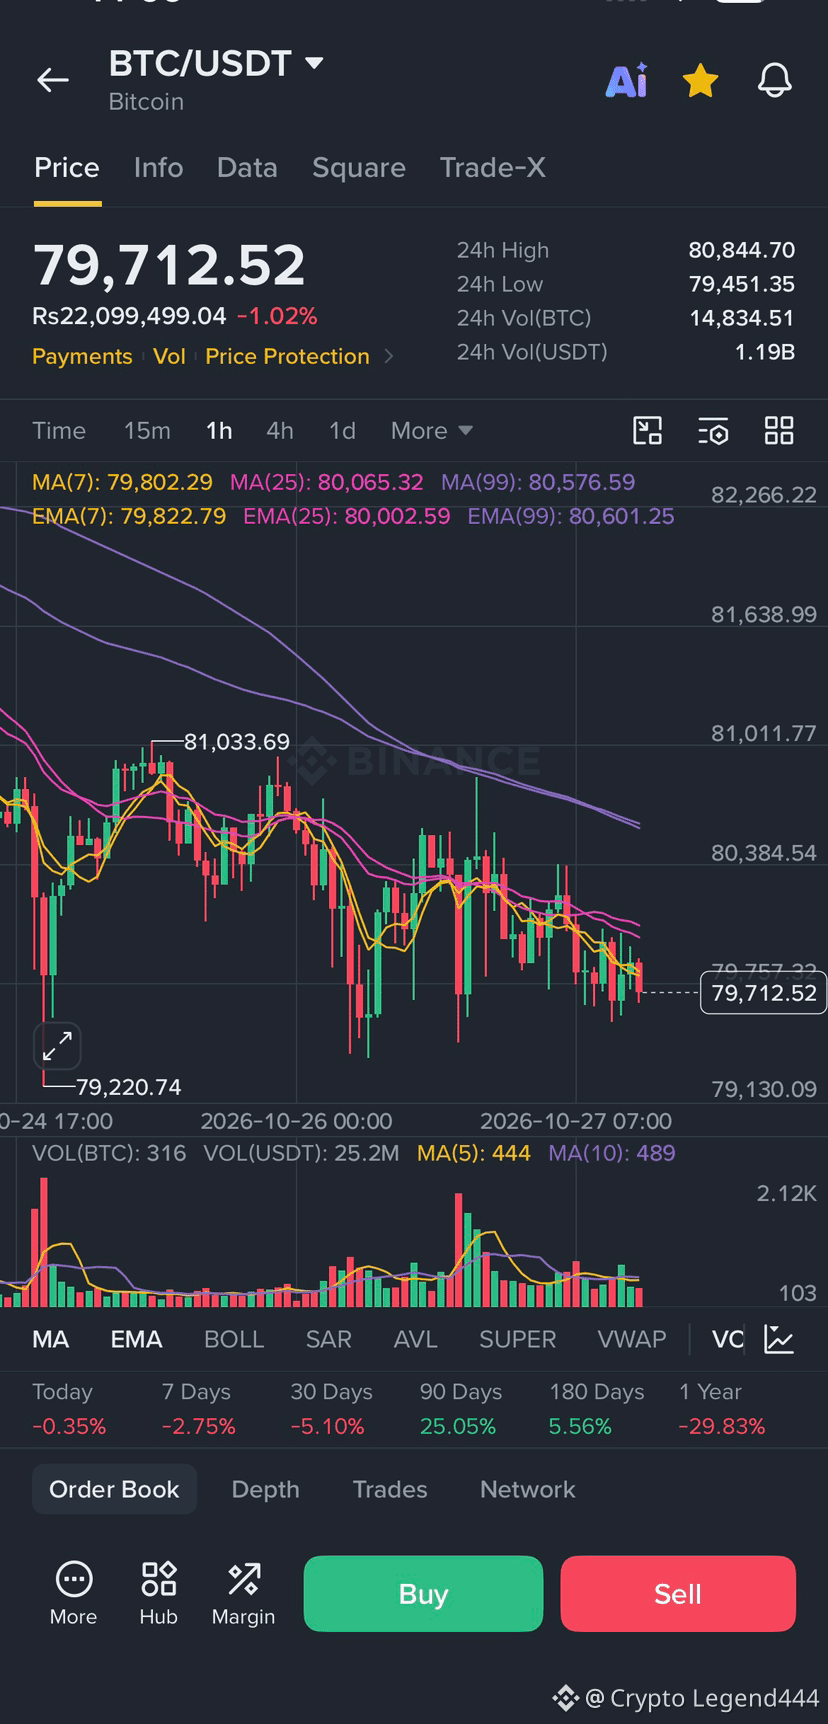
🚨 $BTC : $85K OR $75K FIRST? 👀
BTC got rejected near $87K and is testing the $80K zone.
📉 Breakdown: $76K–$72.5K
📈 Bounce: $85K
👇 What’s your call?
🟢 BULL = $85K
🔴 BEAR = $75K
Also watching short setups on $BULLA & $Q 🔥
#BTC #crypto #BitcoinSlipsBelow$80KAgain
{future}(BTCUSDT)
🚨 $BTC : $85K OR $75K FIRST? 👀
BTC got rejected near $87K and is testing the $80K zone.
📉 Breakdown: $76K–$72.5K
📈 Bounce: $85K
👇 What’s your call?
🟢 BULL = $85K
🔴 BEAR = $75K
Also watching short setups on $BULLA & $Q 🔥
#BTC #crypto #BitcoinSlipsBelow$80KAgain
BTC got rejected near $87K and is testing the $80K zone.
📉 Breakdown: $76K–$72.5K
📈 Bounce: $85K
👇 What’s your call?
🟢 BULL = $85K
🔴 BEAR = $75K
Also watching short setups on $BULLA & $Q 🔥
#BTC #crypto #BitcoinSlipsBelow$80KAgain
465

·
--
هل تتوقعون عودة البيتكوين فوق 82,000 دولار قبل قرار الفيدرالي، أم سيختبر مستوى 79,000 دولار أولًا؟ وما العامل الأكثر تأثيرًا في توقعاتكم؟
👇 شاركونا تحليلاتكم في التعليقات#BitcoinSlipsBelow$80KAgain $
هل تتوقعون عودة البيتكوين فوق 82,000 دولار قبل قرار الفيدرالي، أم سيختبر مستوى 79,000 دولار أولًا؟ وما العامل الأكثر تأثيرًا في توقعاتكم؟
👇 شاركونا تحليلاتكم في التعليقات#BitcoinSlipsBelow$80KAgain $
👇 شاركونا تحليلاتكم في التعليقات#BitcoinSlipsBelow$80KAgain $
108

·
--
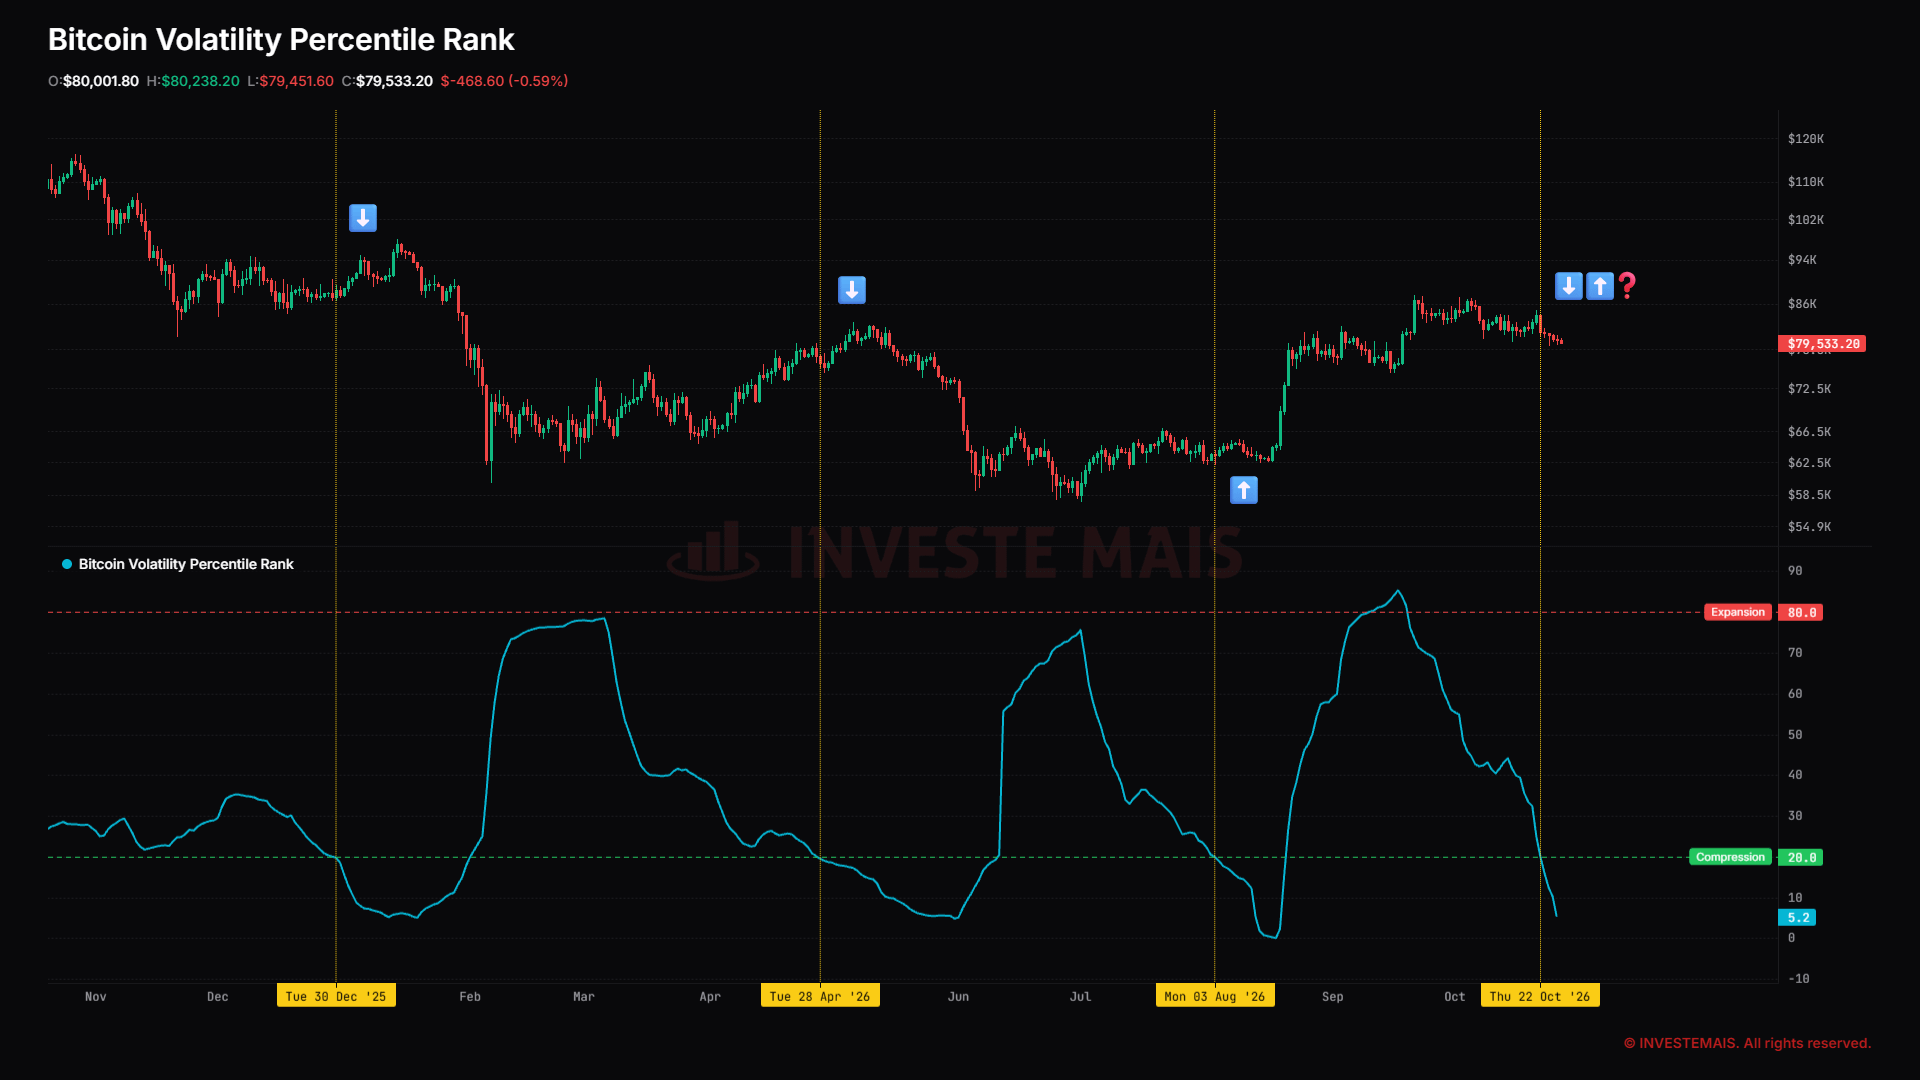
#bitcoin Volatility Percentile Rank back in Compression🟩 zone — given the low volatility and price consolidation between $84k-$80k
The market is poised for a new directional move soon...
#BTC #technicalanalyst #BitcoinSlipsBelow$80KAgain $BTC
{spot}(BTCUSDT)
#bitcoin Volatility Percentile Rank back in Compression🟩 zone — given the low volatility and price consolidation between $84k-$80k
The market is poised for a new directional move soon...
#BTC #technicalanalyst #BitcoinSlipsBelow$80KAgain $BTC
The market is poised for a new directional move soon...
#BTC #technicalanalyst #BitcoinSlipsBelow$80KAgain $BTC
7

·
--
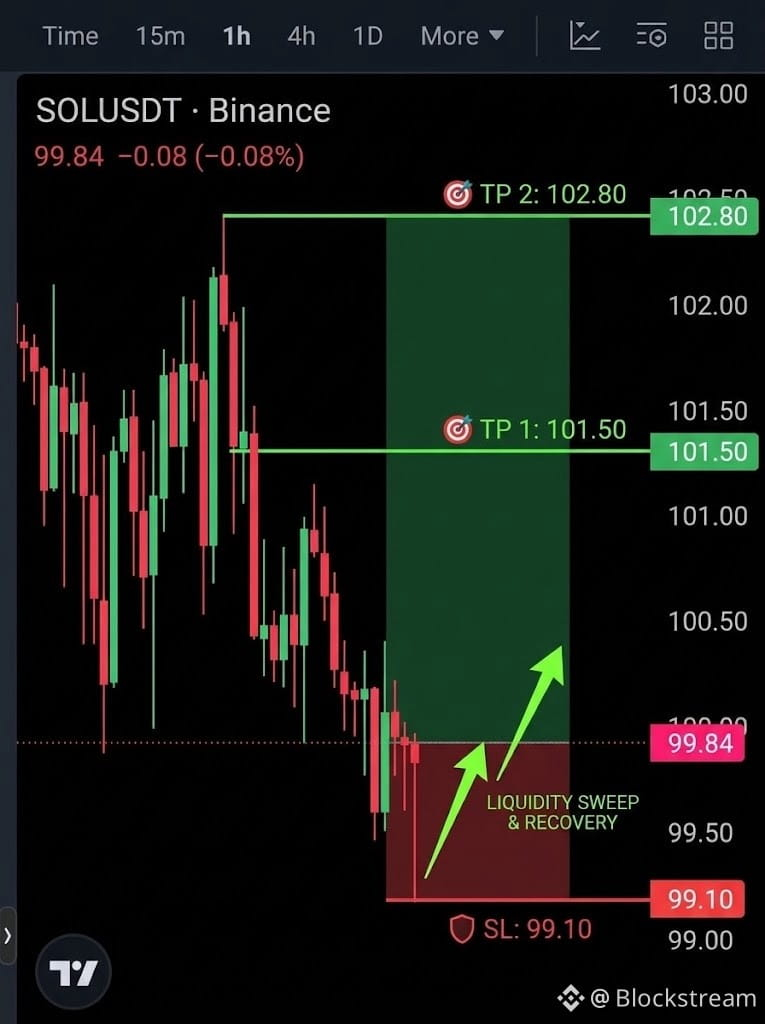
Everyone is panic-selling $SOL below $100, but smart money just swept the liquidity. 🧠⚡
On the 1H timeframe, $SOL took out the stops below $99.50 and immediately showed a strong wick rejection. Sellers are running out of steam right at key structural support.
Here is the high-probability long setup for today:
1. Liquidity sweep complete at $99.50.
2. Short positions are heavily stacked between $101.50 and $102.80.
3. Holding above $99.80 confirms a shift back into the local range.
🎯 TP1: $101.50
🎯 TP2: $102.80
🛡️ SL: $99.10
I’m trading the liquidity trap, not chasing red candles.
Are you buying this $SOL dip or waiting for $100 reclaim? Drop your thoughts below! 👇
{spot}(SOLUSDT)
#sol #BitcoinSlipsBelow$80KAgain
Everyone is panic-selling $SOL below $100, but smart money just swept the liquidity. 🧠⚡
On the 1H timeframe, $SOL took out the stops below $99.50 and immediately showed a strong wick rejection. Sellers are running out of steam right at key structural support.
Here is the high-probability long setup for today:
1. Liquidity sweep complete at $99.50.
2. Short positions are heavily stacked between $101.50 and $102.80.
3. Holding above $99.80 confirms a shift back into the local range.
🎯 TP1: $101.50
🎯 TP2: $102.80
🛡️ SL: $99.10
I’m trading the liquidity trap, not chasing red candles.
Are you buying this $SOL dip or waiting for $100 reclaim? Drop your thoughts below! 👇
#sol #BitcoinSlipsBelow$80KAgain
2
1
218

·
--
උසබ තත්ත්වය
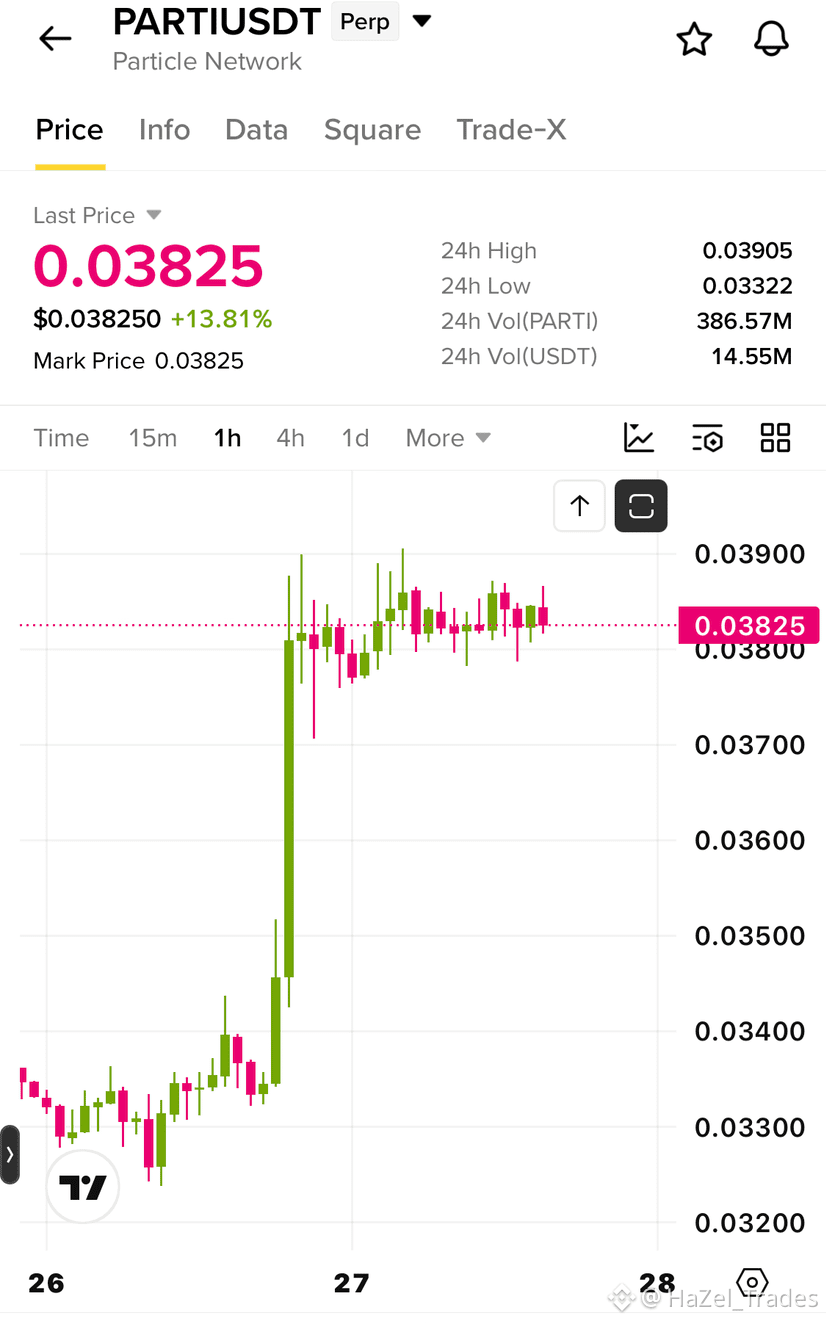
$PARTI READY FOR THE NEXT BREAKOUT WAVE! 🚀🔥
Whales are holding strong as price coils tightly under resistance.
PARTIUSDT — LONG 🚀
Entry: 0.03750–0.03840
TP1: 0.04090
TP2: 0.04280
TP3: 0.04500
SL: 0.03620
RIDE THE MOMENTUM 👇🏻🌸
— Hazel Trades 🌸
{future}(PARTIUSDT)
#BitcoinSlipsBelow$80KAgain #ThailandLaunchesWORPTStablecoinToQRPaymentApp #StrategySkipsBitcoinPurchasesSpends$205MOnSTRCBuybacks #BitmineAdds10452ETH
$PARTI READY FOR THE NEXT BREAKOUT WAVE! 🚀🔥
Whales are holding strong as price coils tightly under resistance.
PARTIUSDT — LONG 🚀
Entry: 0.03750–0.03840
TP1: 0.04090
TP2: 0.04280
TP3: 0.04500
SL: 0.03620
RIDE THE MOMENTUM 👇🏻🌸
— Hazel Trades 🌸
#BitcoinSlipsBelow$80KAgain #ThailandLaunchesWORPTStablecoinToQRPaymentApp #StrategySkipsBitcoinPurchasesSpends$205MOnSTRCBuybacks #BitmineAdds10452ETH
33
O limite psicológico foi rompido. A equação da queda do Bitcoin:
(Perda da média móvel) + (Vendas em modo de aversão ao risco) = Teste do suporte principal.
O BTC negociado a US$ 79.628 perdeu o patamar dos US$ 80.000. No gráfico técnico, os danos são visíveis: o preço caiu abaixo da MA(7) em US$ 81.042 e da MA(25) em US$ 82.509.
Os ursos assumiram o controlo, com a mínima de 24h a tocar os $79,429. A próxima grande defesa estrutural é a MA(99), nos $75,867. Para invalidar a queda acentuada, os touros precisam de recuperar a zona dos $81K rapidamente.
Estás a comprar nesta queda ou à espera de preços mais baixos? Vamos debater.
$BTC $AIN $HUMA
#BitcoinSlipsBelow$80KAgain
#BTC #cryptotrading #Binance #TechnicalAnalysis
{spot}(BTCUSDT)
{future}(AINUSDT)
{spot}(HUMAUSDT)
O limite psicológico foi rompido. A equação da queda do Bitcoin:
(Perda da média móvel) + (Vendas em modo de aversão ao risco) = Teste do suporte principal.
O BTC negociado a US$ 79.628 perdeu o patamar dos US$ 80.000. No gráfico técnico, os danos são visíveis: o preço caiu abaixo da MA(7) em US$ 81.042 e da MA(25) em US$ 82.509.
Os ursos assumiram o controlo, com a mínima de 24h a tocar os $79,429. A próxima grande defesa estrutural é a MA(99), nos $75,867. Para invalidar a queda acentuada, os touros precisam de recuperar a zona dos $81K rapidamente.
Estás a comprar nesta queda ou à espera de preços mais baixos? Vamos debater.
$BTC $AIN $HUMA
#BitcoinSlipsBelow$80KAgain
#BTC #cryptotrading #Binance #TechnicalAnalysis

1
55

·
--

ලිපිය
🇺🇸 US Durable Goods Orders will be released at 8:30 AM, right before the US market opens — the release lands at 8:30 AM ET on Tuesday, October 27, 2026, and the live consensus is around +1.3% month-over-month, which sits in your "neutral" zone, not the bullish one.** The Fed decision itself comes Wednesday, October 28, not "today" in the sense of a same-day reaction to the durable goods print.
- The durable goods number is a **September** reading, released October 27 — it's backward-looking data, not a forward signal.
- The Fed's rate announcement is **Wednesday, October 28 at 2:00 PM ET**, with Chair Kevin Warsh's press conference at 2:30 PM ET.
- The Fed is **expected to hold** at 3.75%–4.00%, not cut or hike this week.
## **Durable Goods — What's Actually Coming**
The Census Bureau publishes Durable Goods Orders at 8:30 AM ET on Tuesday, October 27, 2026. The reference month is September 2026, so this is a look backward at factory demand, not a prediction of what's next.
- Headline Durable Goods Orders: consensus around **+1.3% MoM**, with a Trading Economics forecast near **+1.5%**
- Durable Goods Ex Transportation: consensus around **+0.5% MoM**
- Prior month (August): headline came in at **0%**, ex-transport at **+0.3%**
> The ex-transportation figure matters more than the headline — aircraft orders swing wildly month to month and can distort the signal.
Your thresholds map onto the consensus like this: +1.3% sits in your **neutral band (+1.4% to +1.7%)** by a hair, well below the +2.5% bearish trigger and above the +0.5% bullish floor. So the setup is a **mildly positive but not market-moving** print, unless it surprises hard in either direction.
## **The Fed — What the Sources Actually Say**
The FOMC meets October 27–28, 2026, with the decision dropping Wednesday, October 28 at 2:00 PM ET and Chair Kevin Warsh taking questions at 2:30 PM ET.
The near-universal expectation is a **hold** at 3.75%–4.00%:
- CME FedWatch shows **less than a 10% chance** of a hike this week
- **94 of 100** economists surveyed by Reuters expect no change in October
- **All 100** expect a **December hike**
- Nearly **75%** of traders expect at least one hike by year-end
The September hike — the first since 2023 — took the range to 3.75%–4.00% by a **12–0 vote**. The pause this month is about buying time to see how Iran war fuel price hikes feed into inflation before moving again. Goldman Sachs expects the next hikes in **December and March**, following an every-other-meeting pattern.
## **What to Watch After the Decision**
Key data landing right behind the Fed:
- **October 29** — September PCE inflation and Q3 GDP
- **November 6** — October employment report
- **November 10** — CPI inflation
If the Fed holds as expected, the market's real focus shifts to Warsh's press conference tone — specifically any hint about December. A hawkish tilt there would matter far more than the durable goods print.
#BitcoinSlipsBelow$80KAgain #EthereumDropsBelow$2300 #Geopolitics
🇺🇸 US Durable Goods Orders will be released at 8:30 AM, right before the US market opens
— the release lands at 8:30 AM ET on Tuesday, October 27, 2026, and the live consensus is around +1.3% month-over-month, which sits in your "neutral" zone, not the bullish one.** The Fed decision itself comes Wednesday, October 28, not "today" in the sense of a same-day reaction to the durable goods print.
- The durable goods number is a **September** reading, released October 27 — it's backward-looking data, not a forward signal.
- The Fed's rate announcement is **Wednesday, October 28 at 2:00 PM ET**, with Chair Kevin Warsh's press conference at 2:30 PM ET.
- The Fed is **expected to hold** at 3.75%–4.00%, not cut or hike this week.
## **Durable Goods — What's Actually Coming**
The Census Bureau publishes Durable Goods Orders at 8:30 AM ET on Tuesday, October 27, 2026. The reference month is September 2026, so this is a look backward at factory demand, not a prediction of what's next.
- Headline Durable Goods Orders: consensus around **+1.3% MoM**, with a Trading Economics forecast near **+1.5%**
- Durable Goods Ex Transportation: consensus around **+0.5% MoM**
- Prior month (August): headline came in at **0%**, ex-transport at **+0.3%**
> The ex-transportation figure matters more than the headline — aircraft orders swing wildly month to month and can distort the signal.
Your thresholds map onto the consensus like this: +1.3% sits in your **neutral band (+1.4% to +1.7%)** by a hair, well below the +2.5% bearish trigger and above the +0.5% bullish floor. So the setup is a **mildly positive but not market-moving** print, unless it surprises hard in either direction.
## **The Fed — What the Sources Actually Say**
The FOMC meets October 27–28, 2026, with the decision dropping Wednesday, October 28 at 2:00 PM ET and Chair Kevin Warsh taking questions at 2:30 PM ET.
The near-universal expectation is a **hold** at 3.75%–4.00%:
- CME FedWatch shows **less than a 10% chance** of a hike this week
- **94 of 100** economists surveyed by Reuters expect no change in October
- **All 100** expect a **December hike**
- Nearly **75%** of traders expect at least one hike by year-end
The September hike — the first since 2023 — took the range to 3.75%–4.00% by a **12–0 vote**. The pause this month is about buying time to see how Iran war fuel price hikes feed into inflation before moving again. Goldman Sachs expects the next hikes in **December and March**, following an every-other-meeting pattern.
## **What to Watch After the Decision**
Key data landing right behind the Fed:
- **October 29** — September PCE inflation and Q3 GDP
- **November 6** — October employment report
- **November 10** — CPI inflation
If the Fed holds as expected, the market's real focus shifts to Warsh's press conference tone — specifically any hint about December. A hawkish tilt there would matter far more than the durable goods print.
#BitcoinSlipsBelow$80KAgain #EthereumDropsBelow$2300 #Geopolitics
12


MrRUHUL
·
--
Long Setup (Recommended on Dips)
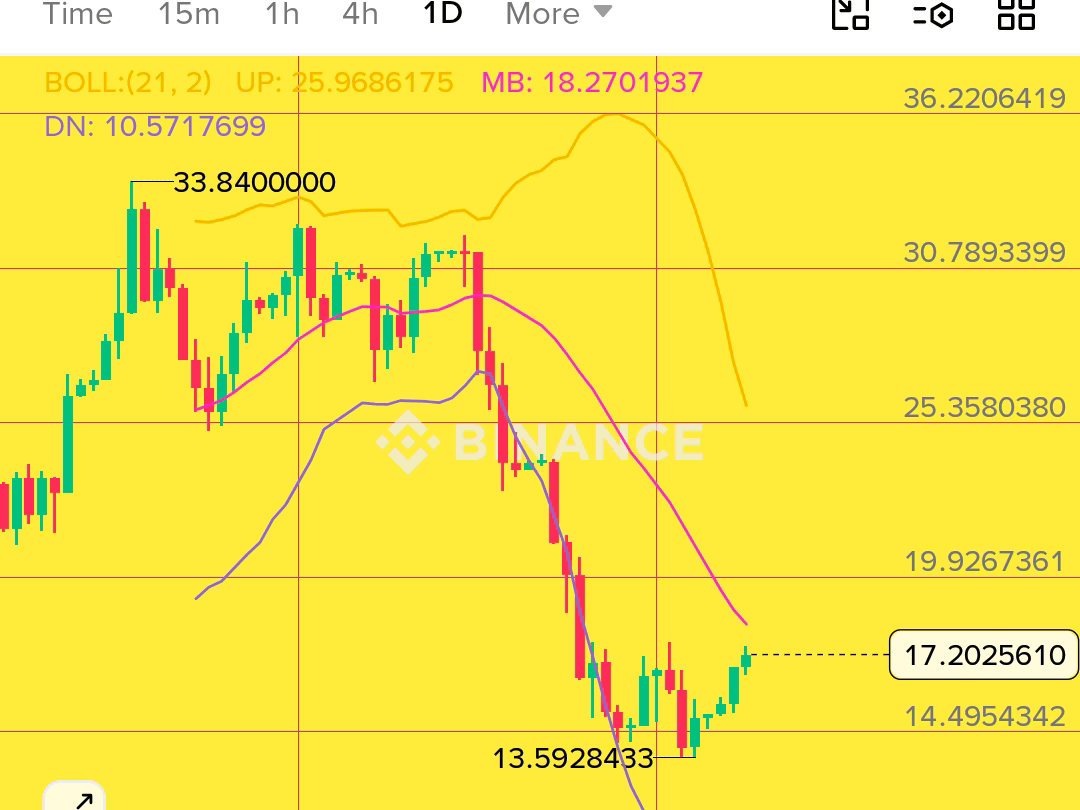
This $SKUU pulled back hard from 33.84 and is sitting around 17.20 near the middle Bollinger. Looking for a dip entry.
Entry $SKUU : 15.50 – 16.50
SL: 14.00
TP1: 21.00
TP2: 23.50
This $SKUU pulled back hard from 33.84 and is sitting around 17.20 near the middle Bollinger. Looking for a dip entry.
Entry $SKUU : 15.50 – 16.50
SL: 14.00
TP1: 21.00
TP2: 23.50
1
6

·
--
උසබ තත්ත්වය
💎Trading Strategy for $BTC Bitcoin Tonight.
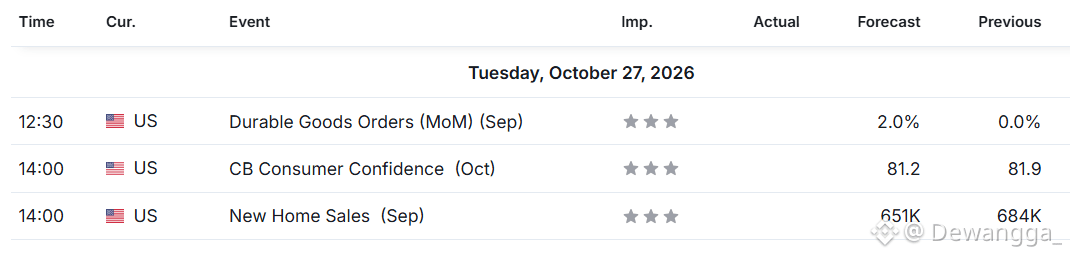
1. If Durable Goods Orders data 🟥RED => LONG📈
2. If Durable Goods Orders data 🟩GREEN => SHORT📉
3. Take Profit before 14:00 GMT🛑
4. If CB Consumer Confidence and New Home Sales data 🟥RED => LONG📈
5. If CB Consumer Confidence and New Home Sales data 🟩GREEN => SHORT📉
6. if CB Consumer Confidence and New Home Sales data are 🟩🟥MIXED => DON'T TRADING🛑
4. Don't be greedy, discipline Take Profits.
Data releases at 12:30 GMT (Durable Goods Orders) and 14:00 GMT (CB Consumer Confidence and New Home Sales) You can check the data on the Economic Calendar here: investing. com/economic-calendar or Investing apps (playstore/ appstore)
NFA DYOR 🔥
Not a Buy/Sell Signal🛑
Follow and tip if you find this helpful☕️
$QNT $MINA #EthereumDropsBelow$2300 #BitcoinSlipsBelow$80KAgain #ThailandLaunchesWORPTStablecoinToQRPaymentApp #StrategySkipsBitcoinPurchasesSpends$205MOnSTRCBuybacks #BitmineAdds10452ETH
53

·
--
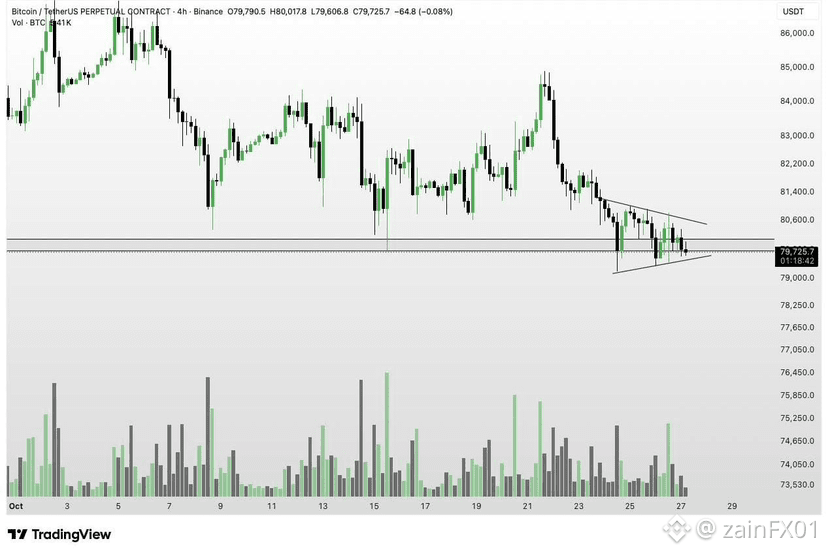
*$BTC symmetrical triangle in 4-hr 👀#BitcoinSlipsBelow$80KAgain
*$BTC symmetrical triangle in 4-hr 👀#BitcoinSlipsBelow$80KAgain
54
තවත් අන්තර්ගතයන් ගවේෂණය කිරීමට ඇතුල් වන්න
Binance චතුරශ්රය හි ගෝලීය ක්රිප්ටෝ පරිශීලකයින් හා එක්වන්න
⚡️ ක්රිප්ටෝ පිළිබඳ නවතම සහ ප්රයෝජනවත් තොරතුරු ලබා ගන්න.
💬 ලොව විශාලතම ක්රිප්ටෝ හුවමාරුව මගින් විශ්වාස කෙරේ.
👍 සත්යායනය කරන ලද නිර්මාණකරුවන්ගෙන් සැබෑ විදසුන් සොයා ගන්න.
විද්යුත් තැපෑල / දුරකථන අංකය
නැගී එන මාතෘකා
1
#EthereumDropsBelow$2300
1,562 නැරඹීම්
68 සාකච්ඡා කරමින්
2
#BitcoinSlipsBelow$80KAgain
3,040 නැරඹීම්
41 සාකච්ඡා කරමින්
3
#ThailandLaunchesWORPTStablecoinToQRPaymentApp
4,553 නැරඹීම්
123 සාකච්ඡා කරමින්
4
#StrategySkipsBitcoinPurchasesSpends$205MOnSTRCBuybacks
3,675 නැරඹීම්
73 සාකච්ඡා කරමින්
5
#BitmineAdds10452ETH
38,907 නැරඹීම්
593 සාකච්ඡා කරමින්
6
#SouthKoreaConsidersEducationTaxOnCryptoExchanges
22,009 නැරඹීම්
462 සාකච්ඡා කරමින්
7
#OCCUrgesCommunityBanksToEnterStablecoinPayments
17,014 නැරඹීම්
301 සාකච්ඡා කරමින්
8
#RippleWinsFullApprovalAsNationalTrustBank
23,524 නැරඹීම්
298 සාකච්ඡා කරමින්
9
#AkashSelectsSolanaAsMigrationTarget
11,670 නැරඹීම්
153 සාකච්ඡා කරමින්
10
#OndoToOpenSubscriptionsForOpenAIPreIPOTokenizedNotes
669 නැරඹීම්
25 සාකච්ඡා කරමින්